
A reduced order model for structural response of the Mark III LNG cargo containment system
Abstract
Highly varying sloshing loads are a superposition of load components resulting from a sequence of different physical phenomena. However, not all features of spatial and temporal variations of sloshing loads and associated phenomena are equally important when failure of structure is considered. Therefore, the prediction of sloshing loads should be focused on those load components which lead to failure. These components can be found by employing a structural model, which should be fast computationally considering the huge number of possible sloshing loads. This paper presents a reduced order model based on the beam-foundation model which is derived for the Mark-III cargo containment system. The model is validated against a detailed finite element model and it conservatively predicts the stresses at failure locations. The calculation time using the model is approximately two orders smaller in comparison to a finite element model computation, which allows the model to be applied for finding governing load components and associated physical phenomena.
1.Introduction
Safe and efficient marine storage and transportation of liquefied natural gas (LNG) at −162°C requires cargo tanks providing sufficient strength and thermal insulation. At these temperatures LNG can be transported as long as the vessel’s inner hull is insulated from the low temperature with a Cargo Containment System (CCS), as sketched in Fig. 1.
Fig. 1.
Cross section of an LNG carrier insulated with a Mark III cargo containment system.
The CCS experiences sloshing loads that are mainly investigated in 1:40 scale model tests, scaled up to full scale [12,21]. Due to sensor size, the scaled loaded area is such that local flow features are lost. Scaled loads are then compared with structural capacity, while taking correction factors for operational experience into account. This procedure has allowed for safe sailing with LNG carriers for the past years.
While this method is safe, the physics are still not well understood [3], leading to the Sloshel project. In this project sloshing impacts on a CCS were investigated in model and full scale [5,17], which led to the identification of three Elementary Loading Processes (ELP) [20]:
1. Direct impact of the fluid onto the wall
2. Jet formation after direct impact
3. Entrapped gas which pulsates
For new applications such as small scale LNG and liquid hydrogen, the same ELPs are expected. However, they will have other magnitudes. Furthermore, without the scaling factors from operational experience questions are raised about the importance of phase transition, variability, and fluid-structure interaction. The SLING project [3] investigates the importance of these factors by analyzing their influence on the pressure map. A change in the pressure map does not necessarily mean that an effect is important, as demonstrated in [4]. This is determined by looking at the predicted structural damage. If omission of a factor does not change the predicted damage, then it is not considered important. Ideally all pressure maps would be investigated, to derive general conclusions and guidelines for model tests and numerical simulations, but this would be too time consuming for an FE analysis. This research is part of the SLING project and has as goal to efficiently quantify which part of the load is important for the structure. By knowing what loads are important the design of a CCS can be done more efficiently.
In this paper we take the first step towards a fast load screening method, without employing complex and time-consuming FE analysis for the large number of load cases that can be imagined. We define screening as a selection process, which results in a conservative prediction of structural damage by selecting the most damaging load cases. Screening should help to answer the question: Which load influencing factors are important for the damage prediction of a membrane CCS? The screening method should conservatively predict failure while being simple to apply. This led to the development of a reduced order model, which has three main advantages over FE analysis:
1. Such a model gives a stress estimate before using FE models, similar to the Euler beam theory which gives a first response estimate.
2. The model can be applied as a filter to determine which load parts are important.
3. It could be applied as fast design tool, as it gives a relation between loading, response and material parameters.
An additional use for such a screening method could be to investigate results of numerical sloshing simulations, which can deliver higher resolution results compared to model tests, such as [13,14]. Such simulations come at high computational cost, and do not necessarily include all physics on all scales because modelling the pressure peaks requires high spatial and temporal resolution [21]. Additionally, variability of the flow is not accounted for when calculating a single impact, further increasing the cost if statistics are required. There are methods to reduce the computational cost of free surface simulations, such as advanced boundary conditions [30], but this is beyond the scope of this article.
This paper consists of two main parts. First, the reduced order CCS model is developed, starting with the assumptions used to reduce the model order and proceeding with the structural model. Second, the reduced order model response is compared to FE analysis results for a number of static load cases and a dynamic wave impact (from [20]). The paper finishes with conclusions and recommendations.
2.Reduced order cargo containment system model
There are multiple CCS types on the market. In this paper we choose the often used Mark III CCS designed by Gaztransport & Technigaz. [8,10,15] explain the working principles behind the CCS, as shown in Fig. 2. The insulation is made of prefabricated panels of 3 by 1 m, which rest on the inner hull using mastic ropes. The foam core insulates the tank, while the top and bottom plywood prevent local indentation either due to the impact loads at the top, or due to the supporting mastic ropes at the bottom. The primary and secondary membrane ensure gas and liquid tightness. Relaxation grooves in plywood and foam, as well as corrugations in the primary membrane, are used to reduce thermal stresses. After fixing the panels to the hull with studs, the top is made flat using insets called the ‘top bridge pad’, creating a flat inner tank. The primary membrane is welded to a stainless steel anchoring strip which is fixed to the top plywood. For convenience we will hereafter call the area between two corrugations a ‘subpanel’.
![The Mark III cargo containment system as designed by GTT similar to [19].](https://content.iospress.com:443/media/isp/2019/66-4/isp-66-4-isp190272/isp-66-isp190272-g002.jpg)
Accurate response estimates have been obtained using idealized triangular loads and FE analysis, reconstructing the load from these idealized loads [18]. In early design it can be impractical to determine the response to idealized loads using an FE model. Here the reduced order model comes in. It gives an estimate of the structural stress, and therefore failure can be investigated. Two main failure modes are identified [6,15]: indentation failure with maximum permanent deformation of the foam due to crushing, and shear failure of the bottom plywood.
From here on we will develop a reduced order model specifically for the indentation failure mode. The focus of the reduced order model is on the subpanel representing most of the tank wall. We decided to disregard the insets, studs and anchoring strips, assuming they can later be added using a stress concentration factor. Additionally, shear failure of the bottom plywood can later be added based on the deformation of the top plywood. Also, we will only investigate the linear response of the CCS. The presented model will be valid on the entire CCS excluding the corners, where the structure is different. For plastic deformation of the foam, the model of [7] can be chosen [15]. This model combines the square of the hydrostatic and Von Mises (mean and deviatoric) stress linearly to a failure locus. However, other failure laws can also be considered [16], and show a large influence on the capacity, which is why this choice is not made here.
A first idea for a reduced order model is a higher order sandwich model [9], with the plywood as face plates and foam as core. Such sandwich models are however still quite complex and do not lend themselves for a quick estimate without considerable effort. Looking at the failure mode allows further simplification as demonstrated in [11,23,26]. A beam-foundation models, such as the Vlasov model [28], is used to predict the combined behavior of the face plate (top plywood) and foam core. This method requires the displacement field over the height of the foundation, which can be determined with an energy minimization under static loading [27].
For highly dynamic impact loads such a minimization is impractical, as the displacement field of the foam changes in time. Instead of obtaining the displacement field of the foam by energy minimization, it is given by the first vibration mode of the CCS: the top plywood going up and down. This mode can be imagined as the top plywood moving up and down without bending. The following assumptions are made for the reduced order model:
The displacement field over the height of the foam is similar to the displacement field of the first vibration mode, only scaled in magnitude.
Only a short part of the bottom plywood between the mastic ropes can bend, hence the bottom plywood and mastic ropes are considered rigid.
The primary membrane is not included, following [2,15]. It could be added to the bending stiffness of the beam.
The secondary membrane of 1 mm thick is disregarded as done in [2,15].
The subpanel is isolated from other subpanels (relaxation groove goes all the way to the bottom).
Anisotropic material properties and plasticity are not taken into account.
2.1.Foam displacement field
First the vibrations of a subpanel of the CCS with undeformed top plywood are determined. The foam is modelled as a bar along the subpanel thickness, with varying temperature and therefore stiffness, satisfying:
Table 1
| Bottom (20°C) | Top (−163°C) | |||
| Plywood | 7,700 | 11,300 | MPa | |
| 680 | 680 | kg/m3 | ||
| 0.3 | 0.3 | – | ||
| Foam | E | 55 | 105 | MPa |
| ρ | 125 | 125 | kg/m3 | |
| ν | 0.2 | 0.2 | – | |
| Mastic rope | E | 2,800 | – | MPa |
| ρ | 960 | – | kg/m3 | |
| ν | 0.3 | – | – |
No deformations are allowed at
The solution
Fig. 3.
Ritz (reduced order) vs FE mass normalized displacement through the thickness of the foam, including thermal properties. Ritz (9 terms): 636 Hz, FE model: 636 Hz.
2.2.Top plywood response
The foam displacement field can be used in the beam-support model of [28], which is rewritten here:
2.3.Stresses at top and bottom of foam
When the deformation is known, the vertical stresses
For the horizontal stress
Following our kinematics the following shear stresses are obtained [23]:
In the following the
2.4.Boundary conditions and solution
The relation between top and bottom normal stress and total shear force of the foam can be determined, by requiring the total force equilibrium on the foam to be zero, over a certain portion of the beam
By looking at the relaxation grooves in Fig. 2, the beam should be considered free, whereas the foam is elastically restrained up to approximately halfway its thickness. These boundary conditions can be realized by enforcing the sum of shear force in the beam and the foam to be zero, hence:
Additionally, the moment at the end of the beam is zero:
A static solution is obtained by setting
A modal solution is found by applying separation of variables. Substitute
The aim is to solve the spatial ordinary differential equation:
For higher modes a Wronskian matrix of the boundary conditions is used. The zero values of the Wronksian determinant are determined, changing only α, which can in turn be used for the natural frequencies
3.Results and discussion
In this section static and dynamic results of the reduced order model are compared with the FE calculations. A 2D model is made to represent the CCS, containing the top and bottom plywood, foam and relaxation grooves. The structure is supported from below by the mastic ropes. ANSYS© Academic Research Mechanical, Release 16.2 is used for the finite element calculations [1], with linear plane strain elements (PLANE182) for the top and bottom plywood as well as the foam. All displacements are measured at the interface between the top plywood and foam.
Fig. 4.
Finite element mesh of the wide model, with detailed view of the relaxation groove and mastic rope.
A narrow and a wide model are used. The narrow model has one subpanel, Fig. 2, the wide model has three, with the middle one loaded. Elements of 3, 1.5, and 0.75 mm (static_s_1o3…12 respectively) are used for the convergence in the narrow model, in the wide model 3 mm elements are used. The elements are as square as possible, as is shown for the wide model in Fig. 4. The material model is isotropic linear and properties are chosen after [16,25] and similar to [24], and displayed in Table 1. The top plywood is free at both ends, and continuously supported by the foam.
For all FE models the bottom of the mastic is constraint in vertical z direction. The foam and bottom plywood are constraint in horizontal x direction, as shown in Fig. 2. Only the stress and displacement at the top of the foam are compared, other stress results can be obtained as described in Section 2.
3.1.Static response
Sloshing loads can be divided in three ELPs [20]: (1) direct impact, (2) building jet and (3) compression of escaping or entrapped gas. The loads investigated in this section are based on these three ELPs, and one test case of measured loads. The small corrugation starts at 53/2 mm from the center of the relaxation groove [24]. Any load closer to the relaxation groove will be redistributed by the corrugation.
Fig. 5.
Static load cases, index corresponds to static load figures.
Five static load cases are proposed in Fig. 5. The peak loads (12 mm wide) represent direct impacts and building jets in the corner of the corrugation and at about one third of the width. A wider peak (143.5 mm wide) is applied at one third of the panel. Between the corrugations a triangular and uniform loading are applied, representing a wide pressure caused by, for instance, entrapped gas or hydrostatic load. All loads have a maximum of 1 MPa, to easily compare their effects. We believe that these loads show clearly the advantages and limitations of this model regarding spatial accuracy, even though they do not vary in time. In fact, it is easier to investigate the spatial accuracy with a static model, because there is only one time step to compare.
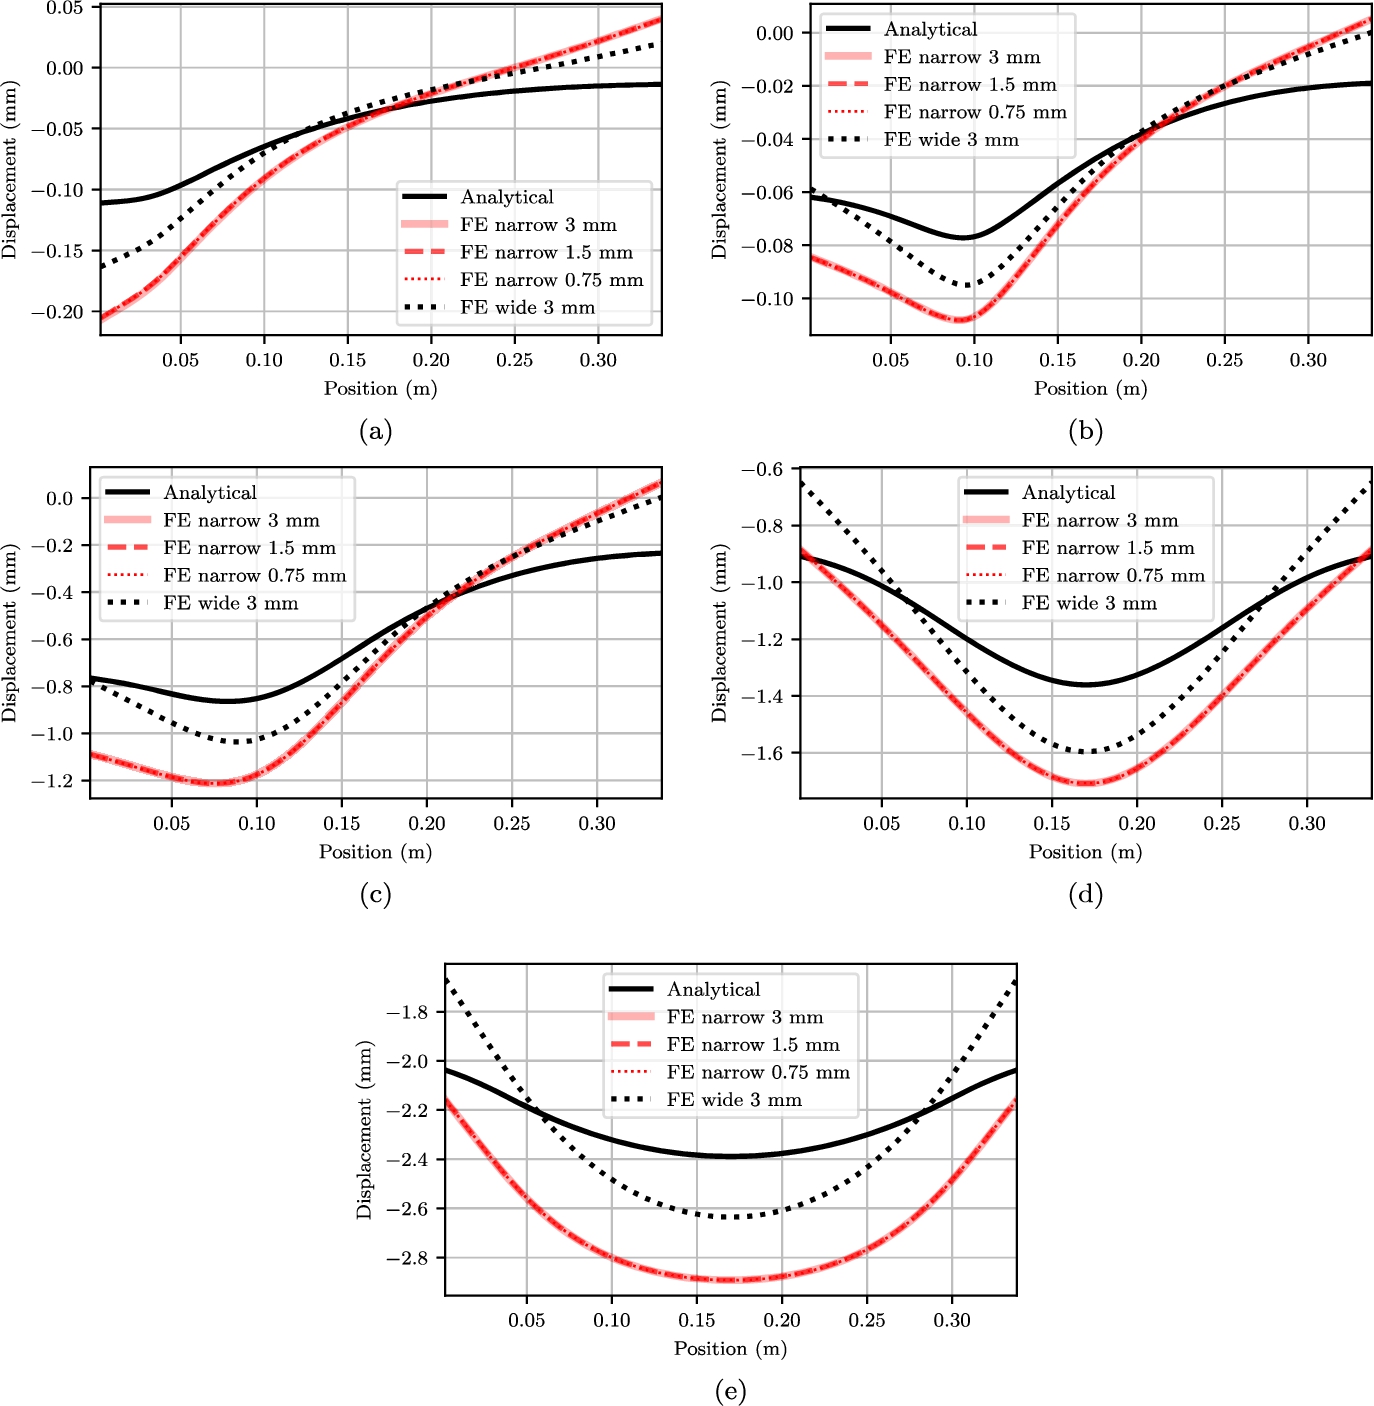
Fig. 7.
Displacement contours for static loads, wide FE model vs reduced order. Cases are reduced order (solid lines), and wide FE model (colored contour). Subplots correspond to the lines in Fig. 5.
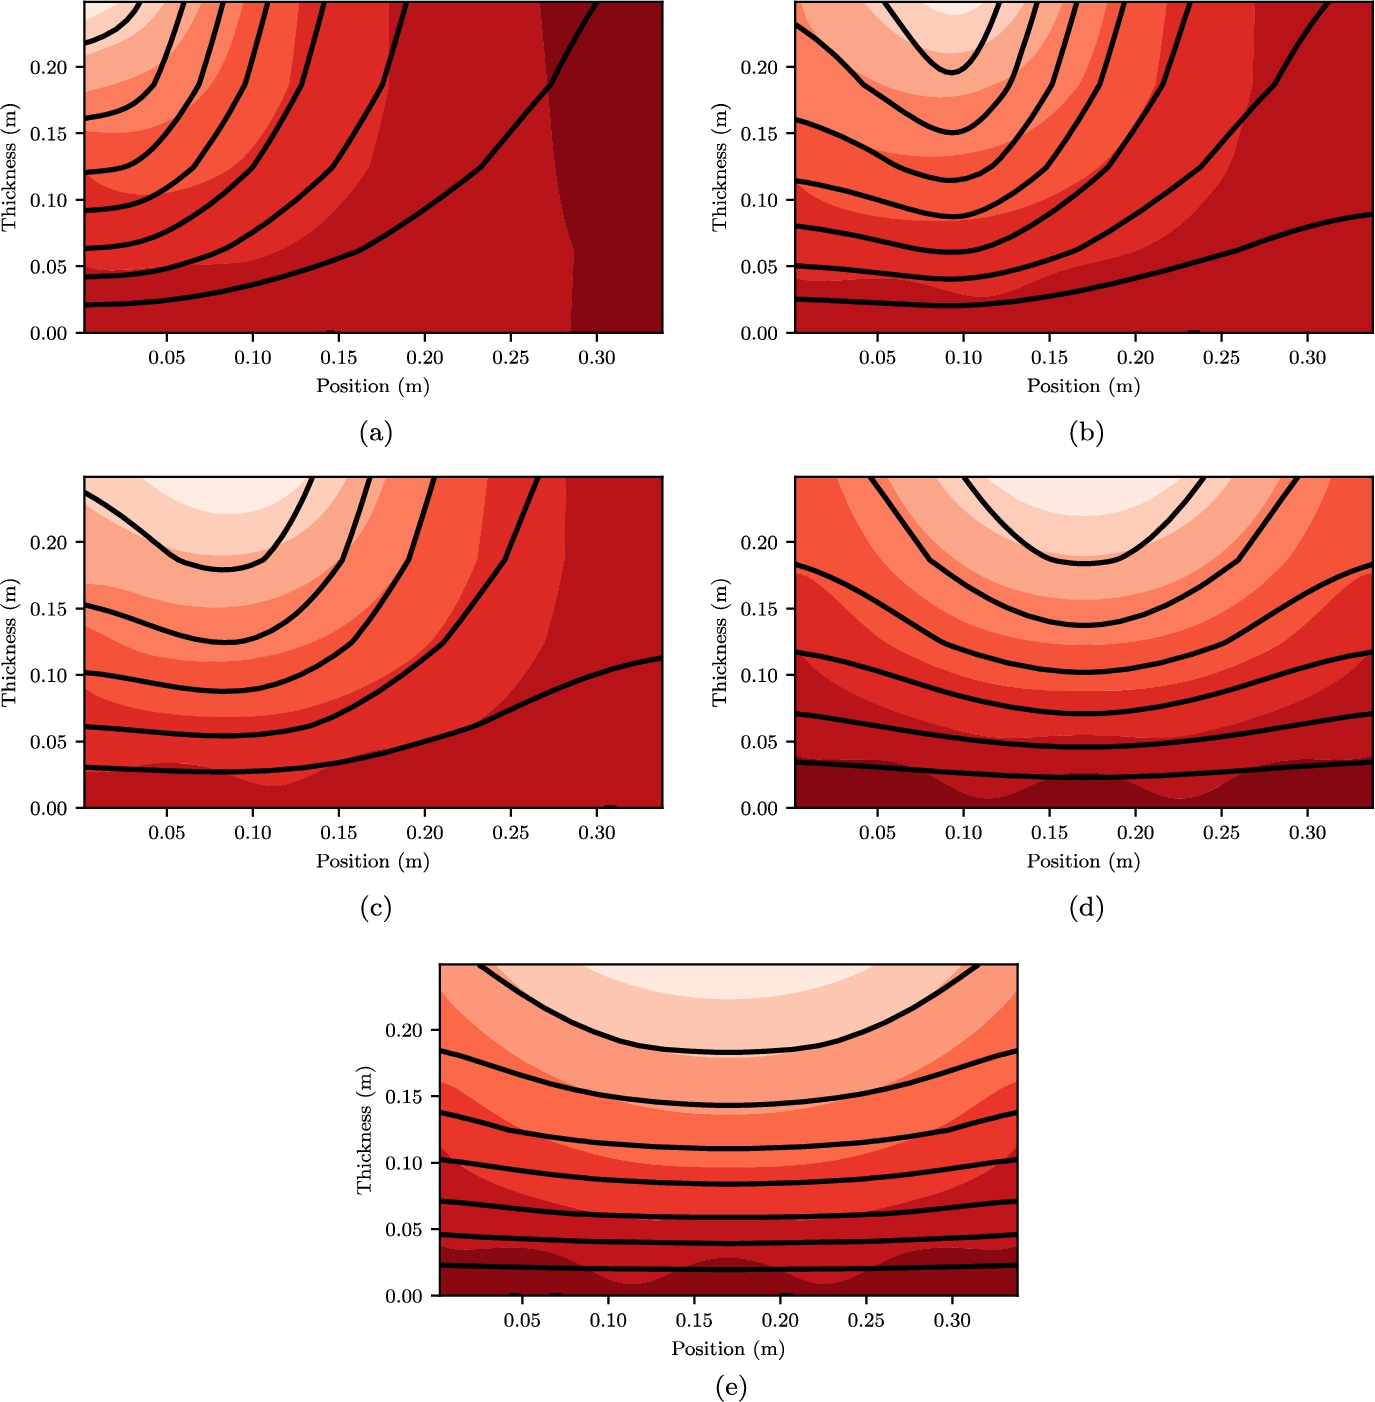
After application of the loads in Fig. 5, the following figures are obtained. Figure 6 shows the static displacement at the top of the foam, and Fig. 7 compares the vertical displacement field in the foam between the reduced order (line) and reference solution (colored). These can be compared by looking at the shape and closeness of the lines: closer lines denote a larger strain.
With respect to the reference solution, the narrow model consequently overestimates displacement, as the boundaries of the foam are free to move vertically rather than resting on the next subpanel. All shown element sizes overlap and are considered sufficiently accurate to predict stress and displacement. The reduced order model underestimates displacement for local loads, with increasing accuracy as the load becomes more uniform. This can be explained using Fig. 7, where the FE model has most deformation at the top of the foam. Compare this to the reduced order model where the deformation is distributed over the entire height the foam. Therefore we conclude that the FE model is softer for local loads.
It was assumed earlier that the deflection of the back plywood between the mastic ropes does not affect the displacement at the top of the foam. This assumption is confirmed by looking at the displacement contours which, except for the bottom one, do not show where the mastic ropes are. At the bottom of the FE model there will be displacement between the mastic ropes, but this is not predicted by the reduced order model.
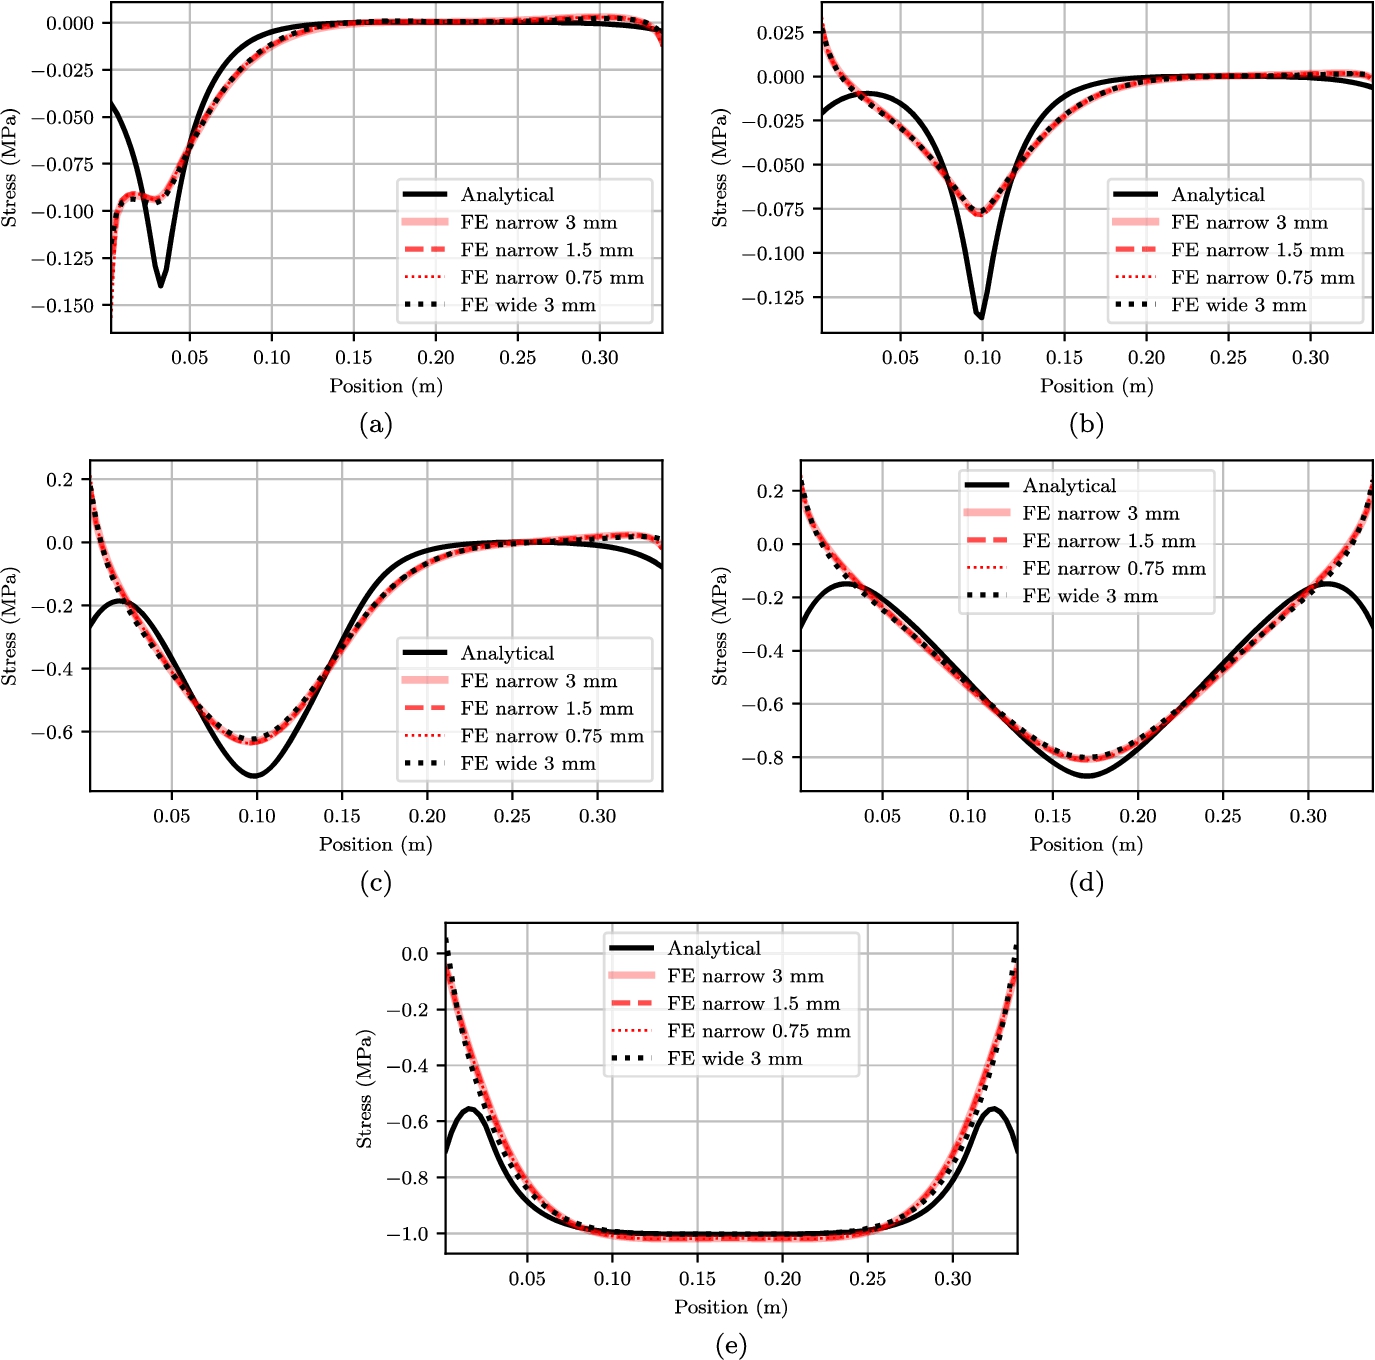
Failure of the CCS requires specific material knowledge, which is not widely available. The vertical
For some of the reduced order results an increase of stress is found at the edge, because of the end spring condition derived earlier. We could also say this stress concentration indicates a peeling failure, which is not further explored here. For loads that are applied further away this stress is distributed over a larger area. An a priori error estimate is hard to define, because it strongly depends on the shape of the load. However, the general trend of the deformation and stress is similar, and therefore the reduced order model is considered a reasonable estimate.
3.2.Dynamic response
Fig. 9.
Dynamic ‘slosh’ load from [20], interpolated with cubic b-splines. The known sensors are plotted solid, the interpolated ones are dashed.
![Dynamic ‘slosh’ load from [20], interpolated with cubic b-splines. The known sensors are plotted solid, the interpolated ones are dashed.](https://content.iospress.com:443/media/isp/2019/66-4/isp-66-4-isp190272/isp-66-isp190272-g009.jpg)
Fig. 10.
Displacement and contact stress at top of the foam for slosh load. Cases are reduced order (solid line) and FE narrow model (dotted line). The load is from [20]. The symbols at the subplots correspond to the indications in Fig. 2.
![Displacement and contact stress at top of the foam for slosh load. Cases are reduced order (solid line) and FE narrow model (dotted line). The load is from [20]. The symbols at the subplots correspond to the indications in Fig. 2.](https://content.iospress.com:443/media/isp/2019/66-4/isp-66-4-isp190272/isp-66-isp190272-g010.jpg)
In Fig. 9 the investigated load case is shown, a sloshing load from [20]. The three known pressure sensors are denoted
The reduced order model uses the first eleven vibration modes to determine the response, it is compared to the narrow FE model, which has a geometry closest to the reduced order model. In Fig. 10 the dotted line denotes the narrow FE model with an element size of 3 mm, and the solid line the reduced order model. The FE model took about ten minutes to run, the reduced order model was finished within seconds. In the idealized case, the reduced order model would be 90 times faster than the FE model: the FE model has 90 elements over the height of the CCS, and the reduced order model one. The same comparison holds for the static loads, but there the difference is not as pronounced because only five loads are investigated. Such a run time would not be a problem for one load case, but in order to investigate many load cases the difference is significant.
Comparing the displacement shows that the FE model has higher displacement than the reduced order model. By looking at the different graphs, the trend of the displacement is quite similar, especially for the first impact. After that the load decreases again, going more towards free vibration. Any difference observed after the initial impact is due to the free vibration and therefore denotes a difference in natural frequency and mode shape between both models.
The stress in the FE model reaches its maximum earlier than the reduced order model, even though the displacement has coinciding maxima. This indicates that not all natural frequencies of the reduced order model are correct. The stresses are overestimated by the reduced order model, as in the static load case, so this is not considered to be a problem. For a specific structure one could, if an FE model is also available, tune the model parameters to maximize agreement for a load condition.
4.Conclusions and recommendations
This paper presents a reduced order model for a subpanel (panel between corrugations) of the Mark III CCS, to efficiently assess sloshing loads. A beam-foundation model is used, with a predefined displacement field over the thickness of the foam tuned to the first vibration mode of the subpanel. The reduced order model is compared to a FE analysis for five static load cases and one dynamic load case using the same boundary conditions. Regarding the modelling assumptions, considering the bottom plywood and mastic ropes as rigid is justified when top stress and displacement are considered, as their effects cannot be seen at the top.
The reduced order model overestimates the maximum stress for the presented cases, while being two orders of magnitude faster. We see a larger difference for more localized loads, meaning the response to ELP 1 is predicted worse than for ELP 2 and 3. Because of its speed and conservativeness, the model is ideal for screening: to identify the important features, and associated phenomena, of sloshing loads. In addition the model can be used for defining maximum spatial distribution and size of pressure sensors to be used in experimental sloshing tests. However, we still recommend users of this model to double-check the most critical cases with an FE model.
In future work there should be a better estimate for added mass and damping, because during the wave impact the structure is not completely wet or dry. The developed model should be extended with the ship inner hull, which can interact via its stiffness, damping and mass with the CCS, and therefore affecting the stress. Finally, other failure modes such as fracture of bottom plywood at supporting mastic ropes should be taken into account. With the aforementioned improvements and a failure law of choice, this model can be included in a screening procedure which quickly investigates many load cases. Then the user knows which cases are important and can investigate those cases further with an expensive FE model.
Acknowledgements
This work is part of the research programme ‘SLING’ with project number P14-10 which is (partly) financed by the Netherlands Organisation for Scientific Research (NWO).

References
[1] | ANSYS, Inc., Mechanical APDL documentation, Academic Research, release 16.2, 2015. |
[2] | A. Arswendy and T. Moan, Sloshing response of LNG tank, in: Proceedings of the International Conference on Offshore Mechanics and Arctic Engineering, (2006) . |
[3] | H. Bogaert, An experimental investigation of sloshing impact physics in membrane LNG tanks on floating structures, PhD thesis, Delft University of Technology, 2018. |
[4] | R. Bos and M. Kaminski, Comparing 2d and 3d linear response of a simplified LNG membrane cargo containment system, in: Proceedings of the International Offshore and Polar Engineering Conference, (2018) , pp. 780–787. |
[5] | L. Brosset, Z. Mravak, M. Kaminski, S. Collins and T. Finnigan, Overview of sloshel project, in: Proceedings of the International Offshore and Polar Engineering Conference, (2009) . |
[6] | Bureau Veritas, Strength assessment of LNG membrane tanks under sloshing loads, Guidance note NI 564 DT R00 E, 2011. |
[7] | V. Deshpande and N. Fleck, Isotropic constitutive models for metallic foams, Journal of the Mechanics and Physics of Solids 48: (6–7) ((2001) ), 1253–1283. |
[8] | S. Ehlers, M. Guiard, J. Kubiczek, A. Höderath, F. Sander, R. Sopper, P. Charbonnier, M. Marhem, I. Darie, H. von Selle, J. Peschmann and P. Bendfeldt, Experimental and numerical analysis of a membrane cargo containment system for liquefied natural gas, Ships and Offshore Structures 12: ((2017) ), S257–S267. doi:10.1080/17445302.2016.1248753. |
[9] | Y. Frostig, M. Baruch, O. Vilnay and I. Sheinman, High-order theory for sandwich-beam behavior with transversly flexible core, Journal of Engineering Mechanics 118: ((1992) ), 1026–1043. |
[10] | T. Gavory and P.-E. de Sèze, Sloshing in membrane LNG carriers and its consequences from a designer’s perspective, International Journal of Offshore and Polar Engineering 19: (4) ((2009) ), 13–20. |
[11] | E.E. Gdoutos, I.M. Daniel and K.A. Wang, Indentation failure in composite sandwich structures, Exp. Mech. 42: (4) ((2002) ), 426–431. doi:10.1007/BF02412148. |
[12] | E. Gervaise, P.-E. De Sèze and S. Maillard, Reliability-based methodology for sloshing assessment of membrane LNG vessels, in: Proceedings of the International Offshore and Polar Engineering Conference, (2009) , pp. 254–263. |
[13] | P. Guilcher, Y. Jus and Brosset, 2D simulations of breaking wave impacts on a flat rigid wall – Part 2: Influence of scale, in: Proceedings of the International Offshore and Polar Engineering Conference, (2018) , pp. 741–754. |
[14] | P. Guilcher, Y. Jus, N. Couty, L. Brosset, Y. Scolan and D. Le Touze, 2D simulations of breaking wave impacts on a flat rigid wall – Part 1: Influence of the wave shape, in: Proceedings of the International Offshore and Polar Engineering Conference, (2014) , pp. 232–245. |
[15] | J. Issa, L. Garza-Rios, R. Taylor, S. Lele, A. Rinehart, W. Bray, O. Tredennick, G. Canler and K. Chapot, Structural capacities of LNG membrane containment systems, in: Proceedings of the International Offshore and Polar Engineering Conference, (2009) , pp. 107–114. |
[16] | H.K. Jeong and Y.S. Yang, Strength analysis of Mark III cargo containment system using anisotropic failure criteria, Journal of Advanced Research in Ocean Engineering 1: ((2015) ), 211–226. doi:10.5574/JAROE.2015.1.4.211. |
[17] | M. Kaminski and H. Bogaert, Full-scale sloshing impact tests – Part I, International Journal of Offshore and Polar Engineering 20: (1) ((2010) ), 24–33. |
[18] | B. Kayal, A. Benoit, M. Frihat and T. Loysel, Introduction to a structural-based sloshing assessment for membrane containment system, in: Proceedings of the International Offshore and Polar Engineering Conference, (2016) , pp. 1029–1035. |
[19] | M.H. Kim, S.M. Lee, J.M. Lee, B.J. Noh and W.S. Kim, Fatigue strength assessment of Mark-III type LNG cargo containment system, Ocean Engineering 37: ((2010) ), 1243–1252. doi:10.1016/j.oceaneng.2010.05.004. |
[20] | W. Lafeber, L. Brosset and H. Bogaert, Elementary loading processes (ELP) involved in breaking wave impacts: Findings from the sloshel project, in: Proceedings of the International Offshore and Polar Engineering Conference, (2012) , pp. 265–276. |
[21] | S. Malenica, L. Diebold, S.H. Kwon and D.-S. Cho, Sloshing assessment of the LNG floating units with membrane type containment system where we are?, Marine Structures 56: ((2017) ), 99–116. doi:10.1016/j.marstruc.2017.07.004. |
[22] | C. Mittelstedt and W. Becker, Free-edge effects in composite laminates, Appl. Mech. Rev. 60: ((2007) ), 217–245. doi:10.1115/1.2777169. |
[23] | P. Navarro, S. Abrate, J. Aubry, S. Marguet and J.-F. Ferrero, Analytical modeling of indentation of composite sandwich beam, Compos. Struct. 100: ((2013) ), 79–88. doi:10.1016/j.compstruct.2012.12.017. |
[24] | J.K. Paik, J.M. Sohn, Y.S. Shin and Y.S. Suh, Nonlinear structural analysis of membrane-type LNG carrier cargo containment system under cargo static pressure loads at the cryogenic condition with a temperature of −163°C, Ships and Offshore Structures 6: ((2011) ), 311–322. doi:10.1080/17445302.2010.530428. |
[25] | Y. Parihar, K. Doshi, J. Saripilli, R. Joga and S. Dhavalikar, Strength assessment of membrane type containment system of LNG carrier, in: Proceedings of the International Offshore and Polar Engineering Conference, (2016) , pp. 1043–1050. ISBN 978-1-880653-88-3. |
[26] | O. Thomsen, Analysis of local bending effects in sandwich plates with orthotropic face layers subjected to localised loads, Composite Structures 25: (1–4) ((1993) ), 511–520. doi:10.1016/0263-8223(93)90199-Z. |
[27] | C.G. Vallabhan and Y. Das, Parametric study of beams on elastic foundations, Journal of Engineering Mechanics 115: (12) ((1988) ), 2072–2082. |
[28] | V. Vlasov and N. Leont’ev, Beams, Plates and Shells on Elastic Foundations, Israel Program for Scientific Translations, (1960) . |
[29] | B. Wang and Y. Shin, Full-scale test and FE analysis of LNG Mk III containment system under sloshing loads, in: Proceedings of the International Offshore and Polar Engineering Conference, (2011) , pp. 121–128. |
[30] | P. Wellens and M. Borsboom, A generating and absorbing boundary condition for dispersive waves in detailed simulations of free-surface flow interaction with marine structures, Computers & Fluids 200: ((2020) ), 104387. doi:10.1016/j.compfluid.2019.104387. |


