
Energy and cost analysis of a hydrogen driven high speed passenger ferry
Abstract
Background:
Norway is facing the challenge of reducing transport emissions. High speed crafts (HSC) are the means of transport with highest emissions. Currently there is little literature or experience of using hydrogen systems for HSC.
Objective:
Evaluate the economic feasibility of fuel cell (FC) powered HSC vs diesel and biodiesel today, and in a future scenario, based on real world operation profile.
Method:
Historical AIS position data from the route combined with the speed-power characteristics of a concept vessel was used to identify the energy and power demand. From the resulting data a suitable FC system was defined, and an economic comparison made based on annual costs including annualized investment and operational costs.
Results:
HSC with a FC-system has an annual cost of 12.6 MNOK. It is 28% and 12% more expensive than diesel and biodiesel alternative, respectively. A sensitivity analysis with respect to 7 key design parameters indicates that highest impact is made by hull energy efficiency, FC system cost and hydrogen fuel cost. In a future scenario (2025–2030) with moderate technology improvements and cost development, the HSC with FC-systems can become competitive with diesel and cheaper than biodiesel.
Conclusions:
HSC with FC-systems may reach cost parity with conventional diesel in the period 2025–2030.
1.Introduction
Norway has set ambitious goals for reduction of GHG-emissions. Most of the electricity production in the national grid is from renewable hydroelectric power and is currently supplemented by strong expansion in wind power. Norway’s main GHG-emissions are found in the offshore operations, industry and transport sectors, where transport (road traffic, aviation, maritime) account for the largest fraction of GHG-emissions (Table 1). Hence, in order to decarbonize the transport sector, it is natural for Norway to electrify transport applications using battery and hydrogen fuel cell electric technology and renewable energy-based charging / refueling infrastructure.
Table 1
Norwegian GHG emissions 2017 [26]
| Sector | GHG emissions (Mill. tons CO2 equiv.) |
| Transport (road, aviation, maritime) | 15.8 |
| Oil and gas extraction | 14.7 |
| Manufacturing industries and mining | 12.1 |
| Agriculture | 4.5 |
| Electrical energy supply | 1.9 |
| Heating | 1.0 |
| Other | 2.9 |
The introduction of new and more climate friendly technology is normally associated with higher costs than conventional and well established technologies. To overcome this challenge, it is necessary to introduce incentives and public support in the introductory phases of the new technology. In Norway, a combination of strict regulations, focus on contract award criteria and the use of public purchase power has been successful for the introduction of new and more environmentally friendly solutions in the maritime sector.
The Norwegian Public Roads Administration (NPRA) is responsible for administrating many of the roughly 130 car ferry routes in Norway (ca. 200 ferries in total). NPRA have over the past decades developed public tenders and contracts that combine commercial competition with new technology development and system demonstrations. In 2000 this resulted in the world’s first LNG powered car ferry MF Glutra, and in 2018 there were 21 LNG-fueled car ferries in operation in Norway. A similar development contract resulted in the world’s first fully battery electric car ferry MF Ampere starting operation in 2015, and by 2022 there will be at least 73 battery electric ferries in operation in Norway. In 2019 a new development contract was signed with Norled to develop a hydrogen and fuel cell powered ferry, which will start to operate in 2021. The NPRA expect hydrogen to be the best solution for the most difficult car ferry routes, such as Bodø to Moskenes, and expect to consume about 10 000 tons of hydrogen per year in 2030. The combination of electrification with batteries and hydrogen will give significant reductions in GHG-emissions from car ferries (Fig. 1) [27].
![NPRA expected reduction CO2 emissions [ktons] from Norwegian car ferries towards 2030 [27].](https://content.iospress.com:443/media/isp/2020/67-1/isp-67-1-isp190273/isp-67-isp190273-g001.jpg)
When the NPRA fund new developments and pilot projects and follow up with stricter contract award criteria favoring lower emissions, they generate a local market where technology providers are motivated to invest in the development of new and more environmentally friendly products and systems at a cost-competitive price.
An important part of the Norwegian public transport system is the high-speed passenger ferries, also called high-speed craft (HSC). HSC typically have a capacity up to 100–300 passengers and service speeds up to 35 knots. Unfortunately, these high-speed vessels have very high emissions compared to other modes of transport, as shown in Table 2.
Table 2
CO2 emissions per passenger-km from Norwegian transportation in 2004 [29]
| Mode of transport | CO2 emissions (g/p-km) |
| Passenger train | 8 |
| Bus | 78 |
| Passenger car | 100 |
| Taxi | 172 |
| Airplane | 191 |
| Car ferry | 621 |
| High-speed crafts (HSCs) | 904 |
In many county municipalities in Norway the largest emissions from public transport comes from the HSC. In Sogn and Fjordane (now part of Vestland) HSC contribute to over 50% of the total emissions. The HSCs are difficult to convert to zero-emission due to their large energy consumption. The energy consumption is also strongly dependent on the overall weight of the vessels. Hence, the use of more expensive light weight carbon fibre hulls may be cost effective, due to the resulting fuel savings.
A report by Selfa Arctic (funded by the Norwegian NOx Fund) estimated yearly diesel consumption of each HSC route in Norway [12]. Many of the routes require 5–10 MWh per trip. If a state-of-the art Li-ion maritime battery developed specifically for light-weight applications, such as the Corvus Dolphin Power with system weight 8 kg/kWh is used, the battery system will have a weight of 57–114 tons (assuming an optimistic 70% depth of discharge and one charge cycle per trip). Therefore, it is clear that the use of batteries will significantly increase the overall weight for the most demanding routes compared to the conventional diesel solutions used today, namely two main engines and a few thousand litres of diesel with a combined weight of ca. 10–15 tons.
For HSC the increased weight of a battery solution may significantly reduce the deadweight tonnage (i.e. total allowable weight of cargo, passengers, crew, etc.), which is 10 tons for the HSC analysed in this study. Another challenge may be the lack of time to charge the battery along the routes, due to short stops (1–2 minutes) and inability to charge underway due to weak electric grids on islands and in remote locations. It is therefore necessary to investigate other options that have higher energy storage densities (kWh/kg) and high charging/refuelling rates (kWh/min).
In September 2019 the Trøndelag County Municipality presented results from an ongoing development contract on HSC, where five consortia are competing to deliver concept designs of zero-emission HSC [25]. The consortia are investigating different concepts using either batteries with fast charging, battery swapping, or hydrogen as the main energy storage options. This is combined with new hull designs ranging from aerodynamic carbon fibre hulls to novel hydrofoil solutions. As a result, Vestland County Municipality decided in December 2019 that 8 new HSC shall be zero emission by 2024, with a bonus if it can be achieved from 2022 [33].
The case study presented in this paper is based on a concept design for a hydrogen powered HSC (Fig. 2) [20]. The ship is a medium sized passenger ferry with a capacity of about 100 passengers that has a lightweight carbon fibre hull and a rated speed of 28 knots. The reference route goes from Florø in the Western part of Norway and covers 113 nautical miles (209 km) per day. A concept risk assessment of this ship has been completed [2], concluding that the risks associated with the hydrogen energy systems are acceptable and comparable to conventional diesel systems. A similar hydrogen powered ship (21 m, 84 PAX, 22 kn), the Water-Go-Round, is currently being constructed in California [15]. A similar case study (33 m, 150 PAX, 35kn) was performed in the SF-Breeze project by Sandia National Laboratories [24].
Fig. 2.
Illustration of a concept design (GKP7H2) of a hydrogen and fuel cell driven high speed passenger ferry [20].
![Illustration of a concept design (GKP7H2) of a hydrogen and fuel cell driven high speed passenger ferry [20].](https://content.iospress.com:443/media/isp/2020/67-1/isp-67-1-isp190273/isp-67-isp190273-g002.jpg)
A hypothesis in this work is that a hydrogen powered HSC will offer the lowest cost zero-emission solution, especially for the longest routes. It may also be the among the first large hydrogen consumers in Norway that can trigger a hydrogen market. The first hydrogen powered HSC will not be cost competitive with conventional technology due to development costs. However, there is a need to estimate the cost of a hydrogen solution considering expected future cost reductions.
The main objective of this paper is to assist route operators, route owners and infrastructure owners to estimate the expected cost of ownership of a hydrogen powered HSC in the future, and to calculate hydrogen demand from the HSC sector. The secondary objective of the work is to provide the basis for a method to calculate future hydrogen demand from different ship sectors, to be used for analysis of the Norwegian energy system. A third objective is to provide new knowledge on how the operation of a fuel cell system on a HSC can be optimized with respect to fuel cell life time.
2.Case study
In order to dimension the fuel cell and hydrogen storage systems for a HSC it is first necessary to establish the load profile (duty cycle) and overall energy consumption. Specific energy consumption for the vessel then needs to be coupled with speed data derived from the AIS data base to estimate the load profile and overall energy consumption for an existing route. This load profile can then be used to dimension the fuel cell system and hydrogen storage.
A cost analysis of the HSC with the required hydrogen components can then be performed and a comparison made to a conventional HSC to evaluate if there is a business case for a hydrogen and fuel cell driven HSC. Finally, a sensitivity analysis can be performed with respect to key hydrogen and fuel cell technology cost parameters in order to find out what is required to be competitive with existing diesel-driven solutions.
2.1.Methodology
2.1.1.Energy consumption analysis
The energy consumption is analysed by historical positioning data for a specific ship. The data source is the Automatic Identification System (AIS) operated by The Norwegian Coastal Administration [14]. The dataset used contains position data for approximately every 60 seconds. The velocity in each time interval is the distance travelled between two points divided by time.
The data set contains noise in form of small movements while the ship is standing still and some nonsense data such as velocities beyond maximum speed. In order to clean the noise in data from small movements, a rolling average speed is calculated for a time window of 30 min for each point in the dataset. If the rolling average speed is below 0.3 knot, the value in the middle of the time window is set to 0 knot. In addition, all intervals with velocity above the ferry maximum speed limit (28 knots) were adjusted down to the design limit.
The power requirement at each point in the velocity data set was calculated using the power-to-speed characteristics, which is unique to each ship. In addition, a constant power demand is present due to the auxiliary equipment onboard. The energy consumed is the power multiplied with time interval for each datapoint.
In the analysis it was assumed that shore power is supplied to the vessel when docked and thereby no onboard energy production is present. A simple approach was chosen to identify docking time: docking time was simply assumed to be equal to the time the ferry was standing still. The downside of this approach is that it underestimates somewhat the energy demand of the HSC as in reality for short stops it might not be convenient to use shore power.
The efficiency of a fuel cell system depends on its power output. For each interval efficiency is calculated based on required power output. The hydrogen consumption is then calculated by dividing energy consumption by fuel cell efficiency and hydrogen lower heating value.
2.1.2.Annual costs analysis
When choosing between several technical solutions, the final decision factor is often based on cost. The purchase cost alone can give misleading information, so the cost occurring during the entire period of ownership, such as fuel and maintenance, should also be considered. The costs are presented as a yearly expense budget including an annualized cost of the HSC itself and its power system. The annual cost is calculated using the following equation:
The annualized investment cost is calculated as an annuity cost over the lifetime of the different assets by [22]:
The rest value is calculated in the same fashion, with the only difference that the cash flow occurs in the end of lifetime by using equation
A discount rate of 8% is used based on Oslo stock market development between 2014 and 2019.
2.2.System description
2.2.1.Ship power vs. speed curve
Power versus speed data for the concept ferry was provided by the GKP7H2-consortium. The data was fitted to an exponential curve. A constant of 30 kW was added to represent the load of auxiliary equipment and hotel loads. Figure 3 shows the correlation between the power and speed data.
Fig. 3.
Power-speed curve for GKP7H2 concept vessel.
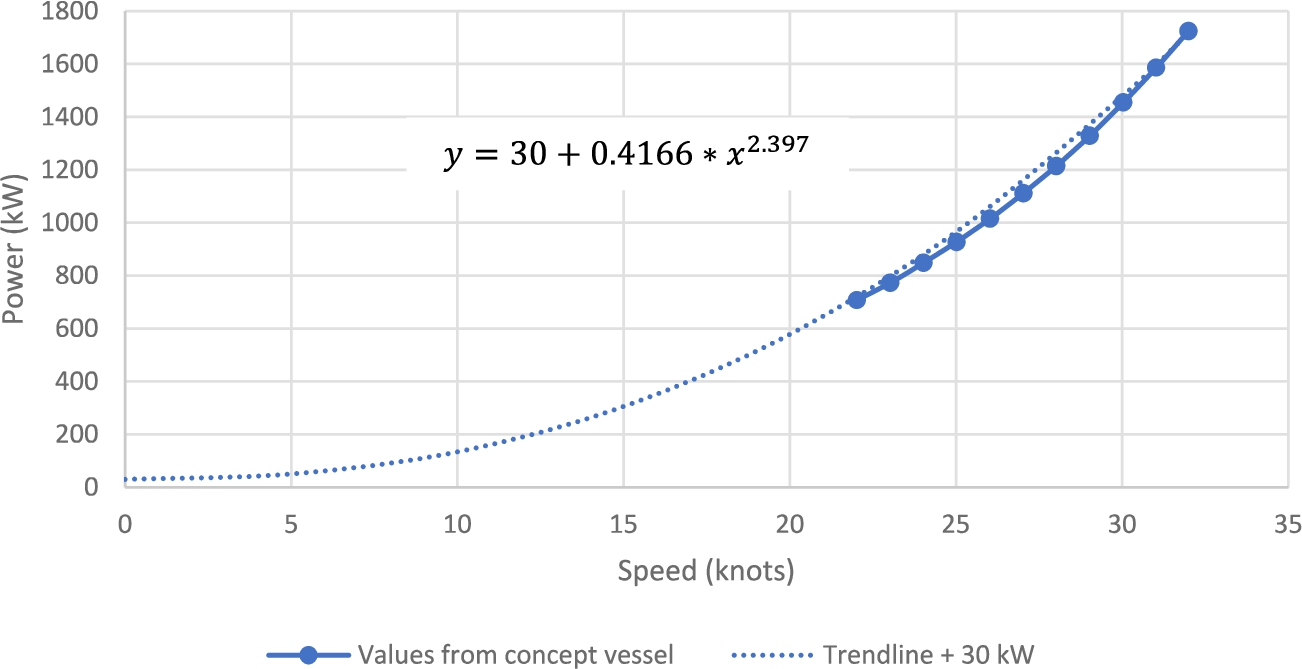
Several consortia are currently developing solutions to further reduce the energy consumption. In the future it could be possible to reduce power requirements by ca 10% by improving the aerodynamic design [1], and up to 45% by implementing modern hydrofoil solutions [11].
2.2.2.Hydrogen and PEM fuel cell system
The hydrogen system consists of a 250 bar compressed hydrogen storage, PEM fuel cell modules with balance of plant (BoP) and necessary additional controls and safety systems.
The PEM fuel cell efficiency was based on the PowerCell MS 100 prototype fuel cell system with 100 kW net rated power and 120 kW peak power [23]. Figure 4 (left) shows stack voltage, power and system efficiency vs. stack current. From this data an estimated system efficiency as a function of power was calculated (Fig. 4, right). In the concept ferry a total fuel cell power capacity of 1.2 MW was selected, which will require
Fig. 4.
PowerCell MS 100 system data [23] (left) and MS 100 efficiency plotted vs power output (right).
![PowerCell MS 100 system data [23] (left) and MS 100 efficiency plotted vs power output (right).](https://content.iospress.com:443/media/isp/2020/67-1/isp-67-1-isp190273/isp-67-isp190273-g004.jpg)
According to the FC-datasheet [23] the voltage at peak power is reduced from ca. 300 V at the beginning-of-life to ca. 250 V at the end-of-life, corresponding to a reduction in efficiency of ca. 17% at peak power at end-of-life. Fuel cell degradation [10,16] and its effects on the efficiency curve has not been modelled and has been left for future work.
Due to the relatively low weight of fuel cells (150 kg per 100 kW FC-module) it was assumed that service and maintenance mainly consists of replacing degraded or defective FC-modules with new or refurbished FC-modules. It was assumed that for a FC-module this can be performed within a few hours overnight while the ferry is not in operation, and that the ferry would not need to be taken out of service to perform this task. Since it is mainly the membrane with catalysts that has a short lifetime, or perhaps single components have failed, the degraded or defective module may afterwards be refurbished and resold or reused.
2.2.3.Diesel engine system
Data from a high-speed diesel engine of the type MTU 10V2000 M72 was used to estimate the diesel fuel consumption [17]. It has a rated fuel consumption of 0.21 kg/kWh, which corresponds to a LHV efficiency of ca. 40.6%. The installation of two diesel engines with peak power 900 kW were assumed, which are typically operated at less than rated power in order to reduce degradation. Nevertheless, as the selected diesel engine is optimized for high power-to-weight ratio the time between overhauls (TBO) is relatively frequent. In this study a TBO of 8000 hours was assumed. Due to the restricted space in the engine room and the high number of work hours required on the engine, the least expensive way to service the engines is to cut open the hull and remove the engines to perform overhauls. Normally, the old engines are replaced with new ones to minimize the time the ship is out of service. A service and replacement of diesel engines takes about 1–2 weeks, during which a replacement ferry must be rented. The old engines are afterwards refurbished and sold. The replacement of diesel engines and consequent down time of the ferry is a major cost.
2.3.Cost data
2.3.1.Currency conversion
The costs referred to in this study are presented in Norwegian kroner (NOK) using exchange rates of 10 NOK/EUR and 9 NOK/USD. The local Norwegian currency is chosen as several of the cost parameters are based in a Norwegian context, for example the hydrogen price is based on Norwegian power prices.
2.3.2.Hydrogen fuel cost
The cost of hydrogen produced on-site depends on the daily production capacity and utilization. Hydrogen cost was estimated using a model developed at IFE [30] and is presented in Fig. 5. The following was assumed: local hydrogen storage sufficient for 1.5 days of consumption, electricity cost of 0.3 NOK/kWh, 1 bunkering dispenser, 100% utilization of the electrolyser, 2 compressors (full redundancy), 5% rate of return and 10 years depreciation. Investment support was not included; however, it is realistic that a significant part (i.e. 40%) of the CAPEX may be covered by governmental support schemes which will reduce the hydrogen cost. Several other long-distance high-speed passenger vessel routes that may be hydrogen powered also serve Florø. For this analysis a hydrogen consumption of around 1000 kg/day (including other consumers) and a hydrogen cost of 45 NOK/kg was considered realistic for this kind of “early day” project.
![Estimated hydrogen cost vs. installed production capacity [30].](https://content.iospress.com:443/media/isp/2020/67-1/isp-67-1-isp190273/isp-67-isp190273-g005.jpg)
There are several promising ways to reduce the hydrogen cost. Normally, a predictable and large (more than 1000–2000 kg/day) consumption is needed. It may be possible to receive government incentives to lower the infrastructure CAPEX, and to sell oxygen and waste heat, for example to nearby fish farms. Assuming an oxygen price of 1–2 NOK/kg a future hydrogen sales price near 30 NOK/kg may be realistic [32].
2.3.3.Fossil diesel and biodiesel fuel cost
As basis the lowest recorded historical price for truck diesel at CircleK in 2019 of 14.3 NOK/L including VAT [6]. When subtracting 25% for VAT, 1.35 NOK/L for CO2 tax and 3.81 NOK/L for road tax [18], the resulting diesel cost is 6.28 NOK/L. Based on interviews with industry a cost of 6–7 NOK/L is considered realistic for maritime diesel.
Fossil diesel fuel for passenger transport at sea is exempted from the 1.65 NOK/L basic tax, but the 1.35 NOK/L CO2 tax must be paid. In addition, ships with combined installed propulsion power higher than 750 kW must pay 22.3 NOK/kgNOX in NOx tax [19]. The current requirement for NOx control is IMO Tier 2, with emission limit of 7.7 g/kWh for high speed engines [13]. The maximum value is used to estimate NOx emissions in this article. The Tier 3 standard will come into effect in the North Sea area by 2021 and will cap the emissions down to 2 g/kWh for high speed engines. Such an increased restriction will reduce expenses for NOx tax, but may increase equipment and/or operational costs.
There are different types of biofuels available in the market, but HVO100 seems to be the easiest to implement. It is chemically very similar to fossil diesel and may therefore often be used in conventional diesel engines without system modifications. The historical price of HVO100 for trucks has over the past year varied from ca. 14–15 NOK/L excl. VAT [6]. Biofuels are exempted from CO2 and basic tax. In Norway there is a minimum turnover requirement for biofuels. Biodiesel covered by the turnover requirement is taxed with 3.81 NOK/L in road tax [18]. However, the actual turnover is higher than the minimum requirement, and the remaining volumes are sold with zero tax. It is therefore difficult to assess the actual price based on public sources. Based on historical data and interviews with industry it is assumed a HVO100 cost of 12 NOK/L. NOx tax is also applicable for biofuels.
2.3.4.High speed passenger ferry cost
A diesel driven high-speed passenger ferry which can transport 100 passengers up to 30 knots is assumed to cost 40 million NOK. The estimated cost of the hydrogen powered HSC is based on the diesel HSC, where the costs related to diesel engine systems are subtracted, and the cost of fuel cell system and hydrogen storage are added. Hence, a fair comparison between technologies can be made. The economic lifetime of the HSC is assumed to be 20 years.
2.3.5.Diesel engine system cost
The diesel-mechanical engine system applied on the HSC of this study consists of two parallel and independent main propulsion machines each with rated power about 750 kW, ca. 4000 litres fuel storage, exhaust systems, gear boxes, cooling systems, and other auxiliary equipment. In addition, two auxiliary 30 kW power generators for electricity supply was assumed in the design.
Accurate cost data for high-speed diesel engines are not widely published. The US Environmental Protection Agency have published data for a series of generic CHP reciprocating engine systems [7]. The total installed cost is 2837 USD/kW for an engine with a rated power of 633 kW, and 2366 USD/kW for an engine with a rated power of 1121 kW (both 1800 rpm). Based on interviews with industry it is assumed that the total cost of a diesel engine system with a rated power of 1200 kW is 16 MNOK (equivalent to 1481 USD/kW). It was also assumed that the costs are equally divided between engine components with limited lifetime on one side and components with lifetime equal to the lifetime of the HSC, such as exhaust system, fuel storage, control systems, etc., on the other side. Since the engines are refurbished and sold after 8000 operating hours, they have a residual value. It is assumed that this value is 50% of the original cost.
2.3.6.Fuel cell system cost
The cost of a complete maritime fuel cell system is currently around 2100 EUR/kW [12]. The high cost is due to ongoing development and very low production volumes. The prices are expected to fall rapidly with increased annual production volumes [28]. The fuel cell systems for maritime applications may also share many components with the systems developed for heavy duty road vehicles, and this may accelerate cost reductions. The provider of the fuel cell stack system (PowerCell) evaluated in this study estimates a current price of 1800 EUR/kW for their products for heavy-duty applications, with a price reduction down to 1000 EUR/kW towards 2025 [4]. Ballard [8] states a current fuel cell system cost of 1200 USD/kW and lifetime of 25 000 hours for buses, and predict a 60% decline (480 USD/kW) in cost by 2030 and a 30 000 hour lifetime in 2026. The FCH-JU multi-annual work plan [9] gives a state-of-the art fuel cell system cost for buses of 1500 EUR/kW and lifetime of 16 000 hours in 2017, with targets of 900 EUR/kW and 20 000 hours in 2020, 750 EUR/kW and 24 000 hours in 2024 and 600 EUR/kW and 28 000 hours in 2030. In addition, comes the costs related to auxiliary systems, marinization, and regulatory approvals. In this analysis a total system cost of 2100 EUR/kW (equal to 21 000 NOK/kW) was assumed.
In the automotive industry the production volumes have reached around 500 to 1000 fuel cell vehicles per year, and the fuel cell system costs are still typically around 1000 USD/kW [31]. However, future cost predictions vary from 280 USD/kW at 20 thousand units/year to 50 USD/kW at 500 thousand units/year. Although an automotive system has lower design lifetime (typically 5000 hours) and is therefore not directly comparable to a heavy-duty maritime system, one may expect similar cost reductions with increased production volumes. Therefore, a cost reduction of 50–80% in some years is considered realistic if annual production volumes continue to increase.
The fuel cell stack lifetime depends on how the stack is operated. Operation at very low or very high current, start-up/shut-down cycling, and freezing starts can significantly reduce stack lifetime [10]. The load cycles on a fuel cell for a ship (continuous high power) will be significantly different than for a bus (power during acceleration). Therefore, the actual lifetime of the system is hard to predict. Hybridization with batteries to avoid unfavourable operating conditions is expected to increase the lifetime of the fuel cell system significantly. For this analysis a conservative lifetime of 20 000 hours is assumed for the fuel cell components with limited lifetime.
The overall fuel cell system costs are equally divided for components with limited lifetime on one side, mainly the stack and wearable components in the BoP, and other components with lifetime similar to the lifetime of the HSC on the other side, such as non-wearable BoP components, control and monitoring systems, piping, safety systems, auxiliary equipment and regulatory approvals.
2.3.7.Hydrogen storage system cost
In a high-speed ferry low weight is the most important parameter to minimize energy consumption. Therefore, light weight carbon fibre reinforced Type 4 cylinders from Hexagon were selected. In this concept the Titan XL 38ft with storage pressure 250 bar, 8500 litres volume, weight 2400 kg and hydrogen storage capacity of ca 150 kg was used [3]. This means that if the total hydrogen storage capacity is 450 kg, which is the case in this study, three such tanks would be required.
Another alternative would be to use
Based on interviews with the industry such a storage tank costs about 720 USD/ kg of hydrogen stored. In comparison, the FCH-JU multi-annual work plan provided in 2017 a state-of-the art CAPEX for vehicle storage tanks of 1000 EUR/kg, with targets of 500 EUR/kg in 2020, 400 EUR/kg in 2024 and 300 EUR/kg in 2030 [9]. Due to the scale of the hydrogen storage on a high-speed ferry it is also relevant to reference FCH-JU costs for compressed gas tube trailers, which was 400 EUR/kg (850 kg hydrogen capacity) in 2017, with target of 350 EUR/kg in 2020.
In addition to the hydrogen storage tanks, there will be costs related to valves and piping, bunkering interface, instrumentation, passive (fire insulation) and active (detectors and firefighting) safety systems, class approval and testing. Based on interviews with industry it is assumed that the additional costs are in the same order of magnitude as the tanks themselves. The total cost is assumed to be 1500 USD/kg of hydrogen capacity, equivalent to 13 500 NOK/kg. The hydrogen storage is assumed to have the same lifetime as the HSC.
2.3.8.Power electronics and electric motor cost
Power electronics is needed to control each fuel cell and deliver its power to a DC bus. In addition, two electric motors are needed and converters to control their speed. Based on interviews with industry a DC-DC converter will cost ca 25 000 EUR per 100 kW fuel cell system. The propulsion system has an estimated cost of 6 MNOK [12]. All components are expected to have the same lifetime as the HSC.
If two 100 kW stacks could be connected in series and controlled by one single DC-DC converter the number of converters would be reduced to the half. This is a realistic approach that would reduce costs. A master thesis investigating the possibilities of weight reduction of the fuel cell power electronics was performed in relation to this case study [5]. It was found that the inductor weight using six conventional 200 kW converters with Si-based semiconductors was 2800 kg. It could also be reduced to just 268 kg by developing new converters using SiC-based semiconductors.
3.Results
3.1.Energy consumption analysis
3.1.1.Reference route
The reference route Florø-Måløy is today operated by the HSC MS Sylvarnes, with installed propulsion power of 1216 kW. The route was analysed for the period January–June 2017. The first week of the dataset is presented in Fig. 6. The weekdays are differentiated by colours, and show that the ferry also serves islands south of Florø three days per week, in addition to the main route between Florø and Måløy.
Fig. 6.
The ferries operation between 1st and 7th of January in 2017.

3.1.2.Ship operational profile
The resulting operational profile is reviewed by plotting its content. Figure 7 shows a profile for a single day. The data reveals time at harbour between routes, time in transit with relatively constant high velocity, and very short stops while it is in route.
Fig. 7.
A typical velocity profile for the high-speed ferry MF Sylvarnes (Friday 13 January 2017).
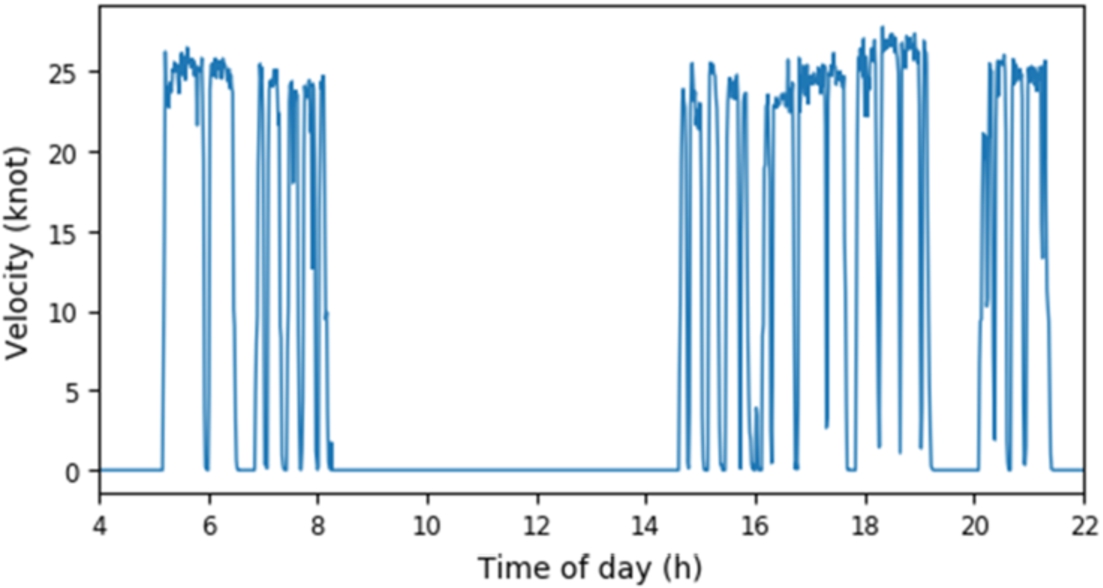
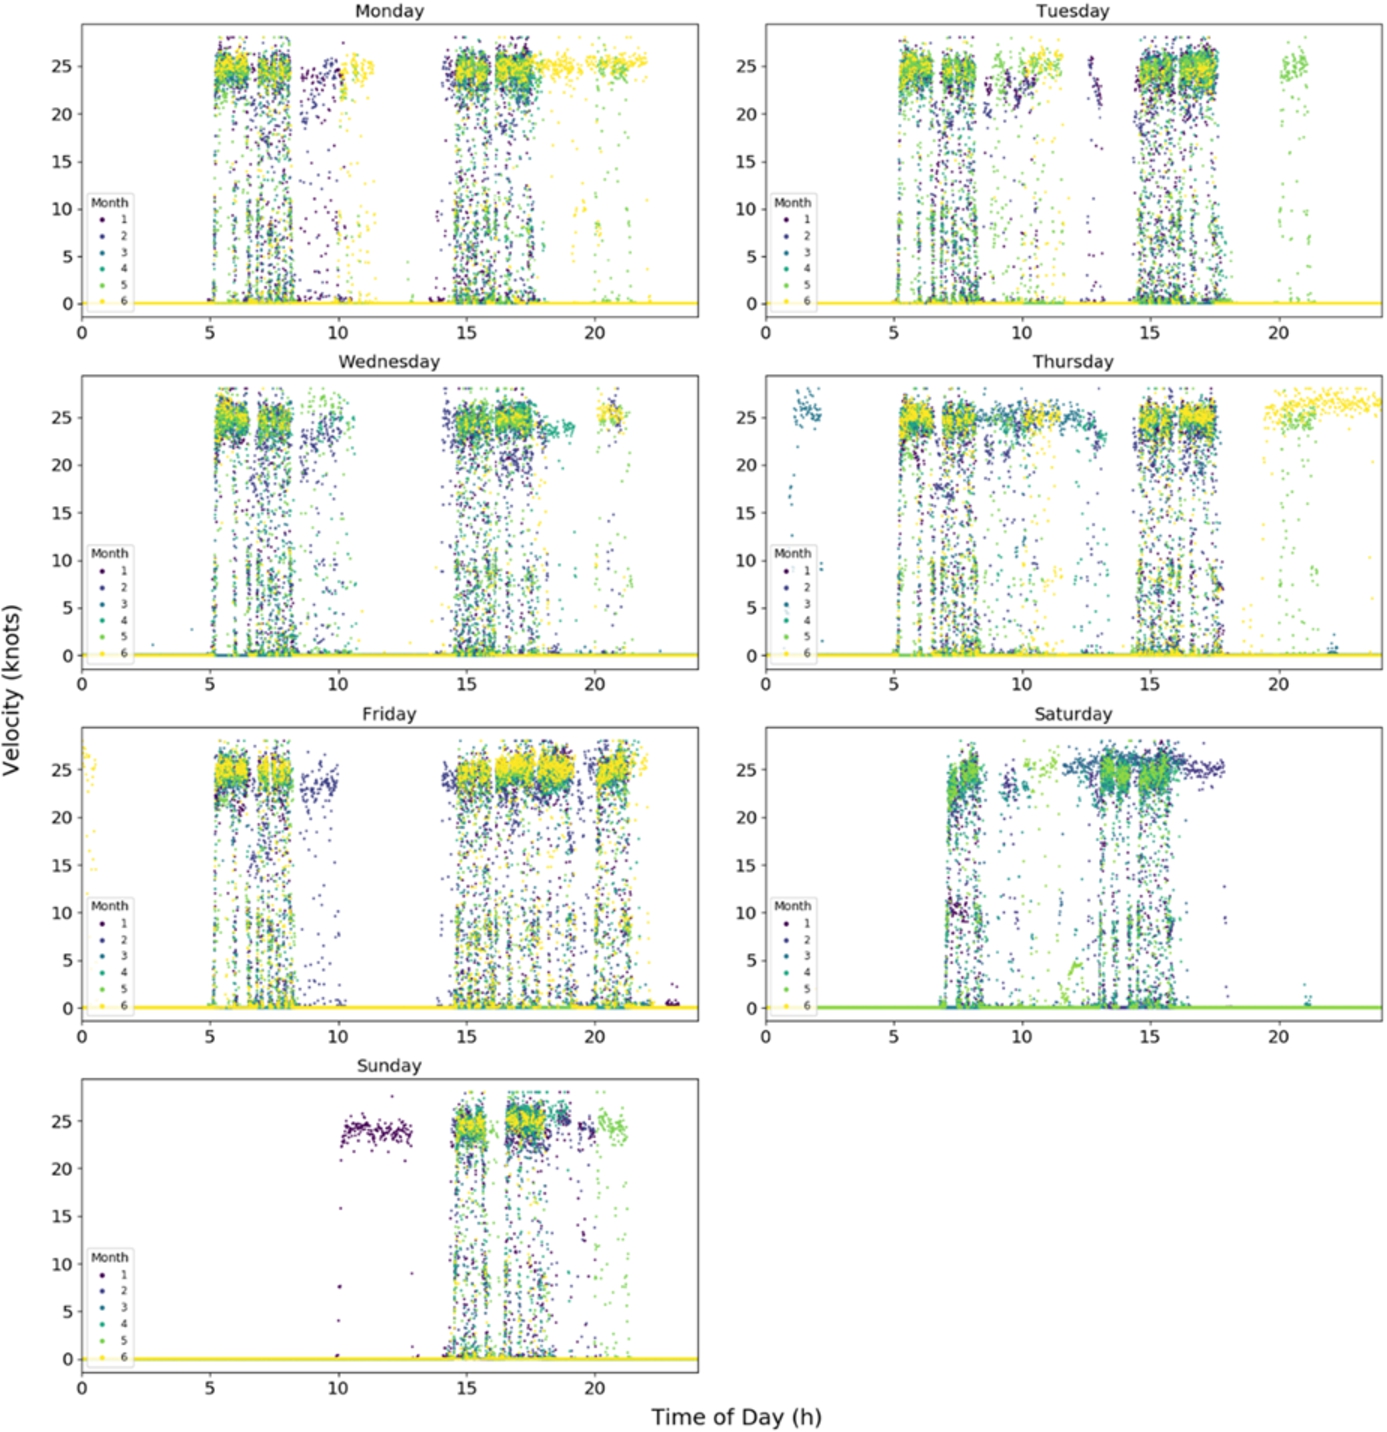
Figure 8 provides plots of the velocity vs. time of day for each weekday for the entire dataset of the 6-month period (where data for each month is represented by different colours). The operational profile of the ferry is relatively predictable, with two distinct work shifts; one in the morning and one in the afternoon, except weekends where the operation is reduced. From the plots it is also possible to identify additional trips made on Monday, Tuesday and Thursday evenings during May and June. The median speed for this period is 23 knots. The plots also show that there are few datapoints around the maximum speed of 28 knots.
Fig. 8.
The user profile of MF Sylvarnes plotted per weekday for the 6 months period.
The ship is in movement for 1097 hours during the 6-month period. Extrapolating this data to a full year of operation gives a yearly operation time of 2194 hours.
A major interruption was found in the dataset for 8 days starting on 6 June 2019, and it was assumed that this was due to maintenance of the ferry. It was also noted up to 94 interruptions of more than 10 minutes in the time series, of which 27 were longer than 30 minutes. Most of the interruptions occurred outside the operation time of the vessel and their impact on the further analysis is considered as limited except the 8 days hold in the timeseries due to maintenance.
3.1.3.Energy consumption
In the energy consumption calculation of the ferry, the days when the vessel was not in operation were removed from the dataset. Days with a very low energy usage of 100 kWh/day or lower were assumed to be days of no operation (the average energy consumption during operation was 3520 kWh/day). In total 12 days where removed using this method, including Easter and other holidays. In addition, there were 8 days with missing data (as mentioned in previous section).
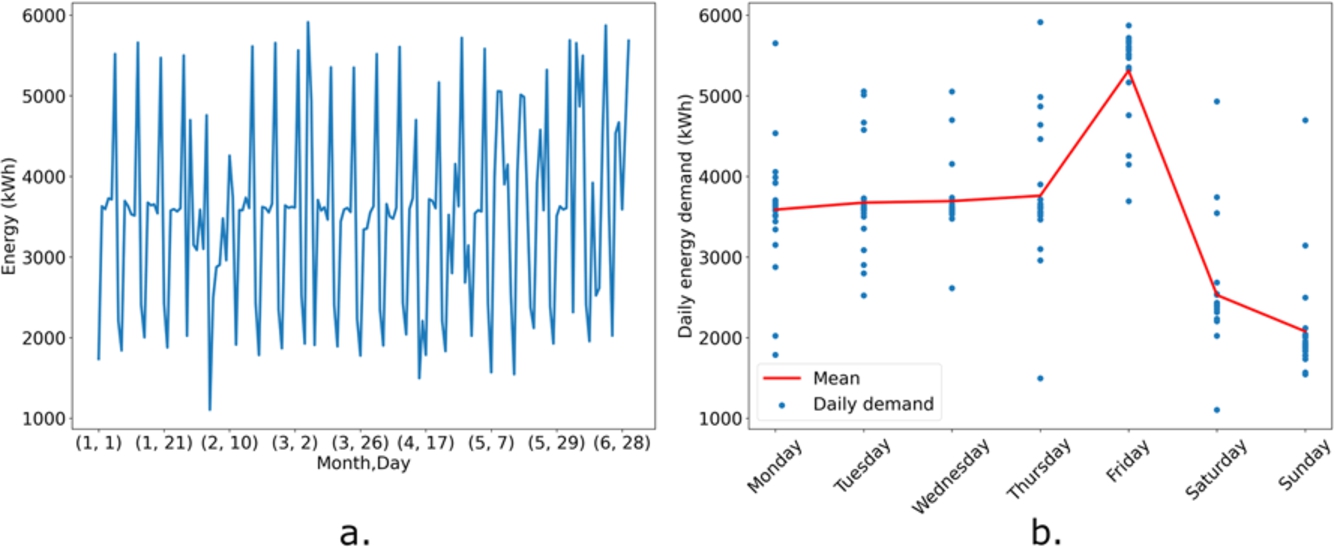
The energy consumption of the ferry has a repeating weekly pattern when plotting the entire period of 6 months and per weekday (Fig. 9). On average the ferry consumes 24 600 kWh per week with a peak in energy demand on Fridays with a mean energy consumption of 5310 kWh, as it here operates up to 3 hours longer in comparison to other working days (Fig. 8). A distinct decrease in energy demand was also observed on weekends (Fig. 8).
Fig. 9.
a. Daily energy consumption over the entire dataset. b. Energy consumption per weekday for every weekday in dataset and mean value.
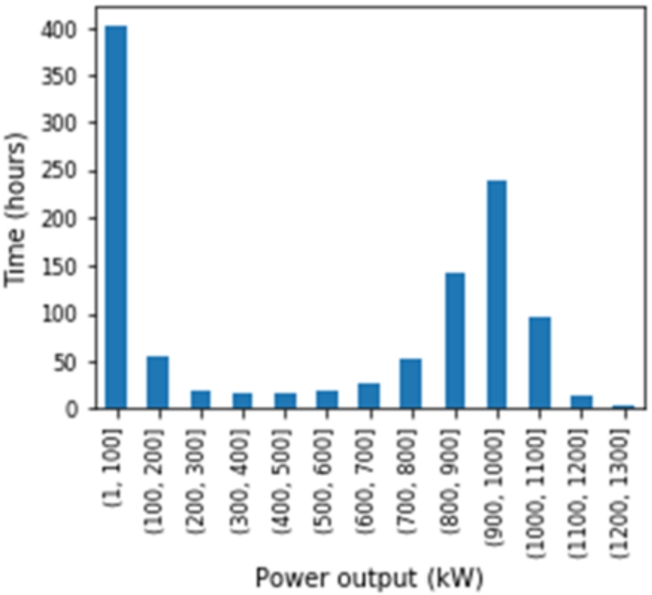
3.1.4.Power demand
Already by observing Fig. 8, it can be concluded that during normal operation frequent high-power output is required. The time spent at different power output levels, organised in 100 kW intervals, is presented in Fig. 10. The most frequent power output level is between 1–100 kW which mainly consists of idling at dock just before or after departure. Part of this time might be replaced with power connection from shore. During operation the ferry typically requires a total power between 700–1100 kW. During the 6 months period only 14 hours were spent at power levels higher than 1100 kW and only 2 hours were spent at power levels higher than 1200 kW. This indicates that a maximum installed power of 1200 kW should be sufficient to maintain the power required for the route.
Fig. 10.
Hours spent at different power outputs.
3.1.5.Estimated hydrogen and diesel consumption
Table 3 shows the weekly and daily hydrogen demand and average fuel cell system efficiency. For comparison, the table also includes the diesel consumption based on a mean engine efficiency of 0.21 kgdiesel/kWh and gravimetric density for diesel of 0.84 kg/L (a high fuel efficiency which is considered a conservative approach).
Table 3
Calculated hydrogen consumption, avg. FC system efficiency and avg. weekly diesel consumption
| Item | Amount |
| Mean weekly hydrogen demand | 1373 kg |
| Mean daily hydrogen demand | 196 kg |
| Max daily hydrogen demand | 337 kg |
| Average FC system efficiency | 53.8% |
| Mean weekly diesel consumption | 6159 liter |
3.2.Annual cost analysis
3.2.1.CAPEX
The capital cost of a HSC with internal combustion engine is assumed to be 40 MNOK, while the cost for a fuel cell powered HSC is based on estimated costs per unit and calculated size of the components. The required propulsion power was found to be 1200 kW. The required capacity of hydrogen storage was calculated to be 453 kgH2; this was based on the maximum daily hydrogen demand, a 17% increase in hydrogen storage capacity due lower end-of-life FC-efficiency, and a 15% spare capacity. Table 4 shows the investment costs of the components and the annual cost considering the annuity payment based on discount rate and the items lifetime (based on 2194 operating hours per year, as shown in the previous section).
Table 4
Estimated purchase cost of a hydrogen powered HSC
| Item | Lifetime | Investment cost (MNOK) | Annual cost (MNOK) |
| HSC incl. diesel system | 20 y | 40.0 | n/a |
| Diesel system (permanent installations) | 20 y | 8.00 | 0.815 |
| Diesel system (degradable components) | 8.00 | 2.61 | |
| Refurbished engine residual value | n/a | −4.00 | −0.987 |
| HSC w/o engine | 20 y | 24.0 | 2.44 |
| Fuel cell system (permanent installations) | 20 y | 12.6 | 1.28 |
| Fuel cell system (degradable components) | 12.6 | 2.00 | |
| Hydrogen storage | 20 y | 6.12 | 0.623 |
| Power electronics and electric motors | 20 y | 9.00 | 0.917 |
| Sum FC HSC | 64.3 |
3.2.2.OPEX
The operational costs are divided into three main parts: fuel, maintenance, and fees, as shown in Table 5. The fuel cost is the main OPEX expenditure and is based on the energy demand (Table 3). The hydrogen consumption is however increased by 8.5% to represent an average consumption during the fuel cell lifetime since consumption is assumed to be increased by 17% at the end of the lifetime. Other costs connected to operation of a HSC was provided in interviews with the maritime sector.
While the HSC is docked it will consume a certain amount of energy for the auxiliary systems. As both the ICE and the FC HSC is assumed to use electric power from shore when docked and consume equal amount of energy, these values are excluded from the calculations.
In total the annual operational cost of a FC HSC is 0.4 million NOK higher than for a diesel-powered HSC and 1.0 million NOK less than the biodiesel solution.
Table 5
Summary of the annual operational costs in million NOK
| FC HSC | Diesel HSC | Biodiesel HSC | |
| Fuel cost | |||
| Diesel excl. tax | 2.01 | 3.84 | |
| Hydrogen fuel | 3.49 | ||
| NOX tax | 0.196 | 0.196 | |
| CO2 tax | 0.432 | ||
| SUM | 3.49 | 2.64 | 4.04 |
| Maintenance | |||
| Cleaning (Engine rooms, technical rooms and outside) | 0.025 | 0.030 | 0.030 |
| Deck accessories | 0.150 | 0.150 | 0.150 |
| Maintenance | 0.500 | 0.850 | 0.850 |
| Lubricating oil | 0 | 0.100 | 0.100 |
| Technical maintenance fuel cells | 0.250 | ||
| Technical maintenance safety systems | 0.200 | ||
| Rental of reserve ferry | 0.200 | 0.400 | 0.400 |
| SUM | 1.33 | 1.53 | 1.53 |
| Fees | |||
| Ships classification and official fees | 0.100 | 0.250 | 0.250 |
| Assurance incl P&I | 0.400 | 0.300 | 0.300 |
| Port charges | 0 | 0.200 | 0.200 |
| SUM | 0.500 | 0.750 | 0.750 |
| SUM of Fuel cost, Maintenance and Fees | 5.32 | 4.92 | 6.32 |
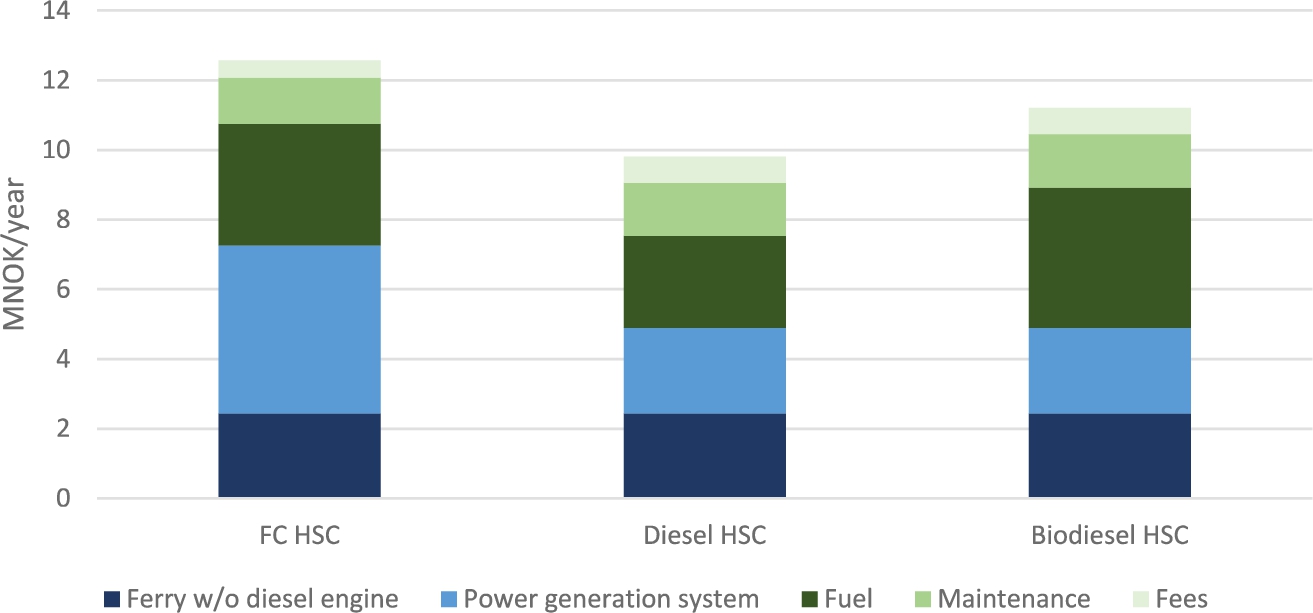
3.2.3.Annual budget
The annual costs of the different HSCs are summarized in Fig. 11. Due to the considerably higher investments cost and somewhat higher operational costs, the FC HSC is 2.77 MNOK/year or 28% more expensive to operate in comparison with the conventional fossil diesel solution. It is also 1.37 MNOK/year or 12% more expensive than a biodiesel solution.
Figure 11 also shows that the FC HSC have the highest share of annuity payments for the power generation system, which makes it more sensitive to changes in the discount rate in comparison with other alternatives.
Fig. 11.
Annual costs for hydrogen, biodiesel and diesel-powered HSC.
3.3.Sensitivity analysis
A sensitivity analysis was made for the FC HSC by adjusting three variables related to the performance of fuel cell system and HSC design, three cost variables and the discount rate. The results of the analysis are shown in Fig. 12.
Fig. 12.
Changes in H2 HSC annual costs considering changes in 6 different parameters.
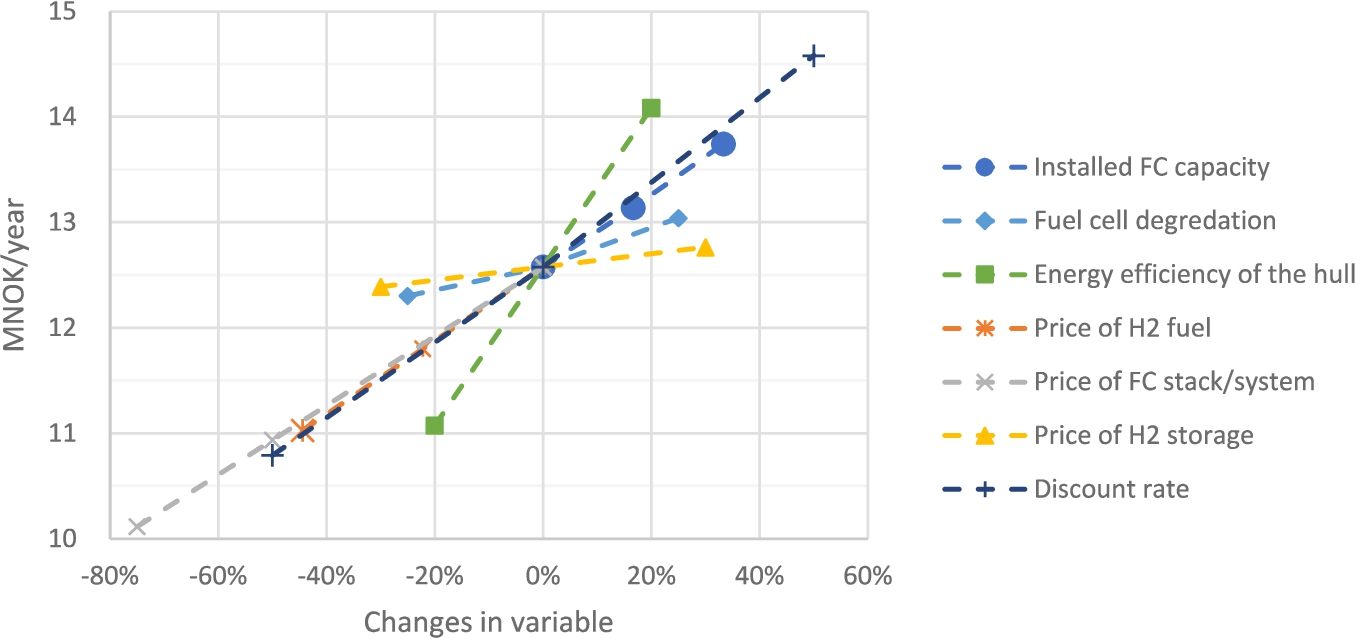
The installed FC capacity was increased from 1.2 up to 1.6 MW. With an over-dimensioned FC system the efficiency increases, and fuel demand is reduced. When the FC is increased to 1.6 MW, the average FC efficiency rises by 3.2% to 57%, daily hydrogen demand drops by 5.6% and storage size decreases by 6.2%. These reductions in storage and fuel consumption do not compensate for increased FC CAPEX. The second technical parameter, lifetime of FC, is adjusted
The last technical parameter used in the sensitivity analysis is hull efficiency and the resulting reduction of propulsion power and fuel consumption. It is modelled by changing the output of the velocity-power curve in Fig. 3 by
From the three cost parameters the annual cost had similar sensitivity to FC system and hydrogen costs, but a much larger reduction in FC system costs is expected. A hydrogen price below 45 NOK/kg can be achieved by large scale production, and/or by selling the biproducts of hydrogen production, such as oxygen and waste heat [32]. In the sensitivity analysis it is included effects of a price decrease down to 25 NOK/kgH2 (
For any capital intense solution, the discount rate has an important impact on the obtained result. In this case the annual cost has similar sensitivity to a relative change in discount rate as to other central cost parameters such as FC system or hydrogen costs.
3.4.Future cost scenario
In the sensitivity analysis the effect of different parameters where reviewed separately to identify the most important ones. However, the results from the sensitivity analysis cannot be summarized as several of the variables are interdependent, e.g. if fuel cell system size is decreased, the impact of its cost reduction will also be reduced. Therefore, a simultaneous reduction of several of these values are made to represent a possible future scenario for the HSC, that could be achieved during 2025–2030. Conservative improvements were estimated for technical performance and costs, which are listed in Table 6.
Table 6
Reduction of various variables in the future scenario
| Item | Change in % | Value | Comments |
| Hull efficiency | |||
| Propulsion power | 1000 kW | Due to improved hull efficiency and downsizing | |
| FC system lifetime | 25 000 h | ||
| H2 storage | 418 kg | Due to improved hull efficiency | |
| H2 weekly consumption | 1307 kg/week | Due to improved hull efficiency | |
| Cost of fuel cell system (permanent installations) | 5500 NOK/kWel | ||
| Cost of fuel cell system (degradable components) | 5500 NOK/kWel | ||
| Cost of hydrogen storage system | 12 800 NOK/kgH2 | ||
| Cost of hydrogen fuel | 35 NOK/kg | ||
| CO2 tax | 1.62 NOK/L |
Fig. 13.
Cost reduction for future HSC based on assumed technology improvements and cost reductions presented in Table 6 (
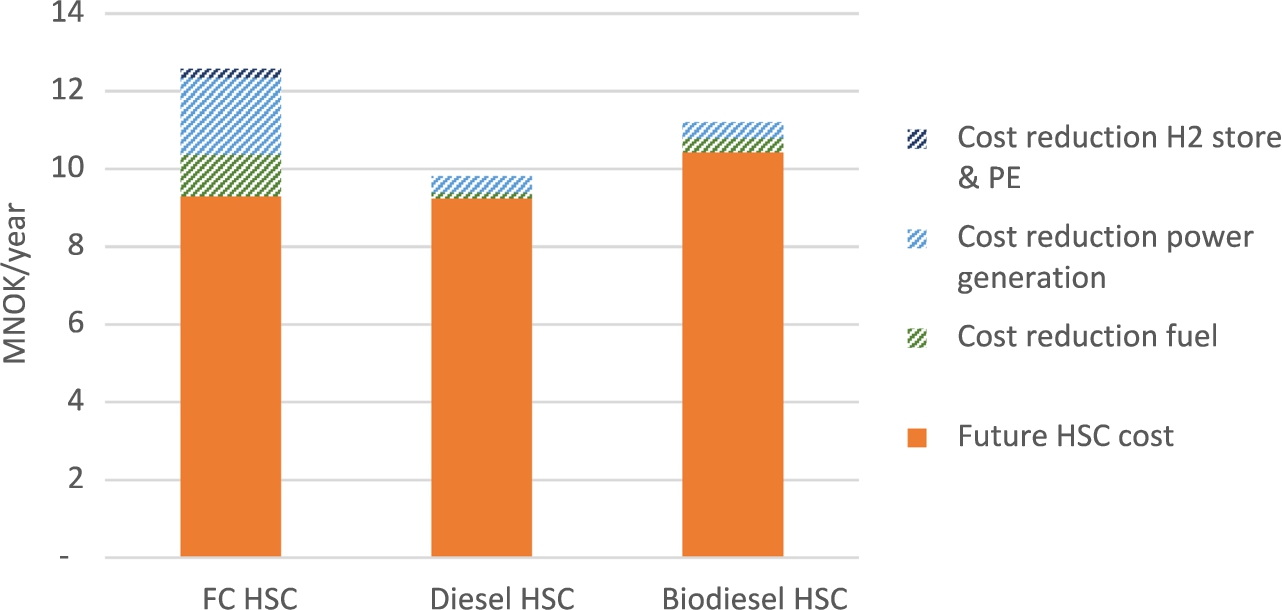
In the future scenario the required propulsion power is slightly more downsized than the decrease in peak power. When selecting installed propulsion power of 1000 kW the number of hours the system cannot provide power according to AIS data analysis is increasing from 2 hours to 11 hours during the 6 months period, which is considered acceptable.
The costs of future HSC and the reduction from present cost levels are shown in Fig. 13. The annual cost of a future FC HSC decreased by 26% to 9.29 MNOK/year, where fuel cell and hydrogen fuel had the biggest cost cuts. Also, the diesel-powered HSC receives benefits from a more energy efficient hull, such as downsized engine and reduced fuel consumption, but to a smaller extent. The cost gap between diesel and H2 HSC reduces from 2.77 MNOK/year to 0.05 MNOK/year, while biodiesel HSC becomes 1.14 MNOK/year more expensive than the FC HSC.
4.Discussion
4.1.Energy analysis and dimensioning of energy system
In this study historical positioning data from the route Florø to Måløy in 2017 was used to estimate power and energy required for a new hydrogen powered HSC to operate the same route. It was found that a fuel cell system installation of 1200 kW, and 453 kg of hydrogen storage (including 17% increased fuel consumption at end of life and 15% spare capacity) would be sufficient for the concept ship to operate this route.
Considering the module weight of a PowerCell MS-100 of 150 kg (per 100 kW) and hydrogen storage tank weight of a Hexagon Titan XL 38 ft tank of 2400 kg (150 kg storage capacity each) the total hydrogen system weight would be around 9000 kg. In addition, comes the power electronics of about 3 tons and possibly a battery for hybridization (which is not included in this study). This would result in a weight that is similar to the conventional 10–15 tons of diesel engines with fuel storage.
It may also be of interest to compare with a battery electric solution. Assuming a battery capacity of 25% of the daily maximum energy demand is sufficient (337 kg of hydrogen, 33.3 kWh/kg hydrogen lower heating value, 50% fuel cell efficiency), DoD of 60% and battery weight 8 kg/kWh, the required battery installation would weigh about 18.7 tons. This indicates that a battery electric solution may be feasible on this particular route and could be investigated in further work.
4.2.Cost analysis
In this study the annual cost of operating a hydrogen and fuel cell powered HSC was compared to a biodiesel and conventional fossil diesel powered solution.
At the current technology cost level, the FC HSC was found to have CAPEX of 64.3 MNOK, which is 61% higher than a conventional solution. However, the OPEX at 5.32 MNOK/year was only 8% higher than a fossil diesel solution, and 16% cheaper than a biodiesel solution. In total the annual costs of the FC HSC are 2.77 MNOK/year (28%) higher than fossil diesel and 1.37 MNOK/year (12%) higher than biodiesel. This was to be expected, since the maritime hydrogen system market is almost non-existing.
The more interesting result is the future cost scenario where moderate improvement in hull efficiency and fuel cell lifetime are applied, along with moderate price reductions for the hydrogen and fuel cell systems and increase in CO2 tax. In this scenario the annual FC HSC cost is reduced by 26% to 9.29 MNOK, which is only 0.05 MNOK/year (0.4%) higher than the fossil diesel solution and 1.14 MNOK/year (12%) less than biodiesel.
The results of the future cost scenario indicate that the hydrogen powered HSC will reach cost parity with the fossil diesel solution sometime in the period 2025 to 2030. This supports the hypothesis that hydrogen can offer the lowest cost zero-emission solution, especially for the longer routes where battery electric solutions are not currently possible.
A prerequisite for the future cost scenario is that one or a few ships are built beforehand to take the development costs. The first ship will not reach cost parity just by postponing building it.
The cost reductions considered in the future cost scenario are considered conservative. For example the cost used for the fuel cell system of 11 kNOK/kW (1100 EUR/kW) is higher than the predicted costs for 2025 (750–1000 EUR/kW) and much higher than the predicted costs for 2030 (480–600 EUR/kW).
The discount rate in this report was set to 8%. With the key policy rates in many countries being around 0% to 1% for several years, one may consider if 8% is slightly high.
4.3.Hydrogen HSC as public transport option
Traditionally the high-speed passenger ferry has not been considered a very attractive alternative for public transport due to very high diesel consumption and resulting GHG emissions. However, once a zero-emission alternative such as a hydrogen powered HSC becomes available, it should really be considered wherever congestion is problematic and waterways are available.
A hydrogen HSC with large consumption and daily routes throughout the year is the perfect customer for initiating a hydrogen supply infrastructure. Also, it does not require investments in expensive infrastructure such as roads, rail and subway systems.
4.4.Uncertainties
Among the major uncertainties in this report is the inability of the energy analysis method of accounting for the weather effect. Bad weather conditions would increase the power required to maintain a certain velocity or cause the ship to slow down, but the increased energy consumption will not show up in the historical positional AIS data. The actual energy consumption on the route may therefore be higher, especially during stormy seasons. A function correcting for weather effects should be implemented in further work.
The IMO Tier 3 NOX standard will come into effect in the North Sea area by 2021 and will limit the emissions to 2 g/kWh for high speed engines. This may increase CAPEX (SCR installation) and/or OPEX (additives or reduced efficiency) for both the diesel cases, but has not been considered in this work.
The diesel consumption in this work was calculated using a constant optimal engine diesel consumption of 0.21 kg/kWh (LHV efficiency of ca 40.6%). In practice the efficiency might be a few percentage points lower since parts of the time is spent at very low output power. The method will result in underestimation of diesel consumption, favouring the diesel cases. A better method would have been to use an efficiency function dependent on output power, as was done with the fuel cell system. This is left for further work.
For the first FC HSC one might expect large one-time development costs related to the fact that the hull must be redesigned considering the safety aspects of hydrogen, and maritime fuel cell and hydrogen equipment for light vessels must be developed. In addition, the operator does not have experience with such a vessel and may want to have a back-up vessel available until sufficient operational experience is made. These added costs may be significant and have not been captured in this work.
This work does not include the possibility of incentives. Incentives may cover parts of the development costs of a FC HSC. There are several funding agencies offering incentives aiming to promote greener and zero-emission technologies for which a FC HSC would be eligible. Examples of these are the Norwegian NOX Fund and ENOVA.
5.Conclusions
A cost analysis of a concept hydrogen powered HSC operating on a route between Florø and Måløy in Norway has been carried out. The main motivation with this study was to evaluate if a hydrogen powered HSC may become a cost-effective alternative in the future, while also offering zero GHG emissions.
The study analyses the energy and power requirements for a concept ship based on six months of historical positional data from a ship operating the same route. The energy and power requirements are used to dimension the system components and calculate investment and operational costs. The FC HSC is then compared to a conventional diesel, and a biodiesel solution. A sensitivity analysis was performed, in addition to a future cost scenario where moderate technology improvements and cost reductions were assumed.
In the current cost scenario, the hydrogen solution has 28% higher annual costs than a conventional diesel solution, and 12% higher than a biodiesel solution. The sensitivity analysis shows that improving energy efficiency of the hull has the largest impact on the annual costs, since it will result in less installed FC power, smaller hydrogen storage and lower fuel consumption. However, the hull is already optimized to a great extent so only small improvements are expected. The second largest impact is made from reducing FC system cost and hydrogen fuel cost, of which the FC system cost is expected to be reduced the most (50–75%) in this decade.
In the future cost scenario moderate improvements were assumed for hull efficiency and FC lifetime, conservative cost reductions for system components and hydrogen fuel, and a moderate increase in CO2 tax. In this scenario the FC HSC reaches cost parity with the fossil diesel solution.
The conclusion of the study is that a hydrogen powered HSC, in the period 2025–2030, after it has been developed and tested, may offer a zero-emission solution at approximately the same costs as a conventional fossil diesel powered ferry.
Acknowledgements
This work was performed within MoZEES, a Norwegian Centre for Environment-friendly Energy Research (FME), co-sponsored by the Research Council of Norway (project number 257653) and 40 partners from research, industry and public sector. Acknowledgements go to the GKP7H2-consortium for providing information on the concept design for a hydrogen driven high speed passenger ferry.
References
[1] | B. Aa, AERO – The future of fast ferries [Internet]. Norway: Brødrene Aa; 2019 [cited 2019 Oct 11]. Available from: https://www.braa.no/news/aero-design-revealed. |
[2] | F.G. Aarskog, O.R. Hansen, T. Strømgren and Ø. Ulleberg, Concept risk assessment of a hydrogen driven high speed passenger ferry, International Journal of Hydrogen Energy 45: (2) ((2020) ), 1359–1372. doi:10.1016/j.ijhydene.2019.05.128. |
[3] | Brødrene Aa, Westcon Power & Automation, Boreal Sjø, Rapport fase 2 – Utviklingskontrakt utslippsfri hurtigbåt [Online report]. Norway: Brødrene Aa; 2019 [updated 3 September; cited 2020 Apr 20]. Available from: https://www.trondelagfylke.no/nyhetsarkiv/framtidas-hurtigbater-gir-null-utslipp/. |
[4] | J. Burgren, Hydrogen technology fuel cell development into the future – Powercell, in: MoZEES Workshop on Heavy Duty Transport Solutions, 22–23 October, (2019) , Oslo2019. |
[5] | H.M. Bye, Investigation of a 200 kW SiC-based IBC for high-speed hydrogen ferries [Online Report]. Norway: NTNU; 2019 [cited 2020 Apr 20]. Available from: http://hdl.handle.net/11250/2625864. |
[6] | Circle K, Fuel prices [Internet]. Norway: Circle K; 2019 [updated 2019 Oct 16; cited 2019 Oct 16]. Available from: https://www.circlek.no/no_NO/pg1334073738687/business/milesDrivstoffbedrift/Priser.html. |
[7] | K. Darrow, R. Tidball, J. Wang and A. Hampson, Catalog of CHP technologies, Section 2. Technology characterization – Reciprocating internal combustion engines [Online report]. USA: EPA; 2015 [cited 2020 Apr 20]. Available from: https://www.epa.gov/sites/production/files/2015-07/documents/catalog_of_chp_technologies_section_2._technology_characterization_-_reciprocating_internal_combustion_engines.pdf. |
[8] | Deloitte, Ballard, Fueling the future of mobility – Hydrogen and fuel cell solutions for transportation [Online report]. China: Deloitte; 2020 [cited 2020 Apr 20]. Available from: https://info.ballard.com/deloitte-vol-1-fueling-the-future-of-mobility. |
[9] | FCH 2 JU, Multi-annual work plan 2014–2020 [Online report]. EU: FCH 2 JU; 2018 [cited 2020 Apr 20]. Available from: https://www.fch.europa.eu/sites/default/files/MAWP%20final%20version_endorsed%20GB%2015062018%20%28ID%203712421%29.pdf. |
[10] | T. Fletcher, R. Thring and M. Watkinson, An energy management strategy to concurrently optimise fuel consumption & PEM fuel cell lifetime in a hybrid vehicle, International Journal of Hydrogen Energy 41: (46) ((2016) ), 21503–21515. doi:10.1016/j.ijhydene.2016.08.157. |
[11] | Flying Foil, The world’s most efficient hydrofoils Norway: Flying foil; 2020 [cited 2019 Oct 11]. Available from: https://flyingfoil.no/. |
[12] | C. Ianssen, T. Sandblost and E. Ianssen, Battery/fuel cell fast ferry [Online report]. Trondheim/Sandtorg: Selfa; 2016 [updated 2017; cited 2020 Apr 20]. Available from: https://www.nho.no/samarbeid/nox-fondet/artikler/rapporter/. |
[13] | IMO, Nitrogen Oxides (NOx) – Regulation 13 [Internet]. United Kingdom: IMO; 2019 [cited 2019 Oct 16]. Available from: http://www.imo.org/en/OurWork/Environment/PollutionPrevention/AirPollution/Pages/Nitrogen-oxides-(NOx)-%E2%80%93-Regulation-13.aspx. |
[14] | Kystverket, Automatic identification system [Internet]. Ålesund: Kystverket; 2011 [updated 2019 Sep 09; cited 2020 Apr 18]. Available from: https://www.kystverket.no/en/EN_Maritime-Services/Reporting-and-Information-Services/ais/Automatic-Identification-System-AIS. |
[15] | Marine GGZE, Water-Go-Round Project [Internet]. California: Water-Go-Round; 2020 [cited 2020 Apr 18]. Available from: https://watergoround.com/. |
[16] | J.C. Meier, C. Galeano, I. Katsounaros, J. Witte, H.J. Bongard, A.A. Topalov et al., Design criteria for stable Pt/C fuel cell catalysts, Beilstein J. Nanotechnol. 5: ((2014) ), 44–67. doi:10.3762/bjnano.5.5. |
[17] | MTU, Marine diesel engines 8V/10V 2000 M72 for fast vessels with high load factors (1B) [Internet]. Germany: MTU; 2019 [cited 2020 Apr 20]. Available from: https://www.mtu-solutions.com/eu/en/products/commercial-marine-products-list.html. |
[18] | Norwegian Tax Administration, Mineral product tax [Internet]. Norway: Norwegian Tax Administration; 2019 [cited 2019 Oct 16]. Available from: https://www.skatteetaten.no/en/business-and-organisation/vat-and-duties/excise-duties/about-the-excise-duties/mineral-product/. |
[19] | Norwegian Tax Administration, NOx tax [Internet]. Norway: Norwegian Tax Administration; 2019 [cited 2019 Apr 20]. Available from: https://www.skatteetaten.no/en/business-and-organisation/vat-and-duties/excise-duties/about-the-excise-duties/nox/. |
[20] | J.H. Nygård and T. Strømgren, Sluttrapport forprosjekt gkp7h2 – hurtiggåande passasjerbåt med hydrogenbasert framdrift, justert versjon for ekstern bruk [Online report]. Florø: DNVGL; 2017 [updated 2017 Aug 10; cited 2020 Apr 20]. Available from: https://www.dnvgl.no/maritime/gront-kystfartsprogram/rapporter.html. |
[21] | E. Ovrum and D. Øvrebø, Infrastruktur for fremtidens hurtigbåt [Online report]. Norway: Rambøll; 2019 [cited 2020 Apr 20]. Available from: https://www.hubforocean.no/rapportarblogg/infrastruktur-for-fremtidens-hurtigbt. |
[22] | C.S. Park, P. Kumar and N. Kumar, Engineering Economics, 3rd edn, Pearson Prentice Hall, England, (2013) . |
[23] | PowerCell, MS-100 [Internet]. Sweden: Powercell; 2019 [cited 2019 Sep 16]. Available from: https://www.powercell.se/en/products/powercell-ms-100-50-100kw/. |
[24] | J.W. Pratt and L.E. Elebanoff, Feasibility of the SF-BREEZE: A zero-emission, hydrogen fuel cell, high-speed passenger ferry [Online report]. Livermore (CA): Sandia National Laboratories; 2016 [cited 2020 Apr 20]. Available from: https://energy.sandia.gov/programs/sustainable-transportation/hydrogen/market-transformation/maritime-fuel-cells/sf-breeze/. |
[25] | E. Solvang, Framtidas hurtigbåter gir null utslipp [Internet]. Steinkjer: Trøndelag fylkeskommune; 2019 [updated 2019 Dec 12; cited 2020 Apr 20]. Available from: https://www.trondelagfylke.no/nyhetsarkiv/framtidas-hurtigbater-gir-null-utslipp. |
[26] | Statistics Norway, Norwegian emissions to air [Internet]. 2019 [cited 2019 12 September]. Available from: https://www.ssb.no/en/natur-og-miljo/statistikker/klimagassn/. |
[27] | The Norwegian Public Roads Administration, Utviklingskontrakt hydrogen-elektrisk ferje [Internet]. Lillehammer: NPRA; 2020 [updated 2020 Jan 02; cited 2020 Apr 19]. Available from: https://www.vegvesen.no/fag/trafikk/ferje/utviklingskontrakt-hydrogen. |
[28] | S.T. Thompson, B.D. James, J.M. Huya-Kouadio, C. Houchins, D.A. DeSantis, R. Ahluwalia et al., Direct hydrogen fuel cell electric vehicle cost analysis: System and high-volume manufacturing description, validation, and outlook, Journal of Power Sources 399: ((2018) ), 304–313. doi:10.1016/j.jpowsour.2018.07.100. |
[29] | H. Thune-Larsen, R. Hagman, I.B. Hagman and K.S. Eriksen, Energy efficiency and CO2 emissions in the Norwegian transport sector 1994–2050 [Online report]. Oslo: Institute of Transport Economics; 2009 [cited 2020 Apr 20]. Available from: https://www.toi.no/transport-models/energy-efficiency-and-co2-emissions-in-the-norwegian-transport-sector-article28258-1261.html. |
[30] | Ø. Ulleberg and R. Hancke, Techno-economic calculations of small-scale hydrogen supply systems for zero emission transport in Norway, International Journal of Hydrogen Energy 45: (2) ((2020) ), 1201–1211. doi:10.1016/j.ijhydene.2019.05.170. |
[31] | L. van Biert, M. Godjevac, K. Visser and P.V. Aravind, A review of fuel cell systems for maritime applications, Journal of Power Sources 327: ((2016) ), 345–364. doi:10.1016/j.jpowsour.2016.07.007. |
[32] | V. Vandenbussche, E. Rambech, J.C. Gjerløw and T. Trondstad, Smøla hydrogen value chain [Online report], Oslo: Endrava; 2019 [cited 2020 Apr 20]. Available from: https://www.endrava.com/value-chain-for-hydrogen-from-wind-energy/. |
[33] | Vestland County Municipality, Vestland får miljøvenlege snøggbåtar [Internet]. Bergen: Vestland County Municipality; 2019 [cited 2019 Dec 19]. Available from: https://www.vlfk.no/vestland-far-miljovenlege-snoggbatar/. |


