
Life cycle ship performance assessment (LCPA): A blended formulation between costs and environmental aspects for early design stage
Abstract
Background:
In ship design, since the early stage, there is an increasing need to compare different design solutions analysing ship performances along the whole life-cycle frame, not only from the economical point of view, but also in terms of the environmental aspects.
Objective:
To this aim, an approach is proposed to carry out the assessment of both cost and environmental performances on a comparative basis, among different ship design solutions.
Method:
A blended formulation between Life Cycle Cost (LCC) and Life Cycle Assessment (LCA) is developed, with the option nevertheless to keep also each selected Key Performance Indicator (KPI) as a separated source of information.
Results:
Significant KPIs are specifically identified and discussed; then a formulation is proposed for a comprehensive evaluation by means of a single index of Life Cycle Performance Assessment (LCPA). The harmonized formulation allows a rationally based comparison between projects and solutions, giving a weight to each selected KPI according to priorities of designers and ship owners/operators. A Ship Breakdown Structure has been developed to link ship design parameters with calculation of KPIs.
Though the end of life is an essential phase to be accounted for in a life cycle evaluation, the practical approach presented in this paper is limited to Design/Construction and Operations. Decommissioning issues have been postponed to a future activity, keeping in mind that the topic is very much related to owners company policy and strongly dependant on details not available yet in the conceptual ship design phase.
Conclusions:
The decision-making activity during the ship design process needs to be supported by quantitative evaluations, properly projected over the whole ship lifetime range. In the paper, the structure of a bottom up procedure is proposed, starting from low level information and data (e.g. ship characteristics and operational profile) and arriving to a single parameter (LCPA index), by means of selected KPIs and their linear combination. Indeed, one of the great challenges is the availability and selection of appropriate data, needed to quantify KPIs during the design stage.
The approach has been implemented and applied to a Ro-Ro passenger ship in order to verify and validate the LCPA tool structure and its reliability.
1.Introduction
Ships are among the most complex systems built by humans, especially when dealing with the case of passenger ships, navy ships and supply vessels. The relevant activities specifically devoted to create added value in this sector are complex as well [2] and suitable innovative assessment tools are needed to manage the process. In order to increase the profitability of the shipbuilding field and of the shipping arena in general, it is necessary to evaluate ship economical performances in a life cycle perspective, taking into account for example also operational aspects. At the same time, recognizing that sustainable development is an ineludible value, it is necessary to address the ship environmental impact as well.
In this scenario, the well-known Life Cycle Costing (LCC) and Life Cycle Assessment (LCA) analyses represent some best practices to be properly implemented in the design of new units. In fact, they are both well developed and applied in many sectors but not very much exploited in the shipping industries.
Usually with the term “life-cycle” the following three phases, one behind the other, are meant: Design/Production, Operations, Disposal. In this paper, the disposal phase is for the moment disregarded and the focus is mainly on the design/production and operations phases.
LCC is a method that enables comparative cost assessments to be made over the life cycle of a vessel, from design and commissioning to scrapping/re-cycling. It takes into account all relevant economic factors both in terms of initial capital costs, future operational and asset replacement costs [6].
LCA is the assessment of the environmental impact of a product or a service throughout its lifespan.
Both LCC and LCA are addressed in two specific ISO standards, 15686-5 [13] and 14040 [14] respectively.
Several approaches for both LCC and LCA are available at present, even though their application is neither straightforward nor harmonized. The most common attempt of an hybrid formulation is aimed to implement aspects of LCC in a LCA study and vice versa (further information in Section 3). However, differences in the methodological approach and in setting priorities for environmental, economic and societal issues lead to conflicting outcomes and conclusions. Moreover, there is still a lack of a holistic approach when integrating these procedures in the ship design phase [8].
As mentioned above, LCC and LCA are two approaches that investigate different features of the life cycle performance of a product. However, for both procedures, the application during ship design is particularly demanding. Moreover, a unique analysis which takes into account economic, environmental and energetic aspects at the same time would be undeniably preferable. For this reason, a Life Cycle Performance Assessment (LCPA) has been defined and developed. This procedure separately performs LCA and LCC analyses, evaluating economic and environmental-energetic KPIs and merging them to assess a final global index, the LCPA Index (further information in Section 5).
With respect to LCC and LCA analysis, design procedures for the shipping field should consider the whole product life cycle, starting from ship concept design to scrapping/re-cycling in a consistent and objective way. However, at present, only some features regarding the vessel’s whole life cycle are available on database and software platforms. Therefore, the decision-making process resembles more the integration of solutions addressing singular sub-problems than a comprehensive approach, relying on a superposition principle to synthesize the best possible design. One of the reasons is that shipyards and owners in some way define the optimised product in an independent way, with their own separate perspective.
Shipyards would like to produce the requested product at the lower cost possible, obviously guaranteeing all technical requirements stated in the design contractual specification. However, ship owners are strongly driven by reducing operational costs and increasing revenues. However, better performances and lower costs and emissions could be achieved if different operational profiles and ship configurations are analysed at preliminary design from a life cycle holistic perspective. Therefore, an integrated formulation for life cycle analysis on environmental impact and costs could help a more effective dialogue between shipyards and ship owners during the design process.
Very interesting approaches and applications about lifecycle assessment during ship design are presented in [4,10,22].
2.Merging techniques
Since both environmental and economic performances of a product over its life cycle are important, in recent years approaches to take them into account together were proposed. In fact, when performing an LCA to reduce emissions and pollutants, an integrated LCC analysis to assess the different alternatives confers an important value to obtained results [16]. However, there are different challenges involved when merging LCC and LCA analyses.
The first issue which arises is the different unit of measures involved in the analysis. The main results of a LCC are expressed in currency, while environmental impact depends on the type of pollutant being considered. Therefore, making a comparison between different solutions during the design of a new product, a ship in our case, could be complicated.
Another consideration is the double counting of the same environmental impact when translating it in both financial or physical terms [21]. Moreover, cost data can be more volatile than physical quantities due to the different value of currencies in countries and over different years. Besides, since people are familiar with currency units, costs data sometimes creates an excessive sense of reliability which could lead to wrong results or questionable conclusions [5].
Parameters involved in LCC and LCA analyses can also vary significantly depending on the field of application which is being considered. For example, economic and environmental parameters to assess a ship design could be really different from other industrial sectors. Some similarities can be found when dealing with the transport industry, even if ships are not manufactured following a series production. In principle the production of large quantities of a standardized article would allow an easier implementation of LCC and LCA analysis due for example to the higher level of available data.
Regarding LCC and LCA in other industrial sectors, it seems that they are usually more established compared to maritime and shipping industry. Considering the road sector, a specific attention towards car and automotive industry has been addressed. The automotive industry seems to be pursuing the implementation of LCA and LCC in a single global assessment using a Full Cost Accounting (FCA) technique.
This method (FCA) was developed to adjust the existing prices of products and services by monetising and incorporating both internal and external impacts (positive and negative), including environmental and social externalities. FCA is not a new concept; it has been applied in many different settings such as the energy industry, oil and gas industry and chemical industries [15]. For this approach to work successfully, the problems of boundaries and allocating a specific impact to the particular activity or organisation have to be resolved. When applying FCA, organizations need to make decisions on which impacts are to be excluded from the assessment and which are to be accounted for. The main challenge of this method is to quantify environmental and social issues into monetary values: for this reason, this approach seems to be applicable realistically only for a specific situation (i.e. known shipyard and ship type) where data can be collected easily.
Another way of combining LCA and LCC is discussed by Bernier et al. [3] which proposes the adoption of eco-costs as a weighting method in LCA by monetizing the environmental impacts. This method would produce a single-score impact assessment that can be used as a decision making tool as well as a more complete approach to LCA analysis.
Another method proposed by the Society of Environmental Toxicology and Chemistry (SETAC) is an “environmental LCC”. This procedure is based on a conceptual framework for life cycle sustainability assessment and uses separated analyses for each of the three key points of sustainability: environment, economy, and social equity [16]. However, further steps need to be performed to put this procedure on a solid basis for eventual integration with a social LCA into a comprehensive Life Cycle Sustainability Assessment (LCSA).
In this attempt to build a LCSA approach, it is important to define relationships between life cycle tools used to estimate economic, environmental and social equity performances. In fact, for each category, different approaches can be applied. As highlighted by Hoogmartens et al. [11], it is necessary to build a framework which clarifies connections between all life cycle assessment tools available and defines the domain of each model. In any case, when evaluating economic and environmental performances of a project, the time span and reference scenario must be the same in both analyses to avoid errors caused by a different problem definition.
Moreover, there is a potential confusion regarding LCSA acronyms; sometimes, LCSA refers to Life Cycle Sustainability Assessment, while in other cases it refers to Life Cycle Sustainability Analysis. LCSA (assessment) separately models each of the three aspects of sustainability, and then synthesizes the results in a final decision-analysis step. While this approach has the advantage of promoting a strong sustainability perspective, it does not consider mutual relations amongst the pillars, since the three aspects are analysed separately. On the other hand, LCSA (analysis) avoids this problem by offering an integrated framework, but this approach has been developed only as a conceptual framework and it is difficult to apply it to a specific context [17].
A proposal to combine LCC and LCA within the ship design process is provided in the next section. Even if the social equity problem is not considered at this stage, it could be easily added in the future to carry out full LCSA to assess performances of different ship designs. A LCSA (assessment) procedure has been employed and is discussed in the paper conclusion sections.
3.Key Performance Indicators (KPIs) and Ship Breakdown Structure (SBS)
In recent years, regulations are moving towards a performance based design approach i.e. it is no longer necessary to comply with prescriptive rules, but rather certain measurable performance have to be met. In this scenario, Key Performance Indicators are the measures used to assess the quality of the design.
An advantage of using KPIs in ship design is the ability to easily compare different vessel configurations to select the best alternative. KPIs can be used in all fields of the ship project to evaluate performances of different systems and aspects of the vessel. Different KPIs can be formulated in relation with safety, economic, environmental aspects and they can be customized in relation with ship typology under investigation.
KPIs can be also used to assess the life cycle performance of a ship, with a particular attention towards both economic and environmental aspects. As a result, two families of KPIs have been proposed. It is important to highlight that this list can be adapted and updated according to the particular needs and general boundaries. These KPIs are the result of a literature review, aimed to select the parameters which have been considered as significant for a life cycle analysis. Main sectors of the transport industry have also been investigated, focussing on similarities with the shipping industry.
Economic KPIs:
– Net Present Value (NPV): The NPV is the most popular economic measure. It is an index on the profitability of an undertaking that is calculated by subtracting the present values (PV) of cash-outflows (including initial cost) from the present values of cash-inflows over a time. It can be calculated through the formulation:
Where:– i: Discount rate
– T: Life Time under investigation
–
–
– L: Cost of Disposal or Resale Value or Recycling [$]
– t: Current index of year.
However, despite its popularity, NPV can lead to faulty decisions unless used with caution. One weakness is due to NPV being dimensionally-dependant. Thus, NPV will always tend to favour large proposals even though smaller, more numerous proposals might well lead to greater cumulative NPVs, taken the supply of investment is limited. To correct this weakness, it is possible to simply divide each proposal by the investment, leading to the NPV Index (NPVI) [19]:
– Average Annual Cost (AAC): it is a significant parameter when dealing with ships not exploited for commercial use, for example naval vessels, yachts and pleasure craft. It useful also when comparing alternatives with equal income, and can be expressed as [19]:
In this formulation
If necessary, AAC can be related to vessel’s productivity (for cargo carrying vessels) by the Required Freight Rate (RFR):
Where ‘P’ the annual ‘productivity’ of the vessel (tons of cargo, number of passengers, number of TEU, etc.)
– Average Annual Benefits (AAB): It is used to correct a shortcoming of the NPV, which is not appropriate for comparisons between long and short-term investments. To better frame the situation, the NPV can be converted to a uniform annual income stream of equivalent value. This uniform amount is called the AAB:
With the AAB Index [19], it is possible to overcome the NPV’s two weaknesses simultaneously, just by dividing the AAB by the investment to obtain the average annual benefit per dollar investment:
– Operating Expenditure (OPEX): The operating expense results from the ongoing costs a ship owner pays to run its basic business. Main elements of OPEX for a ship are [20]:
Operating cost (i.e. Crew wages, management,
Voyage cost (i.e. Fuel, port duties and fees,
Cargo handling cost
Insurance cost
Maintenance and Repair cost
– Maintenance and Repair costs (M&R costs): They are a part of OPEX, but they can be used independently to assess costs related to maintenance of systems (especially machinery) and structure.
– Earnings Before Interests, Taxes, Depreciation and Amortization (EBITDA): it is an accounting measure calculated using a company’s net earnings, prior to interest expenses, taxes, depreciation and amortization are subtracted, as a proxy for the company’s current operating profitability.
– Return on Investment Capital (ROIC): It is a ratio used in finance, valuation and accounting, as a measure of the profitability and value-creating potential of companies after taking into account the amount of initial capital invested.
It is worth mentioning that the ROIC as above defined is applicable only for commercial shipping and not suitable for naval ships.
– Capital Expenditure (CAPEX): Capital expenditures are the funds that a ship owner uses to purchase a vessel from a shipyard to generate a potential profit. However, it is easier to estimate costs from a shipyard-perspective with parametric or bottom-up estimation. Then, the price for the ship-owner depends on the present market-trend when the contract is placed which is in a certain way uncorrelated to the production cost (BLD cost).
– Building Cost (BLD): It is the cost sustained by the shipyard to build the vessel. Effective cost estimation can be especially difficult in the early phases of a project where only limited information regarding the construction cost is available. The shipyard has a very limited time to come up with a bid to respond to a request for tender. In most cases, new building contracts are signed before the detailed design is completed. This is the reason why the shipyard experience on this kind of estimations is of critical importance [18].
Environmental KPIs:
– Energy Efficiency Design Index (EEDI): The EEDI index is representative of the energy efficiency of a ship when comparing the CO2 generated with reference to the goods transportation service (grams or tonne per mile cargo carried). It is calculated for a specific reference ship’s operational condition. IMO will be able to drive ship technologies for a more energy-efficient worldwide fleet, by imposing limits on this index. Overtime, the required EEDI level will be reduced to gradually leading the process [12]:
– NOx and SOx emissions (during operation): the grams of NOx/SOx generated per unit of transport work are identified by these parameters and the acceptable levels are regulated by MARPOL Annex VI. From the design and operational point of view, it is interesting to point out that NOx emissions depend in particular on engines installed on board, while SOx emissions are related to the type of fuel used to produce energy.
– Cumulated Energy Demand (CED): This parameter is able to represent the necessary energy to produce the ship (materials and yard production) together with the energy for ship operation when burning fuel in primary energy converters; the energy used to produce these fuels and provide them at the ship’s bunker station (well to tank) is included as well.
– Particulate matter (PM) (during operation): Particulate matter (PM) is a reference parameter when assessing environmental impact also for IMO, because black carbon (as part of the composition of PM) has a health impact on urban areas but also may have an impact in general on the global environment.
These environmental KPIs (EEDI, NOx, SOx, CED, PM) are divided by the transport flow, in a similar manner to EEDI, in order to compare ship configurations with vessel of different sizes. In this way, KPIs do not depend on the size of the ship. This is necessary in order to carry out consistent comparisons since it would not be reasonable to compare environmental performances of ships with different capacities and it would not be acceptable to conclude that the better environmental performance would be not to transport anything at all.
It is worth noting that, to implement a more comprehensive environmental impact assessment of the ship, due attention should be paid also to other aspect beside air emissions [1,7,9], relevant to water and land.
In order to evaluate KPIs when designing a new vessel, relations between KPIs and the main technical characteristics of the ship need to be developed. In this way, different configurations of systems and ship operational profiles can be analysed. To do this, a Ship Breakdown Structure (SBS) should be created, enabling a different formulation and relevant level of accuracy depending on the stage of the design process. This is a typical example of parametric/top-down approach, as described by Shetelig [18].
To recap, Table 1 provides a list of the selected KPIs for a life cycle analysis.
Table 1
KPIs for life cycle analysis
| Economic KPIs | Environmental KPIs |
| NPV (NPV Index) | |
| AAB (AAB Index) | |
| AAC | EEDI |
| RFR | NOx |
| OPEX | SOx |
| M&R costs | CED |
| CAPEX | PM |
| BLD | |
| EBITDA | |
| ROIC |
After identifying the list of KPIs, it is necessary to understand how to evaluate them in an early design phase. In this stage of the design, the domain of design configurations is still very wide and precise details of the ship cannot be known. Moreover, by adopting a holistic and integrated approach to ship design, many different ship configurations could be analysed in this phase.
In this scenario, KPIs can be calculated using reference parameters, which have a strong and direct influence on KPIs. These parameters can be identified once a Ship Breakdown Structures (SBS) has been developed.
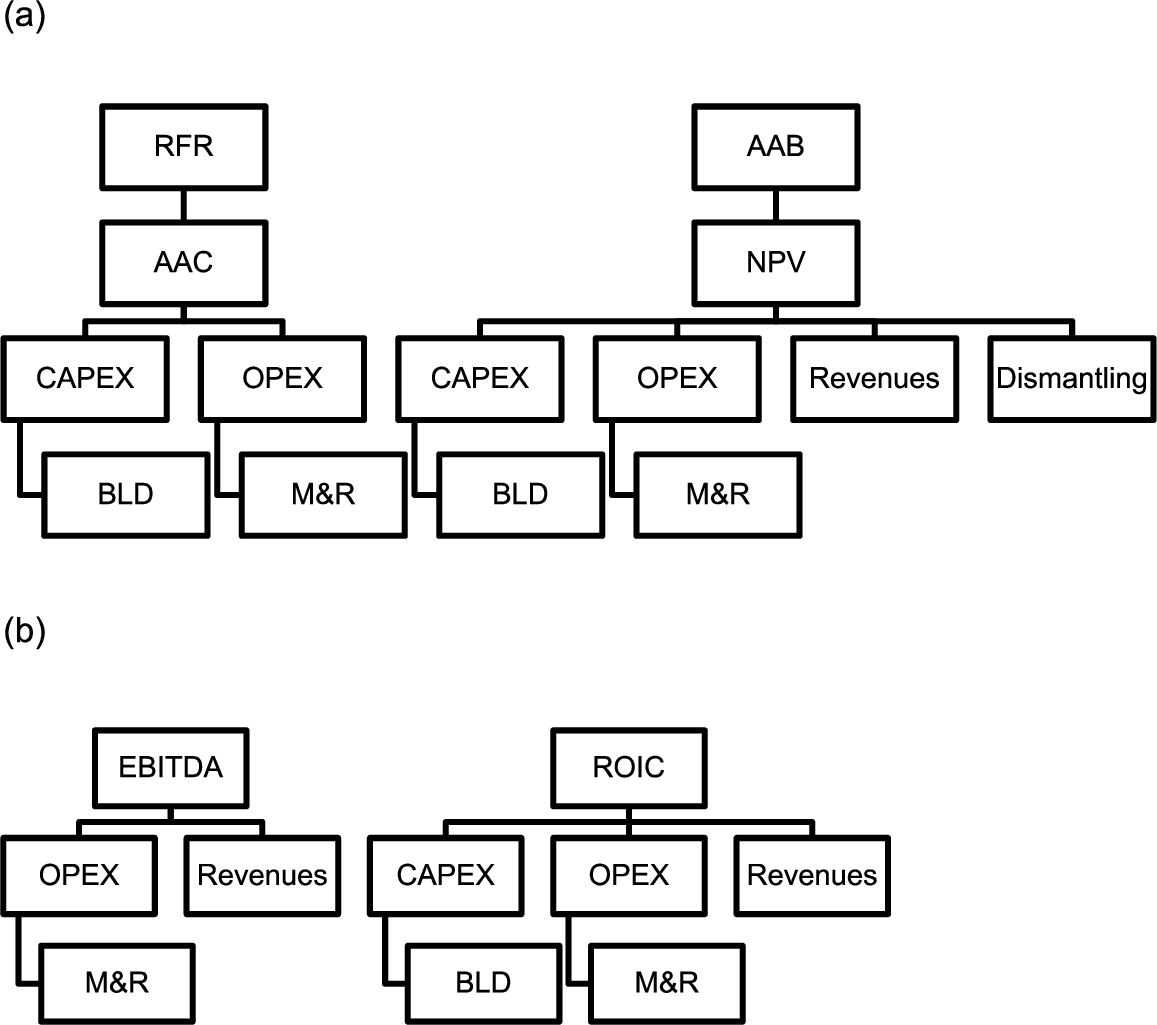
First, relations between economic KPIs have been studied in order to understand input and outputs for each KPI. From this analysis, Building Cost (BLD) and Operational Expenditures (OPEX) are recognized to be the critical parameters, together with Revenues and Dismantling/Recycling expenditures/incomes (Fig. 1). After calculating them, the evaluation of other economic parameters can be done with few additional data and calculations.
Fig. 1.
Economic KPIs relationship.
Obviously, some KPIs are preferable for some types of ships, while others might not be appropriate. For example, it is not reasonable to evaluate the Average Annual Benefits (AAB) for a coast guard vessel, since it does not produce any direct economic income. In this case, it could be useful to evaluate the Average Annual Costs (AAC).
For environmental KPIs, these mainly depend on the amount and type of fuel used and energy configurations adopted, therefore a detailed study of them is not necessary to find any link with other ship technical parameters.
The SBS developed for LCC purposes is shown in Appendix A. From Table A.1, it is possible to select and define a list of parameters required to predict costs of different designs. The SBS has been organized on three different level; the higher the level, the more accurate is the analysis and classification of that KPI. Depending on the desired level of detail, the amount of data required to perform the calculation changes significantly. For each item of the SBS, Cost Estimating Relationships (CERs) can be created to link the technical parameters of the ship with the calculation of a KPI. The procedure developed is imagined for a preliminary ship design stage, when different vessel configurations are analysed and compared.
Each cost and emission modeled is then assigned to one of the three phases of a ship life cycle:
Phase 1: Design and Construction
Phase 2: Ship operation
Phase 3: Disposal/Recycling
After these steps, economic and environmental KPIs of a ship design configuration are defined for the whole life cycle.
4.LCPA definition and discussion
As already mentioned, the traditional approach is to provide separate assessments of cost and environmental impact. In the present activity, this traditional attitude can be followed as well but an attempt is also carried out in order to formulate a merged Index able to integrate costs and environmental impact in a single value.
Every time several kinds of assessment are considered together, some critical issues emerge. Among them there are some main issues raised during the hypothesis of different calculation procedures.
First of all, it is necessary to compare numerically KPIs with different units of measure and magnitudes. For this reason, non-dimensional coefficients could be introduced, so that KPIs could be better compared and ranked.
Another issue regards the range assumed by KPIs’ coefficients. It is important that coefficients have a similar range and moreover they assume a comparable internal variation for each KPI considered. Attention to both absolute and relative values is necessary for a reliable analysis. The weight of different KPIs in the decision process can be expressed after the proper selection of the KPIs sub-domain, deemed as specifically useful for the assessment.
Finally, some KPIs, in particular environmental ones, could have an acceptance threshold given by rules. In this case, the calculation process has to consider these limitations.
Depending on the parameter taken into account, coefficients can be defined as follows. This procedure has been developed to compare alternative design configurations for the same set of requirements and not to assess economic and environmental performances of a single vessel.
Earnings parameters (such as NPV, AAB)
These reach their optimum when the parameter reaches its higher value; therefore, it is possible to rank them comparing their maxima; a non-dimensional coefficient for the ith scenario can be evaluated as:
The coefficient is always defined between zero and one, even if some or all solutions are negative (loss of capital). There is always a solution with coefficient equal to zero and another one with coefficient equal to one.
Cost parameters (such as CAPEX, OPEX):
These reach their optimum when the parameter reaches the minimum, value; therefore, it is possible to rank them comparing their minima; a non-dimensional coefficient for the ith scenario can be evaluated as:
Again, the coefficient is always defined between zero and one. There is always a solution with coefficient equal to zero (worst) and another one with coefficient equal to one (best).
Environmental parameters (such as CED)
These can be treated in a similar manner to costs, since the optimum solution is the minimum one:
Environmental parameters (such as EEDI) could have maximum limits given by regulations. In this case, solutions with
Defining coefficients in this way, it is not possible to calculate some of them when there is only one solution (i.e.
In order to keep track of economic and environmental performances, two different coefficients (LCC Index and LCA Index) can be calculated before merging them in a LCPA Index. In this way, during the merges, relative weights of Indexes can vary according to the designer’s point of view. This can be formulated as follows:
Finally, a global LCPA Index is calculated:
The great advantage of this approach is that it is not affected by the selected KPIs used to assess and compare ship designs. In fact, other parameters could be defined and used to study different design alternatives, but the structure of the combined analyses would be the same. Moreover, the evaluation of safety performances could be added by evaluating a separated index in a similar manner to as for LCC and LCA. In this scenario, the social equity problem could be handled from a safety perspective, evaluating through key performance indicators the level of safety of different designs. This could allow a holistic comparison of alternative ship configurations, improving the overall quality of the design process, in the direction of a Life Cycle Sustainability Assessment.
Another advantage of this method is the possibility of different weights given to KPIs in the decision-making process, as well as of different influence of LCC or LCA in the final assessment, according to the desire of ship owners and shipyards. On the other hand, freedom to assign weightings at all stage of the process has a strong influence on the final results obtained. Increasing the influence of a KPI could mean that a design has a better performance, however this might not be true with other weights assigned. Therefore, before implementing this approach in a formal assessment, some restrictions to weights should be defined.
The above described approach has been implemented and applied to a Ro-Ro passenger ship in order to verify and validate the LCPA tool structure and its reliability.
Thanks to Appendix A, a roadmap is available to formulate relations between costs (KPIs) and ship components and systems. The specific formulation is likely to be a parametric expression, properly tuned in relation with the database that the stakeholder has at their disposal. This kind of information is very delicate and very much case/company/country/commercial context sensitive, therefore not easily eligible to be expressed to a general level of knowledge.
The ship characteristics of the investigated case are summarized in Table 2.
Table 2
Ro-Ro main characteristics
| Ro-Ro Passenger ship | |
| Length (m) | 180 |
| Breadth (m) | 27 |
| Draft (m) | 7.8 |
| Speed (kn) | 28 |
| Passengers | 2000 |
| Cabins | 150 |
| Garage lanes (m) | 2000 |
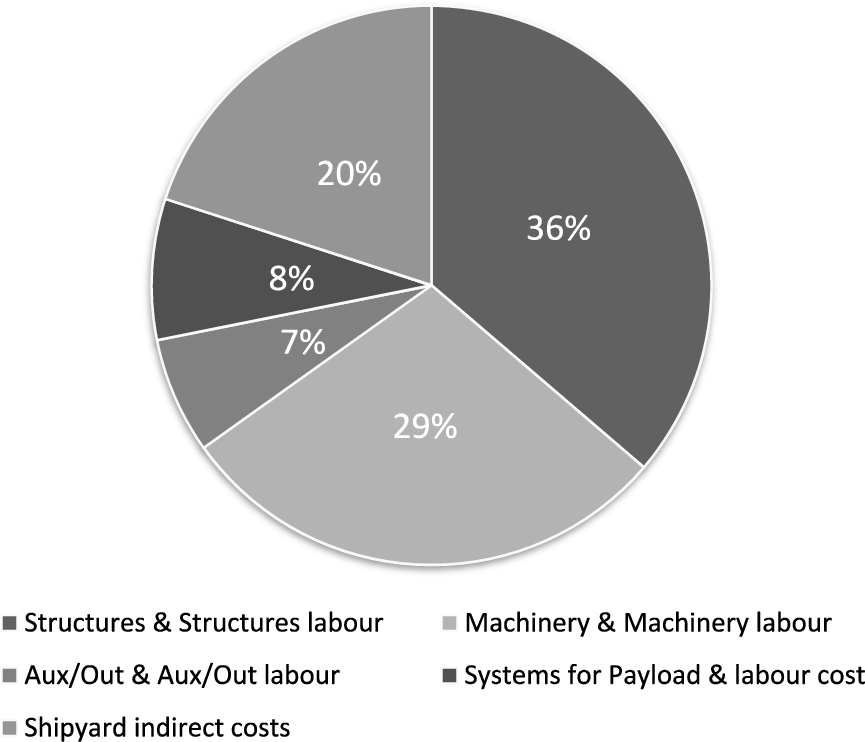
By means of the ship breakdown structure (Appendix A) the CAPEX value has been calculated and results in terms of distribution among relevant main selected CAPEX sub-components are reported in Fig. 2.
Fig. 2.
Distribution among main CAPEX sub-components.
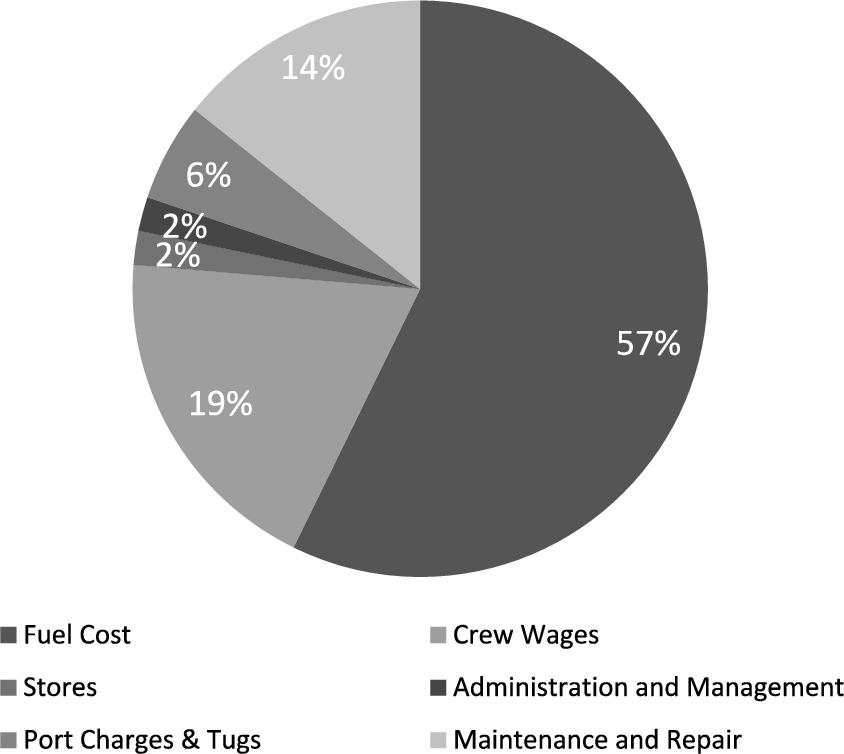
In Fig. 3 a distribution of some selected OPEX main sub-components (3rd level – Appendix A) is reported for a specific investigated profile.
Fig. 3.
Distribution among selected OPEX sub-components.
The application exercise in this particular case consisted of the investigation of the OPEX value variations in relation with different operational profiles identified in terms of route length, speed, fuel, daily frequency.
During the investigations, all considered OPEX cost values are kept constant but the fuel cost is calculated for each of the different configurations.
Among the different routes considered for the study, the performances for the Genoa–Olbia route are reported here as an example, for different speeds (i.e. 21 and 25 knots) and fuels (i.e. MDO and HFO).
The selected KPIs and related weights for the comparison are reported in Table 3.
Table 3
Selected KPIs and relevant weights for the application exercise
| KPI | Weight | Total |
| OPEX | 1/3 | 1 (LCC Index) |
| AAB | 1/3 | |
| EBITDA | 1/3 | |
| EEDI | 0.5 | 1 (LCA Index) |
| SOx | 0.25 | |
| NOx | 0.25 | |
| LCC | 0.5 | 1 (LCPA Index) |
| LCA | 0.5 |
It is beneficial to represent on a spider graph the KPIs values for each investigated configuration (Fig. 4).
Fig. 4.
Spider graph with selected KPIs and related ship performances.
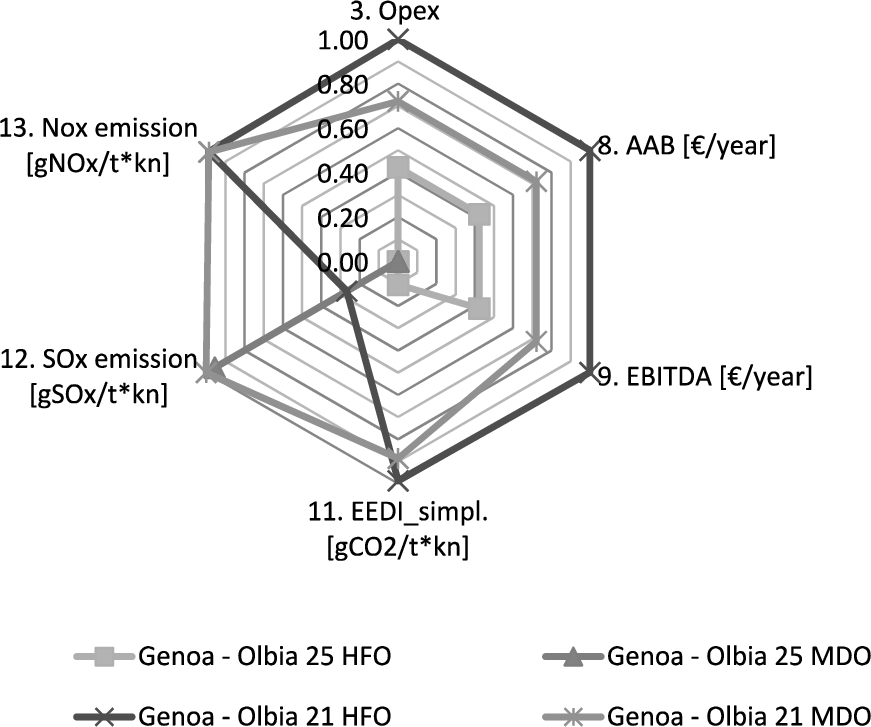
Finally it is possible to appreciate the comparison among different configurations by means of LCC and LCA indexes further combined in the overall LCPA index (Table 4), as a result also of the selected weights as explained in Section 5.
Table 4
LCC, LCA and LCPA values for the different configurations
| Index | Genoa–Olbia 21 kn, HFO | Genoa–Olbia 25 kn, HFO | Genoa–Olbia 21 kn, MDO | Genoa–Olbia 25 kn, MDO |
| LCC | 1.00 | 0.35 | 0.84 | 0.00 |
| LCA | 0.62 | 0.14 | 0.95 | 0.75 |
| LCPA | 0.86 | 0.25 | 0.89 | 0.38 |
In the future a wider application is planned to several ship typologies in order to point out further interesting outcomes to share with the scientific community relevant to the real tool versatility when applied in a very varied domain.
5.Conclusions
In recent years, major governments are trying to achieve the target of sustainable development. Therefore, life cycle analyses of different aspects relevant to ships have to be applied when designing a newbuilding. This implies new and more intense form of collaboration among stakeholders and in particular between the shipbuilder and operators, with the common aim of reducing for example emissions and increasing the profitability over the life cycle of the vessel.
Moreover, in today’s regulation context, the push towards performance based assessment leads the way to the use of KPIs for the assessment of environmental and economic performance for both LCA and LCC respectively. A comprehensive selection of KPIs has been defined in this paper based on a literature review, which has been performed analysing shipping and other transport sectors. A Ship Breakdown Structure has also been presented to be followed as a possible roadmap when looking for practical link between KPIs and ship components and technical parameters. The realistic implementation of such links is usually carried out by means of parametric expressions, properly tuned in relation with database typically market sensitive and confidential. To this regard it is assumed as appropriate that each stakeholder develops in-house formulations in relation with the specific ship case, company profile, country policies, commercial context and any other relevant boundary condition that characterizes the investigation. Therefore this paper is not much focused on this issue but on the general approach for a life cycle assessment in the perspective of sustainable ship design. In fact an approach to evaluate and compare ship designs comprehensively has been proposed, through the calculation of a Life Cycle Performance Assessment Index (LCPA Index). This Index has been calculated as a linear combination of sub-indexes previously evaluated with regard to economic and environmental aspects (LCC Index and LCA Index respectively) through KPIs calculation. The selection of KPIs can be adapted according to the requirements of designers and operators and it is totally arbitrary.
A tool has been implemented based on what above described and it has been applied to a Ro-Ro passenger ship in order to verify and validate the LCPA tool structure and its reliability. For the investigated ship, the CAPEX value has been calculated and presented in terms of main sub-components percentages. In particular the attention has been focussed on the OPEX value variations in relation with different operational profiles identified in terms of route length, speed, fuel, daily frequency. An example of possible weight values for selected KPIs is presented as well.
In principle this approach allows for integration of other aspects of design (such as safety issues), through the calculation of other sub-indexes, which can also be accounted for when calculating the LCPA Index. The final aim of the proposed approach would be the creation of a Life Cycle Sustainability Assessment (LCSA) adapted for the shipping sector.
The approach is also suitable to be applied in a trade-off analysis in relation with uncertainties about variables and general boundary conditions of the problem, like market oil prices.
In addition to KPIs identification and combination, one great challenge to the integrated approach is the availability and selection of appropriate data, required to implement such KPIs. Given the Big Data era, with future improvements in data availability and management, this issue may well be overcome, even though the implied confidentiality might remain an important critical point. The definition of weights in indexes relations (which can be arbitrary chosen at the moment) can be further improved by testing this approach with different designs. Future works will be performed to apply and validate this approach.
This kind of tool/approach, properly further developed, is likely to gain more and more relevance in the future in a foreseen circular economy perspective, where the use of resources for the longest time possible is encouraged, together with the extraction of the maximum value from them and the re-circulation of products/materials at the end of service life.
Nomenclature
NPV (NPV Index) | Net Present Value |
AAB (AAB Index) | Average Annual Benefits |
AAC | Average Annual Cost |
RFR | Required Freight Rate |
OPEX | Operating Expenditure |
M&R costs | Maintenance and Repair costs |
CAPEX | Capital Expenditure |
BLD | Building Cost |
EBITDA | Earnings Before Interests, Taxes, Depreciation and Amortization |
ROIC | Return on Investment Capital |
EEDI | Energy Efficiency Design Index |
NOx | Nitrogen Oxides |
SOx | Sulphur Oxides |
CED | Cumulated Energy Demand |
PM | Particulate matter |
Acknowledgements
The reported research is still under development in the frame of the HOLISHIP (HOLIstic optimisation of SHIP design and operation for life cycle) project (2016-2020), which has been funded by the European Commission in the HORIZON 2020 Transport Programme.
Appendices
Appendix A.
Appendix A.Ship breakdown structure
Table A.1
Ship breakdown structure for costs prediction where three different detail levels can be selected
| 1st level | 2nd level | 3rd level |
| 1 – BUILDING COST | 1.1a Structure cost 1.1b Structure labour cost | 1.1.1 Hull |
| 1.1.2 Superstructures | ||
| 1.2a Machinery cost 1.2b Machinery labour cost | 1.2.1 Main Engine/s | |
| 1.2.2 Electricity Generators | ||
| 1.2.3 Power Transmission | ||
| 1.2.4 Propeller/s | ||
| 1.2.5 Steering system | ||
| 1.2.6 Boilers/Heat recovery systems | ||
| 1.2.7 Maneuvering system | ||
| 1.3a Auxiliaries and Outfitting cost 1.3b Auxiliaries and Outfittinglabour cost | 1.3.1 Electricity distribution | |
| 1.3.2 Engine aux. systems | ||
| 1.3.3 Firefighting – Safety systems | ||
| 1.3.4 Anchoring | ||
| 1.3.5 Bildge and Ballast systems | ||
| 1.3.6 Oufitting | ||
| 1.3.7 Painting and coatings | ||
| 1.4a Systems for Payload cost 1.4b Payload labour cost | Depend on the type of ship | |
| (Considered separately) | 1.5 Shipyard indirect costs | 1.5.1 Design effort |
| 1.5.2 Shipyard operational costs |
| 1st level | 2nd level | 3rd level |
| 2 – CAPEX | 2.1 (1.) Building Cost 2.2 Market relation cost-price |
Table A.1
(Continued)
| 1st level | 2nd level | 3rd level |
| 3 – OPEX | 3.1 Operating costs | 3.1.1 Crew number |
| 3.1.2 Crew wages | ||
| 3.1.3 Stores | ||
| 3.1.4 Lubricants | ||
| 3.1.5 Administration and Management | ||
| 3.2 Voyage costs | 3.2.1 Fuel Consumption | |
| 3.2.2 Fuel Price | ||
| 3.2.3 Port Charges | ||
| 3.2.4 Canal dues | ||
| 3.2.5 Tugs | ||
| 3.3 Costs related to Payload | 3.3.1 Cargo type | |
| 3.3.2 Cargo handling gear | ||
| 3.4 Capital | 3.4.1 Size of loan | |
| 3.4.2 Length of loan | ||
| 3.4.3 Interests | ||
| 3.5 (4.) Maintenance and Repair | See 4. M&R | |
| 3.6 Insurance | 3.6.1 Hull & Machinery and war risks | |
| 3.6.2 P&I |
| 2nd level | 3rd level | 4th level |
| 4 – Maintenance and Repair | 3.5.1 Operational Maintenance | 3.5.1.1 Maintenance policy |
| 3.5.1.2 Machinery density | ||
| 3.5.1.3 Main Engine MCR | ||
| 3.5.1.4 Ship dimensions (L, B, D) | ||
| 3.5.2 Scheduled Dry dock |
| 1st level | 2nd level | 3rd level |
| 5 – Average Annual Cost (AAC) | 5.1 (2.) CAPEX | |
| 5.2 Lifetime | ||
| 5.3 Discount rate | ||
| 5.4 (3.) OPEX |
| 1st level | 2nd level | 3rd level |
| 6 – Required Freight Rate (RFR) | 6.1 (5.) AAC | |
| 6.2 Productivity (cargo per year) | 6.2.1 Operational Profiles | |
| 6.2.2 Payload |
Table A.1
(Continued)
| 1st level | 2nd level | 3rd level |
| 7 – NPV | 7.1 (2.) CAPEX | |
| 7.2 (5.2) Lifetime | ||
| 7.3 (7.3) Discount rate | ||
| 7.4 (3.) OPEX | ||
| 7.5 Cost/Revenues of disposal/recycling | ||
| 7.6 Revenues | 7.6.1 Cargo Capacity/Cost of service | |
| 7.6.2 Productivity | ||
| 7.6.3 Freight rate |
| 1st level | 2nd level | 3rd level |
| 8 – AAB | 8.1 (7.) NPV |
| 1st level | 2nd level | 3rd level |
| 9 – EBITDA | 9.1 (7.6) Revenues | |
| 9.2 (3.) OPEX |
| 1st level | 2nd level | 3rd level |
| 10 – ROIC | 10.1 (7.6) Revenues | |
| 10.2 (2.) CAPEX | ||
| 10.3 (3.) OPEX |
References
[1] | K. Andersson, F. Baldi, S. Brynolf, J.F. Lindgren, L. Granhag and E. Svensson, Shipping and the Environment – Improving Environmental Performance in Marine Transportation Ch. 1, Springer, (2016) . |
[2] | S.L. Andrade, T.G. Monteiro and H.M. Gaspar, Product life-cycle management in ship design: From concept to decommission in a virtual environment, MSc thesis from NTNU Aalesund, 2016. |
[3] | E. Bernier, F. Maréchal and R. Samson, Life Cycle Optimization of Energy-Intensive Processes Using Eco-Costs, Int J Life Cycle Assess., Springer, Berlin, (2013) . doi:10.1007/s11367-013-0560-x. |
[4] | S. Chatzinikolaou and N.P. Ventikos, in: Applications of Life Cycle Assessment in Shipping, Conference INT-NAM 2014, Istanbul Turkey, (2014) . |
[5] | A. Ciroth, Cost data quality considerations for eco-efficiency measures, in: Ecol Econ, Vol. 68: , Elsevier, Amsterdam, (2009) , pp. 1583–1590. |
[6] | Davis Langdon Management Consulting, Literature review of life cycle costing (LCC) and life cycle assessment (LCA), London, UK, 2016. |
[7] | A.M. Fet, Sustaibility reportind in shipping, Journal of Marine Design and Operations B 5: ((2003) ), 11–24. |
[8] | A.M. Fet, D.M. Aspen and H. Ellingsen, Systems Engineering as Holistic Approach to Life Cycle Designs. 2013, Elsevier, Ocean Engineering, Amsterdam, (2013) . |
[9] | H.M. Gaspar and O. Balland, Approaching environmental performance in conceptual ship design, in: Practical Design of Ships and Other Floating Structures, PRADS 2010, (2010) , Rio de Janeiro. |
[10] | H.M. Gaspar, O. Balland, D.M. Aspen, A. Ross and S.O. Erikstad, Assessing air emissions for uncertain life-cycle scenarios via responsive systems comparison method, Journal of Engineering for the Maritime Environment (Part M) ((2015) ). |
[11] | R. Hoogmartens et al., Bridging the gap between LCA, LCC and CBA as sustainability assessment tools, in: Environmental Impact Assessment Review, Vol. 48: , Elsevier, Amsterdam, (2014) , pp. 27–33. |
[12] | IMO (International Maritime Organization) Resolution MEPC.212(63) – Guidelines on the method of calculation of the attained energy efficiency index (EEDI) for new ships, London, UK, 2012. |
[13] | ISO (International Standards Organization), International Standard ISO 15686-5: Buildings and constructed assets – Service-life planning – Life cycle costing, Geneva, CH, 2006. |
[14] | ISO (International Standards Organization), International Standard ISO 14040: Environmental Management – Life Cycle Assessment – Requirements and Guidelines, Geneva, CH, 2008. |
[15] | D. Jasinski et al., A comprehensive review of full cost accounting methods and their applicability to the automotive industry, Journal of Cleaner Production 108: (A) ((2015) ), 1123–1139. doi:10.1016/j.jclepro.2015.06.040. |
[16] | W. Klöpffer, Life cycle sustainability assessment of products, Int J Life Cycle Assess 13: (2) ((2008) ), 89–94. Springer, Berlin. |
[17] | S. Sala, F. Farioli and A. Zamagni, Life Cycle Sustainability Assessment in the Context of Sustainability Science Progress, Part II, Int J Life Cycle Assess 18: (9) ((2012) ), 1686–1697. Springer, Berlin. doi:10.1007/s11367-012-0509-5. |
[18] | H. Shetelig, Shipbuilding Cost Estimation. Master Thesis, University of Trondheim, Norway, 2013. |
[19] | SNAME, Ship Design and Construction, T. Lamb, ed., Vol. 1: , Chapter 6. Jersey City, USA, (2003) . |
[20] | M. Stopford, Maritime Economics, 3rd edn, Routledge, Abingdon on Thames, UK, (2003) . |
[21] | T.E. Swarr, Environmental Life-Cycle Costing: A Code of Practice, Int J Life Cycle Assess 16: ((2011) ), 389–391. Springer, Berlin. |
[22] | H. Winnes and A. Ulfvarson, Environmental improvements in ship design by the use of scoring functions, Journal of Engineering for the Maritime Environment (2006). |


