
A traffic flow forecasting method based on the GA-SVR
Abstract
This paper uses support vector regression (SVR) to predict short-term traffic flow, and studies the feasibility of SVR in short-term traffic flow prediction. The short-time traffic flow has many influencing factors, which are characterized by nonlinearity, randomness and periodicity. Therefore, SVR algorithm has advantages in dealing with such problems. In order to improve the prediction accuracy of the SVR, this paper uses genetic algorithm (GA) to optimize the SVR and other parameters to obtain the global optimal solution. The optimal parameters are used to construct the SVR prediction model. This paper selects the traffic flow data of the Jiangxi Provincial Transportation Department database to verify the feasibility and effectiveness of the proposed model.
1.Introduction
With the increasing number of cars, the problem of traffic congestion is becoming more and more serious. Traffic congestion not only delays people’s travel, but also reduces the efficiency of economic development and wastes many resources [17]. In order to solve the problem of traffic congestion, Intelligent Transport System (ITS) has gradually attracted more and more people’s attention, and traffic flow prediction is the core function of ITS [8]. Traffic flow prediction is an important bridge to build intelligent traffic system, and also an important basis for traffic management departments to effectively manage traffic congestion and other problems [18].
At present, traffic flow prediction methods are mainly divided into two categories: mathematical statistics method and intelligent prediction method [3]. The statistical theoretical models used by many scholars mainly include Historical Average Model, Kalman Filter model and Autoregressive Integrated Moving Average model (ARIMA) [10]. Due to the non-linear and stochastic characteristics of traffic flow, the mathematical statistics method is only applicable to the prediction of a single object point, and the prediction accuracy cannot meet the actual needs [2]. In order to better capture the characteristics of traffic flow data, some intelligent prediction methods are widely used in the short-term traffic flow prediction [12].
Based on the above research, the mathematical statistical prediction method rep-resented by regression analysis and time series cannot deal with the sudden and random situations of traffic flow prediction [5]. Although the artificial neural network has a strong nonlinear fitting characteristic, it is easy to fall into local optimization and output instability [9]. Different from artificial neural network, SVR can obtain the global optimal solution and map the nonlinear regression problem to the linear regression problem by applying kernel function [11]. GA is a global optimization search algorithm that borrows from natural selection and genetic theory in the process of biological evolution [13]. It has the characteristics of group search and intrinsic heuristic random search, and is not easy to fall into local optimization, so it is very suitable for large-scale parallel computing [6]. Based on this, GA and SVR are combined to give full play to the advantages of the two, the key parameters in the SVR model are obtained by using the characteristics of GA optimization, and then the traffic flow prediction model is established to obtain accurate results.
2.Prediction model construction
2.1.SVR
Support Vector Machine (SVM) itself is proposed for binary classification problems [14], and SVR is an important branch of SVM. When SVM is applied to regression fitting analysis, its basic idea is no longer to find an optimal classification surface to separate the two types of samples, but to find an optimal classification surface to minimize the error of all training samples from the optimal classification surface [16].
SVR models are used to model large-scale nonlinear data in high dimensional space. Given the training set
Among them, the
Generally, the radial basis function is selected as the kernel function, which is expressed as:
2.2.GA
GA is a randomized search method that borrows from the evolutionary law of biology (survival of the fittest, genetic mechanism of survival of the fittest). Professor J. Halolland first proposed it in 1975 in the United States [1]. GA have been widely used in combinatorial optimization, machine learning, signal processing, adaptive control and artificial life [7]. Only the fittest chromosomes in the population have the chance to interact (reproduce or mate) and create a second population. The mating process uses three different techniques:
Cloning: a parent chromosome is copied exactly to the next generation, 50% of the new population is generated by Cloning.
Crossover: two parents exchange a part of their chromosome at one or more randomly selected breakpoints to create two new children, 47% of the new population is generated by Crossover.
Creation: a completely new chromosome is generated randomly,
2.3.Optimization of SVR parameters by GA
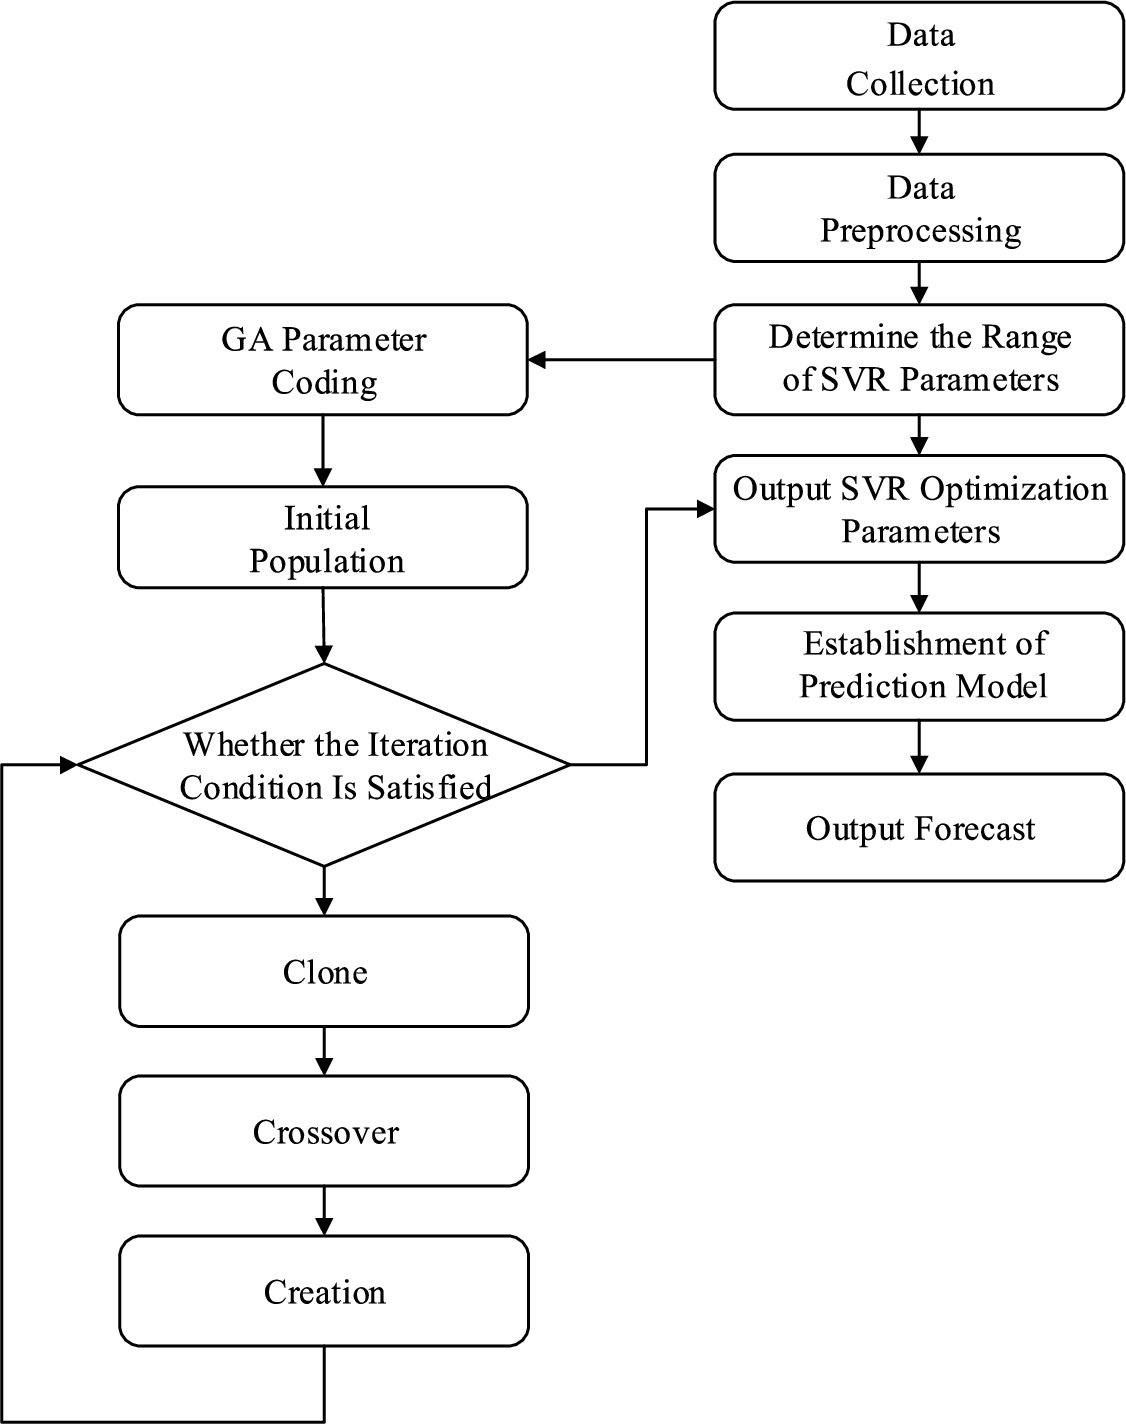
GA is a search heuristic algorithm for solving optimization problems [15]. With scalability as its main feature, this algorithm can be combined with other algorithms to form a high-quality hybrid algorithm combining the advantages of both sides [19]. Based on the defects of SVR prediction method itself, GA is used to carry out optimization, which can effectively optimize the threshold and weight under its initialization state, and can better carry out actual training and prediction for SVR [4]. The key parameter of RBF kernel function is ε, namely the width of the kernel, which controls the radial range of the function. The penalty parameter C plays a balancing role between mod-el complexity and training error. The larger the C value is, the greater the penalty for the data beyond the loss function is, which affects the generalization ability of the model. The embedded dimension E and time delay τ determine the quality of the samples, so it has a great impact on the accuracy of the prediction model. At present, there is no definite theory to guide the parameter selection of regression machine. The basic idea of genetic algorithm for SVR parameter optimization is to introduce the principle of biological evolution into the coding serial population formed by the optimization parameter (C, σ, E, τ). Iterate the individuals through the Cloning, Crossover and Creation in the inheritance according to the selected fitness function until the termination condition is satisfied, to achieve the purpose of intelligent optimization. The realization process of SVR prediction model optimization by genetic algorithm is as follows:
(1) Define the necessary data. Including training data set, appropriate features, the number of SVR input and output, the size of GA population, termination conditions and GA parameter (population size, crossover probability, mutation probability, etc.) settings.
(2) Standardized traffic data. Select 90% of the traffic data as the training data set, and the remaining 20% of the traffic data as the test data set.
(3) Set GA parameters and encode SVR parameters. Chromosomes are expressed in the form of
(4) Calculate the fitness of each individual. At the same time, appropriate criteria need to be introduced to rank the individuals in the population. In this paper, Mean Absolute Percentage Error (MAPE) is selected as the fitness function:
(5) Determine whether the iteration conditions are met. If not satisfied, clone, crossover and creation operations are performed. The clone operation uses the roulette method to screen the population with a high fitness value into the next generation. The fitness value of the individual
The crossover operation uses a linear combination to crossover two chromosomes with a certain probability
(6) The fitness value of each generation was calculated, the survival of the fittest was eliminated, and the offspring were obtained through cloning, crossover and creation after determining the parent individuals. The optimal individual was selected from the sub generation and the optimal combination of four parameters (C, σ, E, τ) was determined after decoding.
(7) Construct the SVR prediction model and substitute the parameters obtained by genetic algorithm optimization into the SVR prediction model for simulation prediction.
The specific flow chart is shown in Fig. 1.
Fig. 1.
GA-SVR traffic flow forecasting method flow chart.
3.Experiment and result analysis
3.1.Data sources
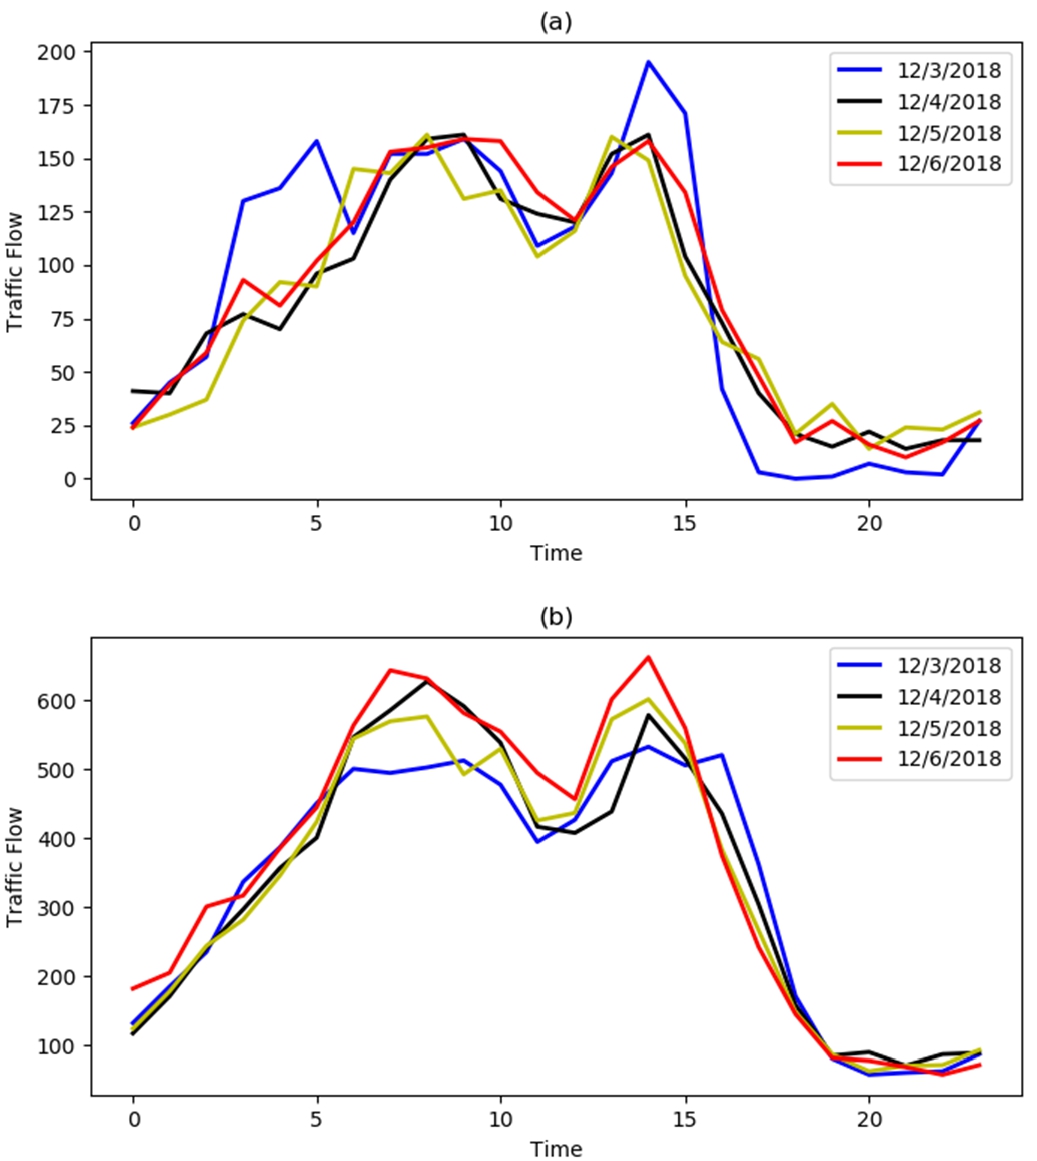
This article uses traffic flow data provided by the Jiangxi Provincial Transportation Department. As shown in Fig. 2, traffic flow data follows certain stability and regularity, so weekends and working days have different characteristics. In order to fully utilize the regularity of the collected data, the data used in this experiment does not include weekend Traffic flow. In this paper, the data of 50 consecutive working days on the S46 and G76 Expressways in Jiangxi Province are selected as experimental data, the data of the previous 40 working days are used as training data, and the data of the last 10 working days are used as test data.
Fig. 2.
Weekday traffic flow: (a) on S46 expressway; (b) on G76 expressway.
3.2.Error analysis and comparison
To better explain the prediction accuracy of this optimization model, this paper introduces three error evaluation indexes, namely Mean Absolute Error (MAE), Root Mean Square Error (RMSE) and MAPE, to evaluate the prediction effect of the prediction model. MAE, RMSE and MAPE are calculated as follows:
In these formulas,
3.3.Simulation analysis
In this paper, the GA-SVR was used as the prediction model. The parameters of the model are set as follows: the value range of the penalty factor is [0,100], the value range of the RBF kernel function parameter is [0,1000], and the value range of the embedding dimension is [11,17], the value range of time delay is [11,17]. The maximum evolutionary number of genetic algorithm is 100, the maximum number of population is 20, the crossover probability is 0.47, the creation probability is 0.03, and the cross-validation parameter is set to 5. The comparison between the predicted traffic flow result of this model and the real value of S46 Expressway on December 27, 2018 is shown in Fig. 3.
Fig. 3.
The fitting effect of GA-SVR model on training set.
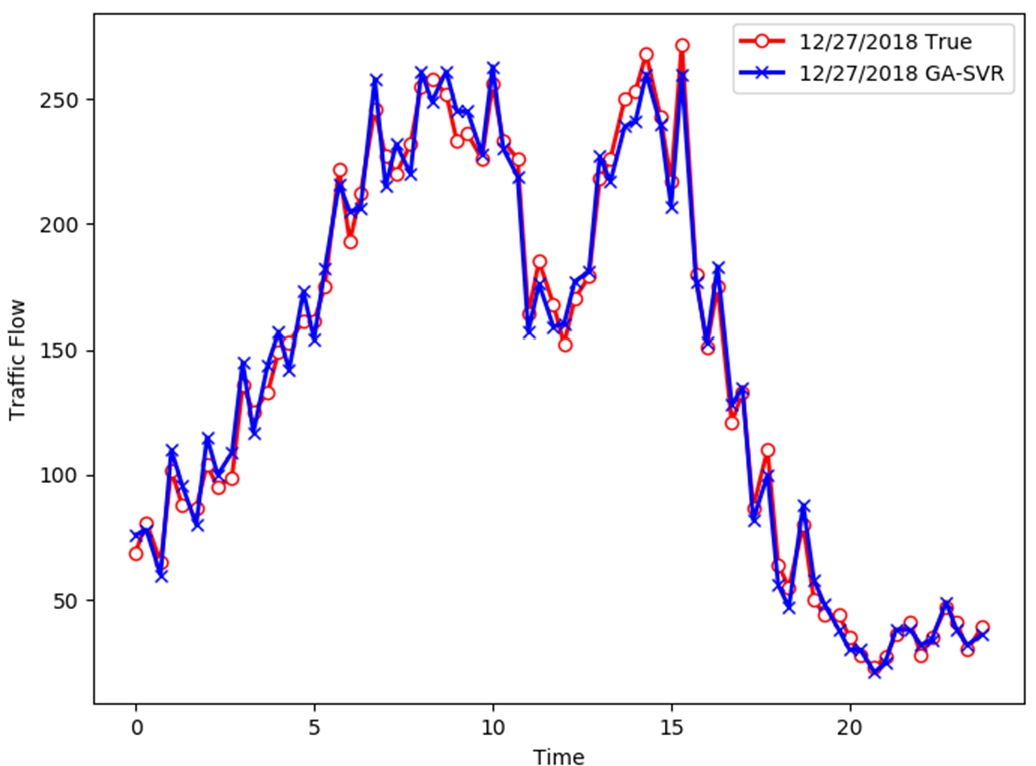
As can be seen from the figure, this model has a good fitting performance for the training set.
In order to verify the prediction performance of the model proposed in this paper and observe the prediction effect of the model more intuitively, the un-optimized SVR and three classical prediction models with good test performance model are selected as the benchmark comparison models. The three classical models are R-CNN, BP Neural Network and ARIMA. MAE, RMSE, and MAPE were used as evaluation indicators. Figure 4 shows the prediction results of this model and the un-optimized SVR model on S46 and G76 Expressways. Compared with the real value, although both models can reflect the variation trend of traffic flow, it is obvious that this model is closer to the real value, and the un-optimized SVR model has poor adaptability to the rapid change of traffic flow. Figure 5 shows the comparison of the predicted results between this model and the three classical models. As can be seen from the figure, the model proposed in this paper is the closest to the real value, and R-CNN and BP based on deep learning also perform well. However, when there are relatively large fluctuations in traffic flow data, R-CNN and BP are prone to fall into the local optimal, and ARIMA model performs the worst.
Fig. 4.
Comparison of model prediction results with SVR: (a) on S46 expressway; (a) on G76 expressway.
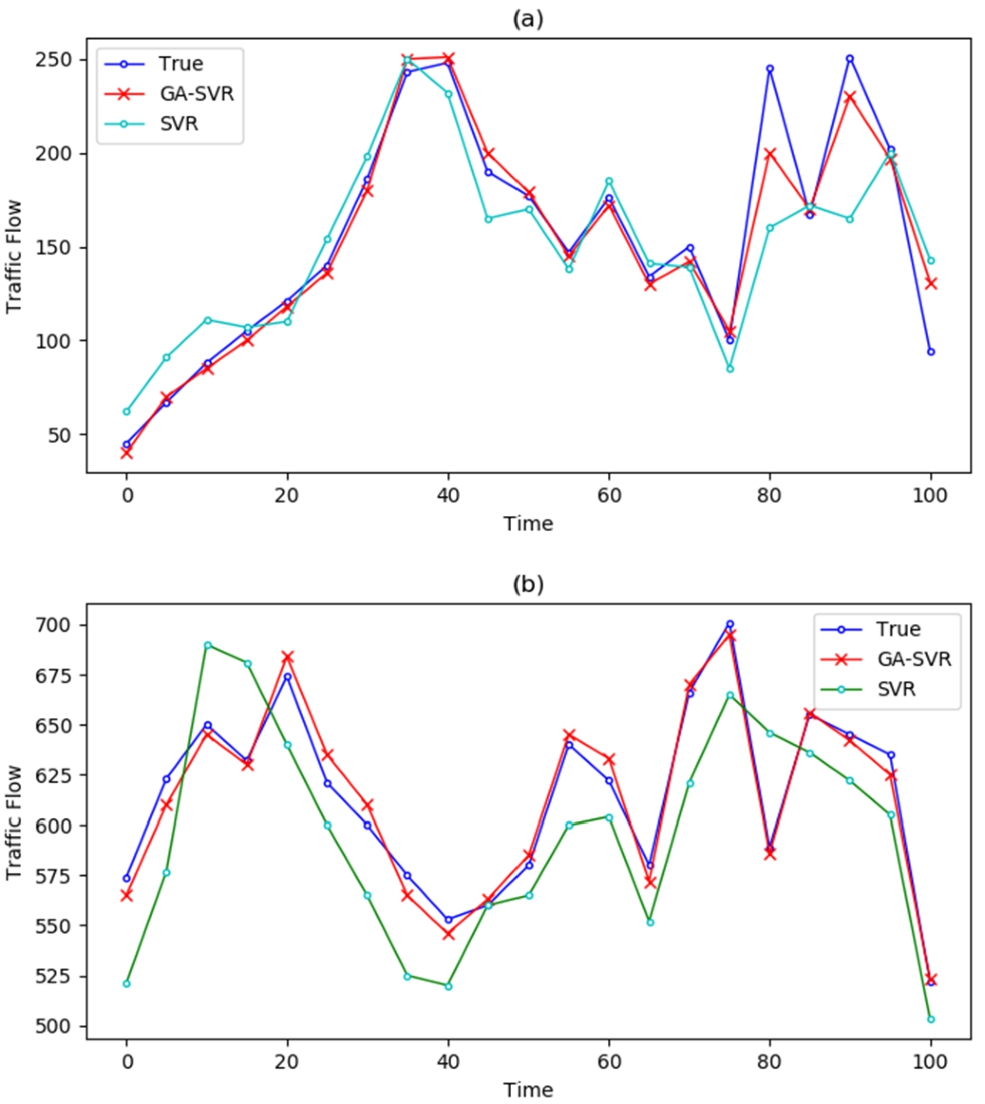
Fig. 5.
Comparison of model prediction results classical models: (a) on S46 expressway; (b) on G76 expressway.
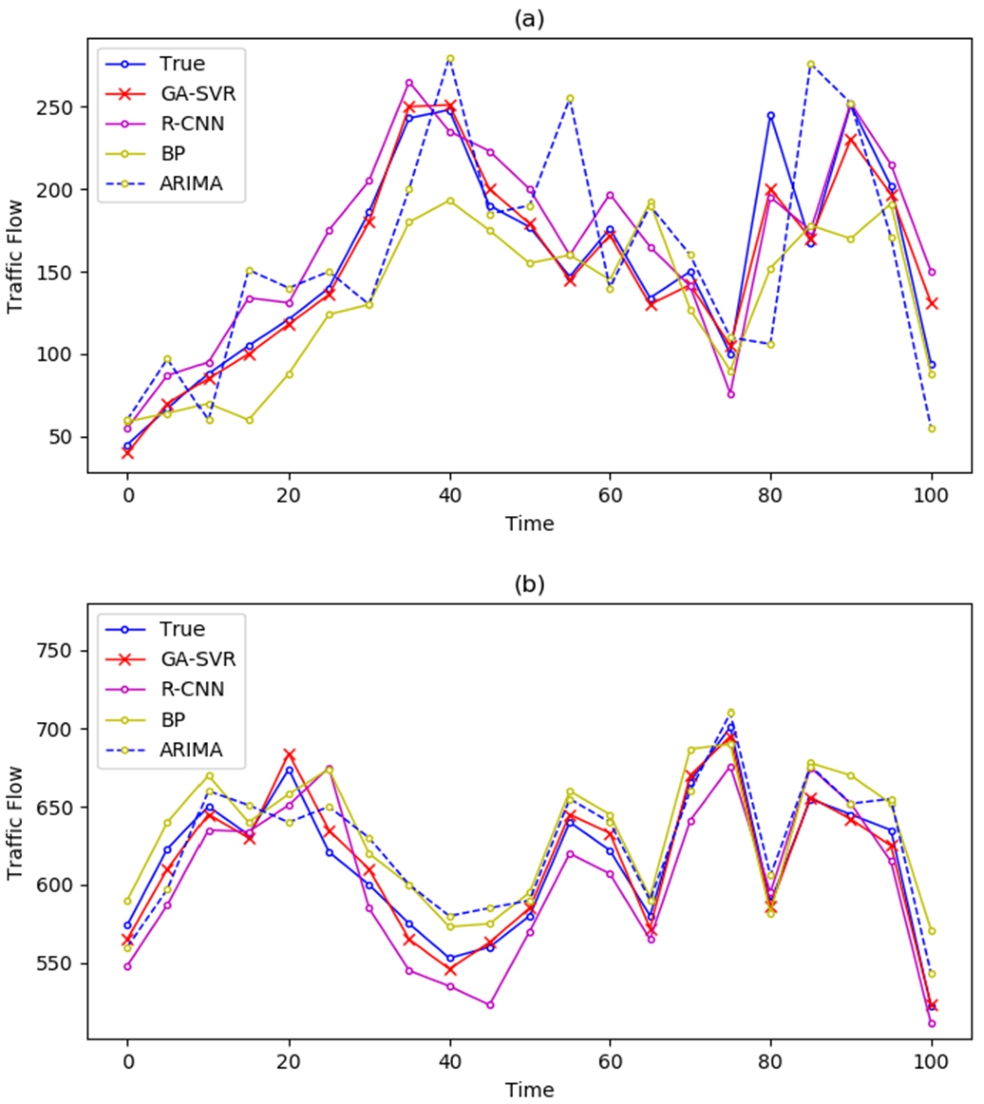
Fig. 6.
Performance evaluation: (a) MAE; (b) PMSE; (c) MAPE.
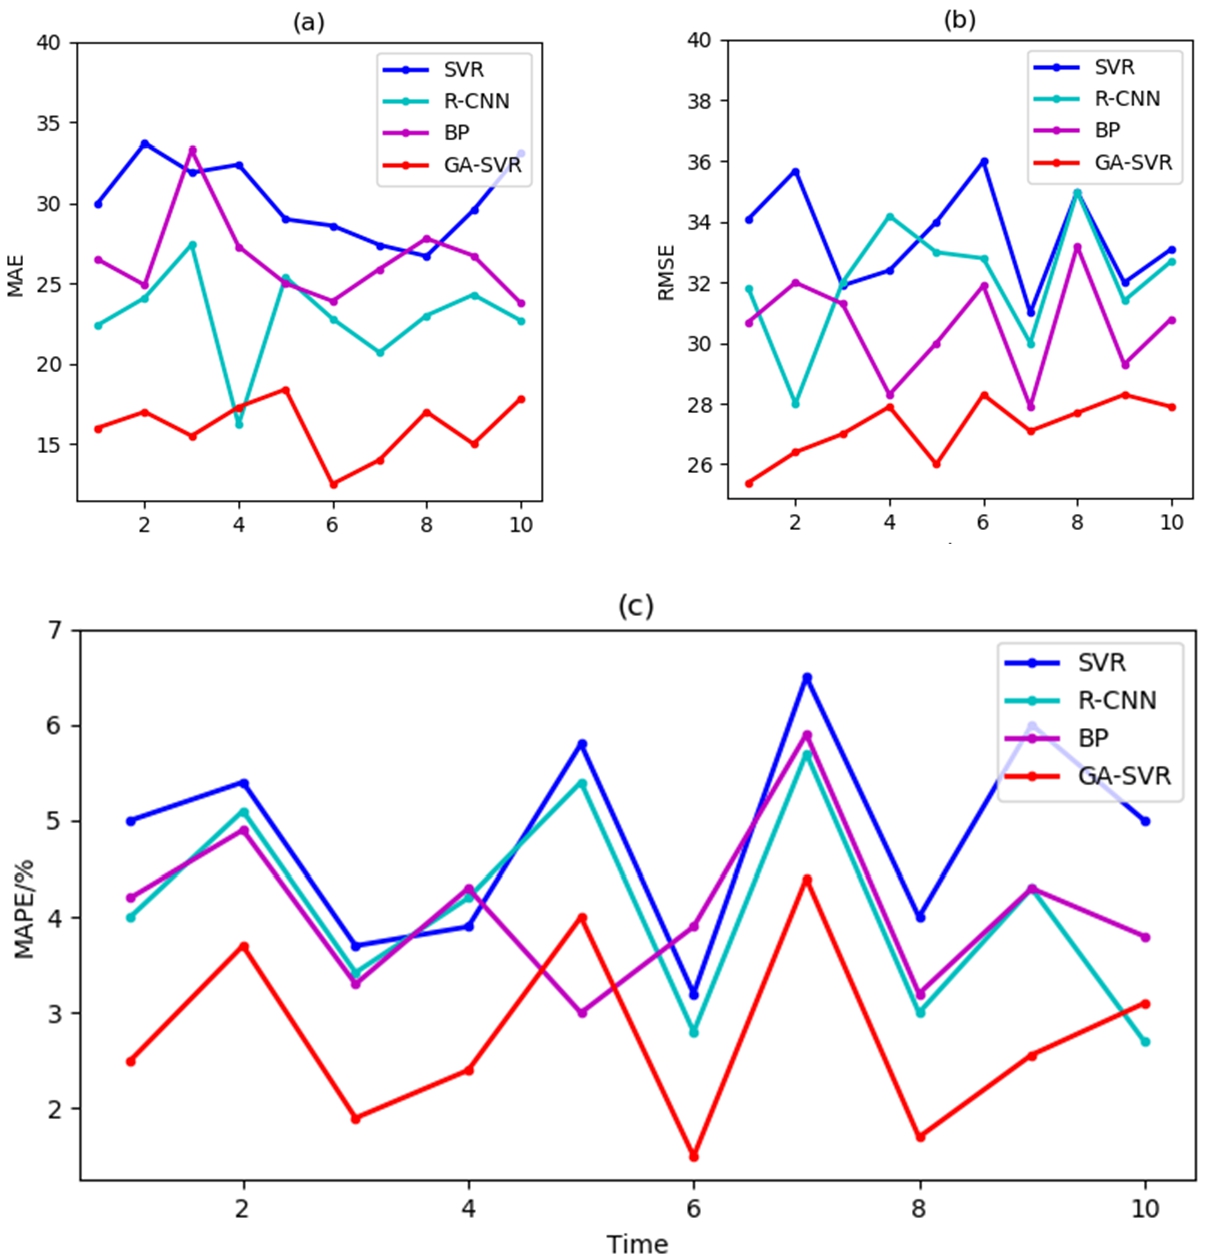
Figure 6 shows the comparison of MAE, RMSE and MAPE indexes among different models. As can be seen from the figure, the prediction error of the model proposed in this paper on the 10 test data sets is smaller than that of other models, showing performance advantages. The smaller the value of the three indicators, the more accurate the prediction results. Figure 6 shows that GA-SVR prediction model has better MAE, RMSE and MAPE than R-CNN, BP neural network and un-optimized SVR, with better prediction accuracy, among which the un-optimized SVR has the worst performance.
4.Conclusion
SVR has powerful nonlinear fitting characteristics of artificial intelligence algorithm and overcomes the shortcoming of unstable output results. It has excellent characteristics when dealing with complex nonlinear laws in the case of small samples, but it is difficult to determine the parameter values in practical applications. By combining GA and SVR, using the optimized parameters of SVR forecasting model is established and the actual traffic flow data to verify, results show that the prediction model is proposed in this paper can effectively improve short-term traffic flow prediction accuracy. Compared with R-CNN, the BP Neural Network and ARIMA, error evaluation indexes MAE, RMSE and MAPE values were significantly decreased, the prediction results to reduce the pressure on urban traffic has very important significance.
Acknowledgements
This work was supported in part by Research Project of Transportation Department in Jiangxi Province under grant no. 2018X0016.
Conflict of interest
None to report.
References
[1] | B. Abdulhai, H. Porwal and W. Recker, Short-term traffic flow prediction using neuro-genetic algorithms, Intelligent Transportation Systems Journal 7: (1) ((2002) ), 3–41. doi:10.1080/713930748. |
[2] | M.S. Ahmaed and A.R. Cook, Analysis of freeway traffic time-series data by using Box-Jenkins technique, Transportation Research Record. 722: ((1979) ), 1–9. |
[3] | M. Guo, X. Xiao and J. Lan, A summary of the short-time traffic forecasting methods, Techniques Of Automation And Applications. 28: (6) ((2009) ), 8–9. |
[4] | N. Jiang, J. Chen, R.G. Zhou, C.X. Wu, H.L. Chen, J.Q. Zheng and T. Wan, PAN: Pipeline assisted neural networks model for data-to-text generation in social Internet of things, Information Sciences 530: ((2020) ), 167–179. doi:10.1016/j.ins.2020.03.080. |
[5] | N. Jiang, F. Tian, J. Li, X. Yuan and J. Zheng, MAN: Mutual attention neural networks model for aspect-level sentiment classification in SIoT, IEEE Internet of Things Journal 7: (4) ((2020) ), 2901–2913. doi:10.1109/JIOT.2020.2963927. |
[6] | N. Jiang, D. Xu, J. Zhou, H. Yan, T. Wan and J. Zheng, Toward optimal participant decisions with voting-based incentive model for crowd sensing, Information Sciences 512: ((2020) ), 1–17. doi:10.1016/j.ins.2019.09.068. |
[7] | Z. Liu, W. Du, D. Yan et al., Short-term traffic flow forecasting based on combination of K-nearest neighbor and support vector regression, Journal of Highway and Transportation Research and Development (English Edition) 12: (1) ((2018) ), 89–96. doi:10.1061/JHTRCQ.0000615. |
[8] | R. Mehta and V.V. Vazirani, An incentive compatible, efficient market for air traffic flow management, Theoretical Computer Science. 818: ((2018) ), 41–50. doi:10.1016/j.tcs.2018.09.006. |
[9] | R. Moazenzadeh, B. Mohammadi, S. Shamshirband and K.W. Chau, Coupling a firefly algorithm with support vector regression to predict evaporation in northern Iran, Engineering Applications Of Computational Fluid Mechanics 12: (1) (2018) , 584–597. |
[10] | I. Okutani and Y.J. Stephanedes, Dynamic prediction of traffic volume through Kalman filtering theory, Transportation Research Part B: Methodological 18: (1) ((1984) ), 1–11. doi:10.1016/0191-2615(84)90002-X. |
[11] | H. Shi, M. Xu and R. Li, Deep learning for household load forecasting-a novel pooling deep RNN, IEEE Transactions On Smart Grid 9: (5) ((2018) ), 5271–5280. doi:10.1109/TSG.2017.2686012. |
[12] | B.L. Smith and M.J. Demetsky, Short-term traffic flow prediction: Neural network approach, in: Transportation Research Record, (1984) , pp. 98–104. |
[13] | B. Son, J.W. Kim, D. Lee and S.Y. Jung, Genetic algorithm with species differentiation based on kernel support vector machine for optimal design of wind generator, in: IEEE Transactions on Magnetics, (2019) , p. 55. |
[14] | C. Sukawattanavijit, J. Chen and H.S. Zhang, GA-SVM algorithm for improving land-cover classification using SAR and optical remote sensing data, IEEE Geoscience and Remote Sensing Letters 14: (3) ((2017) ), 284–288. doi:10.1109/LGRS.2016.2628406. |
[15] | Y. Tian and L. Pan, Predicting Short-Term Traffic Flow By Long Short-Term Memory Recurrent Neural Network, in: 2015 IEEE international conference on smart, city (Smart City); 2015; Chengdu, IEEE Press, pp. 153–158. |
[16] | V.N. Vapnik, Statistical learning theory, Encyclopedia of the Sciences of Learning 41: (4) ((2012) ), 3185–3185. |
[17] | D. Xu, Y. Wang, P. Peng et al., Real-time road traffic state prediction based on kernel-KNN, Transportmetrica A-Transport Science. 16: (1) ((2020) ), 104–118. doi:10.1080/23249935.2018.1491073. |
[18] | H. Xu and C. Jiang, Deep belief network-based support vector regression method for traffic flow forecasting, Neural Computing & Applications. 32: (7) ((2020) ), 2027–2036. doi:10.1007/s00521-019-04339-x. |
[19] | Y.J. Zhang, M. Wang et al., Research On Adaptive Beacon Message Broadcasting Cycle Based On Vehicle Driving Stability, International Journal Of Network Management. (2020). |


