
Assessment of knee collateral ligament stiffness by strain ultrasound elastography
Abstract
BACKGROUND:
Knowledge of the biomechanics of the normal collateral ligaments is important to secure optimal stability of the knee following injury. Various in vitro methods have been described in evaluating the biomechanics of these ligaments. However, a method of direct evaluation has not been reported.
OBJECTIVE:
To determine the stiffness characteristics of the collateral ligaments of the knee using strain ultrasound elastography.
METHODS:
Strain ultrasound elastography was performed on different components of the collateral ligaments in various angles of knee flexion in 18 healthy males (36 ligaments). We measured relative stiffness of the ligaments using strain ratio (SR = target tissue strain/reference strain). A lower strain ratio indicates higher relative stiffness.
RESULTS:
There was moderate to excellent intra- and inter-rater agreement for strain ratio measurements in all ligament portions. Strain ratios were lowest at 0° in all three ligaments, indicating high relative stiffness. In the superficial and deep medial collateral ligaments, the strain ratio increased with increasing knee flexion, whereas in the lateral collateral ligament, stiffness showed a tendency to fluctuate.
CONCLUSION:
Strain ultrasound elastography is a reliable tool for monitoring relative stiffness of the collateral ligaments of the knee and is easily applied to the routine clinical setting.
1.Introduction
The medial (MCL) and lateral (LCL) collateral ligaments of the knee play a major role in stabilizing the joint against valgus and varus forces. Knowledge of the normal biomechanical behavior of these ligaments is important to secure optimal stability of the knee after ligament injury or surgical procedures. Many in vitro studies have described the material properties and functions of the collateral ligaments of the knee using tensile testing methods [1–8]. Strain gages [7], motion analysis systems [1,3], and measurement of end-to-end distance [4,6,8] have been used to assess ligament strain against an applied load. However, certain variations are noticeable in the presented strain or elongation patterns. These could be attributable to difficulties in controlling the forces, the loading conditions in the in vitro situation, differences in the ligament regions assessed, and differences in the strain or length measurement techniques used.
Hosseini et al. [9] and Park et al. [10] investigated the mechanical behaviors of the MCL and the LCL in vivo. They used MRI and a dual fluoroscopic imaging technique to observe the in vivo pattern in the change in length of different functional portions of the MCL and LCL during a single-legged lunge from full-knee extension to flexion [9,10]. They reported that each ligament portion behaves differently through the knee flexion pathway, and suggested that component-wise analysis in various flexion angles should be considered during total knee arthroplasty (TKA). In these studies, ligament length was measured as the linear distance between its proximal and distal attachments [9,10]. However, it is debatable whether this method enables the length of a ligament structure to be estimated accurately, because of the complexity in orientation of the fibers, especially during knee movements, and also due to methodological issues in reliably identifying the ligament insertion sites [11]. Hence, it is unknown whether changes in fiber orientation have any impact on true ligament deformation during knee flexion, and there are no previous reports of a method for direct evaluation of the stiffness of the collateral ligaments of the knee.
Strain ultrasound elastography (SE) is a non-invasive imaging method that is sensitive to tissue stiffness. It has been used clinically to diagnose malignancies in such as the liver and breast because it is an objective method for differentiating benign from malignant tissue [12]. In SE, relative stiffness is defined as the stiffness of the target tissue relative to an adjacent tissue. In addition to its use as a diagnostic modality, SE is being widely used to assess the mechanical properties of musculotendinous structures [13–17]. We have recently demonstrated that SE is a feasible and reproducible tool for assessing the stiffness behavior of the anteromedial knee joint capsule along the knee flexion pathway [18]. The purpose of the present study was to determine the stiffness characteristics of the normal knee collateral ligaments in various knee flexion angles, using SE.
2.Materials and methods
2.1.Study population
We assessed the right-sided MCL and LCL of 18 healthy male volunteers (mean age, 22.2 ± 1.4 years) who had no history of chronic knee pain or significant musculoskeletal problems in their lower limbs. A total of 36 ligaments were included. The study was approved by our Institutional Internal Review Board and written, informed consent was obtained from each participant.
2.2.Strain elastography assessment procedure
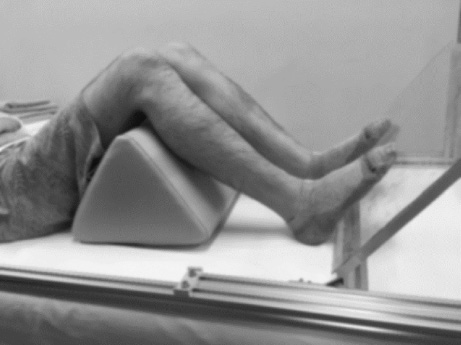
We used the same methodology as described in our previous study in which we assessed the relative stiffness of the anteromedial knee joint capsule [18]. Prior to each elastography assessment, the participants were asked to perform ten full squatting movements to precondition the soft tissues around the knee joint. We assessed ligament stiffness at flexion angles of 0°, 30°, 60°, 90°, and 120°. Knee angles were measured using a universal goniometer. With the subject lying supine on the bed, the knees were bent to the desired flexion angle and supported by a firm wedge. The feet were placed on customized support plate to stabilize the knee joint at each flexion angle and to maintain the neutral position of the feet (Fig. 1).
Fig. 1.
Photograph showing positioning of the lower limb, using a customized support designed to stabilize the knee joint in each flexion angle and maintain the feet in a neutral position.
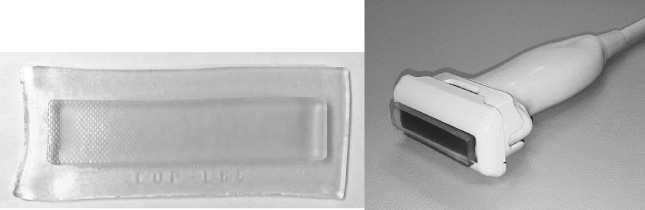
A general-purpose ultrasonic device (Hi Vision Avius; Hitachi Aloka Medical Corp., Tokyo, Japan) and a 5–18 MHz linear array transducer (EUP-L 75; Hitachi Aloka Medical Corp., Tokyo, Japan) were used to examine the relative stiffness of the MCL and LCL. In the SE technique, the stiffness of the target tissue is determined relative to that of an adjacent soft tissue. In the present study, the reference tissue was an acoustic coupler with a known Young’s modulus (22.6 ± 2.2 kPa), attached to the top of the ultrasound transducer by a dedicated plastic attachment (EZU-TEATC2; Hitachi Aloka Medical Corp., Tokyo, Japan) (Fig. 2). Previous studies have reported high intra- and inter-observer reliability in stiffness measurements obtained with SE using this acoustic coupler [13,15,18].
Fig. 2.
Photographs of the acoustic coupler (left) and linear ultrasound probe (right). The coupler is fixed to the probe with a dedicated plastic attachment.
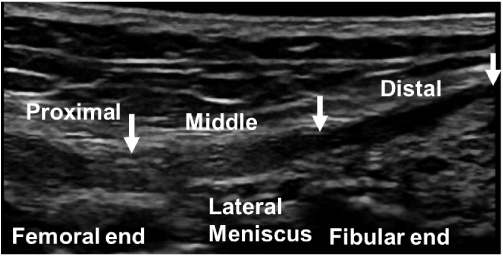
We divided the collateral ligaments into several portions to assess the relative stiffness of the entire ligament area during the SE assessment. The MCL comprises superficial (sMCL) and deep (dMCL) bundles. The sMCL and LCL were each divided into three portions: proximal (at its femoral attachment), middle (sMCL at the medial knee joint line immediately proximal to the medial meniscus, and LCL at the lateral joint line immediately proximal to the lateral meniscus), and distal (sMCL at its tibial attachment, and LCL at its fibular attachment). The dMCL was divided into two portions either side of its attachment to the medial meniscus: meniscofemoral (MF) and meniscotibial (MT) portions (Figs 3 and 4). Each portion of ligament was 1.5–2.0 cm in length. The ultrasound transducer was placed longitudinally at the medial and lateral knee joint line and the corresponding portions of the collateral ligaments were assessed.
Fig. 3.
B-mode ultrasound image of the medial collateral ligament at the 0° knee position. The white arrows indicate the proximal, middle, and distal portions of the superficial medial collateral ligament, and the yellow arrows indicate the meniscofemoral (left) and meniscotibial (right) portions of the distal medial collateral ligament.
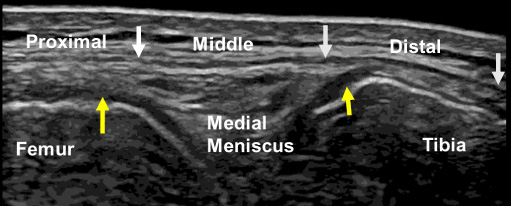
Fig. 4.
B-mode ultrasound image of the lateral collateral ligament at the 0° knee position. Arrows indicate the proximal, middle, and distal portions of the lateral collateral ligament.
Strain ultrasonic elastography repeatedly applies a cyclic compressive force of about 2 Hz on the skin surface via a coupler attached to the ultrasound transducer, and measures the relative stiffness of the target soft tissue [19]. The strain distributions are seen in real-time on a tissue stiffness map superimposed on the usual B-mode image, on which stiffer areas are shown in blue and less stiff areas in red. To maintain uniformity in the compression force when assessing the ligament portions, compressions were applied to each portion while referring to the sine curve in the strain indicator, and by maintaining a constant strain distribution of 0.45%–0.55% in the coupler for all knee flexion angles (Fig. 5). SE was recorded with one region of interest (ROI) placed to cover the entire acoustic coupler (width 4 cm and height 0.5 cm) and another ROI placed over a portion of ligament (Fig. 5). Strain that developed in the ligament tissue and in the coupler was determined using the combined autocorrelation method by the built-in software of the SE machine, and the strain ratio (SR) was calculated [19]. The SR was defined as the ratio of strain in the ligament tissue to that in the acoustic coupler, as follows:
(1)
Fig. 5.
Elastographic (top) and B-mode images (bottom) of the middle portion of the superficial medial collateral ligament (MCL) at 0° knee flexion. The strain indicator and the strain ratios of the ligament and coupler are displayed. The ROI of the acoustic coupler (width, 4 cm; height, 0.5) is indicated as a yellow rectangle, and the ligament portion (length, 2 cm) is outlined in yellow.
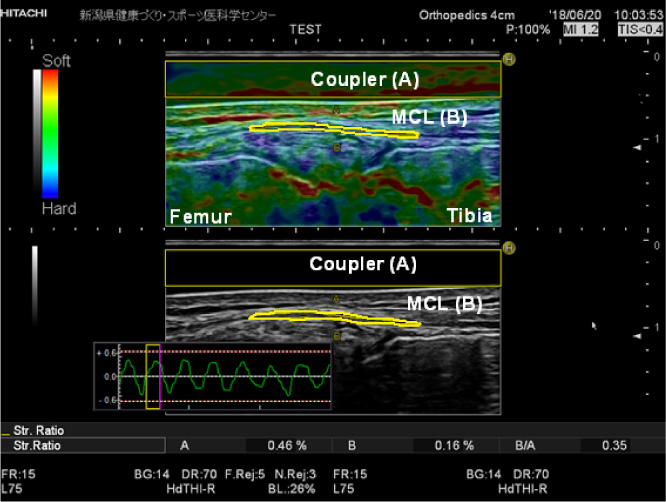
A lower SR indicates higher relative stiffness; i.e., soft tissues with high elasticity show less deformation than those with low elasticity. The strain distribution in the acoustic coupler was maintained at 45%–55% to ensure uniformity of the applied compressions. SR measurements were obtained three times for each ligament portion with the knee at flexion of each of 0°, 30°, 60°, 90°, and 120°.
2.3.Data analysis
Because ultrasonic diagnosis and measurements are operator dependent, we used the intraclass correlation coefficient (ICC) to assess the reliability of measurements at the 0° knee position, for two observers (intraobserver repeatability ICC1,3) who assessed each participant three times (interobserver repeatability ICC2,3). One way repeated measure ANOVA was performed to analyze variation of SR in the MCL and LCL of the same individuals in different angles of knee flexion. Assumptions such as normality and sphericity were analyzed before processing repeated measure ANOVA test. Shapiro–Wilk test as well as normal Q-Q plots were made to check the normality and data were normally distributed. Mauchly’s sphericity test was performed to check the equality of variance within the subjects at all the conditions for all the ligament portions tested, and found that the assumption was not violated except in two ligament portions. Greenhouse–Geisser correction was performed for those two ligaments, for which the Greenhouse–Geisser value was <0.75. Pairwise comparison was conducted with Bonferroni corrections to identify the angles with significant difference for each ligament portion tested. All these tests were carried out at 5% significance level with 95% CI. All statistical analyses were conducted with SPSS statistical software, version 23 (SPSS, IBM Corp. Armonk, NY, USA).
3.Results
3.1.Measurement reliability
The overall ICC1,3 values for the SR measurements obtained from different portions of the sMCL (Fig. 6), dMCL (Fig. 7), and LCL (Fig. 8) showed moderate to excellent agreement (range, 0.62–0.95). The ICC2,3 values also showed substantial inter-rater reliability of the SR measurements (range, 0.66–0.98) (Table 1).
Fig. 6.
Elastographic (top) and B-mode images (bottom) of the superficial medial collateral ligament at 0° knee flexion. From left to right, the proximal, middle, and distal portions are shown. The ROI of the acoustic coupler is indicated as a yellow rectangle, and the ROI of each ligament portion is outlined in yellow.
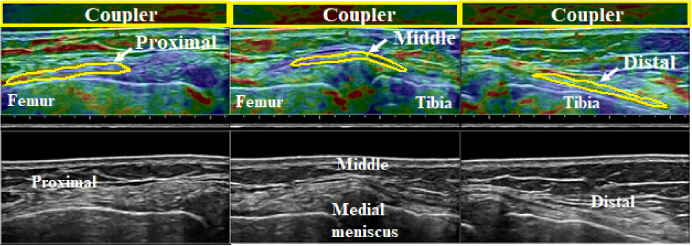
Fig. 7.
Elastographic (top) and B-mode images (bottom) of the meniscofemoral (MF, left) and meniscotibial (MT, right) portions of the deep medial collateral ligament (dMCL) at 0° knee flexion. The ROI of the acoustic coupler is indicated as a yellow rectangle, and the ROI of each ligament portion is outlined in yellow.
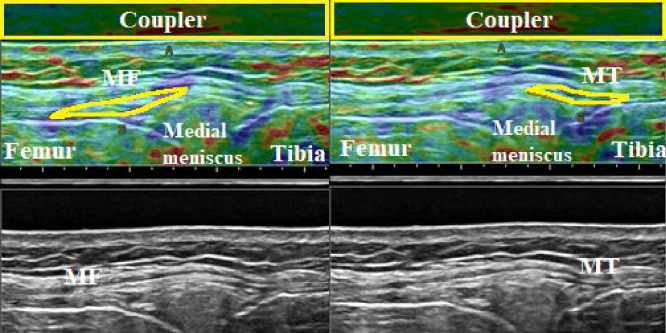
Fig. 8.
Elastographic (top) and B-mode images (bottom) of the lateral collateral ligament (LCL) at 0° knee flexion. From left to right, the proximal, middle, and distal portions are shown. The ROI of the acoustic coupler is indicated as a yellow rectangle, and the ROI of each ligament portion is outlined in yellow.
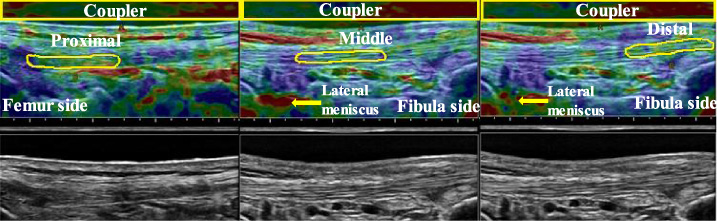
Table 1
Intra-rater and inter-rater reliability analysis of the strain ratio measurements obtained in portions of the superficial and deep medial collateral ligament and lateral collateral ligament at 0° of knee flexion
| sMCL | dMCL | LCL | ||||||
| Proximal | Middle | Distal | MF | MT | Proximal | Middle | Distal | |
| Examiner 1 | ||||||||
| Intra-rater repeatability ICC1,3 | 0.89 | 0.90 | 0.93 | 0.80 | 0.93 | 0.95 | 0.92 | 0.62 |
| Examiner 2 | ||||||||
| Intra-rater repeatability ICC1,3 | 0.91 | 0.87 | 0.88 | 0.73 | 0.62 | 0.90 | 0.8 | 0.74 |
| Inter-rater repeatability ICC2,3 | 0.66 | 0.89 | 0.67 | 0.94 | 0.68 | 0.98 | 0.87 | 0.70 |
[i] sMCL: superficial medial collateral ligament, dMCL: deep medial collateral ligament, MF: meniscofemoral, MT: meniscotibial, LCL: lateral collateral ligament.
3.2.SR obtained in the sMCL and dMCL at different flexion angles of the knee
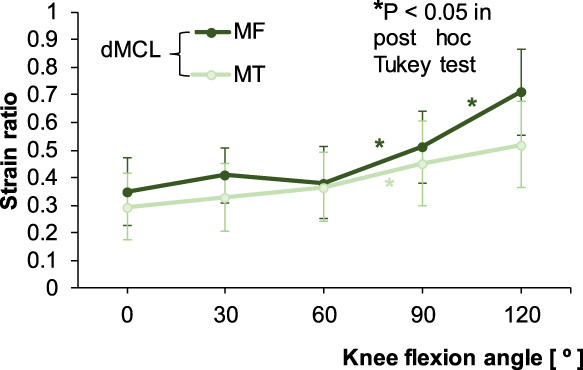
In the sMCL, the proximal, middle, and distal portions showed the lowest SR at 0°. In the proximal and middle portions, SR was constant until 60°, and then increased rapidly until 120°. In the distal portion, SR increased rapidly after 30° until 90° (Fig. 9). In the dMCL, the MF and MT portions showed relatively constant SR from 0° to 60°, after which the SR of the MF portion increased significantly at 120° (P < 0.05). In the MT portion, however, significant increase in SR was seen only between 60° and 90° (P < 0.05) (Fig. 10).
Fig. 9.
Strain ratios for the proximal, middle, and distal portions of the superficial medial collateral ligament (sMCL) according to knee flexion angle. The asterisk colors correspond to the three ligament portions.
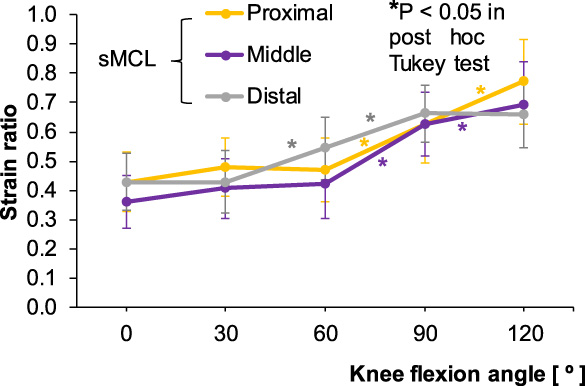
Fig. 10.
Strain ratios for the meniscofemoral (MF) and meniscotibial (MT) portions of the deep medial collateral ligament (dMCL) according to knee flexion angle. The asterisk colors correspond to the two ligament portions.
3.3.SR obtained in the LCL at different flexion angles of the knee
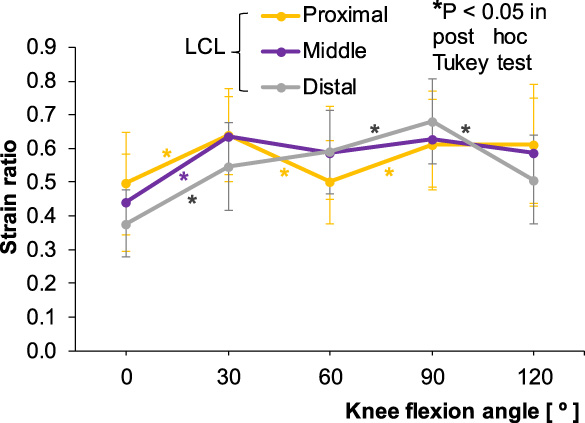
In the LCL, all the three portions showed a significant increase in SR from 0° to 30° (P < 0.05), after which the proximal and middle portions showed a fluctuating tendency, as SR decreased at 60° and increased at 90°. In the distal portion, SR continued to increase during flexion until 90°, and decreased significantly from 90° to 120° (P < 0.05) (Fig. 11).
Fig. 11.
Strain ratios for the proximal, middle, and distal portions of the lateral collateral ligament (LCL) according to knee flexion angle. The asterisk colors correspond to the three ligament portions.
4.Discussion
Among the types of knee injury, ligament pathology is the most common (∼40%) [20]. According to a previous study, 29% of these injuries occur to the MCL [20]. Ligament laxity following knee injury is a risk factor for early onset of osteoarthritis (OA) of the knee joint [21,22]. In athletes, the progression to returning to play after a knee injury is determined by achieving pain-free range of motion, restoring muscle strength, and building endurance. However, the mechanical properties of the recovering ligament are not usually assessed. In addition, the assessment of laxity in the MCL and LCL is a key stage during total knee arthroplasty (TKA) [23]. Despite advances in achieving equal mediolateral laxity intra-operatively using various devices during TKA, slightly greater laxity has been observed post-operatively [24]. The indirect assessment methods for evaluating the mechanical properties of the collateral ligaments described in numerous past investigations are not feasible for application to the routine clinical setting [1–6,9,10]. Thus, in the present study, we attempted to apply SE for direct assessment of the stiffness behavior of the MCL and LCL.
In the present study, we observed moderate to excellent measurement reliability for SR in all portions of the MCL and LCL at 0° of knee flexion. Our findings agree with those of previous studies regarding other soft tissues (e.g., the supraspinatus and Achilles tendons) that used the same ultrasound system and acoustic coupler as in the present study [13,15]. Several methodological features of the present study had advantages in terms of SR measurement reliability. We used an acoustic coupler as the reference because of individual variation in the stiffness characteristics of internal references such as fat pads and subcutaneous tissue, and because there is inconsistency in the strain values of internal references when they are measured at different angles of knee flexion [25]. As the tissue displacement technique is performed manually, SE is considered operator dependent. We took measures to assure uniformity in the application of manual compressions by maintaining a constant strain distribution of 0.45%–0.55% in the coupler for all knee flexion angles, in each subject; this method also helped to minimize the effects on the SR of underlying soft tissues [26]. However, Hatta et al. reported that SR is less affected if the target tissue is within a depth of 22 mm from the skin [27]. In our study, we used large ROIs for the coupler and for the target tissue. Because SE measures the stiffness of the target tissue relative to a reference, smaller ROIs may not produce a fair representation of absolute tissue stiffness. In previous SE studies that assessed only one portion of the target tissue (e.g., the middle portion, or just one third), it is unknown whether the findings represent the stiffness of the entire tissue [15,17]. For this reason, in the present study, as far as possible we have measured the entire tissue length. The SR values of soft tissues have generally been obtained with the joint placed at one joint angle [14,16,17,28]. As the soft tissues possess non-linear behavior in the general force-displacement curve, we consider that it is important to assess SRs at various flexion angles. Some studies that used methods other than elastography to assess the collateral ligaments and the patellar tendon found that elastic behavior varied with joint angle [9,10,29]. In our study, all knee joint positions were stabilized at defined angles using a customized support. Fixation of the measurement site is reported to have a significant impact on measurement reliability using elastography [30]. Furthermore, soft tissues such as tendons, joint capsules, and ligaments possess viscoelastic properties and have mechanical characteristics that depend on the applied strain rate. Therefore, to precondition the soft tissues around the knee joint to reduce the hysteresis of the relationship between the force and the deformation of ligament, we asked the subjects to perform full squatting movements prior to the SE procedure.
The results of the present study revealed that the relative stiffness of different portions of the collateral ligaments differs with knee flexion angle. The relative stiffness of the sMCL in the present study is close to that reported in previous in vitro studies, which observed relatively isometric length change at lower flexion angles and slackening of the ligament in mid flexion and at deep flexion angles [4–6,8]. These studies assessed the ligament as a whole or only the most central fibers, in a similar manner to the present study in which the entire ligament was divided transversely. In an in vivo study, Hosseini et al. divided the sMCL into anterior, middle, and posterior bundles longitudinally [9]. The mean value of length change measurements in the three bundles showed a similar tendency of length change in the sMCL as was observed in the present study [9]. Table 2 lists a comparison of the present mean values with those of previous in vivo and in vitro studies. The relatively constant stiffness behavior of the sMCL in the early flexion range in the present study might be due to elongation of the anterior fibers and shortening of the posterior fibers of the sMCL during 90° knee flexion, because the most anterior part of the femoral attachment of the sMCL is located anteriorly to the flexion axis and the most posterior part is located posteriorly [1,31]. Regarding the dMCL, except in the range of 30°–90°, the present results showed a similar tendency to those of Hosseini et al., who investigated length change behavior by measuring the distance between the proximal and distal attachments of the dMCL [9] (Table 2). However, they observed overlapping of the ligament fibers with increasing knee flexion angle which, we believe, might have affected real ligament deformation. The present results of overall relative stiffness of the LCL showed that SR was maximum at 0°, minimum at 90°, and then increased between 90° and 120°. A similar tendency to that in the study of Hosseini et al. was seen when we assessed the mean value of length change measurements of all three components [9]. It is known that ligaments are incompressible structures. However, the rhythmic shortening and elongation of the LCL through the range of 60°–145° knee flexion observed by Hosseini et al. presents the image of the LCL behaving as a spring, as they presented the distance between attachment sites and not the true ligament length [9]. In contrast to the present results, Rochcongar et al. observed a rapid decrease in the length of the LCL from 0°–100° [8] (Table 2).
Table 2
Comparison of the present results with previously published in vivo and in vitro studies
| Ligament | Study | 0° | 30° | 60° | 90° | 120° | 145° |
| sMCL | Present study (in vivo) | 0.41 | 0.44 | 0.48 | 0.64 | 0.71 | |
| SR | |||||||
| Hosseini et al. [9] (in vivo) | 0.0% | −2.7% | −4.3% | −8.0% | −13.3% | −15.0% | |
| Length change % | |||||||
| Rochcongar et al. [8] (in vitro) | 0.0% | −1.09% | −2.17% | −3.26% | −6.52% | ||
| Length change % | |||||||
| dMCL | Present study (in vivo) | 0.32 | 0.37 | 0.37 | 0.48 | 0.62 | |
| SR | |||||||
| Hosseini et al. [9] (in vivo) | 0.0% | −3.4% | −0.6% | 0.0% | −1.4% | 0.6% | |
| Length change % | |||||||
| Rochcongar et al. [8] (in vitro) | 0.0% | −5.60% | −5.60% | −5.60% | −5.60% | 0.0% | |
| Length change % | |||||||
| LCL | Present study (in vivo) | 0.44 | 0.61 | 0.56 | 0.64 | 0.57 | |
| SR | |||||||
| Hosseini et al. [9] (in vivo) | 0.0% | −1.0% | −15.5% | −18.0% | −16.0% | −7.0% | |
| Length change % | |||||||
| Rochcongar et al. [8] (in vitro) | 0.0% | −4.8% | −8.10% | −11.30% | −14.50% | ||
| Length change % |
[i] Data presented as the mean values of the three ligament components, for the present and the in vivo studies. The in vitro study assessed the whole ligament without dividing it into different components. sMCL – superficial medial collateral ligament, dMCL – deep medial collateral ligament, LCL – lateral collateral ligament.
Regarding the clinical relevance of this study, in which we obtained substantial measurement reliability, we recommend that measurement of stiffness with SE could be incorporated into routine pain and functional outcome assessments during rehabilitation, or before and after surgical procedures. Furthermore, we found that relative stiffness of both the MCL and LCL was greatest at full knee extension. In athletes who have sustained a collateral ligament injury (particularly to the MCL), the present findings indicate that progression to returning to play should begin with loading of the injured knee ligament at high flexion angles and gradually progress to lower flexion angles. The basic data obtained in the present study could be used to understand changes in ligament stiffness in injured, aged, and diseased knees in comparison with the healthy population.
There were some limitations in this study. First, we did not assess the stiffness behavior of the MCL and LCL through the full range of knee flexion. Second, moderate reliability values were obtained for SR measurements of some ligament portions in the MCL and LCL. This may be related to instability in the strain distribution of the coupler in knee flexion angles beyond 90°, at which the bony prominences become more superficial [26].
5.Conclusions
SE is an easy and reliable tool for measuring the relative stiffness of the knee collateral ligaments in the routine clinical setting, as indicated by the substantial ICC values. The findings of this study enable a complete understanding of the stiffness behavior of the MCL and LCL over a range of knee flexion angles.
Conflict of interest
None to report.
References
[1] | J.C. Gardiner, J.A. Weiss and T.D. Rosenberg, Strain in the human medial collateral ligament during valgus loading of the knee, Clin. Orthop. Relat. Res. (391) ((2001) ), 266–274. doi:10.1097/00003086-200110000-00031. |
[2] | W.T. Wilson, A.H. Deakin, A.P. Payne, F. Picard and S.C. Wearing, Comparative analysis of the structural properties of the collateral ligaments of the human knee, J. Orthop. Sports Phys. Ther. 42: (4) ((2012) ), 345–351. doi:10.2519/jospt.2012.3919. |
[3] | E. Bergamini, H. Pillet, J. Hausselle, P. Thoreux, S. Guerard, V. Camomilla , Tibio-femoral joint constraints for bone pose estimation during movement using multi-body optimization, Gait Posture 33: (4) ((2011) ), 706–711. doi:10.1016/j.gaitpost.2011.03.006. |
[4] | K.M. Ghosh, A.M. Merican, F. Iranpour, D.J. Deehan and A.A. Amis, Length-change patterns of the collateral ligaments after total knee arthroplasty, Knee Surg. Sports Traumatol. Arthrosc. 20: (7) ((2012) ), 1349–1356. doi:10.1007/s00167-011-1824-2. |
[5] | D.T. Harfe, C.R. Chuinard, L.M. Espinoza, K.A. Thomas and M. Solomonow, Elongation patterns of the collateral ligaments of the human knee, Clin. Biomech. (Bristol, Avon) 13: (3) ((1998) ), 163–175. doi:10.1016/s0268-0033(97)00043-0. |
[6] | J. Victor, P. Wong, E. Witvrouw, J.V. Sloten and J. Bellemans, How isometric are the medial patellofemoral, superficial medial collateral, and lateral collateral ligaments of the knee? Am. J. Sports Med. 37: (10) ((2009) ), 2028–2036. doi:10.1177/0363546509337407. |
[7] | M.L. Hull, G.S. Berns, H. Varma and H.A. Patterson, Strain in the medial collateral ligament of the human knee under single and combined loads, J. Biomech. 29: (2) ((1996) ), 199–206. doi:10.1016/0021-9290(95)00046-1. |
[8] | G. Rochcongar, H. Pillet, E. Bergamini, S. Moreau, P. Thoreux, W. Skalli , A new method for the evaluation of the end-to-end distance of the knee ligaments and popliteal complex during passive knee flexion, Knee 23: (3) ((2016) ), 420–425. doi:10.1016/j.knee.2016.02.003. |
[9] | A. Hosseini, W. Qi, T.Y. Tsai, Y. Liu, H. Rubash and G. Li, In vivo length change patterns of the medial and lateral collateral ligaments along the flexion path of the knee, Knee Surg. Sports Traumatol. Arthrosc. 23: (10) ((2015) ), 3055–3061. doi:10.1007/s00167-014-3306-9. |
[10] | S.E. Park, L.E. DeFrate, J.F. Suggs, T.J. Gill, H.E. Rubash and G. Li, The change in length of the medial and lateral collateral ligaments during in vivo knee flexion, Knee 12: (5) ((2005) ), 377–382. doi:10.1016/j.knee.2004.12.011. |
[11] | H.H. Rachmat, D. Janssen, W.J. Zevenbergen, G.J. Verkerke, R.L. Diercks and N. Verdonschot, Generating finite element models of the knee: How accurately can we determine ligament attachment sites from MRI scans? Med. Eng. Phys. 36: (6) ((2014) ), 701–707. doi:10.1016/j.medengphy.2014.02.016. |
[12] | J. Ophir, I. Cespedes, H. Ponnekanti, Y. Yazdi and X. Li, Elastography: A quantitative method for imaging the elasticity of biological tissues, Ultrason. Imaging 13: (2) ((1991) ), 111–134. doi:10.1177/016173469101300201. |
[13] | T. Muraki, H. Ishikawa, S. Morise, N. Yamamoto, H. Sano, E. Itoi , Ultrasound elastography-based assessment of the elasticity of the supraspinatus muscle and tendon during muscle contraction, J. Shoulder Elbow Surg. 24: (1) ((2015) ), 120–126. doi:10.1016/j.jse.2014.04.012. |
[14] | A. Turan, M.A. Teber, Z.I. Yakut, H.A. Unlu and B. Hekimoglu, Sonoelastographic assessment of the age-related changes of the Achilles tendon, Med. Ultrason. 17: (1) ((2015) ), 58–61. doi:10.11152/mu.2013.2066.171.ayt. |
[15] | Y. Yamamoto, S. Yamaguchi, T. Sasho, T. Fukawa, Y. Akatsu, K. Nagashima , Quantitative ultrasound elastography with an acoustic coupler for achilles tendon elasticity: Measurement repeatability and normative values, J. Ultrasound Med. 35: (1) ((2016) ), 159–166. doi:10.7863/ultra.14.11042. |
[16] | A.N. Ozcan, S. Tan, N.G. Tangal, S. Ciraci, S. Kudas, S.B. Bektaser , Real-time sonoelastography of the patellar and quadriceps tendons: Pattern description in professional athletes and healthy volunteers, Med. Ultrason. 18: (3) ((2016) ), 299–304. doi:10.11152/mu.2013.2066.183.ays. |
[17] | E.E. Drakonaki, G.M. Allen and D.J. Wilson, Real-time ultrasound elastography of the normal Achilles tendon: Reproducibility and pattern description, Clin. Radiol. 64: (12) ((2009) ), 1196–1202. doi:10.1016/j.crad.2009.08.006. |
[18] | S. Wadugodapitiya, M. Sakamoto, K. Sugita, Y. Morise, M. Tanaka and K. Kobayashi, Ultrasound elastographic assessment of the stiffness of the anteromedial knee joint capsule at varying knee angles, Biomed. Mater. Eng. 30: (2) ((2019) ), 219–230. doi:10.3233/BME-191046. |
[19] | T. Shiina, N. Nitta, E. Ueno and J.C. Bamber, Real time tissue elasticity imaging using the combined autocorrelation method, J. Med. Ultrason. (2001) 29: (3) ((2002) ), 119–128. doi:10.1007/BF02481234. |
[20] | S. Bollen, Epidemiology of knee injuries: Diagnosis and triage, Br. J. Sports Med. 34: (3) ((2000) ), 227–228. doi:10.1136/bjsm.34.3.227-a. |
[21] | B.C. Fleming, M.J. Hulstyn, H.L. Oksendahl and P.D. Fadale, Ligament injury, reconstruction and osteoarthritis, Curr. Opin. Orthop. 16: (5) ((2005) ), 354–362. doi:10.1097/01.bco.0000176423.07865.d2. |
[22] | K.D. Brandt, E.L. Radin, P.A. Dieppe and L. van de Putte, Yet more evidence that osteoarthritis is not a cartilage disease, Ann. Rheum. Dis. 65: (10) ((2006) ), 1261–1264. doi:10.1136/ard.2006.058347. |
[23] | L.A. Whiteside, Soft tissue balancing: The knee, J. Arthroplasty 17: (4 Suppl 1) ((2002) ), 23–27. doi:10.1054/arth.2002.33264. |
[24] | H. Sasanuma, H. Sekiya, K. Takatoku, H. Takada and N. Sugimoto, Evaluation of soft-tissue balance during total knee arthroplasty, J. Orthop. Surg. (Hong Kong) 18: (1) ((2010) ), 26–30. doi:10.1177/230949901001800106. |
[25] | N. Ok, K. Agladioglu, H.R. Gungor, N. Akkaya and S. Akkaya, Strain ratio measurements of patellar and Achilles tendons with different reference regions in healthy volunteers, Ultrasound Med. Biol. 45: (8) ((2019) ), 2027–2033. doi:10.1016/j.ultrasmedbio.2019.04.025. |
[26] | C. Ewertsen, J.F. Carlsen, I.R. Christiansen, J.A. Jensen and M.B. Nielsen, Evaluation of healthy muscle tissue by strain and shear wave elastography — Dependency on depth and ROI position in relation to underlying bone, Ultrasonics 71: ((2016) ), 127–133. doi:10.1016/j.ultras.2016.06.007. |
[27] | T. Hatta, N. Yamamoto, H. Sano and E. Itoi, In vivo measurement of rotator cuff tendon strain with ultrasound elastography: An investigation using a porcine model, J. Ultrasound Med. 33: (9) ((2014) ), 1641–1646. doi:10.7863/ultra.33.9.1641. |
[28] | F. Porta, N. Damjanov, F. Galluccio, A. Iagnocco and M. Matucci-Cerinic, Ultrasound elastography is a reproducible and feasible tool for the evaluation of the patellar tendon in healthy subjects, Int. J. Rheum. Dis. 17: (7) ((2014) ), 762–766. doi:10.1111/1756-185X.12241. |
[29] | S.J. Pearson, A.S.A. Mohammed and S.R. Hussain, Patellar tendon in vivo regional strain with varying knee angle, J. Biomech. 61: ((2017) ), 45–50. doi:10.1016/j.jbiomech.2017.06.038. |
[30] | S. Aubry, J.R. Risson, A. Kastler, B. Barbier-Brion, G. Siliman, M. Runge , Biomechanical properties of the calcaneal tendon in vivo assessed by transient shear wave elastography, Skeletal Radiol. 42: (8) ((2013) ), 1143–1150, 10.1007/s00256-013-1649-9. |
[31] | L.A. Warren, J.L. Marshall and F. Girgis, The prime static stabilizer of the medical side of the knee, J. Bone Joint Surg. Am. 56: (4) ((1974) ), 665–674. doi:10.2106/00004623-197456040-00002. |


