
Frequency and chaotic analysis of pulsatile motion of blood vessel wall related to aneurysm
Abstract
BACKGROUND/OBJECTIVE:
In this research, using our proposed method, clinical measurements on the pulsatile velocity of blood vessel wall were conducted for cases with aneurysm. Furthermore, detailed analyses of frequency and attracter of trajectories of velocity of blood vessel wall were conducted. On the basis of these analyses, we tried to conduct unified clarification of the change and disturbance of frequency and wave form of pulsatile velocity of blood vessel wall caused by blood vessel diseases such as aneurysm.
RESULTS:
In the pulsation motion of blood vessel wall, vasomotion, which is a regular long periodic fluctuation of amplitude of the pulsatile velocity of blood vessel wall, was found to exist. Furthermore, the shift of its frequency into low frequency region was found to correspond well with an increase in I∗, an indicator of progressive degree of visco elasticity of blood vessel wall and it reflects the mechanical deterioration of blood vessel wall. This long periodic fluctuation of amplitude of the pulsatile velocity of blood vessel wall exists in the low frequency region that composes the frequency of the pulsatile velocity of blood vessel wall. On the other hand, wave forms in high frequency region that compose the frequency of pulsatile velocity of blood vessel wall were found to correspond well with each pulsatile velocity wave form of blood vessel wall itself and their disturbances caused by the existence of aneurysm was typically reflected in these wave forms.
CONCLUSION:
By dividing frequencies that compose the frequency of the pulsatile velocity of blood vessel wall into low and high frequency regions and conducting analyses at each region, the possibility of accurate selective detection of blood vessel diseases such as mechanical deterioration of blood vessel wall (low frequency region) and morphological change of blood vessel wall that is aneurysm (high frequency region) was indicated.
1.Introduction
Methods of noninvasive diagnosis of atherosclerosis [1–5] have been proposed and they are clinically used. However, these methods concern elastic rigidity of blood vessel wall (PWV, CAVI) [1–3], blood pressure drop between some distance of blood vessel (ABI) [4] and shape of blood vessel wall (IMT) [5] and these methods do not represent the progressive degree of inelasticity of blood vessel wall that directly reflects the mechanical deterioration of blood vessel wall. Furthermore, few researches notice irregular pulsatile motion of blood vessel wall caused by aneurysm.
On the basis of the proposed noninvasive diagnostic method using Doppler effect sensor [6,7], one of the authors has conducted analyses of the accelerated response of blood vessel wall during systolic period [6–8] and analyses of attractors on the periodic trajectories of pulsatile velocity of blood vessel wall [9,11]. Using results obtained by these analyses, the progressive degree of visco-elasticity (mechanical deterioration) of blood vessel wall and the irregular degree of pulsatile trajectory of velocity of blood vessel walls were quantified by I∗ [8–11] and entropy, S [9,11] respectively. Furthermore, a parameter estimating the disturbance of the time averaged synthesis wave form calculated by individual pulsatile wave forms of blood vessel wall, DC was proposed [12] and a noninvasive diagnostic method of atherosclerosis and aneurysm was proposed [12]. DC [12] is defined the gradient of change of multi fractal dimensions [13]. These results show that when an atherosclerosis or an aneurysm progress, periodic pulsatile trajectories of the velocity of blood vessel wall show irregular features, which results in the increase in entropy, S [9,11]. Furthermore, a frequency analysis of pulsatile wave form of the velocity of blood vessel wall was conducted [11], which showed that there are dominant frequency f1 of low frequency which takes the maximum norm and f2 of high frequency which takes the extreme value of norm [11]. Furthermore, the former was found to correspond with I∗ [8–10] which estimates the progressive degree of visco-elasticity of blood vessel wall [10] and the latter was found to concern the existence of an aneurysm [11]. In this research, all the methods mentioned above are named VISCOIR (measurement method of viscoelasticity and irregular movement of blood vessel wall). Considering blood vessel diseases being partly affected by disturbance of blood flow under pulsatile pressure conditions, there are some proceeding researches of analyzing disturbance of the trajectory of blood flow fluctuation based on chaos theory [14]. However, from the view point of blood vessel diseases, it is necessary to notice the disturbance of motion of blood vessel wall under pulsatile pressure conditions. Furthermore, the specification of pulsatile frequency and the quantification of disturbance of pulsatile wave form of blood vessel wall are important from the view point of not only the clarification of phenomenological mechanism but also the establishment of noninvasive diagnosis of the blood vessel diseases. In this research, on the basis of previous work conducted by one of the authors [6–12], more detailed analyses of pulsatile frequency of pulsatile motion of blood vessel wall was conducted and these frequencies were related to the blood vessel diseases.
Fig. 1.
Drawing method of trajectory based on attractor analysis.
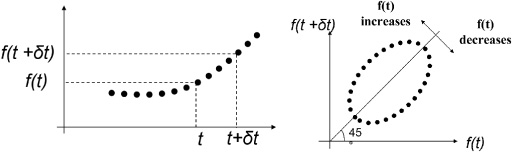
Fig. 2.
Pulsatile velocity and its attracter analysis of trajectories of blood vessel walls under pulsatile pressure conditions during systolic process. T is periodic time. t is time. Δt = 30 [ms]. X (t) is expansion velocity of blood vessel wall during systolic process.
![Pulsatile velocity and its attracter analysis of trajectories of blood vessel walls under pulsatile pressure conditions during systolic process. T is periodic time. t is time. Δt = 30 [ms]. X (t) is expansion velocity of blood vessel wall during systolic process.](https://content.iospress.com:443/media/bme/2019/30-2/bme-30-2-bme191048/bme-30-bme191048-g002.jpg)
2.Background of the research
Some of the authors have conducted attracter analysis on the trajectory of periodic velocity of blood vessel wall measured clinically and noninvasively under pulsatile pressure conditions [9,11]. The drawing method of trajectory of pulsatile blood vessel wall by the attracter analysis is shown in Fig. 1. Clinical examples of measurement results of periodic velocity and its trajectories of blood wall are shown in Fig. 2 [9,11]. In Fig. 2, X (t) is value of velocity of blood vessel wall detected by Doppler effect sensor at the time of t. Δt is 30 [ms]. Occurrence mechanism of these trajectories of the periodic velocity of blood vessel wall for normal, atherosclerosis and aneurysm are as follows. The trajectory of attractor is the time sequential characteristics of the relationship between X (t + Δt) and X (t) by plotting vertical and horizontal axes respectively as shown in Fig. 1. For the case of a sharp wave form, such as normal case (Fig. 2(a)), since the time sequential changing value of X (t) is large, |X (t + Δt) − X (t)| becomes large which results in decrease in the aspect ratio between the major and minor axis of the elliptic trajectory, which is the large length of minor axis. On the other hand, for the case of a blunt wave form with low gradient value of X (t) in the increase and decrease processes of the wave form such as atherosclerosis (Fig. 2(b)), since the time sequential changing value of X (t) is small, |X (t + Δt) − X (t)| becomes small, which results in increase in the aspect ratio between the major and minor axis of the elliptic trajectory, that is small length of minor axis (semi ellipse trajectory). For the case of aneurysm (Fig. 2(c)), since the wave form has two phase one, local increase and decrease behaviors in the time sequential characteristics of X (t) are caused, which results in small circuit loop. These behaviors appear in Figs 2(a), (b) and (c) respectively. On the basis of the theory mentioned above, the following results were found.
These results showed that pulsatile wave forms of the velocity of a normal blood vessel wall draw ellipse trajectories, named the limit cycle as shown in Fig. 2(a). In these trajectories, one ellipse loop corresponds with one pulsatile trajectory and it does not pass the same way but passes through several different ways and returns back to the original loop, that is, a longer periodicity behavior than that of pulsatile behavior itself (i.e. vasomotion of blood vessel wall). Vasomotion was defined for the long periodic fluctuation of blood flow [15,16], however there are only a few papers on the vasomoton of pulsatile motion of artery except that concern ductus arterisus [17]. With increase in progressive degree of atherosclerosis, the occurrence degree of visco elasticity increases and the period of pulsatile wave forms become longer which results in the ellipse trajectory changes into a semi ellipse one (aspect ratio of two axes of ellipse becomes larger) and disturbance of the loop (disturbance of vaso motion) increases [9]. It was proved as the increase in entropy of the trajectory of pulsatile motion of blood vessel wall (Fig. 2(b)) [9,11]. Furthermore, due to the change of morphology of blood wall such as an aneurysm, the disturbance of pulsatile wave form of the velocity of blood vessel wall itself (two phase wave form) [9,11] was caused which results in the appearance of small circuit loop in the trajectory of periodic velocity of blood vessel wall which corresponds with a two phase wave form (Fig. 2(c)) [9,11]. The change and disturbance of these semi ellipses and small circuit loops in these trajectories correspond with those of a pulsatile period and its wave form of blood vessel wall respectively [9,11]. A wave form with longer period, that is, low frequency results in a semi ellipse trajectory [9,11]. Furthermore, the occurrence degree of visco elasticity of blood vessel wall and the existence of aneurysm were found to correspond with the appearance and its changing characteristics of f1 and f2 respectively that are extreme values in the low and high periodic regions of frequency distribution of pulsatile velocity of blood vessel wall obtained by wavelet transform [11] (Fig. 3). That is, the change and disturbance of pulsatile frequency and waveform of velocity of blood vessel wall were shown to be caused by blood vessel diseases [8,9,11]. However, the united clarifications of the change and disturbance of pulsatile behaviors of blood vessel wall remain to be conducted. In this research, using our proposed method, clinical measurements were conducted for cases with aneurysm. Furthermore, detailed analyses of frequency and attracter of trajectories of velocity of blood vessel wall were conducted. On the basis of these analyses, we tried to conduct unified clarification of the change and disturbance behaviors of pulsatile velocity of blood vessel wall caused by blood vessel diseases.
Fig. 3.
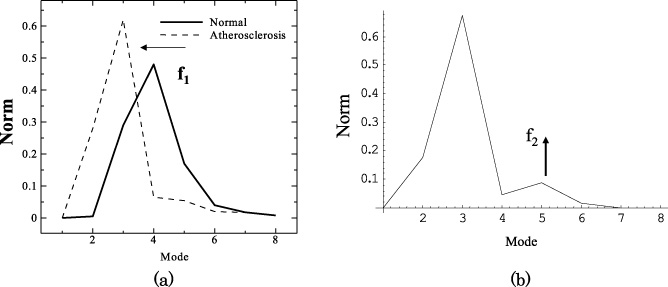
The characteristic of norm distribution of the output wave form were shown for cases of normal, atherosclerosis and aneurysm. Principal frequency, f1 was found to appear (a) and it was found to decrease with progression of atherosclerosis (a). When an aneurysm appeared, a new vibration wave was found to appear in the higher frequency mode, f2 as shown in (b).
3.Methods
This study was approved by the ethics committee of the Graduate School of Medicine, Tohoku University. The targets of clinical measurements are 151 consecutive patients hospitalized for surgical treatment in the Division of Cardiovascular Surgery, Graduate School of Medicine, Tohoku University from March 28th to July 13th 2013.
In this research, parts of these clinical data were used for this analysis. The indexes of I∗ [8,9,11] and Dc [12] that represent the occurrence degree of visco elasticity [10] and the disturbance of the cycle averaged synthetic wave form of fifteen wave forms of pulsatile velocity of blood vessel wall were measured using a Doppler effect sensor of TRY-1 [6–9] (21600ZX00440000, Taiyo Denshi Co. Ltd., Miyagi, Japan) and analyzed [9,11]. Dc is composed of parts of entropy, S which corresponds with the disturbance of periodic trajectories of the velocity of blood vessel wall. Furthermore, on the basis of the method of separated analysis of high and low frequency groups of fifteen whole wave forms of pulsatile velocity of blood vessel wall by the wavelet transformation [11], frequencies of pulsatile velocity of blood vessel wall were divided into eight modes and the norm distribution was obtained. Previous results of this analysis are shown in Fig. 3 as an example [11]. This result showed that the site of maximum value of norm exists in the region of mode 2. With an increase in I∗, it shifts from mode 4 to mode 2 through mode 3. Therefore, mode 2 and mode 3 are defined as low frequency region. Furthermore, an extreme value exists around the region of mode 5 (part of high frequency region). The former was found to correspond well with the parameter of progressive degree of visco elasticity, I∗ [8–10] and the latter was found to well correspond with that caused by disturbance of pulsatile motion of blood vessel wall due to existence of an aneurysm [11]. In this research, total frequency region was divided into mode 2 and 3 in low frequency region and mode from 4 to 7 in high frequency region and the time sequential wave forms of low frequency and that of high frequency were obtained by inverse wavelet transformation. Furthermore, using these wave forms in low and high frequency, analyses of these attractors were conducted and these time sequential trajectories were analyzed. Detailed method of analysis were similar as previous literatures by some of the authors [11].
The study was admitted as a US patent: US, 9,17,400B2 [18]. Mode 1 and 8 were eliminated from this analysis, since these modes were not so much involved in pulsatile wave forms [11].
4.Analysis of periodic wave forms of clinically observed pulsatile velocity of blood vessel wall
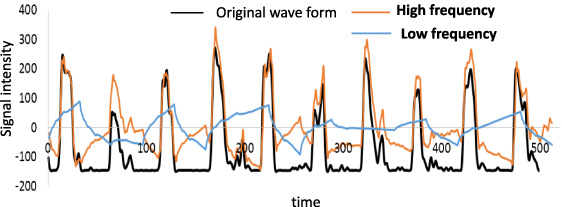
Using the method mentioned in the previous section, results of wavelet transformation of clinically measured examples are shown in Fig. 4. Eliminating modes 1 and 8, which are not sensitive to the analysis, wave forms were divided into low frequency wave (modes 2 and 3) and high frequency wave (modes 4-7). In low and high frequency wave forms that compose original wave forms, wave forms in low frequency show long period wave forms different from original pulsatile wave forms, however, high frequency wave forms show the same frequency wave forms as original pulsatile each wave form. In Fig. 4, time is defined as non-dimensional time divided into 512 which correspond with 512 dimensional data of wavelet transformation including interpolated data. Time of 512 corresponds with the sampling time of 10.24 sec.
Fig. 4.
Original wave form and its high and low frequency components obtained by wavelet transformation. Time is defined as non-dimensional time divided into 512 which corresponds with 512 dimensional data of wavelet transformation including interpolated data. Time of 512 corresponds with the sampling time of 10.24 sec.
A long period wave form connected with peak points of original wave forms (vasomotion) is shown by the dotted line in Fig. 5. Comparison of wave forms in low frequency as shown in Fig. 4, with those of vasomotion as shown in Fig. 5, was shown in Fig. 6. Both wave forms were found to have almost equal period.
Fig. 5.
Original wave form and vasomotion, which is a wave form that connects with peak points of original waveform. Peak points include not only those with amplitude for each wave form but also those with larger than half value of amplitude for each wave form. Time is defined as non-dimensional time divided into 512 which corresponds with 512 dimensional data of wavelet transformation including interpolated data.

Fig. 6.
Comparison of wave form of low frequency with that of vasomotion that connects with peak points of original wave form. Peak points include not only those with amplitude for each wave form but also those with larger than half value of amplitude for each wave form.
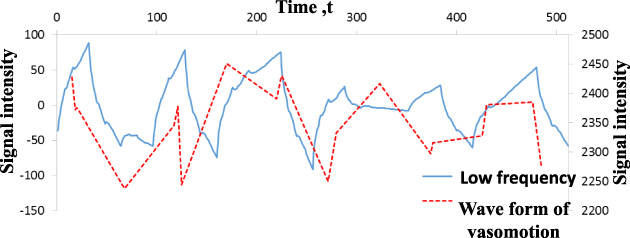
Fig. 7.
Attracter analysis of its trajectory for each wave form (a) Original wave form, (b) High frequency component of wave form, (c) Low frequency component of wave form and (d) Vasomotion that connects with peak points of original wave form.
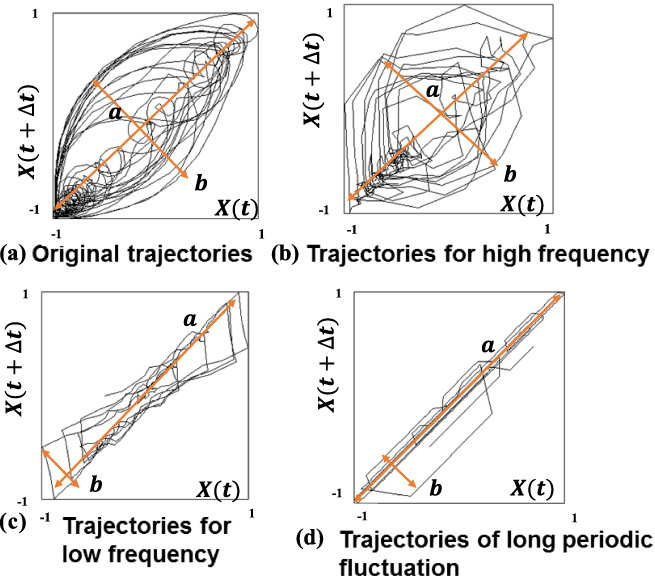
In pulsatile trajectories of original pulsatile wave forms, those in low and high frequencies and those of vasomotion were separately obtained by analysis of attractor as shown in Fig. 7. From the view point of aspect ratio of trajectory a/b (Fig. 7), these results showed that the trajectories of time sequential fluctuation of wave forms in low frequency that compose a part of original wave forms was found to take higher value of aspect ratio and to well correspond with that of vasomotion, that is, flat ellipse with high aspect ratio of a/b = 5.3 for low frequency and 5.7 for vasomotion. High aspect ratio is caused at the trajectory of low frequency [9,11] and it is common feature based on Chaos theory [9,11]. This means that components of low frequency of whole wave form of pulsatile blood vessel wall well corresponds with that of vasomotion. On the other hand, the trajectories of time sequential fluctuation of wave forms in high frequency that composes a part of original wave forms was found to take smaller aspect ratio and to well correspond with that of original pulsatile wave form. However, the aspect ratio of trajectory in the region of high frequency becomes a little smaller as compared with that of original wave form in Fig. 7, that is a/b = 1.68 for high frequency wave form and 2.15 for original wave form. This will be due to the fact of eliminating the components of modes in low frequency region with high aspect ratio from that of original wave form.
From the results mentioned above, separating method of pulsatile frequency of blood vessel wall between low and high frequency is found to be the most useful method to accurately detect vasomotion and each pulsatile wave form of blood vessel wall.
5.Detection of aneurysm by extraction of wave forms of high frequency
As is mentioned in Section 2, existence of an aneurysm was found to cause a two phase wave form and a small circuit loop in pulsatile trajectories of blood vessel wall [9,11]. However, in clinical cases, even though an aneurysm exists, there are some cases when a two phase wave form and a small circuit loop in pulsatile trajectories of blood vessel wall do not typically appear. For such cases, by eliminating wave forms of low frequency, extractions of wave forms of high frequency were conducted and their trajectories were analyzed. Trajectories of original wave forms with and without aneurysm are shown in Figs 8(a) and (b). Trajectories of wave forms of high frequency extracted from pulsatile original wave forms of blood vessel wall with and without aneurysm are shown in Figs 9(a) and (b). In trajectories of original wave forms with aneurysm as shown in Fig. 8(a), a typical two phase wave form or a small circuit loop in pulsatile trajectories were not detected. However, in extracted wave forms of high frequency and their trajectories as shown in Fig. 9(a), typical disorders of wave forms during the decreasing process of velocity of blood vessel wall were observed and correspondingly, in their pulsatile trajectories, concentration of small circuit loops uniquely observed in an aneurysm were found out.
Fig. 8.
Original wave form and its trajectory by attracter analysis (A clinical example of not being feasible to judge the existence of aneurysm by its attracter analysis of the trajectory alone.)
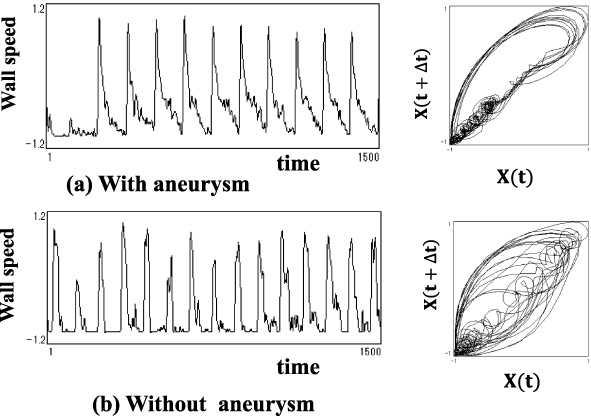
Fig. 9.
High frequency wave components of the original wave form in Fig. 8 and its trajectories by attracter analysis. Definite local circuit loop appears as compared with that of original wave form.
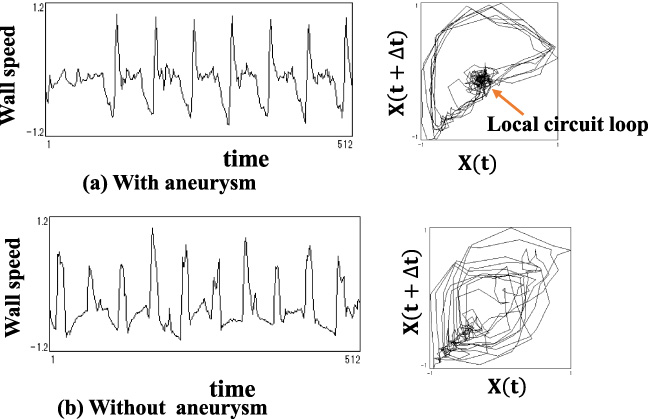
On the other hand, in original wave forms without aneurysm as shown in Fig. 8(b), disorders of wave forms and small circuits of pulsatile trajectories are concentrated at the process of minimum pulsatile velocity of blood vessel wall, however, in extracted wave forms and their trajectories in high frequency region as shown in Fig. 9(b), their disorders and concentration of small circuit loops were typically diminished.
6.Discussion
The frequency distribution of low frequency f1 and high frequency f2 takes the extreme value at the site of modes 2-3 and 5 respectively as shown in Fig. 3. Furthermore, f1 was found to show a well inverse correlation with I∗ that is the parameter of progressive degree of visco elasticity of blood vessel wall [8–10], that is, deterioration of mechanical properties of blood vessel wall [10].
From the results mentioned above, a reasonable long periodic motion of vasomotion was found to be multiplied to the pulsatile velocity of blood vessel wall itself and change of this long periodicity was found to concern with progressive degree of visco elasticity of blood vessel wall (mechanical deterioration of blood vessel wall). Furthermore, disorders of pulsatile wave forms in high frequency region was found to reflect that of disorders of pulsatile wave forms of blood vessel wall itself due to disorders of blood flow caused by existences of aneurysm.
From the results mentioned above, in the time sequential change of pulsatile motion of blood vessel wall, the possibility of a much more accurate detection of the existence of aneurysm was indicated by separated estimation of pulsatile frequency into low and high frequency.
Therefore, as a future research, by reasonable combining I∗-Dc [9,10] and norm analysis method [11] with our proposed frequency analysis method, high accuracy of sensitivity and specificity on the diagnosis of the existence of aneurysm will be realized. The validity of clinical application should be assured which is a future problem of this research.
7.Conclusions
In pulsatile motion of normal blood vessel wall, long periodic fluctuation of amplitude of the pulsatile velocity of blood vessel wall, that is, vasomotion, was found to exist. Furthermore, transition of the frequency of this long periodicity into more lower frequency region was found to correspond with increase in I∗, that is, progressive degree of visco elasticity of blood vessel wall, that concerns with mechanical deterioration of blood vessel wall. This long periodic frequency exists in the low frequency region of whole pulsatile frequencies of velocity of blood vessel wall is shown in previous literature [8].
Wave forms of pulsatile velocity of blood vessel wall in high frequency region were found to correspond with that of blood vessel wall itself of which vasomotion was eliminated. Disorders of wave forms of pulsatile velocity of blood vessel wall due to existence of aneurysm were reflected to these wave forms in high frequency region.
By dividing frequencies that compose the frequency of the pulsatile velocity of blood vessel wall into low and high frequency regions and conducting analyses at each region, the possibility of accurate selective detection of blood vessel diseases such as mechanical deterioration of blood vessel wall (low frequency region) and morphological change of blood vessel wall that are aneurysm (high frequency region) was indicated.
References
[1] | J.R. Womersley, Oscillatory motion of a viscous liquid in a thin-walled elastic tube, I: The linear approximation for long waves, Phil. Mag. 46: ((1955) ), 199–221. |
[2] | C. Vlachopoulos, K. Aznaouridis and C. Stefanadis, Prediction of cardiovascular events and all-cause mortality with arterial stiffness: A systematic review and meta-analysis, J. Am. Coll. Cardiol. 55: ((2010) ), 1318–1327. |
[3] | K. Shirai, J. Utino, K. Otsuka and M. Takata, A novel blood pressure – independent arterial wall stiffness parameter; cardio-ankle vascular index (CAVI), J. Atheroscler. Thromb. 13: ((2006) ), 101–107. |
[4] | J.I. Weiltz, Diagnosis and treatment of chronic arterial insufficiency of lower extremities, a critical review, AHA Medical/Scientific Sttements 1996. |
[5] | P. Pignoli, Intimal plus medical thickness of the arterial wall: A direct measurement with ultrasound imaging, Circulation 74: ((1986) ), 1399–1406. |
[6] | Yokobori A.T.Jr, T. Ohkuma, H. Yoshinari, T. Yokobori, H. Ohuchi and S. Mori, Accoustical imaging and processing of blood vessel and related materials using ultrasound Doppler effect, Bio-Medical Mater. Eng. 1: ((1991) ), 127–136. |
[7] | Yokobori A.T.Jr, T. Ohkuma, H. Sasaki, H. Yoshinari, T. Yokobori, H. Ohuchi and S. Mori, Algorithm of the non invasive diagnosis method of the atherosclerosis by Ultrasound Doppler effect, Bio-Medical Mater. Eng. 4: ((1994) ), 7–86. |
[8] | A.T. Yokobori, M. Ichiki, H. Ohuchi, T. Kobayashi, T. Satoh and Y. Kinoshita, The proposal of non invasive quantitative diagnostic method of the atherosclerosis and the clarification of organ correlation of atherosclerosis and oxygen metabolism, Bio-Medical Mater. Eng. 14: ((2004) ), 241–249. |
[9] | A.T. Yokobori, M. Owa, M. Ichiki, T. Satoh, Y. Ohtomo, Y. Satoh, S. Ohgoshi, Y. Kinoshita and S. Karino, The analysis and diagnosis of unstable behavior of the blood vessel wall with an aneurysm based on noise science, J. Atheroscler. Thromb. 13: ((2006) ), 163–174. |
[10] | A.T. YokoboriJr, T. Ohmi, R. Monma, Y. Tomono, K. Inoue, M. Owa, N. Mochizuki and H. Yamashita, Correlation between the characteritics of acceleration and visco elasticity of artery wall under pulsatile flow conditions (physical meaning of I∗ as a parameter of progressive behaviors of atherosclerosis and arteriosclerosis), Bio-Medical Mater. Eng. 23: ((2013) ), 75–91. |
[11] | A.T. YokoboriJr, M. Ichiki, Y. Tomono, D. Tanaka, T. Kanno, R. Sugiura, Y. Ohtomo, M. Ito and S. Ohgoshi, Frequency response of blood vessel wall with atherosclerosis and aneurysm, Bio-Medical Mater. Eng. 21: ((2011) ), 171–177. |
[12] | K. Honda, A.T. YokoboriJr, M. Ichiki, S. Karino, Y. Ohtomo and Y. Satoh, Non- invasive estimation of blood vessels by Ultrasonic Doppler effect based on the concept of Multi-Fractal, in: The 39th Ann. Meet. of the Tohoku Branch of Japanese Mech. Engineer. 041-1, 2004, pp. 178–179, (in Japanese). |
[13] | A.T. YokoboriJr, S. Sakai, K. Yamagiwa and N. Yoshida, Quantitative characterization of fracture surface of full lamellar TiAl under high temperature creep and fatigue conditions on the basis of fractal concept, Strength, Fracture and Complexity: An International Journal 1: ((2003) ), 19–29. |
[14] | H. Matsumoto, K. Mabuchi, K. Yagyu and Y. Matsumoto, Dynamic topology of coronary blood flow, Kokyu to Jyunkan 47: (12) ((1999) ), 1265–1271, (in Japanese). |
[15] | T. Sakurai and N. Terui, Effects of sympathetically induced vasomotion on tissue-capillary, Am. J. Physiol. Heart Circ. Physiol. 291: ((2006) ), 1761–1767. |
[16] | R.K. Pradhan and Chakravarthy V.S., Informational dynamics of vasomotion in microvascular networks: A review, Acta Physiol. 201: ((2011) ), 193–218. |
[17] | M. Vucovich, N. Ehinger, S. Poole, F. Lamb and J. Reese, Spontaneous rhythmic contractions (vasomotion) of the isolated, pressurized ductus arteriosus of preterm, but not term, fetal mice, Ej Neonatol. Res. 2: ((2013) ), 13–24. |
[18] | United states patent Yokobori et al., patent No. US9,177,400 B2, Nov.3 2015: Program medium, and device for determining vascular disease. |


