
Numerical analysis of the effects of padded pelvic belts as a treatment for sacroiliac joint dysfunction
Abstract
BACKGROUND:
Pain related to the sacroiliac joint (SIJ) accounts for low back pain in 15%–30% of patients. One of the most common treatment options is the use of pelvic belts. Various types of pelvic belts exist; however, the mechanisms underlying treatment and their effectiveness remain unclear to date.
OBJECTIVE:
To analyze stress distribution in the pelvis when a pelvic rubber belt or a padded pelvic belt is applied, to assess the effectiveness of treatment from a numerical biomechanical perspective.
METHODS:
The pressure distribution at the pelvic belts was measured using a device and subsequently modeled with the finite element method of a pelvis with soft tissues. The stress environment when wearing a pelvic belt in a double-leg stance was simulated.
RESULTS:
With the application of pelvic belts, the innominate bone rotated outward, which was termed an out-flare. This caused the SIJ to compress and cause reduction in sacrotuberous, sacrospinous, interosseous, and posterior sacroiliac ligament loading. Padded pelvic belts decreased the SIJ displacement to a greater extent than in pelvic rubber belts.
CONCLUSION:
Pelvic belts aid in compressing the SIJ and reduce its mobility.
1.Introduction
Sacroiliac joint (SIJ) dysfunction is considered to account for approximately 15%–30% of symptoms in patients with low back pain [1–3]. The SIJ is located between the sacrum and ilium and serves as a shock absorber that receives and aids in dissipating the impact of the trunk and lower limbs [4,5]. This joint is supported by tough ligaments and possesses low mobility compared to that of other synovial joints. Among the movements observed within the SIJ are nutation and counter-nutation, which are forward and backward rotations of the sacrum on the sagittal plane relative to the ilium, respectively. The SIJ is considered highly stable in the counter-nutation position [6]. Unexpected force or repeated impact is believed to cause joint misalignment and instability and provoke pain arising from the SIJ [7,8]. Typical conservative (non-surgical) treatment strategies to relieve the painful SIJ include pelvic belts [9,10], injection of local anesthetics into the joint [11,12] and physical therapy [6,13]. Surgical treatment aims to fuse the SIJ, using metal implants [14,15]. Pelvic belts and SIJ fixations are used to improve joint stability by minimizing the extent of joint motion [16,17]. Some researchers have evaluated SIJ fixation using various implants [14,15] and the effects of such treatments on adjacent joints [18,19]. However, pelvic belts have not been comprehensively investigated in the context of SIJ dysfunction. A study in healthy young women indicated that pelvic belts help reduce SIJ laxity [20]. Moreover, mathematical analysis indicates that compression force exerted on the anterior superior iliac spine (ASIS) increased SIJ compression and reduced muscle activity [21]. These reports imply that if the SIJ is fixed with pelvic belts, stability would be enhanced, however, the effects based on the type and tightening method of the pelvic belts remain poorly understood. It has been reported that pelvic belts with a textured sacral pad may enhance the sensory performance of the hip joint and improve motor control [22]. Compressive pelvic belts may also be beneficial in the treatment of SIJ dysfunction.
This study aimed to analyze the effect of pelvic rubber belts or padded pelvic belts on stress distribution within the pelvis and clarify the effectiveness of such treatments that bilaterally compress the posterior superior iliac spine (PSIS). The pressure distribution was assessed in the pelvic region when pelvic belts were applied. Finite element analysis of the pelvic model with soft tissues was conducted. It was hypothesized that padded pelvic belts would more effectively compress the SIJ and thus reduce tension of the surrounding ligaments.
2.Method
2.1.Pelvic model and mesh generation
A finite element model of the pelvis, including soft tissues (Fig. 1), was created based on the total human model for safety (THUMS Version 4.02 AM50 pedestrian model, 175 cm, 77 kg, Toyota Central R&D Labs, Inc. & Toyota Motor Corporation) using SpaceClaim 2021R1 (Cybernet Systems Co., Ltd., Tokyo, Japan). This model comprises three types of tissue: bone, cartilage, and soft tissues (including skin, fat, muscle, etc.). Bones were modeled for the 3rd, 4th, and 5th lumbar vertebrae, sacrum, both innominate bones, and proximal ends of both femurs. Cartilage tissues, L3-4 disc to L5-S1 disc, SIJ cartilage and hip joint cartilage, were created based on the shape of the pelvic bone models. Soft tissue was defined as the distance between the body surface and the pelvic model composed of bone and cartilage. A total of 210 spring elements were added in place of the ligaments around the pelvis [23], and 12 types of ligaments were modeled (Fig. 2). The ligaments were defined as ‘tension only’ and could not sustain the bones in the case of compressive load. ANSYS 2021R1 (Cybernet Systems Co., Ltd., Tokyo, Japan) was used for the analysis and a mesh was created using tetrahedral elements each consisting of 10 nodes (Fig. 2). Consequently, the total number of elements and nodes were 264,938 and 442,001, respectively. The average element quality was 0.751, indicating good mesh quality.
Fig. 1.
Finite element model of the pelvis including soft tissue, displayed on whole model (left) and hidden the soft tissue (Right) with anterior views. The scale bar: 100 mm. S: superior, L: left.
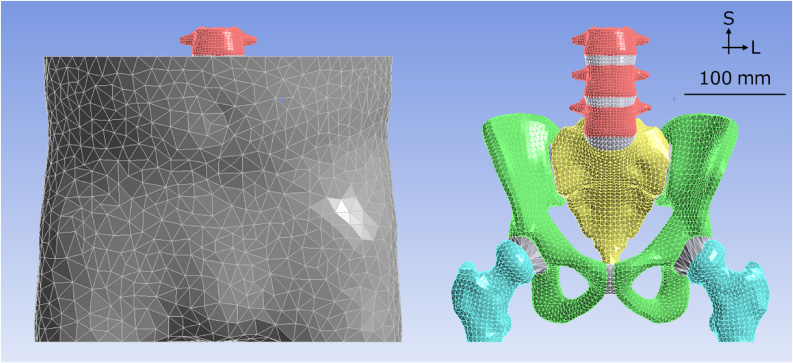
Fig. 2.
The positions and names of the pelvic ligaments modelled in this study, in a meshed pelvis model with anterior (left) and posterior (right) views. The ligaments are the anterior longitudinal ligament (LLA), anterior sacroiliac ligament (ASL), iliolumbar ligament (IL), inguinal ligament (INL), long posterior sacroiliac ligament (LPSL), obturator membrane (MO), posterior longitudinal ligament (LLP), posterior sacroiliac ligament (PSL), pubic ligament (PL), interosseous sacroiliac ligament (ISL), sacrospinous ligament (SS) and sacrotuberous ligament (ST). The scale bar: 60 mm. S: superior, L: left, R: right.
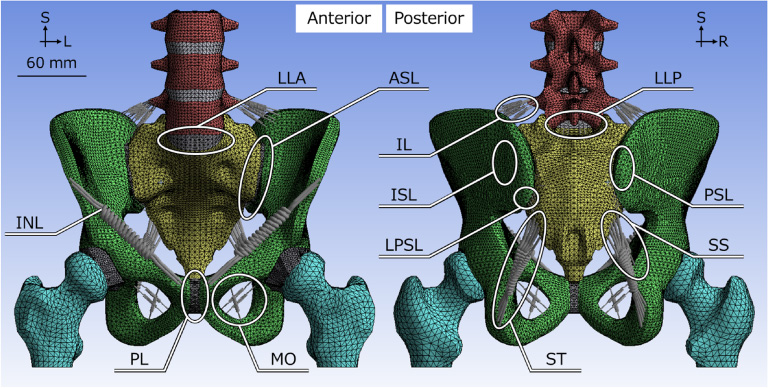
Table 1
Material properties for the finite element model. C10, C01 and C11 mean the parameter of Mooney-Rivlin models for hyper-elastic bodies. Material properties for cartilage were used for the cartilage model except for SIJ and symphysis cartilage.
| Material | Young’s modulus [MPa] | Poisson’s ratio [-] | C10 [MPa] | C01 [MPa] | C11 [MPa] |
| Bone [24] | 11,000 | 0.2 | — | — | — |
| Cartilage | 150 | 0.2 | — | — | — |
| SIJ cartilage | — | — | 4.1 | 0.41 | 0 |
| Symphysis cartilage | — | — | 0.1 | 0.45 | 0.6 |
| Soft tissue [25] | — | — | 0.0855 | 0.02138 | 0 |
| Ligament | 350 | — | — | — | — |
2.2.Material properties
Bones were defined as elastic bodies, cartilage as elastic or hyper-elastic bodies, and soft tissues as hyper-elastic bodies. For simplicity, all the tissues were defined as uniformly isotropic materials. The results obtained by Wirtz et al. [24] and Majumder et al. [25] were used to determine the material properties (Table 1). The following strain energy density function, W, was introduced, which is used for a hyper-elastic body, using the Mooney-Rivlin model of a complete non-compressional body. C10, C01, and C11 are material constants, and I1 and I2 are the first and second invariants of the distortion, respectively.
2.3.Boundary conditions
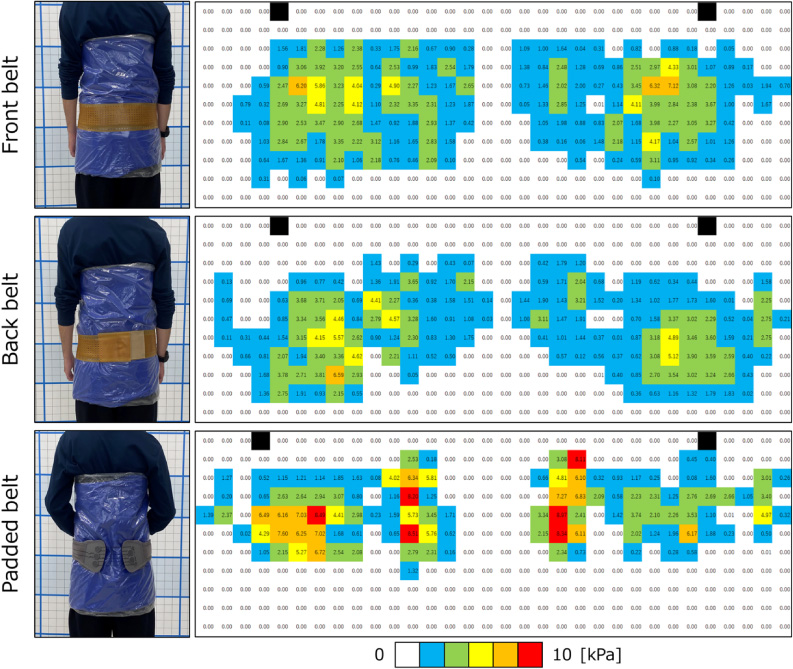
A pelvic rubber belt (Balance Control Band, Hakkosha Co., Ltd., Tokyo, Japan) (Fig. 3a) and a padded belt on the lumbar region (Smartspine SI Support, Ottobock SE & Co. KgaA, Duderstadt, Germany) (Fig. 3b) was investigated. The pelvic rubber belt was tightened forward (termed “front belt”) and backward (termed “back belt”). For the padded belt (termed “padded belt”), two pads were placed around the lateral sides of the PSIS bilaterally. The pressure distribution was measured under the three conditions. A body pressure distribution measuring device (FSA, Takano Co., Ltd., Nagano, Japan) was used to measure the distribution of the tightening pressure of the pelvic belts. A healthy participant (a 23-year-old man, 182 cm body height, 70 kg body weight) volunteered for this study. Pressure sensors were placed on the body, and the pelvic belts were wrapped around the device (Figs. 4 and 5). Before conducting the measurement, both ASISs were palpated to position the pressure sensors. After wrapping the pelvic belt, the participant stood on both legs and 22 frames were measured for 6.8 s in a sufficiently stable state. The average value of 20 frames, excluding the maximum and minimum values, was used for further analysis.
Fig. 3.
(a) Sample of the pelvic rubber belt and (b) padded pelvic belt used in this study.
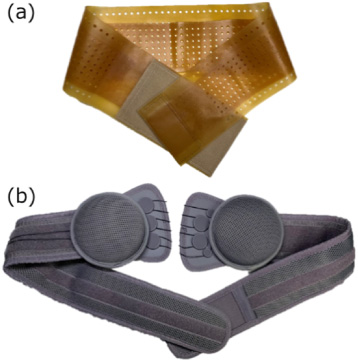
Fig. 4.
Scheme of pressure measurement in this study. (Left) A pressure measuring device was placed on a body and the pelvic belts were wrapped on the device. Blue: a pressure measuring device. Orange: pelvic belt. (Right top) Pressure distribution on the pelvic belts and (right bottom) straightly opened results.
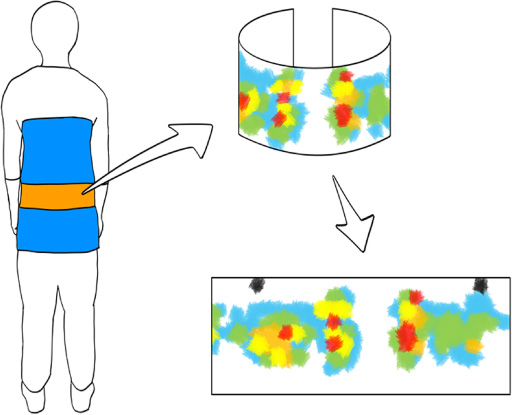
Fig. 5.
Pelvic belt types and related pressure measurements in-vivo in a setup on the volunteer (left row), and pressure distribution on the pelvic belts (right row). Black areas indicate the anterior superior iliac spines as reference marks.
The soft tissue of the pelvic model was divided into 32 areas in the circumferential direction and 11 areas in the vertical direction at approximately 500 mm2, and the obtained pressure was applied to the surface of the soft tissue based on the position of the ASISs (Fig. 6a).
Fig. 6.
(a) The red arrows indicate the places and directions the pressures are applied (trimetric view), and (b) the orange arrows indicate where the loads are applied (anterior view). The scale bar: 60 mm. S: superior, L: left, A: anterior.
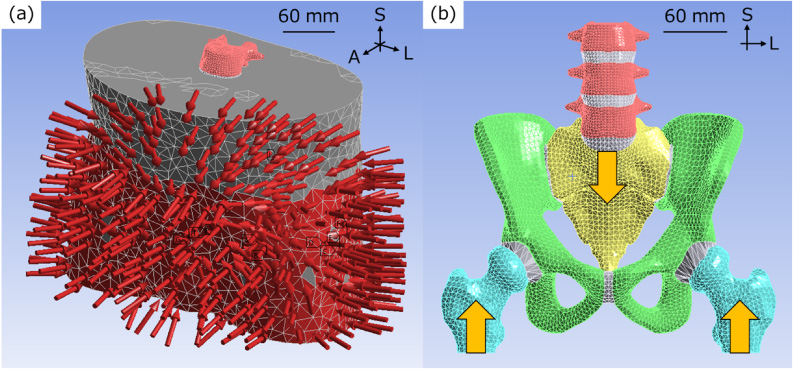
Four conditions were analyzed, including three types of pelvic belts and the control condition without a pelvic belt attached. To simulate the double-leg stance, a vertical upward surface load of 300 N and a vertical downward surface load of 600 N were applied to the lower ends of both femurs and base of the sacrum, respectively (Fig. 6b). The anterior aspect of the second sacral spine [11] and both entire femora were fixed in space to reproduce sacral motion and reduce the computational load by limiting unnecessary movement of the femur, respectively. Because the soft tissues were not displaced in the vertical direction by tightening of the belt, vertical displacement of the cross-sections of the soft tissues was suppressed. The contact on each surface was defined as follows: the contact surfaces of bone and soft tissue were not separated; the contact surfaces of the SIJ cartilage and bone were rough; and the other contact surfaces were bonded. A lack of separation contact means that the contact surfaces cannot be detached and can slide frictionlessly. Rough contact was defined as contact surfaces with detached contact but no ability to slide.
2.4.Analytical parameters
The minimum principal strain of the soft tissue and pelvis, horizontal displacement of the innominate bone, minimum principal stress of the SIJ, displacement of the SIJ, and the ligament loading force were investigated. The ligament loading force is the sum of the maximum elastic forces of the spring elements, representing each ligament.
2.5.Model validation
The adopted type of validation was literature, a comparison of yielded results with values on published literature [26]. The maximum and mean SIJ displacements, mean strain of the sacrotuberous and sacrospinous ligaments, and ligament load rate in the control condition were used for validation.
3.Results
3.1.Horizontal displacement of the innominate bone
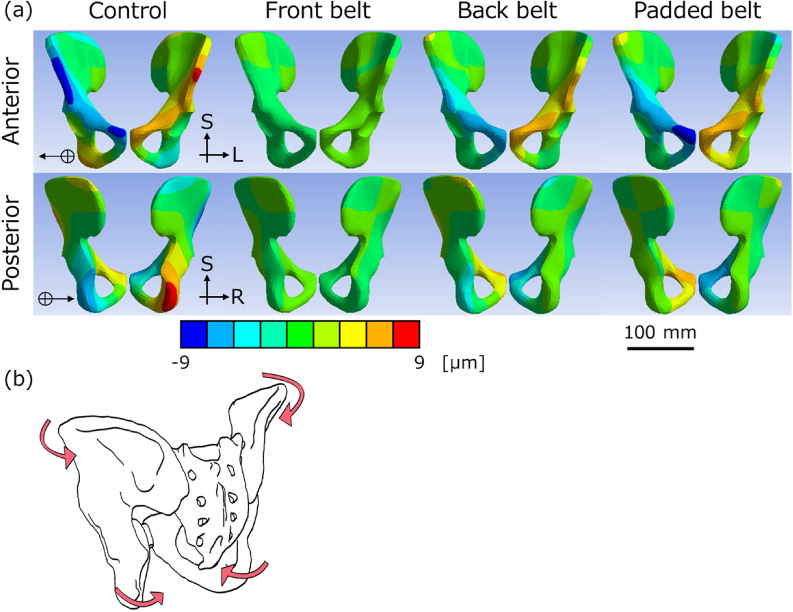
When both types of pelvic belts were applied, the innominate bones rotated outward relative to the control (Figs. 7a and b). In the control group, the iliac crest moved inward, whereas in the pelvic belt group, the iliac crest was scarcely displaced. The extent of the inward displacement with pelvic belts decreased by 2. 99 μm to 8. 11 μm (−2%–52% compared to the control). The front belt (right: 8. 11 μm, −1%; left: 5. 30 μm, 15%) and padded belt (right: 6. 85 μm, 15%; left: 6. 37 μm, −2%) had similar changes, and the back belt (right: 6. 73 μm, 16%; left: 2. 99 μm, 52%) exhibited low change. Focusing on the displacement of the ischial limb, the control was displaced outward and the pelvic belt models were displaced inward.
Fig. 7.
(a) Horizontal displacement of the innominate bones shown from an anterior (1st line) and posterior (2nd line) view. The positive directions are the directions that the arrows point to, to right on the models. The scale bar: 100 mm. S: superior, L: left, R: right. (b) Scheme of pelvic deformation. The innominate bone was rotated outward by using pelvic belts.
3.2.Minimum principal stress distribution within the sacroiliac joint cartilage
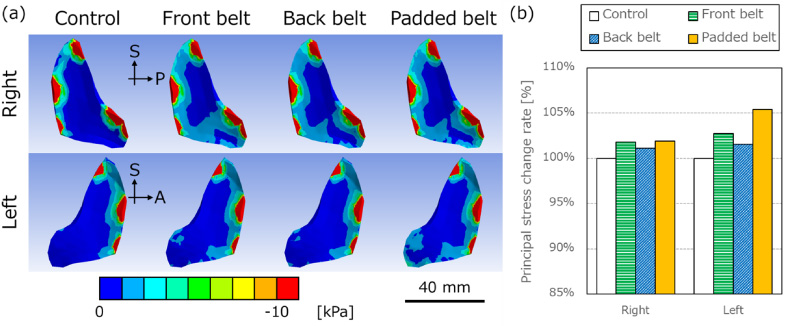
The minimum principal stress indicates the maximum compressive stress with a negative value. In Fig. 8a, red represents the high-compression area. The anterior and superior parts of the SIJs were in a high-compressive stress state. When the pelvic belt was applied, the compressive stress region increased in the inferior parts. The mean minimum principal stress increased up to 5% with the attached padded belt compared with the control (Fig. 8b).
Fig. 8.
(a) Minimum principal stress distribution of right (1st line) and left (2nd line) sacroiliac joint cartilage shown from left and right, respectively. The red area shows the tensile area, and the tensile area decreased by pelvic belts. The scale bar: 40 mm. S: superior, A: anterior, P: posterior. (b) The comparison of mean minimum principal stress rates for the control condition. Right and left mean right and left sacroiliac joints, respectively.
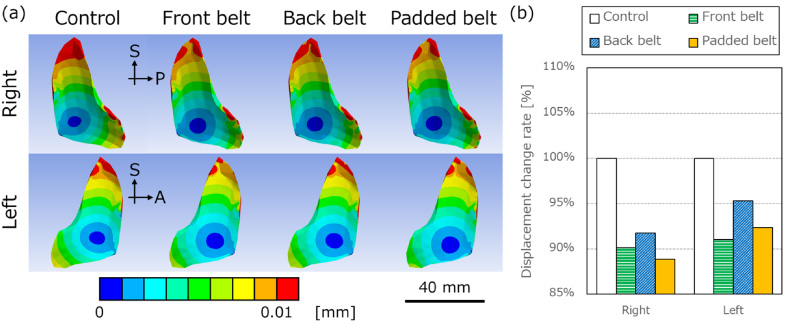
3.3.Displacement of the sacroiliac joint cartilage
When the pelvic belt was applied in the numerical model, the mean total displacement of the SIJs decreased by 5%–11% compared with the control condition (Fig. 9a and b). In particular, it decreased in the front belt (right: −10%, left: −9%) and the padded belt (right: −11%, left: −8%). The decrease in the back belt was lower than that in the others (right: −8%, left: −5%).
Fig. 9.
(a) Resultant displacement distribution of right (1st line) and left (2nd line) sacroiliac joint cartilage shown from left and right, respectively. The very low displacement area (blue area) increased with pelvic belts. The scale bar: 40 mm. (b) The comparison of mean resultant displacement rates for the control. Right and left mean right and left sacroiliac joints, respectively.
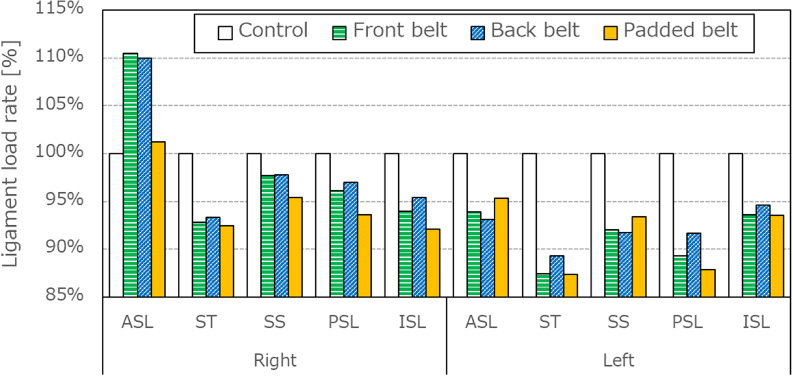
3.4.Ligament loading force
Pelvic belt application decreased the ligament loading force on the interosseous sacroiliac ligament (ISL; right: −6%, left: −6%), posterior sacroiliac ligament (PSL; right: −4%, left: −10%), sacrospinous ligament (SS; right: −3%, left: −8%) and sacrotuberous ligament (ST; right: −7%, left: −12%). In contrast, the anterior sacroiliac ligament (ASL; right: +7%, left: −6%) exhibited opposing trends on the left vs. right side, increasing on the right side and decreasing on the left side (Fig. 10).
Fig. 10.
The comparison of ligament loading rates on anterior sacroiliac joint (ASL), sacrotuberous ligament (ST), sacrospinous ligament (SS), posterior sacroiliac ligament (PSL) and interosseous sacroiliac ligament (ISL) for the control. The left and right graphs are the results on the right and left sides of ligaments, respectively.
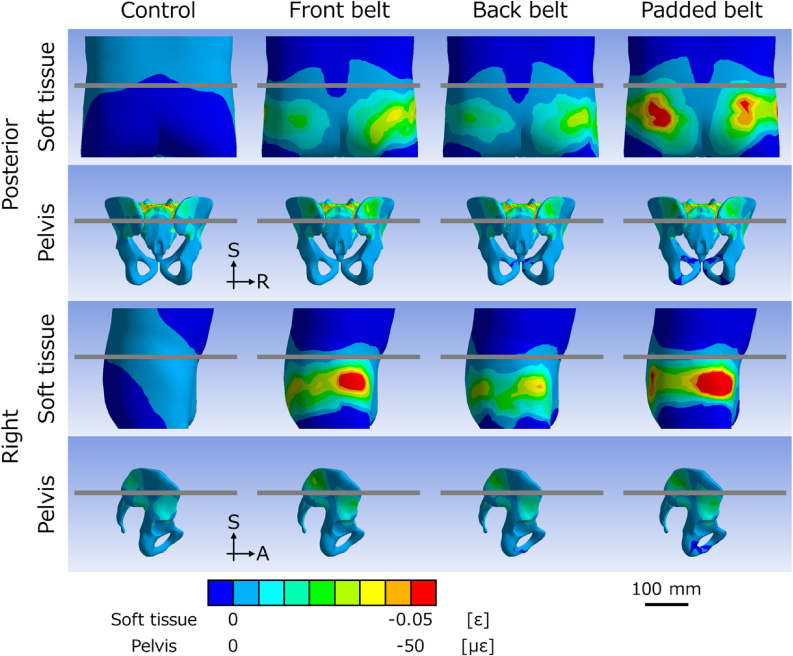
3.5.Minimum principal strain distribution within soft tissues and the pelvis
The minimum principal strain indicates the maximum compressive strain. In the soft tissue, all pelvic belts in this study were compressed mainly at the anterolateral and posterior parts under ASIS levels (Fig. 11). In the pelvis, the anterolateral parts were deformed as well, however, the posterior sides were compressed over the ASIS levels.
Fig. 11.
Minimum principal strain distribution of soft tissue (1st and 3rd lines) and pelvis (2nd and 4th lines). The top and bottom two lines are shown from posterior and right views, respectively. The gray lines indicate the level of the anterior superior iliac spines. The scale bar: 100 mm. S: superior, R: right, A: anterior.
3.6.Validation
The range of the SIJ motion was set for maximum displacements, which is 0.47 mm in healthy individuals [27], 0.3 mm in cadavers [28], and 0.6 mm in FEM [23], and for mean displacements, which is 3. 0 μm on cadavers [29]. In this study, the maximum and mean displacements of SIJ cartilage in the control were 0.17 mm and 7. 33 μm, respectively. The reported mean strains of ST and SS were 0.08% and 0.04% [30], and 0.048% and 0.072% [31], and in this study were 0.015% and 0.021%, respectively. The ligament load rates were 2% and 4% for ASL, 11% and 7% for ST, 8% and 5% for SS, 29% and 8% for PSL, and 39% and 71% for ISL to the total unilateral ligament load in the literature [23] and in this study, respectively. The results of this study were compared to those of the contemporary literature, and yielded values similar to those of previous studies.
4.Discussion
In this study, a rubber belt and a padded belt were investigated, showing similar load transfer mechanisms. Because the soft tissue is relatively thin in the anterior lateral parts of the lumbar region, the strain distribution on the pelvis matched the pressure point. Although the posterior pressure points were below the ASIS level, the pelvic area above the ASIS level was deformed. Regardless of the location of the pelvic belt, the upper part of the PSIS was compressed. The strain distribution in the pelvis with the padded belt was similar to that in the front and back belts, although the padded belt locally compressed the posterior region. This study suggests that the padded belt exerts the same pressure on the pelvis as the rubber belt, which may depend on the location of the pad. Statically, pressure on the buttocks reaches the upper part of the PSIS and compresses the posterior soft tissue, which is not considered to directly affect the pelvis. It may, however, support muscles and contribute to strengthening of the force closer [32].
Pelvic belts are considered an established treatment for SIJ dysfunction. Bertuit et al. reported the effectiveness of pelvic belts in patients during pregnancy, where a visual analogue scale (VAS) at the SIJ was reduced by 20 mm in the group with a pelvic belt compared to the group without [33]. Few studies, however, have investigated the mechanisms underlying treatment with pelvic belts in detail. In this study, the difference in the effect between the rubber belt and padded pelvic belt was investigated using finite element analysis.
When the pelvic belt was applied, the displacement diagrams of the innominate bone showed that the anterior part of the bone moved outward, and the ischial limb was displaced inward, which indicated a relatively outward rotation of the innominate bone, called out-flare. The SIJs were considered to be in a compressed state because the compressive force increased, and the compressive stress area widened. Vleeming et al. reported that form and force closure improve SIJ stability, and the compressive force supports the force closure [32]. Therefore, the pelvic belt reduced displacement of the SIJ and enhanced its stability.
Ligament loading was reduced on the ST, SS, PSL and ISL. Sichting et al. [31] also have reported that the mean strain values for the ST and SS decreased, which is consistent with the results of this study. The ST and SS are considered to limit the nutation motion [34,35], and pelvic belts seemed to weaken the nutation with subsequent ST and SS strains. The reduction in the loads of the PSL and ISL was caused by a decrease in SIJ displacement. The opposite loading trends of the ASL may have resulted from slight asymmetry of the pelvic belts or minute differences in the pressure exerted.
Klima et al. [36] reported that the pelvic belt decreased the angles of nutation and increased the counter-nutation motion of the sacrum using human post-mortem tissues. Sichting et al. [31] showed that the pelvic belt enhanced the inward rotation of the innominate bone on the coronal plane based on the measurement of the pelvis and SIJ deformation based on finite element analysis. These results differ from the outward rotation of the innominate bone on the transverse plane observed in this study. Sichting et al. [31] placed the pelvic belt at a high position around the ASISs, which may be the reason that the results were different. This indicates that the height at which the pelvic belt is positioned may alter its therapeutic effects and treatment mechanisms. Depending on the position of the pelvic belts, patients with SIJ dysfunction reported increased pain relief despite using the same pelvic belts [37]. Different patients and/or pathologies may require pelvic belts with different treatment mechanisms to reduce pain. In this study, all pelvic belts yielded similar effects on pelvic kinematics. Only the back belt exhibited a smaller decrease in displacement at the ASISs and SIJs than the others. The difference in the tightening pressure in each belt could have affected the results.
There are some limitations to this study. First, for simplification, the soft tissue was uniform in the model used in this study, and the role of the muscles was not considered. The soft tissue of the lumbopelvic region is mainly composed of skin, fat, and muscle, but these components were modeled as one soft tissue in this study. The material properties of each tissue are different, and muscle properties can change during standing and walking. In this actual measurement, the pressure distribution was different when the muscle worked, and the simulation should include the muscle conditions. Since these considerations are complicated and this study was conducted in a rest condition without any motion, a simple soft tissue setup was adopted. Second, the tension of the pelvic belt was not specifically controlled although the pelvic belts were worn as tightly as possible to minimize the tension difference in each belt. Third, the pressure distribution measurement system of the pelvic belt did not precisely follow the body shape. The device used in this study was mainly developed to measure body pressure distribution with the participant in the lying position. Because of its mat shape, it became columnar when wrapped around the body and could not be tracked in the exact position. In addition, this could affect the wearing condition of the pelvic belt, since it is necessary to attach the belt while maintaining the shape of the device. For future research, it is important to develop a measuring instrument that can track the shape of the lumbar region without interfering with the pelvic belt.
5.Conclusion
The stress distribution within the pelvis when the pelvic belts were attached was evaluated using finite element analysis. The deformation of the innominate bone and the stresses on the SIJ are shown. Two types of pelvic belts caused the innominate bones to rotate outward, called out-flare, thus enhancing the compression force on the SIJ, and decreasing SIJ mobility.
Conflict of interest
None to report.
References
[1] | T.N. Bernard and W.H. Kirkaldy-Wills, Recognizing specific characteristics of nonspecific low back pain, Clin Orthop Relat Res 217: ((1987) ), 266–280. |
[2] | A.C. Schwarzer, C.N. Aprill and N. Bogduk, The sacroiliac joint in chronic low back pain, Spine 20: (1) ((1995) ), 31–37. |
[3] | S.L. Forst, M.T. Wheeler, J.D. Fortin and J.A. Vilensky, The sacroiliac joint: Anatomy, physiology and clinical significance, Pain Physician 9: (1) ((2006) ), 61–67. |
[4] | A. Vleeming, M.D. Schuenke, A.T. Masi, J.E. Carreiro, L. Danneels and F.H. Willard, The sacroiliac joint: An overview of its anatomy, function and potential clinical implications, J Anat 221: (6) ((2012) ), 537–567. |
[5] | C.O. Lovejoy, Evolution of the human lumbopelvic region and its relationship to some clinical deficits of the spine and pelvis, in: Movement, Stability and Lumbopelvic Pain: Integration of Research and Therapy, A. Vleeming, V. Mooney and R. Stoeckart (eds), Churchill Livingstone, London, (2007) , pp. 141–158. |
[6] | S. Katada, Principles of Manual Treatment for Sacroiliac Joint Dysfunction, Springer, Singapore, (2019) . |
[7] | E. Murakami, Sacroiliac Joint Disorder: Accurately Diagnosing Low Back Pain, Springer, Singapore, (2018) , pp. 33–35. |
[8] | E. Murakami, D. Kurosawa and T. Aizawa, Treatment strategy for sacroiliac joint-related pain at or around the posterior superior iliac spine, Clin Neurol Neurosurg 165: ((2018) ), 43–46. |
[9] | N. Hammer, R. Mobius, S. Schleifenbaum, K.H. Hammer, S. Klima, J. Lange , Pelvic belt effects on health outcomes and functional parameters of patients with sacroiliac joint pain, PLOS ONE 10: (8) ((2015) ), e0136375. |
[10] | J.M.A. Mens, L. Damen, C.J. Snijders and H.J. Stam, The mechanical effect of a pelvic belt in patients with pregnancy-related pelvic pain, Clin Biomech 21: (2) ((2006) ), 122–127. |
[11] | J.H. Lee, S.H. Lee and S.H. Song, Clinical effectiveness of botulinum toxin A compared to a mixture of steroid and local anesthetics as a treatment for sacroiliac joint pain, Pain Med 11: (5) ((2010) ), 692–700. |
[12] | E. Mukarami, Y. Tanaka, T. Aizawa, M. Ishizuka and S. Kokubun, Effect of periarticular and intraarticular lidocaine injections for sacroiliac joint pain: Prospective comparative study, J Orthop Sci 12: (3) ((2007) ), 274–280. |
[13] | W.H. Kirkaldy-Willis and J.D. Cassidy, Spinal manipulation in the treatment of low-back pain, Can Fam Physician 31: ((1985) ), 535–540. |
[14] | L.E. Miller, W.C. Reckling and J.E. Block, Analysis of postmarket complaints database for the iFuse SI joint fusion system®: A minimally invasive treatment for degenerative sacroiliitis and sacroiliac joint disruption, Med Devices 6: (1) ((2013) ), 77–84. |
[15] | E. Mukarami, D. Kurosawa and T. Aizawa, Sacroiliac joint arthrodesis for chronic sacroiliac joint pain: An anterior approach and clinical outcomes with a minimum 5-year follow-up, J Neurosurg Spine 29: (3) ((2018) ), 279–285. |
[16] | A.G. Smith, R. Capobianco, D. Cher, L. Rudolf, D. Sachs, M. Gundanna , Open versus minimally invasive sacroiliac joint fusion: a multi-center comparison of perioperative measures and clinical outcomes, Ann Surg Innov Res 7: (1) ((2013) ), 14. |
[17] | C.L. Wise and B.E. Dall, Minimally invasive sacroiliac arthrodesis: Outcomes of a new technique, J Spinal Disord Tech 21: (8) ((2008) ), 579–584. |
[18] | A. Joukar, R.D. Chande, R.D. Carpenter, D.P. Lindsey, D.U. Erbulut, S.A. Yerby , Effects on hip stress following sacroiliac joint fixation: A finite element study, JOR Spine 2: (4) ((2019) ), e1067. |
[19] | T. Kozaki, H. Hashizume, D. Nishiyama, H. Iwasaki, S. Tsutsui, M. Takami , Adjacent segment disease on hip joint as a complication of spinal fusion surgery including sacroiliac joint fixation, Eur Spine J 30: (5) ((2021) ), 1314–1319. |
[20] | L Damen, C.W. Spoor, C.J. Snijders and H.J. Stam, Does a pelvic belt influence sacroiliac joint laxity? Clin Biomech 17: (7) ((2002) ), 495–498. |
[21] | J.J.M. Pel, C.W. Spoor, R.H.M. Goossens and A.L. Pool-Goudzwaard, Biomechanical model study of pelvic belt influence on muscle and ligament forces, J Biomech 41: (9) ((2008) ), 1878–1884. |
[22] | B. Delshad, E. Zarean, G. Yeowell and E. Sadeghi-Demneh, The immediate effects of pelvic compression belt with a textured sacral pad on the sacroiliac function in pregnant women with lumbopelvic pain: a cross-over study, Musculoskelet Sci Pract 48: ((2020) ), 102170. |
[23] | R. Toyohara, D. Kurosawa, N. Hammer, M. Werner, K. Honda, Y. Sekiguchi , Finite element analysis of load transition on sacroiliac joint during bipedal walking, Sci Rep 10: ((2020) ), 13683. |
[24] | D.C. Wirtz, N. Schiffers, T. Pandorf, K. Radermacher, D. Weichert and R. Forst, Critical evaluation of known bone material properties to realize anisotropic FE-simulation of the proximal femur, J Biomech 33: (10) ((2000) ), 1325–1330. |
[25] | S. Majumder, A. Roychowdhury and S. Pal, Simulation of hip fracture in sideways fall using a 3D finite element model of pelvis–femur–soft tissue complex with simplified representation of whole body, Med Eng Phys 29: (10) ((2007) ), 1167–1178. |
[26] | N. Hammer and S. Klima, In-silico pelvis and sacroiliac joint motion - A review on published research using numerical analyses, Clin Biomech 61: ((2019) ), 95–104. |
[27] | T.J. Kibsgård, O. Røise, B. Stuge and S.M. Röhrl, Precision and accuracy measurement of radiostereometric analysis applied to movement of the sacroiliac joint, Clin. Orthop. Relat. Res. 470: ((2012) ), 3187–3194. |
[28] | N. Hammer, M. Scholze, T. Kibsgård, S. Klima, S. Schleifenbaum, T. Seidel , Physiological in vitro sacroiliac joint motion: A study on three-dimensional posterior pelvic ring kinematics, J. Anat. 234: (3) ((2019) ), 346–358. |
[29] | E. Varga, B. Dudas and M. Tile, Putative proprioceptive function of the pelvic ligaments: Biomechanical and histological studies, Injury 39: (8) ((2008) ), 858–864. |
[30] | W.L. Buford, D.L. Moulton, Z. Gugala and R.W. Lindsey, The sacroiliac spine-computer simulation of motion and modeling of the ligaments, Conf Proc IEEE Eng Med Biol Soc ((2010) ), 5117–5120. |
[31] | F. Sichting, J. Rossol, O. Soisson, S. Klima, T. Milani and N. Hammer, Pelvic belt effects on sacroiliac joint ligaments: A computational approach to understand therapeutic effects of pelvic belts, Pain Physician 17: (1) ((2014) ), 43–51. |
[32] | A. Vleeming and M. Schuenke, Form and force closure of the sacroiliac joints, PM R 11: (S1) ((2019) ), S24–S31. |
[33] | J. Bertuit, C.E. Van Lint, M. Rooze and V. Feipel, Pregnancy and pelvic girdle pain: Analysis of pelvic belt on pain, J Clin Nurs 27: ((2018) ), e129–e137. |
[34] | N. Hammer, A. Hoch, S. Klima, J.B.L. Joncour, C. Rouquette and M. Ramezani, Effects of cutting the sacrospinous and sacrotuberous ligaments, Clin Anat 32: (2) ((2018) ), 231–237. |
[35] | I.A. Kapandji, The Physiology of The Joints, Vol. 3: , , Churchill Livingstone, London, (1974) . |
[36] | S. Klima, R. Grunert, B. Ondruschka, M. Scholze, T. Seidel, M. Werner , Pelvic orthosis effects on posterior pelvis kinematics An in-vitro biomechanical study, Sci Rep 8: ((2018) ), 15980. |
[37] | O. Soisson, J. Lube, A. Germano, K.H. Hammer, C. Josten, F. Sichting , Pelvic belt effects on pelvic morphometry, muscle activity and body balance in patients with sacroiliac joint dysfunction, PLOS ONE 10: (3) ((2015) ), e0116739. |


