
Thrombosis density ratio can predict the occurrence of pulmonary embolism and post-thrombotic syndrome in lower-extremity deep vein thrombosis patients
Abstract
OBJECTIVE:
Deep vein thrombosis (DVT) formation of lower extremities can lead to serious complications including pulmonary embolism (PE) and chronic post-thrombotic syndrome (PTS). We aimed to explore the relationship between the ratio of thrombotic density and the occurrence of PE and PTS in patients with DVT of the lower extremities.
METHODS:
A retrospective analysis was conducted in patients who performed computed tomography venography, dividing into DVT with PE group (54 patients) and DVT-alone group (34 patients), The clinical data were recorded. Univariate and multivariate logistic regression analysis were used to analysis variables associated with PE. The ability of thrombosis density ratio and Wells score to diagnose PE was evaluated by using the receiver operating characteristic curve (ROC) area under the curve (AUC). According to the treatment and follow-up results, subgroup analysis was performed, and the Villata score was used to determine the presence or absence of PTS and its severity.
RESULTS:
Compare with the DVT-alone group, more patients had dyspnea and chest pain in the DVT with PE group. DVT with PE group had lower the percentage of neutrophils, white blood cell count and platelet count, while had higher blood cell count, D-dimer, wells score, thrombus and thrombus density ratio. Multivariate logistic analysis showed that percentage of neutrophils (OR(95% CIs)=1.15 (1.01,1.31), P = 0.040), platelets (OR(95% CIs)=0.96 (0.93,0.99), P = 0.011), and thrombus density ratio (OR(95% CIs)=5.99 (1.96,18.35), P = 0.002) are independent predictors of PE. The Wells score and thrombosis density ratio were consistent in the diagnostic efficacy of PE. In the subgroup analysis, there was a relevance between the ratio of thrombosis density and the Villalta score.
CONCLUSION:
Percentage of neutrophils, platelets, and thrombus density ratio are independent predictors of PE. The thrombosis density of DVT patients may be an index to predict the risk of PE and PTS in DVT patients.
1Introduction
Venous thromboembolism (VTE) is a common disease that affects 1 to 2 percent of the population, with about 1.31 per thousand people per year [1]. It includes deep venous thrombosis (DVT) and pulmonary embolism (PE). DVT formation of lower extremities is a common and serious disease, with an incidence of about 0.5 to 1 per thousand people per years [2]. It is usually caused by slower venous blood flow or endothelial injury in the lower extremities. Lower limb DVT can lead to serious complications, including PE and chronic post-thrombotic syndrome (PTS) [3]. PE is a process in which thrombus from other parts of the body completely or partially blocks one or more pulmonary arteries and enters the pulmonary circulation through blood flow, mainly from the lower limb DVT [4]. PE is the third most common cause of cardiovascular death in hospitals after myocardial infarction and stroke, with a total incidence of about 100 to 200 per hundred thousand people -years. Currently, several non-invasive prediction models such as Wells score [5, 6] and Geneva score [7, 8] are commonly used clinically to predict the risk of PE, but the signs and symptoms of PE often lack specificity. As many as two-thirds of patients may be asymptomatic, often misdiagnosed, or even missed, resulting in delayed treatment and death [9].
PTS is the most common complication of DVT and has attracted more and more attention in recent years. Even after receiving regular and fully effective anticoagulant therapy after an acute attack of DVT, 20 to 50 percent of the patients will develop into PTS in the future. Its clinical manifestations can be mild limb discomfort or severe clinical manifestations such as chronic pain, intractable lower limb edema, skin changes, the formation of venous ulcers, and so on. According to statistics, 5 to 10 percent of DVT patients will develop into severe PTS, and the quality of life will be seriously affected [10]. At present, the diagnosis time of PTS is considered to be within three months to 2 years after the first acute DVT. There are six clinical scoring systems of PTS, including Ginsberg definition, Widmer grade, Brandjes score, venous clinical severity score, CEAP grade, and Villalta score. Villalta score has the best specificity [11, 12].
Computed tomography venography (CTV) of the lower extremity is a reliable method for the diagnosis of lower limb DVT [13]. It has been reported that the thrombus CT Hounsfield units (HU) attenuation associated with the hemoglobin content of blood clots, and may have been used to evaluate aortic successful thrombolysis [14–16]. Generally, the higher the hemoglobin content, the more the HU attenuation value [14]. However, the clinical significance of thrombotic HU unit value in lower limb DVT formation is poorly understood. In our study, We aim to assess whether the thrombotic density ratio of deep vein thrombosis detected by lower extremity CTV can predict the occurrence of PE and PTS.
2Materials and methods
2.1General information
Our study is a single-center retrospective study. The study was approved by ethics committee of Quanzhou Medical College (2022025). We collected patients over 20 years old who underwent lower extremity CTV in our hospital from January 2016 to December 2019 and confirmed DVT of the lower extremity for the first time (including superficial femoral vein, common femoral vein, iliac vein, or inferior vena cava). They visited our hospital for emergency chest pain for 1 to 3 months and underwent computer tomography pulmonary angiography (CTPA). We excluded patients with a previous DVT history, diagnosed with cancer, or were diagnosed with PE by pulmonary ventilation-perfusion scan. The patients included in the study were divided into PE patients (DVT with PE group, n = 54) and non-PE patients (DVT-alone group, n = 34).
2.2CT procedures
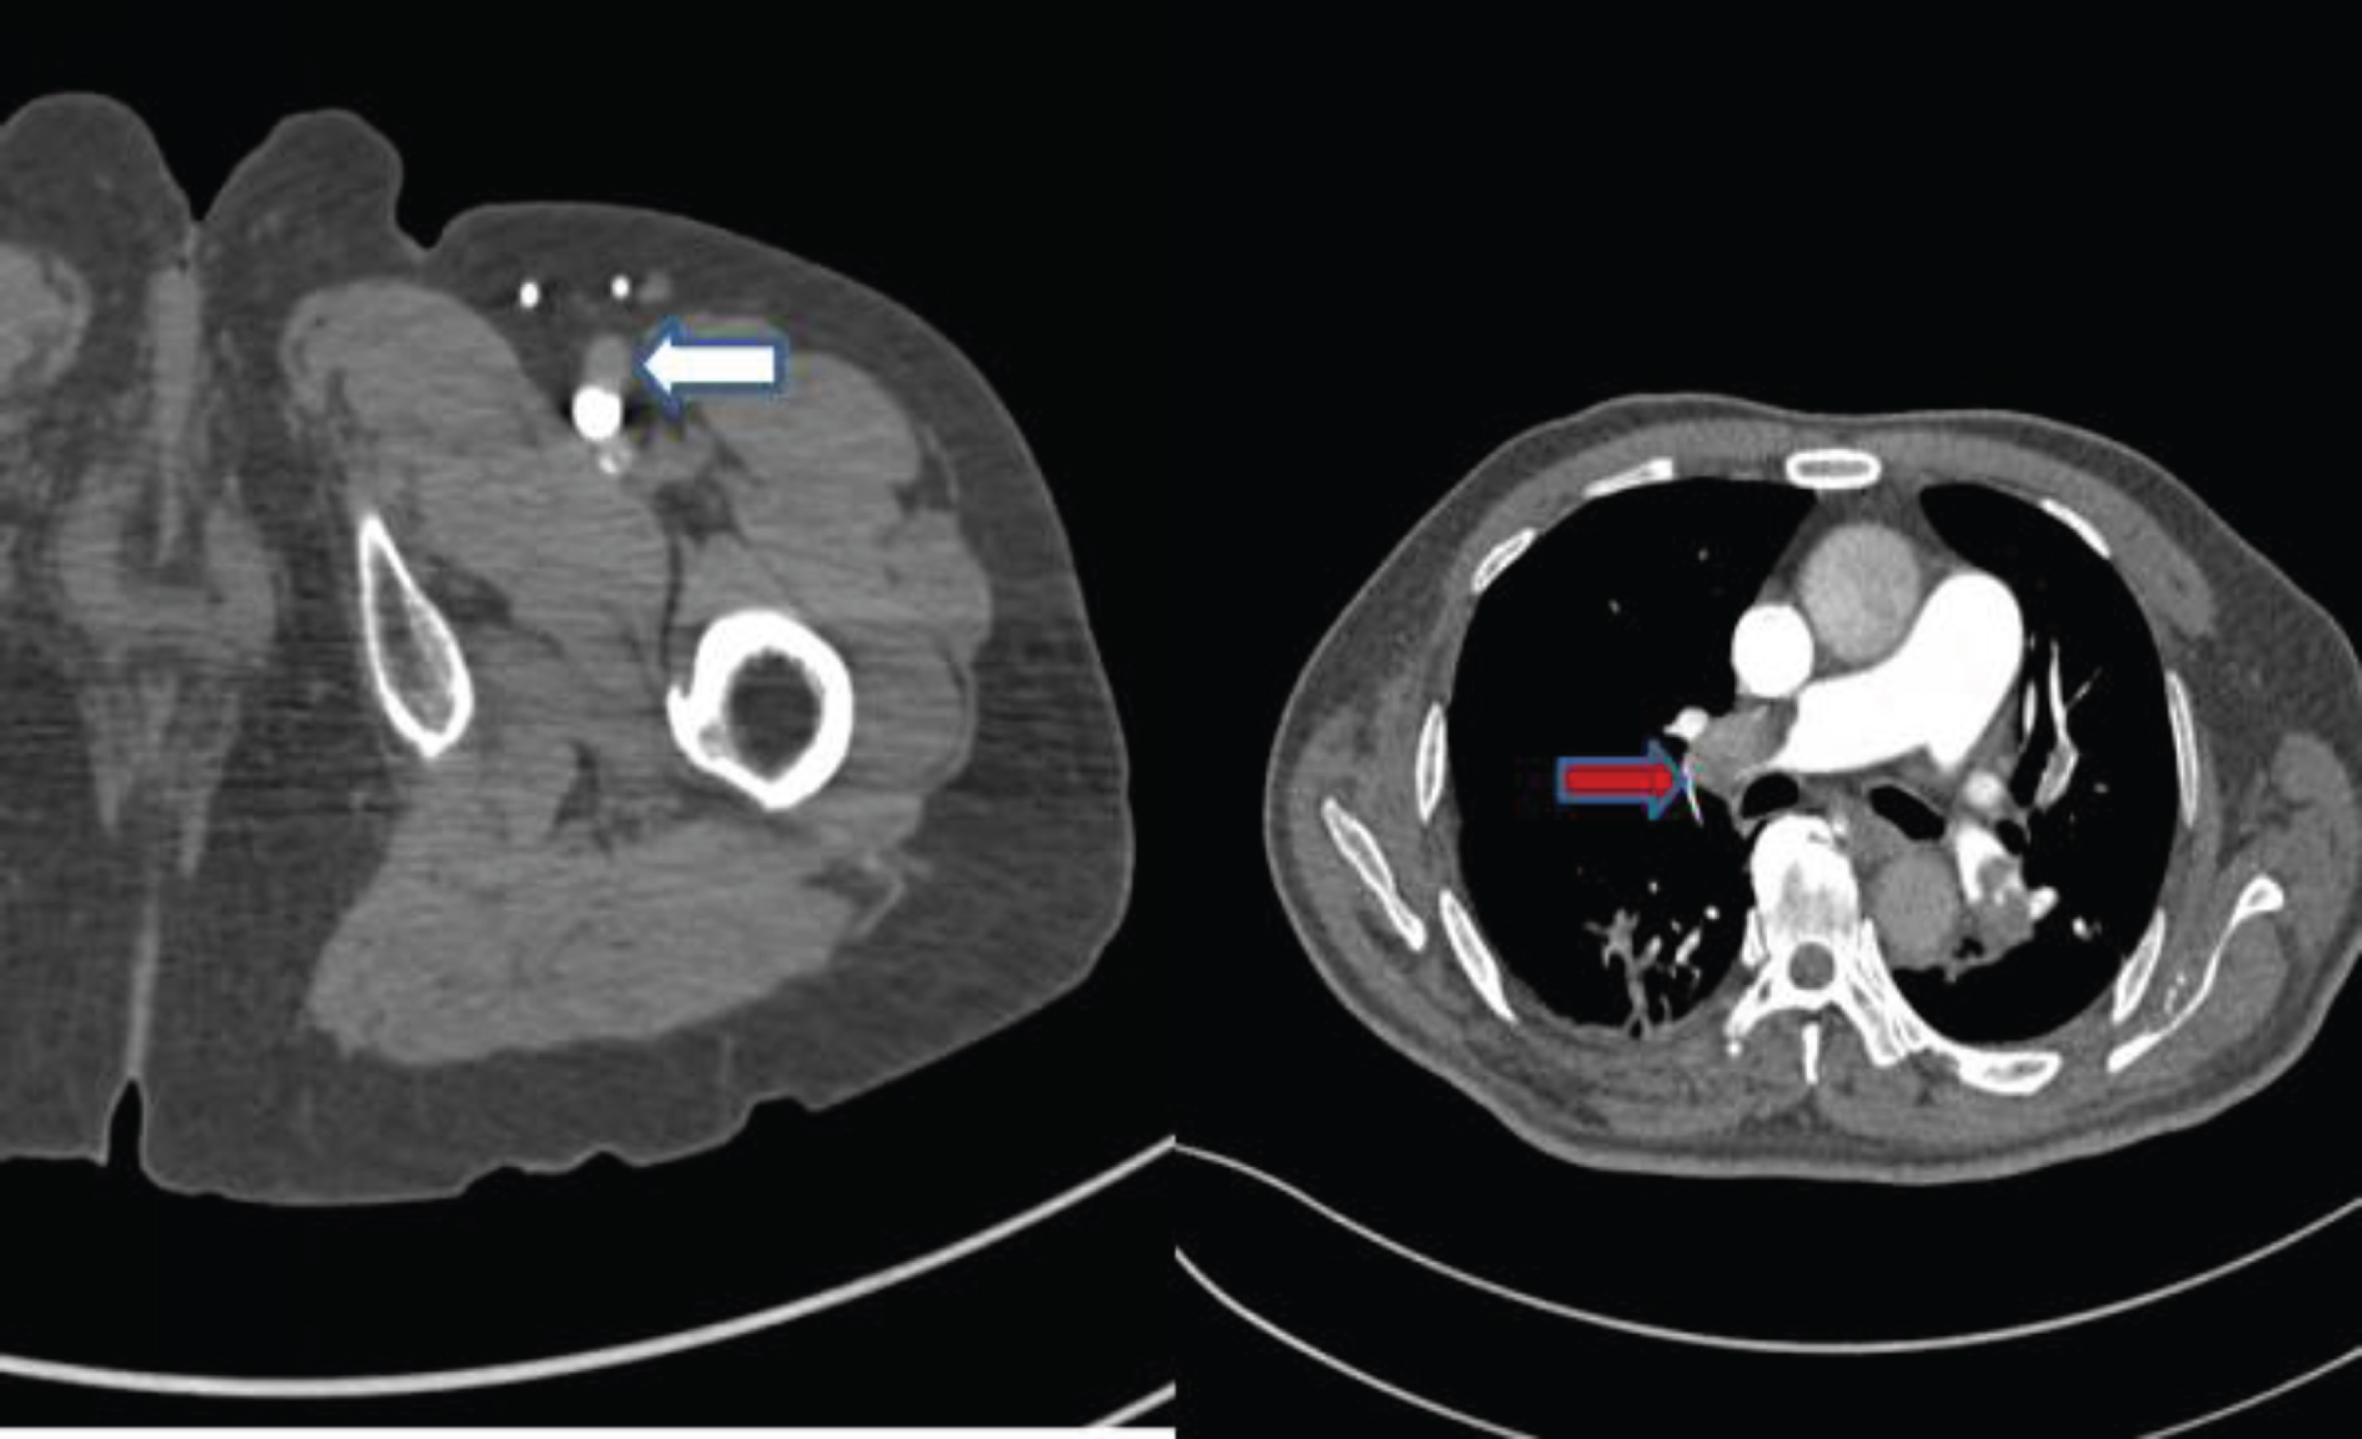
Both CTPA and lower extremity CTV examinations use Siemens dual-source CT (Somatom Definition, Germany, Siemens) (Fig. 1). When performing lower extremity CTV and CTPA, patients and their families should be informed of the purpose of the examination, examination procedures, and precautions. The family members should sign an informed consent form. Iopamidol (370 mgI/L) was used for both lower limb CTV and CTPA contrast agents.
Fig. 1
60-year-old male patient with DVT in left lower limb with PE.
2.3Calculation of the thrombosis density ratio and Wells score
Calculate thrombosis density and normal ipsilateral vein based on axial CT images (thrombosis density ratio =[thrombosis (HU unit density)/ipsilateral standard vein (HU unit density)]). CTPA and CTV images of lower extremities were read by two experienced imaging physicians (associate chief physician and above).
The Wells score is following the “Guidelines” recommended by the European Cardiovascular Association [14] on the diagnosis process of PE assessment and is scored according to the patients’ description and related physical signs (Wells score > 4 points suspect PE).
2.4Treatment and follow-up
During the acute phase, depending on the patients’ clinical condition and initial findings, unconventional Heparin or low-molecular-weight anticoagulant Heparin was used. Then, oral vitamin K antagonists or direct oral anticoagulants. After six months of continuous treatment, the patients were evaluated by two chief physicians. During the evaluation, the patient did not wear elastic socks and assessed the patients’ legs in a well-lit room in the afternoon, the evaluation method was the Villalta score (Table 1).
Table 1
Villalta score of PTS
| Symptoms | Score | Signs | Score | ||||||
| None | Mild | Moderate | Severe | None | Mild | Moderate | Severe | ||
| Pain | 0 | 1 | 2 | 3 | Anterior Tibial Edema | 0 | 1 | 2 | 3 |
| Cramps | 0 | 1 | 2 | 3 | Sebum hardening | 0 | 1 | 2 | 3 |
| Heaviness | 0 | 1 | 2 | 3 | Chromatosis | 0 | 1 | 2 | 3 |
| Abnormal Sensation | 0 | 1 | 2 | 3 | Flushing | 0 | 1 | 2 | 3 |
| Pruritus | 0 | 1 | 2 | 3 | Phlebeciasia | 0 | 1 | 2 | 3 |
| Calf squeezing pain | 0 | 1 | 2 | 3 | |||||
| Ulcer | Have | No | |||||||
Total score 33. 0–4, no PTS; 5–9, mild PTS; 10–14, moderate PTS; 15–33, severe PTS; with ulcer directly score 15.
2.5Statistical analysis
This study used Statistical analyses SPSS (version 22.0). The continuous variables were expressed as means±standard deviation. After the normality test, The results showed that the t-test was used for the normal distribution, and the data of non-normal distribution or non-conformance variance homogeneity variable were compared by Mann Whitney U test. To determine whether there was a correlation between clinical variables and PE, using univariate and multivariate logistic regression analysis and report the odds ratio of 95% confidence intervals (CIs). The ability of thrombosis density ratio and Wells score to diagnose PE was evaluated by using the receiver operating characteristic curve (ROC) area under the curve (AUC) and Z test. Youden index (sensitivity + specificity –1) was used to determine the cutoff value on the ROC curve. In subgroups, Spearman correlation analysis was used to study the relationship between thrombotic density ratio and PTS (Villalta score) (P < 0.05 was considered statistically significant).
3Results
3.1Clinical features
We evaluated 140 patients with lower extremity DVT. After excluding all factors, 88 patients were included in the study (DVT with PE group: 54 of 88 patients [61%], with a mean age was (60.4±12.4) years old; DVT-alone group: 34 of 88 patients [39%], with a mean age was (55.9±11.8) years old). There was no significant difference in age, gender, smoking history, hypertension history, diabetes mellitus history, recent surgery history and internal fixation history between the two groups (P > 0.05). Of the 88 patients, 45 (68.5%) had dyspnea, of which 35 (39.7%) were in the DVT with PE group, and 10 (11.4%) were in the DVT-alone group (P = 0.001). Twenty cases developed chest pain, of which 17 patients (19.3%) were in the DVT with PE group, and three patients were in the DVT-alone group (P < 0.05). There was no statistical difference in heart rate and hemoptysis between the two groups (P > 0.05) (Table 2).
Table 2
General clinical features
| Parameter | DVT with PE group (n = 54) | DVT-alone group (n = 34) | P value |
| Age (year) | 60.4±12.4 | 55.9±11.8 | 0.062 |
| Gender (male/female) | 27/27(50/50) | 19/15(56/44) | 0.289 |
| Risk factors | |||
| Smoking | 15(28) | 14(41) | 0.52 |
| Hypertension | 26(48) | 21(62) | 0.21 |
| Diabetes mellitus | 9(17) | 7(21) | 0.64 |
| Recent surgery history | 8(15) | 3(9) | 0.41 |
| Internal fixation history | 9(17) | 4(12) | 0.53 |
| Clinical symptoms | |||
| dyspnea | 35(65) | 10(29) | 0.001 |
| chest pain | 17(31) | 3(9) | 0.027 |
| Heart rate > 100 Beats/minute | 20(37) | 15(44) | 0.51 |
| Hemoptysis | 14(26) | 4(12) | 0.18 |
3.2Comparision of the preliminary laboratory results between the two groups
Compared with the DVT-alone group, the preliminary laboratory results of DVT with PE group were as follows: the percentage of neutrophils was lower (65.75% ±8.88 vs 71.10% ±12.27, respectively; P < 0.001), and the peripheral blood white blood cell count was lower (6.59×10⁹/L±1.91 vs 8.10×10⁹/L±3.78, respectively; P < 0.05), higher red blood cell count (4.39×10¹²/L±0.52 vs 4.04×10¹²/L±0.60, respectively; P < 0.05), lower platelet count (227.76×10⁹/L±44.05 vs 265.59×10⁹/L±37.55, respectively; P < 0.001), higher D-dimer (9.33±8.48 vs 5.95±9.70, respectively; P = 0.09), higher thrombus (63.71±12.96 and 46.99±6.66, respectively; P < 0.001). The hemoglobin concentration, platelet compaction, normal vein were not significant between the two groups (Table 3).
Table 3
Preliminary laboratory results
| Parameter | DVT with PE Group (n = 54) | DVT-alone Group (n = 34) | P Value |
| Percentage of neutrophils (%) | 63.53±7.11 | 71.10±12.27 | <0.001 |
| WBC (×109/L) | 6.59±1.91 | 8.10±3.78 | 0.016 |
| Platelet (×109/L) | 227.76±44.05 | 265.59±37.55 | <0.001 |
| RBC (×1012/L) | 4.39±0.52 | 4.04±0.60 | 0.005 |
| Mean hemoglobin Concentration (g/L) | 123.61±18.04 | 126.59±14.13 | 0.41 |
| platelet compaction (%) | 0.25±0.10 | 0.26±0.12 | 0.62 |
| D-dimer (ug/ml) | 9.33±8.48 | 5.95±9.70 | 0.09 |
| Thrombus (HU) | 63.71±12.96 | 46.99±6.66 | <0.001 |
| Normal vein (HU) | 342.33±92.19 | 336.03±75.29 | 0.74 |
Abbreviations: WBC, white blood cell count, RBC, Red blood cell count.
3.3DVT with the PE group increased the Wells Score and thrombus density of DVT patients
Compared with the DVT with the PE group and the DVT-alone group, more patients in the DVT with the PE group with Wells score > 4 (79.6% and 47.1%, respectively; P = 0.002). And there was a significant difference in thrombus density ratio between the DVT with PE group and the DVT-alone group (19.6±5.5% and 14.6±3.5%, respectively; P < 0.001) (Table 4).
Table 4
Wells score and thrombus density
| Parameter | DVT with PE group (n = 54) | DVT-alone group (n = 34) | P value |
| Wells score > 4 | 43 (79.6) | 16 (47.1) | 0.002 |
| Thrombus density ratios (%) | 19.6±5.5 | 14.6±3.5 | <0.001 |
3.4Variables associated with PE
The logistic regression analysis results associated with PE were showed in Table 5. White blood cells (OR(95% CIs)=1.36 (1.10,1.66), P = 0.004), percentage of neutrophils (OR(95% CIs)=1.08 (1.03,1.13), P = 0.002), platelets (OR(95% CIs)=0.98 (0.96,0.99); P < 0.001), thrombus density ratio (OR(95% CIs)=5.77 (2.62,12.71), P < 0.001), and Wells score > 4 points (OR(95% CIs)=1.94 (1.34,2.80), P < 0.001) were significantly associated with PE by univariate analysis. Further multivariate analysis showed that percentage of neutrophils (OR(95% CIs)=1.15 (1.01,1.31); P = 0.040), platelets (OR(95% CIs)=0.96 (0.93,0.99); P = 0.011), and thrombus density ratio (OR(95% CIs)=5.99 (1.96,18.35); P = 0.002) are independent predictors of PE.
Table 5
Logistic regression analysis of PE related variables
| Univariate Analysis | Multivariate Analysis | |||
| Parameter | Odds ratio | P Value | Odds ratio P value | |
| WBC | 1.36 (1.10,1.66) | 0.004 | 1.11 (0.79,1.58) | 0.545 |
| Percentage of neutrophils | 1.08 (1.03,1.13) | 0.002 | 1.15 (1.01,1.31) | 0.040 |
| Platelet | 0.98 (0.96,0.99) | <0.001 | 0.96 (0.93,0.99) | 0.011 |
| RBC | 0.69 (0.29,1.63) | 0.395 | 1.54 (0.36,6.59) | 0.565 |
| Thrombus density ratios | 5.77 (2.62,12.71) | <0.001 | 5.99 (1.96,18.35) | 0.002 |
| Wells score > 4 | 1.94 (1.34,2.80) | <0.001 | 1.84 (0.99,3.41) | 0.054 |
Abbreviations: WBC, white blood cell count, RBC, Red blood cell count.
3.5Value of the thrombosis density ratio and the Wells score in diagnostic efficacy of PE
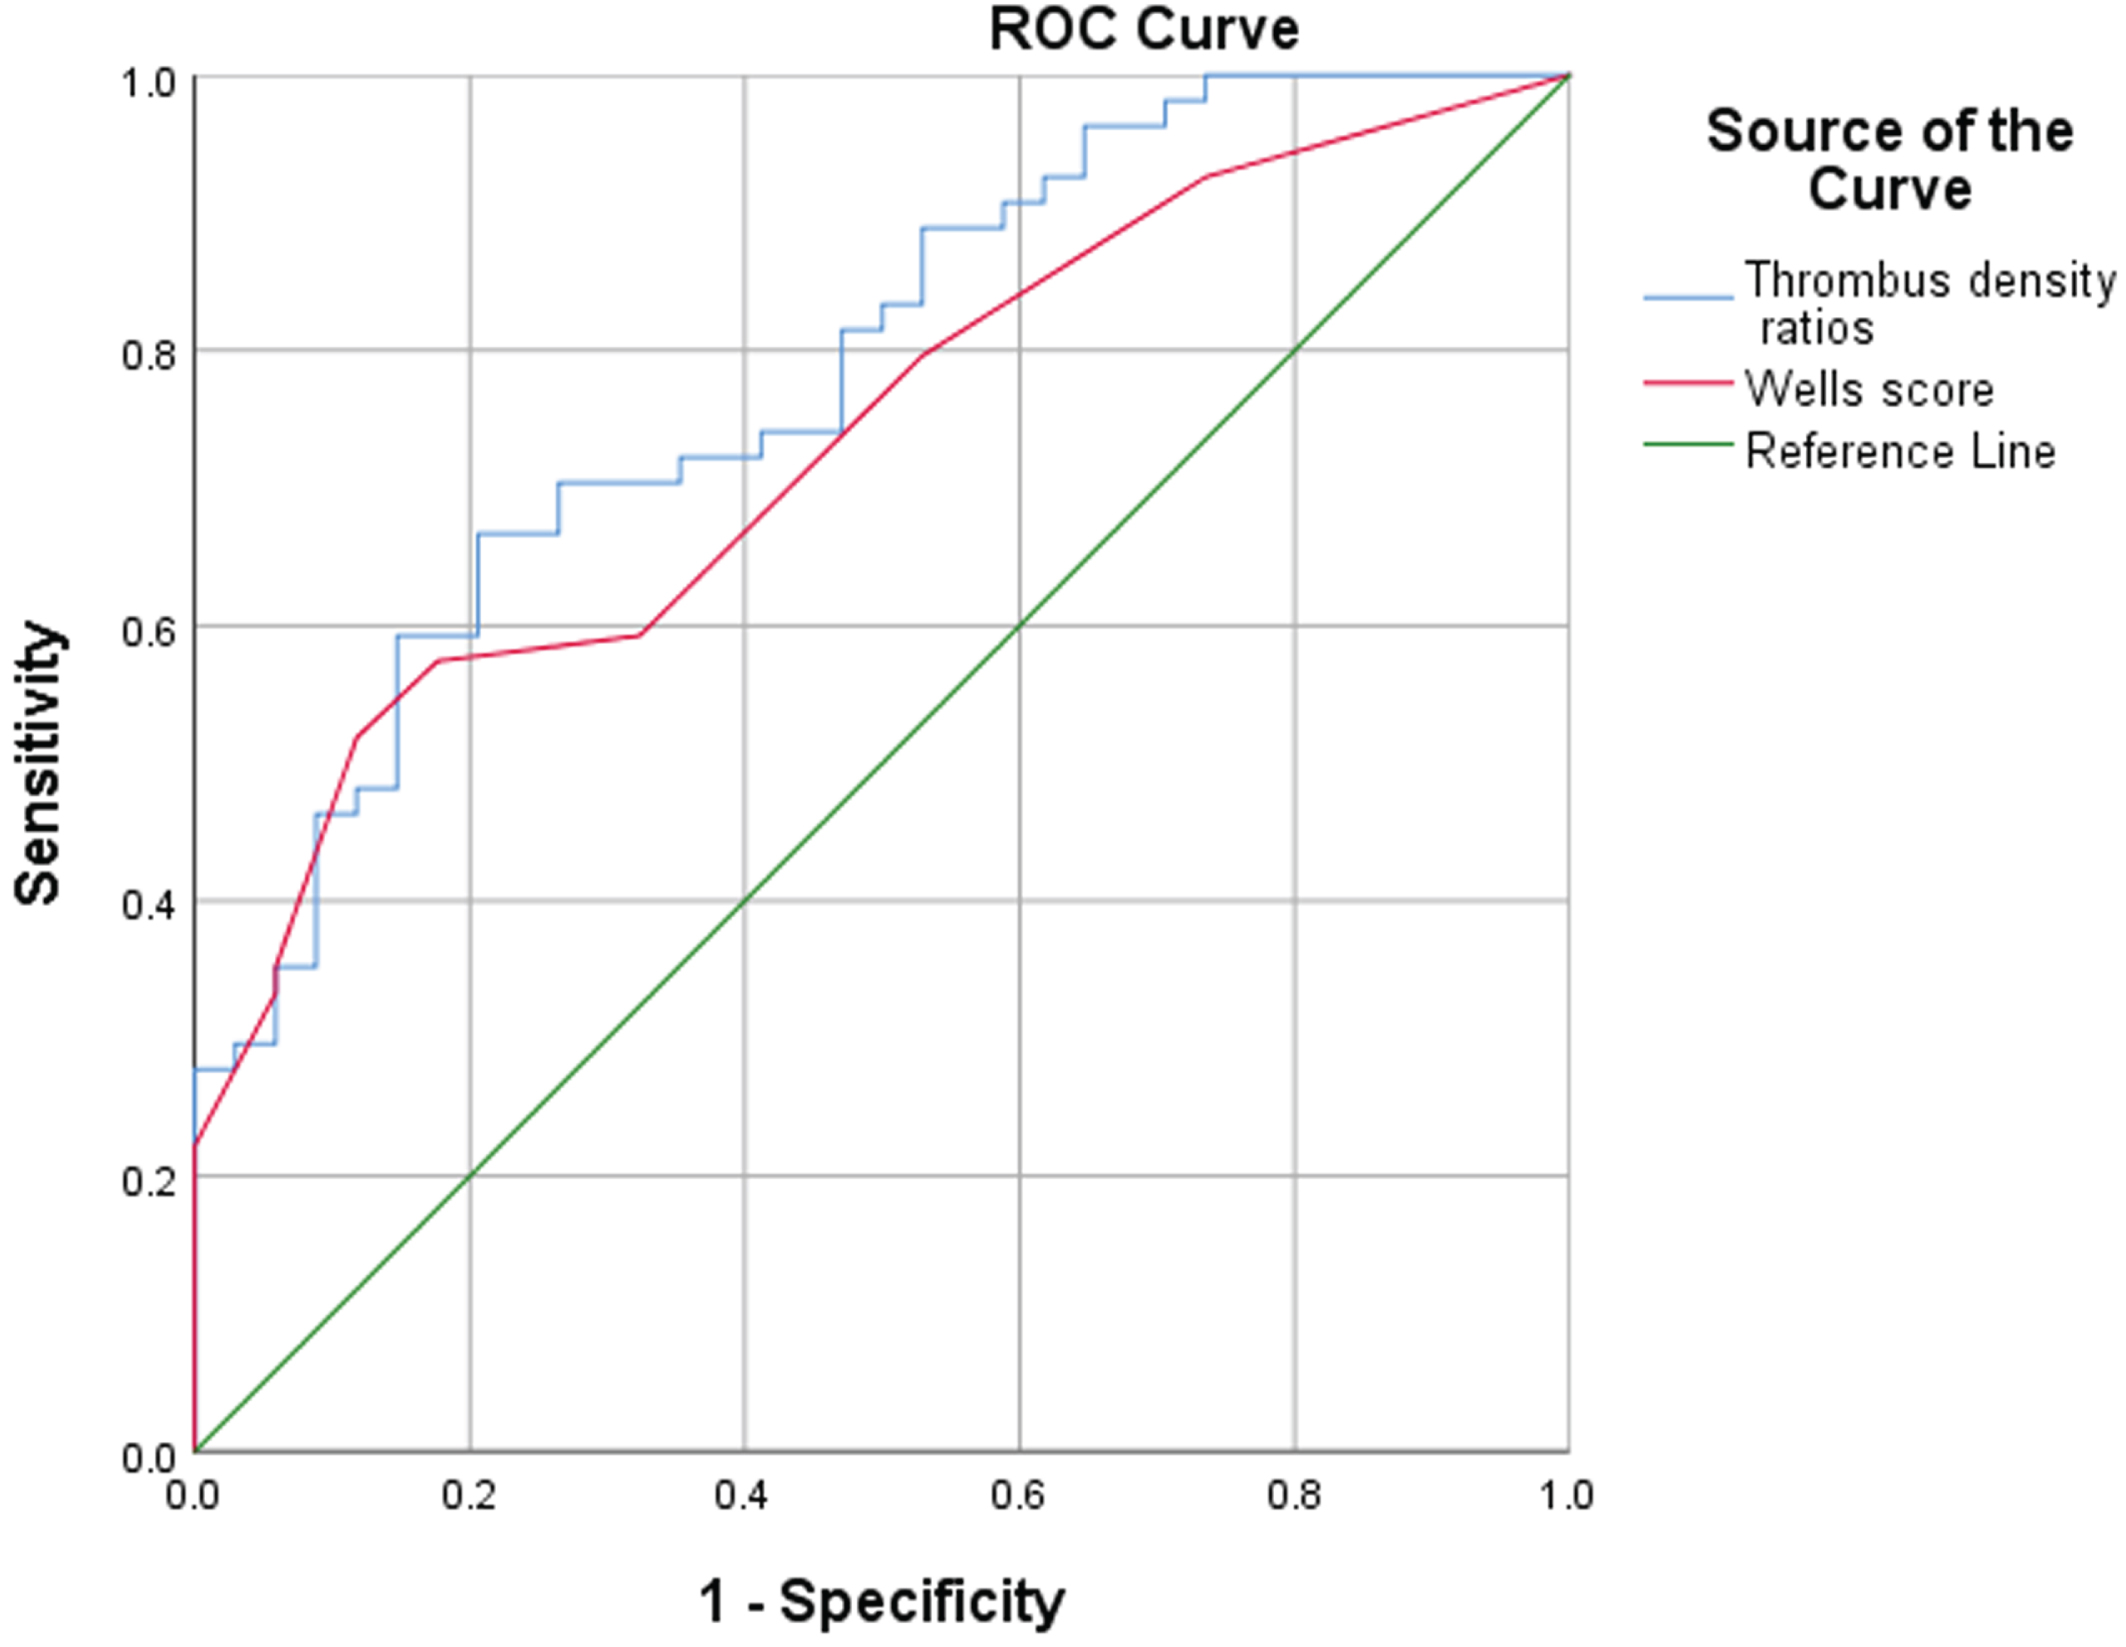
The AUC of the thrombosis density ratio was 0.78, and the AUC of the Wells score was 0.73. The Z test was used to compare the AUC values of the two (P = 0.66), the difference was not statistically significant, indicating that Wells score and the ratio of thrombus density are consistent in the diagnostic efficacy of PE (Fig. 2). The cutoff value of the thrombus density ratio was 16.85%, the sensitivity of predicting PE was 66.7%, and the specificity was 79.4%.
Fig. 2
ROC curve of thrombus density ratio and Wells score in the diagnosis of PE.
3.6Relevance between Villalta score and the ratio of thrombus density
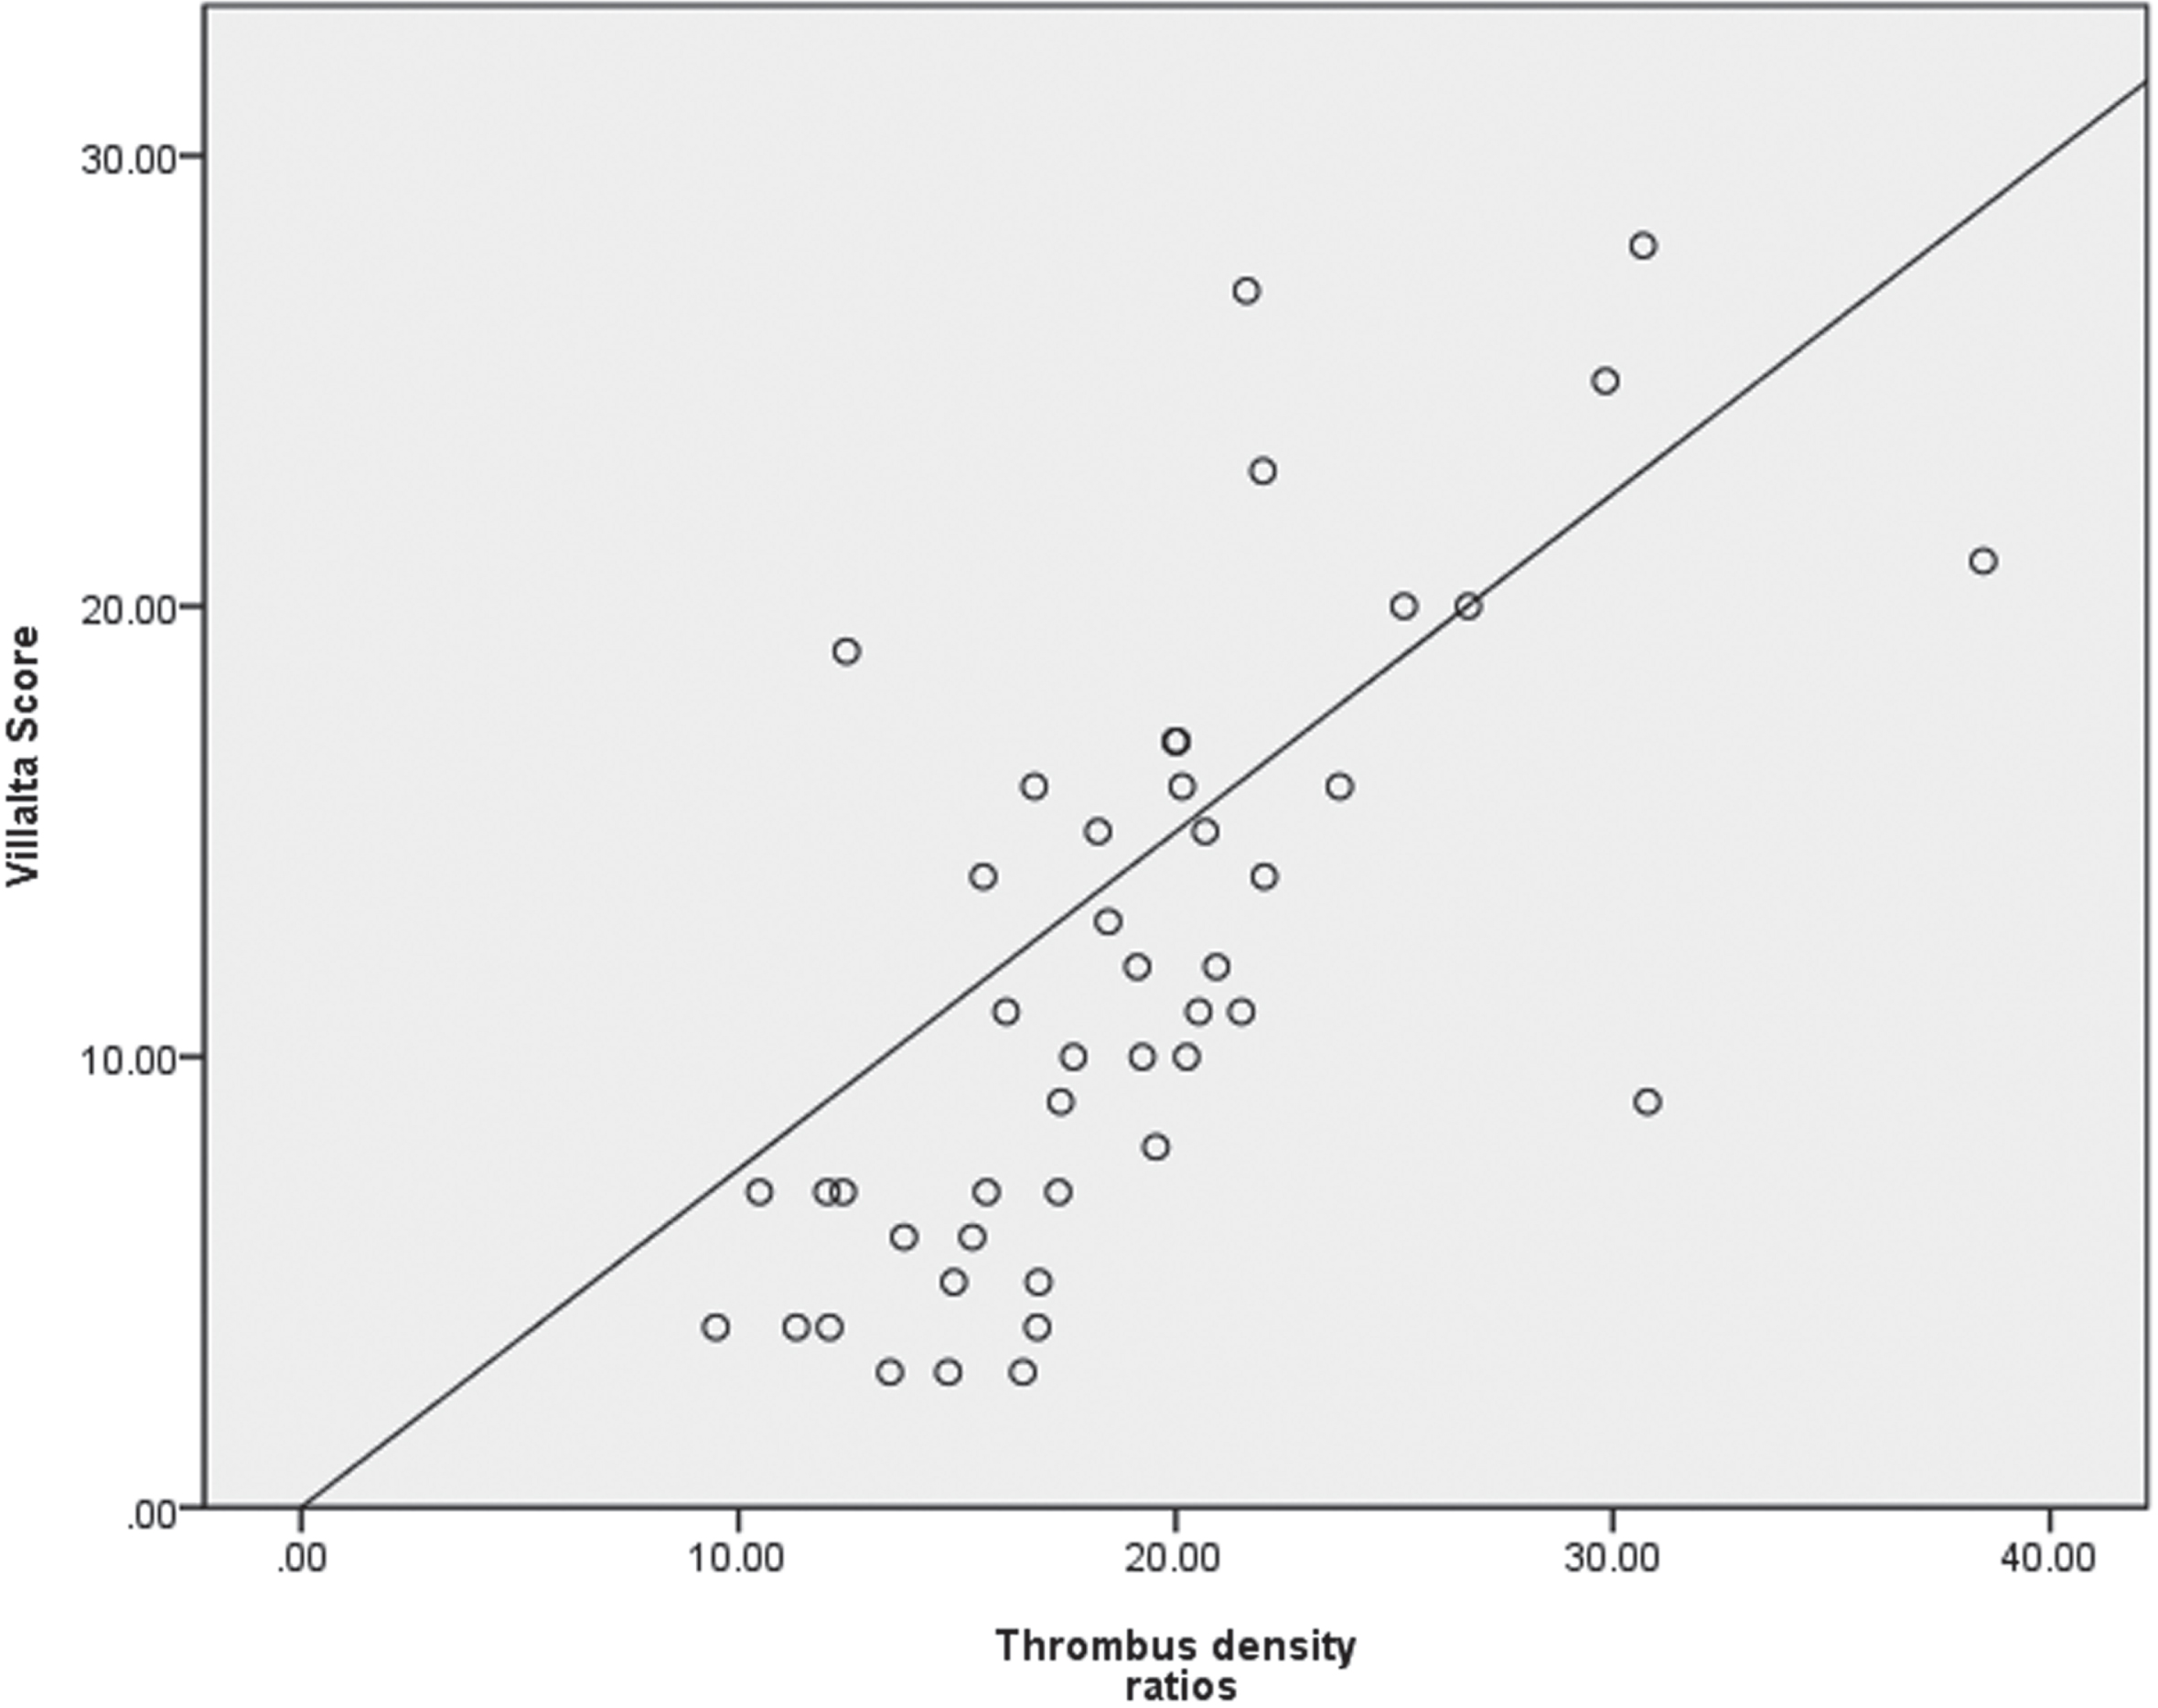
We excluded dead patients (7 patients), patients who had received DVT radiotherapy (25 patients), bedridden patients (5 patients), and patients who lost follow-up (6 patients). The remaining 45 patients were included as subgroups. Assess the correlation between PTS and the ratio of thrombus density. The average Villalta score was 11.8±6.7, and the average ratio of thrombosis density was 18.9% ±5.9. There was a correlation between thrombotic density ratio and Villalta score by Spearman correlation analysis (r = 0.728, P < 0.001) (Fig. 3).
Fig. 3
Correlation analysis between thrombus density ratio and Villata score.
4Discussion
Our study showed more patients with dyspnea, chest pain, and hemoptysis in the DVT with PE group than in the DVT-alone group, and the difference was statistically significant. Many factors lead to dyspnea caused by PE, which may be due to bronchospasm or vasospasm, pulmonary circulation problems, or diaphragmatic disorders caused by pulmonary infarction, resulting in hypoxia cardiac function damage. Studies have shown that in patients with heart failure or other lung diseases, the only symptom that causes PE deterioration may be dyspnea [17]. Chest pain and hemoptysis caused by PE may be related to a local disturbance of pulmonary circulation, pleural involvement, or coronary artery circulation damage [17]. The formation of lower limb DVT and related PE are the main causes of morbidity and mortality. Some researchers have investigated the factors predicted the formation of lower limb DVT in order to take preventive measures promptly. For instance, Chen et al. reported that mean platelet volume (MPV) is a predictor of DVT after total knee arthroplasty as MPV can reflect the hypercoagulable state of blood after surgery [18]. In Caimi et al.’s study, DVT is associated with the activation of CD18 in type II diabetes patients [19]. However, little research have been conducted to explore the predictors of the occurrence of related complications after DVT.
CTV and contrast enhanced ultrasound (CEUS) are both often used method for the detection of venous thromboses [20]. CEUS can sensitively depict the microcirculation perfusion within the tissue, overcoming the disadvantage of color ultrasound is difficult to show fine blood flow. However, the position of lower limb DVT embolus is quite deep, greatly limiting the detection rate of arterial blood flow by CEUS and making it difficult to diagnosis [21]. Compared to CEUS, lower limb CTV can help provide practical value about thrombus components by measuring the thrombus’s HU unit value, reflecting the sharpness of blood clots and the concentration of red blood cells [14]. Our study validates the hypothesis that, from the initial CT images, the thrombus density in the thrombotic veins is lower (i.e., lower HU units), and the possibility of pulmonary embolism is lower. Besides, we found that the thrombus density in the DVT with PE group was significantly higher than that in the DVT-alone group (19.6% ±5.5 and 14.6% ±3.5, respectively, P < 0.001). And the efficacy of thrombus density ratio in diagnosing PE is consistent with Wells score. Therefore, it shows that the lower limb’s DVT thrombus density ratio can be used to predict the risk of PE in DVT patients.
Inflammation affects blood vessels’ endothelial function [22] and may lead to venous thrombosis through endothelial activation [23]. In our study, the percentage of neutrophils and the white blood cell count is correlated with the risk of PE. As the rate of neutrophils and white blood cell count increased, the risk of PE decreased. Neutrophils play an essential role in the pathogenesis of venous thrombosis [24]. Neutrophil extracellular traps (NETs), an extracellular trap of neutrophils, respond to inflammatory stimulation, mainly formed in the tissue stage of venous thrombosis [25]. By binding red blood cells and platelets, NETs include a stent in the thrombus [26], replenishing the fibrin matrix; therefore, the NETs component changes the structure of fibrin to resist mechanical and enzymatic damage [27], thus maintaining thrombus stability. On the other hand, the increase of white blood cells leads to the vein wall’s injury, which stimulates the vein wall to produce a significant inflammatory reaction [28]. The inflammatory response occurrence leads to the increase of leukocyte adhesion [29], thus maintaining the thrombuss’ stability. These may explain why patients with higher neutrophils and higher white blood cells have less active thrombus, reducing PE risk.
Previous studies have shown that the average percentage of red blood cells in thrombus was very high, indicating high CT density [30]. Thrombus rich in platelet fragments has a lower HU unit value than red blood cell-rich thrombus because the HU unit value is linearly correlated with hemoglobin. White thrombus often has a lower HU unit value and greater resistance to fibrinolysis because it is composed of different proportions of platelets, atherosclerosis, cell debris, and fibrin, and there are almost no red blood cells [14, 30]. However, red thrombus can lead to a higher HU unit value and greater sensitivity to fibrinogen because it contains red blood cells full of hemoglobin and some fibrin [31]. That explains why the PE group with lower platelets and higher erythrocyte counts had higher Hu unit values than the DVT group alone. And as the platelet count increased, the risk of PE decreased.
The overall goal of direct oral anticoagulants such as rivaroxaban is to prevent further expansion of deep venous thrombosis and new thrombosis [32]. Studies have shown that DVT anticoagulation therapy can not wholly remove thrombus, residual thrombus caused by venous reflux obstruction, resulting in patients with PTS [33]. The density of thrombus is relatively high, and the percentage of red blood cells is relatively high. Studies have shown that the red thrombus is more extensive than the white thrombus [34]. The red thrombus will cause a larger area of blood vessel blockage. The mortality and disability rate is higher [35], which explains why, in our subgroup analysis, the Villalta score increased as the thrombus density ratio increased, the higher the risk that PTS will occur.
Our study had a number of limitations. First, the sample size of this study was small, so a study with a large sample size needs to be conducted to obtain more reliable results. Second, as there were few observation indicators, a comprehensive assessment of the factors affecting AIS prognosis could not be conducted. Finally, we only evaluated the prognosis of AIS patients during the hospitalization and did not evaluate their long-term prognosis. Thus, a prospective, large sample size study with sufficient observation indicators, and a long-term follow-up period needs to be conducted in the future.
5Conclusion
Percentage of neutrophils, platelets, and thrombus density ratio are independent predictors of PE. The increasement of lower extremity venous thrombosis density ratio may indicate PE and PTS’s risk in patients with DVT. However, given the limited samples size of this study, more studies with larger sample sizes need to be conducted to confirm the above conclusions.
Conflict of interest
All the authors certify that there is no actual or potential conflict of interests in this article.
Funding
None.
References
[1] | Kim M , Rooper L , Xie J , Kajdacsy-Balla AA , Barbolina MV . Fractalkine receptor CX(3)CR1 is expressed in epithelial ovarian carcinoma cells and required for motility and adhesion to peritoneal mesothelial cells. Mol Cancer Res. (2012) ;10: (1):11–24. |
[2] | Heit JA , Spencer FA , White RH . The epidemiology of venous thromboembolism. J Thromb Thrombolysis. (2016) ;41: (1):3–14. |
[3] | Huisman MV , Klok FA . Current challenges in diagnostic imaging of venous thromboembolism. Hematology Am Soc Hematol Educ Program. (2015) ;202–9. |
[4] | Konstantinides SV , Torbicki A , Agnelli G , Danchin N , Fitzmaurice D , Galie N , et al. 2014 ESC guidelines on the diagnosis and management of acute pulmonary embolism. Eur Heart J. (2014) ;35: (43):3033–69, 69a-69k. |
[5] | Wells PS , Anderson DR , Rodger M , Ginsberg JS , Kearon C , Gent M , et al. Derivation of a simple clinical model to categorize patients probability of pulmonary embolism: increasing the models utility with the SimpliRED D-dimer. Thromb Haemost. (2000) ;83: (3):416–20. |
[6] | Nagel SN , Steffen IG , Schwartz S , Hamm B , Elgeti T . Age-dependent diagnostic accuracy of clinical scoring systems and D-dimer levels in the diagnosis of pulmonary embolism with computed tomography pulmonary angiography (CTPA). Eur Radiol. (2019) ;29: (9):4563–71. |
[7] | Le Gal G , Righini M , Roy PM , Sanchez O , Aujesky D , Bounameaux H , et al. Prediction of pulmonary embolism in the emergency department: the revised Geneva score. Ann Intern Med. (2006) ;144: (3):165–71. |
[8] | 57Mikolka P , Kopincova J , Tomcikova Mikusiakova L , Kosutova P , Antosova M , Calkovska A , et al. Effects of surfactant/budesonide therapy on oxidative modifications in the lung in experimental meconium-induced lung injury. J Physiol Pharmacol. (2016) ;67: (1):57–65. |
[9] | Cohen AT , Agnelli G , Anderson FA , Arcelus JI , Bergqvist D , Brecht JG , et al. Venous thromboembolism (VTE) in Europe. The number of VTE events and associated morbidity and mortality. Thromb Haemost. (2007) ;98: (4):756–64. |
[10] | Rabinovich A , Kahn SR . How to predict and diagnose postthrombotic syndrome. Pol Arch Med Wewn 124: (7-8):(2014) ;410–6. |
[11] | Kahn SR , Partsch H , Vedantham S , Prandoni P , Kearon C , Subcommittee on Control of Anticoagulation of the S et al. Definition of post-thrombotic syndrome of the leg for use in clinical investigations: a recommendation for standardization. J Thromb Haemost. (2009) ;7: (5):879–83. |
[12] | Kolbach DN , Neumann HA , Prins MH . Definition of the post-thrombotic syndrome, differences between existing classifications. Eur J Vasc Endovasc Surg. (2005) ;30: (4):404–14. |
[13] | Min SK , Kim YH , Joh JH , Kang JM , Park UJ , Kim HK , et al. Diagnosis and Treatment of Lower Extremity Deep Vein Thrombosis: Korean Practice Guidelines. Vasc Specialist Int. (2016) ;32: (3):77–104. |
[14] | Kirchhof K , Welzel T , Mecke C , Zoubaa S , Sartor K . Differentiation of white, mixed, and red thrombi: value of CT in estimation of the prognosis of thrombolysis phantom study. Radiology. (2003) ;228: (1):126–30. |
[15] | Mokin M , Morr S , Natarajan SK , Lin N , Snyder KV , Hopkins LN , et al. Thrombus density predicts successful recanalization with Solitaire stent retriever thrombectomy in acute ischemic stroke. J Neurointerv Surg. (2015) ;7: (2):104–7. |
[16] | Puig J , Pedraza S , Demchuk A , Daunis IEJ , Termes H , Blasco G , et al. Quantification of thrombus hounsfield units on noncontrast CT predicts stroke subtype and early recanalization after intravenous recombinant tissue plasminogen activator. AJNR Am J Neuroradiol. (2012) ;33: (1):90–6. |
[17] | Collomb D , Paramelle PJ , Calaque O , Bosson JL , Vanzetto G , Barnoud D , et al. Severity assessment of acute pulmonary embolism: evaluation using helical CT. Eur Radiol. (2003) ;13: (7):1508–14. |
[18] | Chen JH , Zhou H , Zhang Q , Wang H , Hidig SM , Chen XY , Feng S . Diagnostic value of mean platelet volume combined with thromboelastography for coagulation state after total knee arthroplasty. Clin Hemorheol Microcirc. (2023) ;84: (3):321–331. |
[19] | Caimi G , Lo Presti R , Carollo C , Montana M , Carlisi M Polymorphonuclear phenotypical expression of CD18, at baseline and after in vitro activation, in several clinical disorders: Revision of our case series. Clin Hemorheol Microcirc. 2023. doi:10.3233/CH-231771. |
[20] | Dong Y , Qiu Y , Cao J , et al. Ultrasound features of abdominal thrombosis in COVID 19 patients. Clin Hemorheol Microcirc. (2022) ;82: (3):239–248. |
[21] | Hirsh J , Ginsberg JS , Chan N , Guyatt G , Eikelboom JW . Mandatory contrast-enhanced venography to detect deep-vein thrombosis (DVT) in studies of DVT prophylaxis: upsides and downsides. Thromb Haemost. (2014) ;111: (1):10–13. |
[22] | Bhagat K , Vallance P . Inflammatory cytokines impair endothelium-dependent dilatation in human veins in vivo. Circulation. (1997) ;96: (9):3042–7. |
[23] | Koster T , Rosendaal FR , Lieuw ALDD , Kroes AC , Emmerich JD , van Dissel JT . Chlamydia pneumoniae IgG seropositivity and risk of deep-vein thrombosis. Lancet. (2000) ;355: (9216):1694–5. |
[24] | Martinod K , Wagner DD . Thrombosis: tangled up in NETs. Blood. (2014) ;123: (18):2768–76. |
[25] | Savchenko AS , Martinod K , Seidman MA , Wong SL , Borissoff JI , Piazza G , et al. Neutrophil extracellular traps form predominantly during the organizing stage of human venous thromboembolism development. J Thromb Haemost. (2014) ;12: (6):860–70. |
[26] | Fuchs TA , Brill A , Duerschmied D , Schatzberg D , Monestier M , Myers DD Jr et al. Extracellular DNA traps promote thrombosis. Proc Natl Acad Sci U S A. (2010) ;107: (36):15880–5. |
[27] | Longstaff C , Varju I , Sotonyi P , Szabo L , Krumrey M , Hoell A , et al. Mechanical stability and fibrinolytic resistance of clots containing fibrin, DNA, and histones. J Biol Chem. (2013) ;288: (10):6946–56. |
[28] | Sullivan VV , Hawley AE , Farris DM , Knipp BS , Varga AJ , Wrobleski SK ,et al. Decrease in fibrin content of venous thrombi in selectin-deficient mice. J Surg Res. (2003) ;109: (1):1–7. |
[29] | Li X , Klintman D , Weitz-Schmidt G , Schramm R , Thorlacius H . Lymphocyte function antigen-1 mediates leukocyte adhesion and subsequent liver damage in endotoxemic mice. Br J Pharmacol. (2004) ;141: (4):709–16. |
[30] | Chueh JY , Wakhloo AK , Hendricks GH , Silva CF , Weaver JP , Gounis MJ . Mechanical characterization of thromboemboli in acute ischemic stroke and laboratory embolus analogs. AJNR Am J Neuroradiol. (2011) ;32: (7):1237–44. |
[31] | Castaigne P , Lhermitte F , Gautier JC , Escourolle R , Derouesne C . Internal carotid artery occlusion. A study of 61 instances in 50 patients with post-mortem data. Brain. (1970) ;93: (2):231–58. |
[32] | Evans VJ , Lawrence M , Whitley J , Johns C , Pillai S , Hawkins K , Power K , Morris K , Williams PR , Evans PA . The treatment effect of rivaroxaban on clot characteristics in patients who present acutely with first time deep vein thrombosis. Clin Hemorheol Microcirc. (2022) ;80: (2):139–151. |
[33] | Tan M , Mos IC , Klok FA , Huisman MV . Residual venous thrombosis as predictive factor for recurrent venous thromboembolim in patients with proximal deep vein thrombosis: a sytematic review. Br J Haematol. (2011) ;153: (2):168–78. |
[34] | Quadros AS , Cambruzzi E , Sebben J , David RB , Abelin A , Welter D , et al. Red versus white thrombi in patients with ST-elevation myocardial infarction undergoing primary percutaneous coronary intervention: clinical and angiographic outcomes. Am Heart J. (2012) ;164: (4):553–60. |
[35] | Keller K , Geyer M , Munzel T , Ostad MA , Gori T . Impact of atrial fibrillation on in-hospital mortality of ischemic stroke patients and identification of promoting factors of atrial thrombi - Results from the German nationwide inpatient sample and a single-center retrospective cohort. Medicine (Baltimore). (2019) ;98: (4):e14086. |


