
Clinical study on the evaluation of liver fibrosis by ultrasound elastography combined with platelet count model
Abstract
OBJECTIVES:
To establish the prediction model of liver fibrosis by combining ultrasound elastography and platelet count and evaluates its clinical value.
METHODS:
146 patients with chronic liver diseases(CLD) admitted to our hospital from July 2020 to July 2022 were collected for liver biopsy pathological examination, and the results of ultrasound elastography (liver hardness value) and serological indicators were collected. Based on the results of Spearman correlation test and multiple linear regression model, the prediction model of liver fibrosis using ultrasound elastography combined with platelet count was constructed and verified.
RESULTS:
The AUC of transient elastography combined with platelet count model (FSP) in the diagnosis of S2, S3 and S4 phases of liver fibrosis was 0.665, 0.835 and 0.909, with specificity of 81.5%, 90.0% and 100%. The AUC of sound touch elastography combined with platelet count model (STEP) in diagnosing S2, S3 and S4 phases of liver fibrosis was 0.685, 0.810 and 0884, with specificity of 96.3%, 90.0% and 83.3%, which are higher than APRI, FIB-4, FORNS, AAR and other models.
CONCLUSION:
Ultrasound elastography combined with platelet count model has good diagnostic efficacy for liver fibrosis.
1Introduction
Liver fibrosis is a common pathological stage after various chronic liver injuries. It is a chronic progressive reversible process. Without timely treatment and intervention, it can eventually progress to cirrhosis or even liver cancer. Therefore, the early diagnosis of liver fibrosis is crucial for the treatment of chronic liver disease [1].
Currently, there are various methods to evaluate liver fibrosis. Liver tissue biopsy is the gold standard for evaluating the degree of liver fibrosis, but it is an invasive examination and should not be operated repeatedly. Therefore, the application of long-term follow-up for patients with chronic liver disease is limited [2]. Magnetic resonance elastography (MRE) still has certain limitations in clinical application. Biliary obstruction, right heart failure and changes in portal blood flow all have an impact on the LS measurement of MRE, and the cost of MRE is relatively high, which can not be widely carried out temporarily [3]. Serological indicators and diagnostic models are easily affected by their own metabolism, with poor specificity [4, 5].
According to current guidelines(EFSUMB), ultrasound elastography has been proved to be an effective method to predict the degree of liver fibrosis. The main ultrasound elastography include instantaneous elastic imaging (Fibroscan, TE), shear wave elastic imaging (2D-SWE), sound touch elastography(STE) and acoustic pulse radiation imaging (ARFI). Ultrasound elastography has the advantages of simple operation, good repeatability, and low cost, which can accurately evaluate liver fibrosis [6].
However, each of these ultrasound elastography has its own limitations. Fibroscan measurements are influenced by factors such as liver inflammation, cholestasis, fat thickness, and ascites. The sampling volume range of ARFI is limited, and the measurement range of ARFI method is relatively narrow, which makes the evaluation of liver fibrosis stage inaccurate. The measured value of SWE is affected by liver steatosis and inflammation. Liver inflammation and patients’ inability to cooperate in holding their breath can affect the accuracy of STE measurement [7–9].
In this study, we intend to establish a multi-parameter model to study and verify its diagnostic efficacy in the diagnosis of liver fibrosis by combining ultrasound elastography techniques with the selected serological indicators.
2Materials and methods
2.1Study subject
This study was approved by the ethics committee of Shanghai Public Health Clinical Center (2022-S086-01), and all patients gave informed consent.
One hundred and forty-six patients with CLD, 64 males and 85 females, aged 14-73 years, with a mean of (48.87±11.95) years, who admitted to our Clinical Center from Jul. 1, 2020 to Aug. 15, 2022, were enrolled. There were 61 cases of chronic hepatitis B (CHB), 2 cases of chronic hepatitis C (CHC), 42 cases of autoimmune liver disease (AIH), 8 cases of primary biliary cirrhosis (PBC), 14 cases of drug-induced liver damage (DILI), 1 case of alcoholic liver disease (ALD), 7 cases of fatty liver disease (NAFLD), and 12 cases of other liver injury with unknown reason, One case of congenital hyperbilirubinemia. All patients were successfully examined with STE and Fibroscan elastography all performed by a senior physician.
Inclusion criteria:1. All enrolled patients underwent liver biopsy and had definite pathological diagnosis. 2. All enrolled patients have a complete clinical history. 3. Two kinds of ultrasound elastography and serological tests were completed within 1-2 days before liver biopsy in the enrolled patients.
Exclusion criteria:1. Patients whose pathological puncture specimens did not meet the pathological diagnostic requirements (length less than 15 mm, number of confluent areas less than 6). 2. Patients with malignant tumor. 3. Pregnant women.
2.2Instruments and methods
2.2.1FibroScan
Using Echosens FibroScan 502 liver fibrosis scanner, M-type probe, probe frequency 5 MHz. The patient was placed in a supine position with the right arm elevated over the head and the probe was placed between the 7th and 9th ribs of the right anterior axillary line to the mid-axillary line. Liver stiffness values (in KPa) were obtained. Ten successful tests were required, with a success rate of at least 60% and a deviation of less than 30% of the median value. The median of the 10 tests was taken.
2.2.2STE
Using the Mindray Resona8 Color Doppler Ultrasound, SC6-1U convex array probe, frequency 1 6 MHz, The patient was fasted for at least 2 h, placed in a lateral position with the right upper limb highly abducted, and the right intercostal region was selected for examination. The patient was asked to hold his breath for about 4 seconds under steady breathing condition to display satisfactory elasticity images under 2D image guidance, and then freeze and store them after stabilization to obtain the elastic modulus value of the liver in the area of interest. The results were output by repeating the test 5 times (≥3 times successfully) in the same patient. The mean value of 5 measurements was taken as the test result.
2.2.3Pathological examination
After all patients signed the informed consent form within one week of admission, liver histological biopsies were performed by rapid percutaneous hepatic puncture with a 16 G Bard’s disposable needle under color ultrasound guidance. The samples were stained with conventional hematoxylin and eosin. The liver tissue samples were stained with conventional hematoxylin and eosin(HE)and reticulated staining. Began to destroy the lobular structure of the liver, with the appearance of P-C fibrous septa, and no obvious cirrhosis. S4:suspected or definite cirrhosis. Where S2 is defined as the stage of significant liver fibrosis, S3 is defined as the stage of severe liver fibrosis, and S4 is defined as the stage of cirrhosis [10].
2.2.4Serological tests
All enrolled patients were tested for routine blood, liver function, immunoproteins and other relevant indexes within one week of admission. Alanine aminotransferase (ALT, U/L), aspartate aminotransferase (AST, U/L), L-γ-glutamyl transpeptidase (GGT, U/L), globulin (GLB, g/L), total cholesterol (Chol, mol/L), platelets (PLT,×109/L), hyaluronic acid (HA, ng/ml), laminin (LN, ng/ml), precollagen type III (PIIIP, ng/ml), collagen type IV(CIV, ng/ml), immunoglobulin G (IgG, g/L) and other relevant serological indices. The AAR, APRI, Forns, and FIB-4 model equations were applied to calculate: 1. AAR=AST/ALT; 2. APRI=(AST/ULN)×100/PLT; 3. Forns=7.811-3.131*In(PLT)+0.781×In(GGT)+3.467* In(age)-0.014*(Chol); 4. FIB-4 = age* AST/PLT* ALT½.
2.2.5Statistical analysis
Data were analyzed by SPSS 22.0 software, R language 4.2.1, with measurement data expressed as (x±s), and comparisons were performed by t-test, non-parametric tests by Mann-Whitney U test, correlation analysis by Spearman correlation test, and multivariate analysis by multiple linear regression analysis. The specificity, sensitivity, and area under the ROC curve(AUC)of each model for the diagnosis of liver fibrosis and cirrhosis were calculated using R language 4.2.1, and all tests were two-sided. p<0.05 was considered a statistically significant difference.
3Results
3.1Patients’characteristics
A total of 146 patients with CLD were included, including 64 males and 85 females, with an average age of 48.87±11.95 years. The Patients’ characteristics at the time of the liver biopsy were shown in Table 1.
Table 1
Baseline characteristics of the146 patient with CLD at the time of the liver biopsy
| Subject | Group | Statistical result |
| Gender | Male | 64 |
| Female | 85 | |
| Age | Mean | 48.87±11.95 |
| Type of liver disease | CHB | 61 |
| CHC | 3 | |
| AIH | 42 | |
| PBC | 8 | |
| DILI | 14 | |
| ALD | 1 | |
| NAFLD | 7 | |
| LID | 12 | |
| Congenital hyperbilirubinemia | 1 |
3.2Analysis using the Mann-Whitney U test
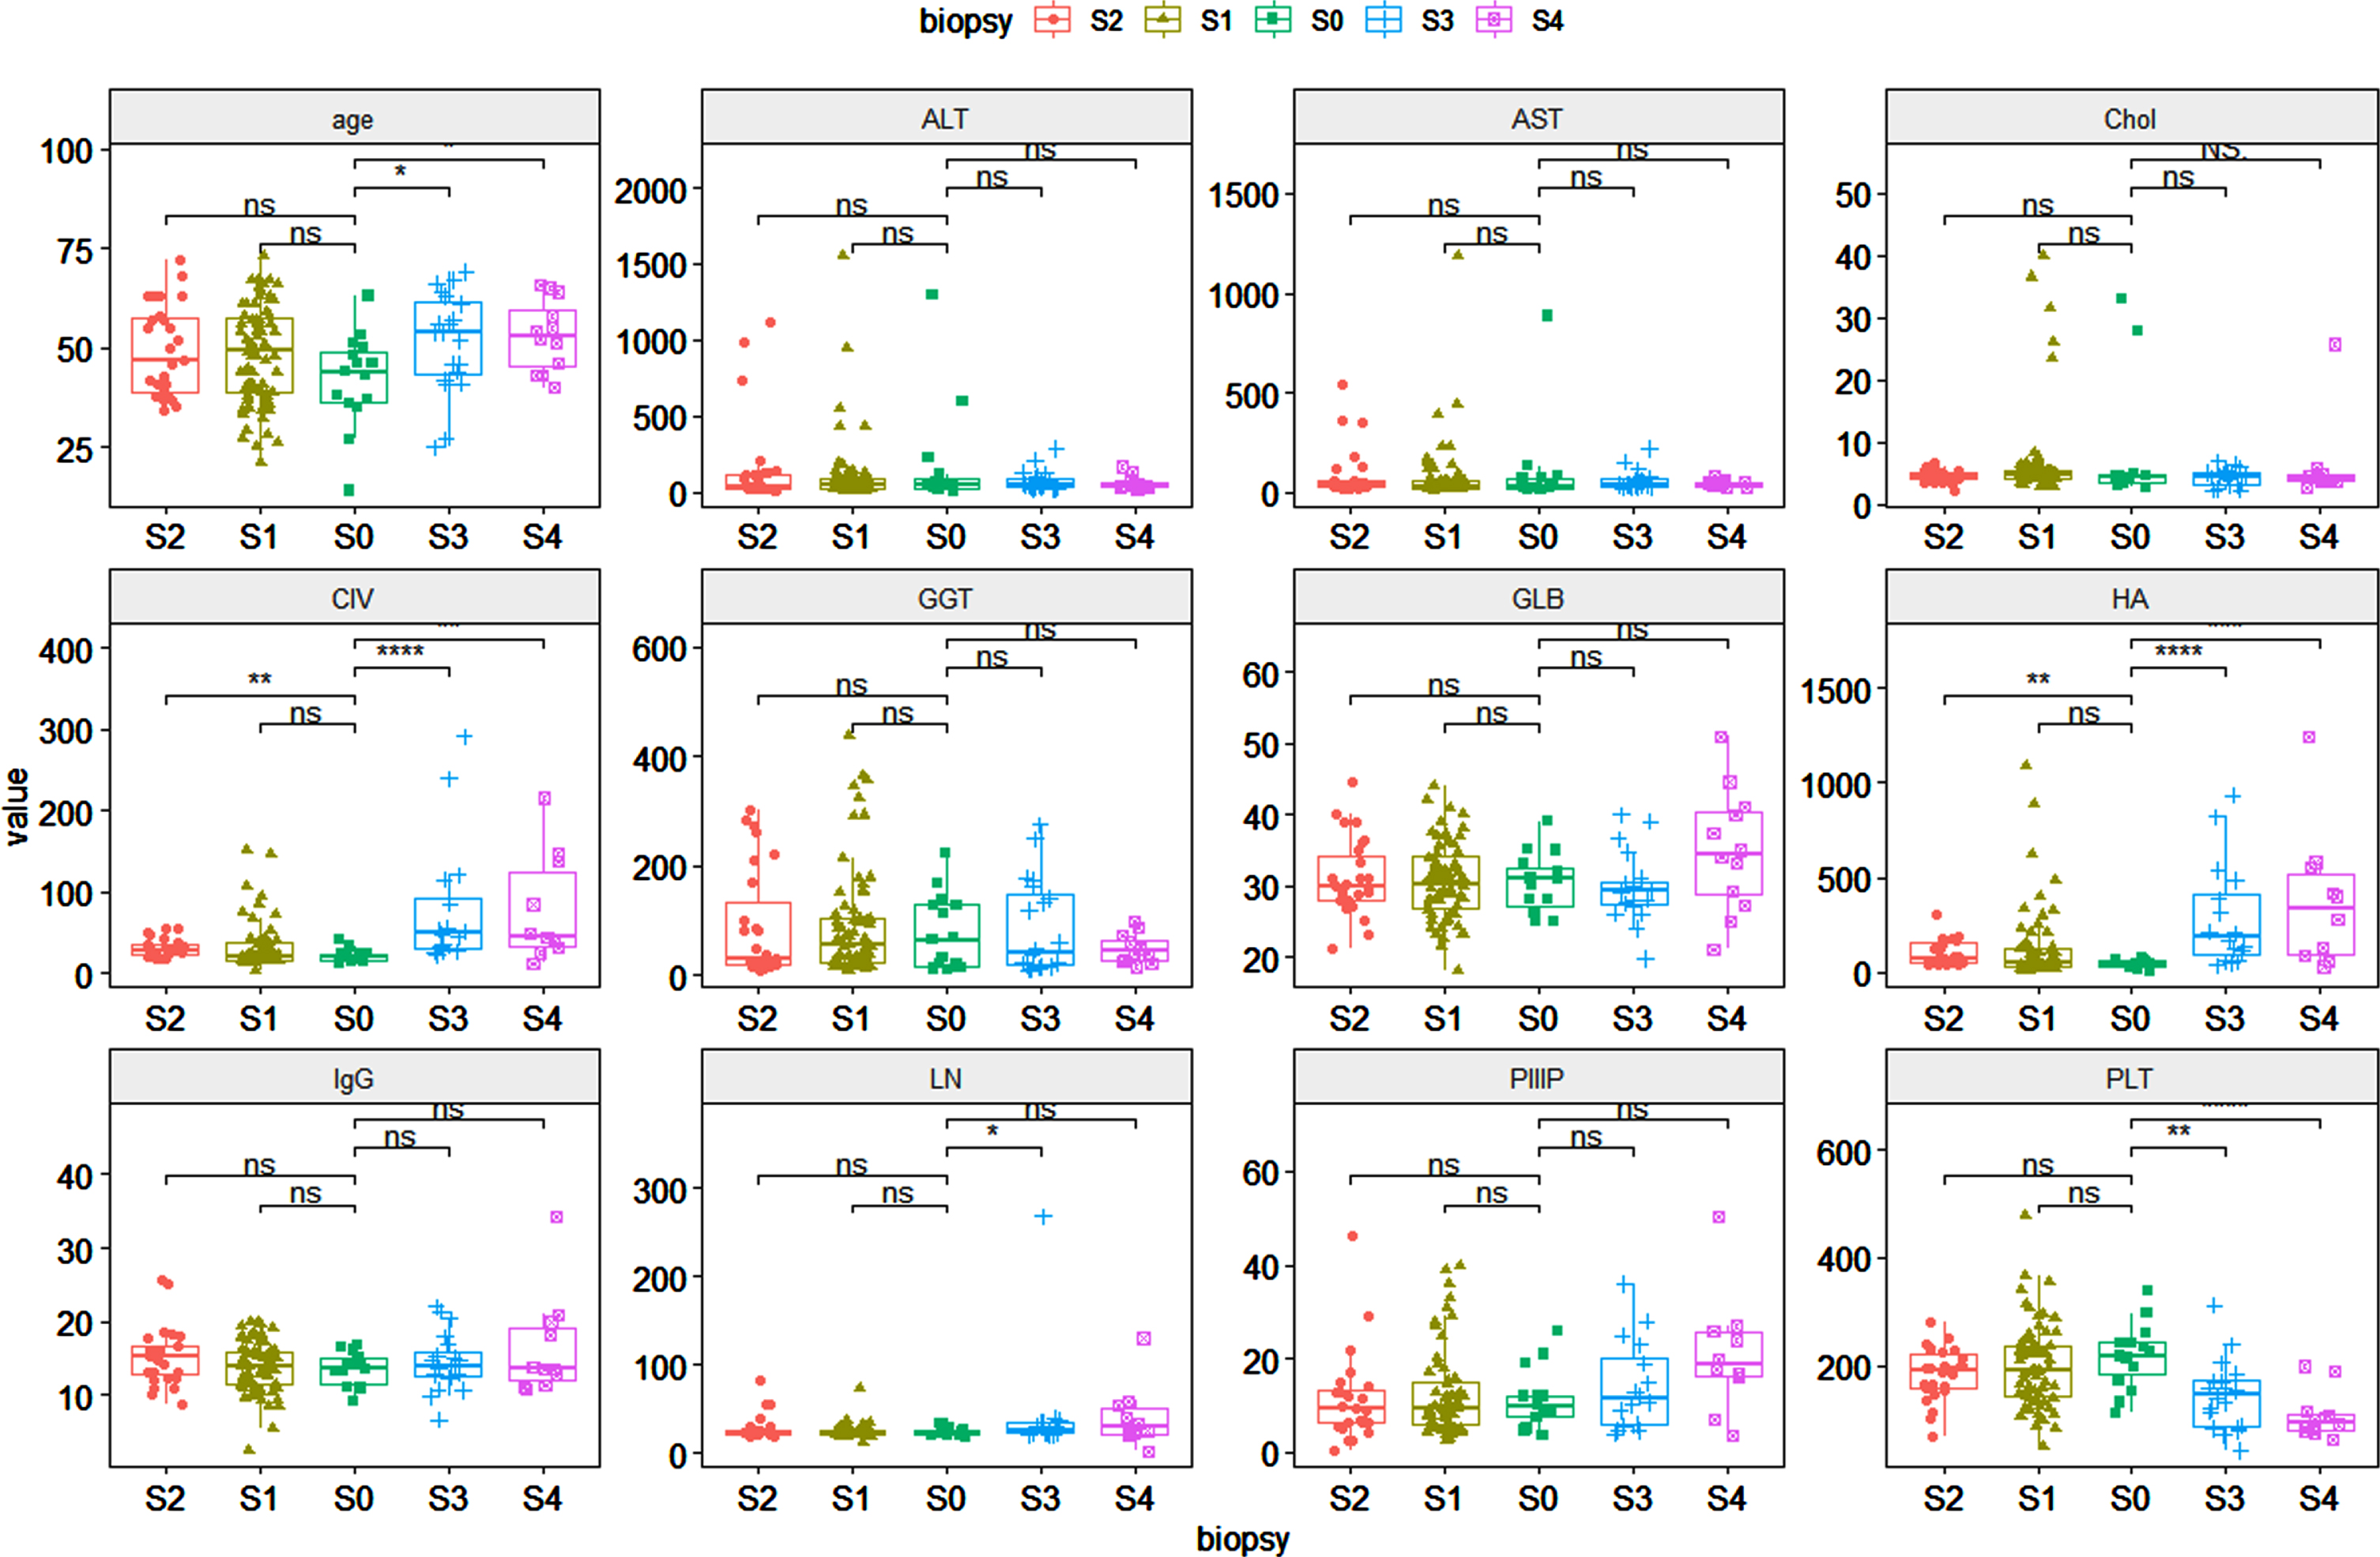
Compared with patients without liver fibrosis, in the stage of significant fibrosis:there were statistical differences in CIV, HA. In the stage of severe liver fibrosis:there were statistical differences in age, CIV, HA, LN, PLT. In the stage of cirrhosis: age, CIV, HA, PLT (Fig. 1).
Fig. 1
Comparison of different indicators of liver fibrosis at various stages
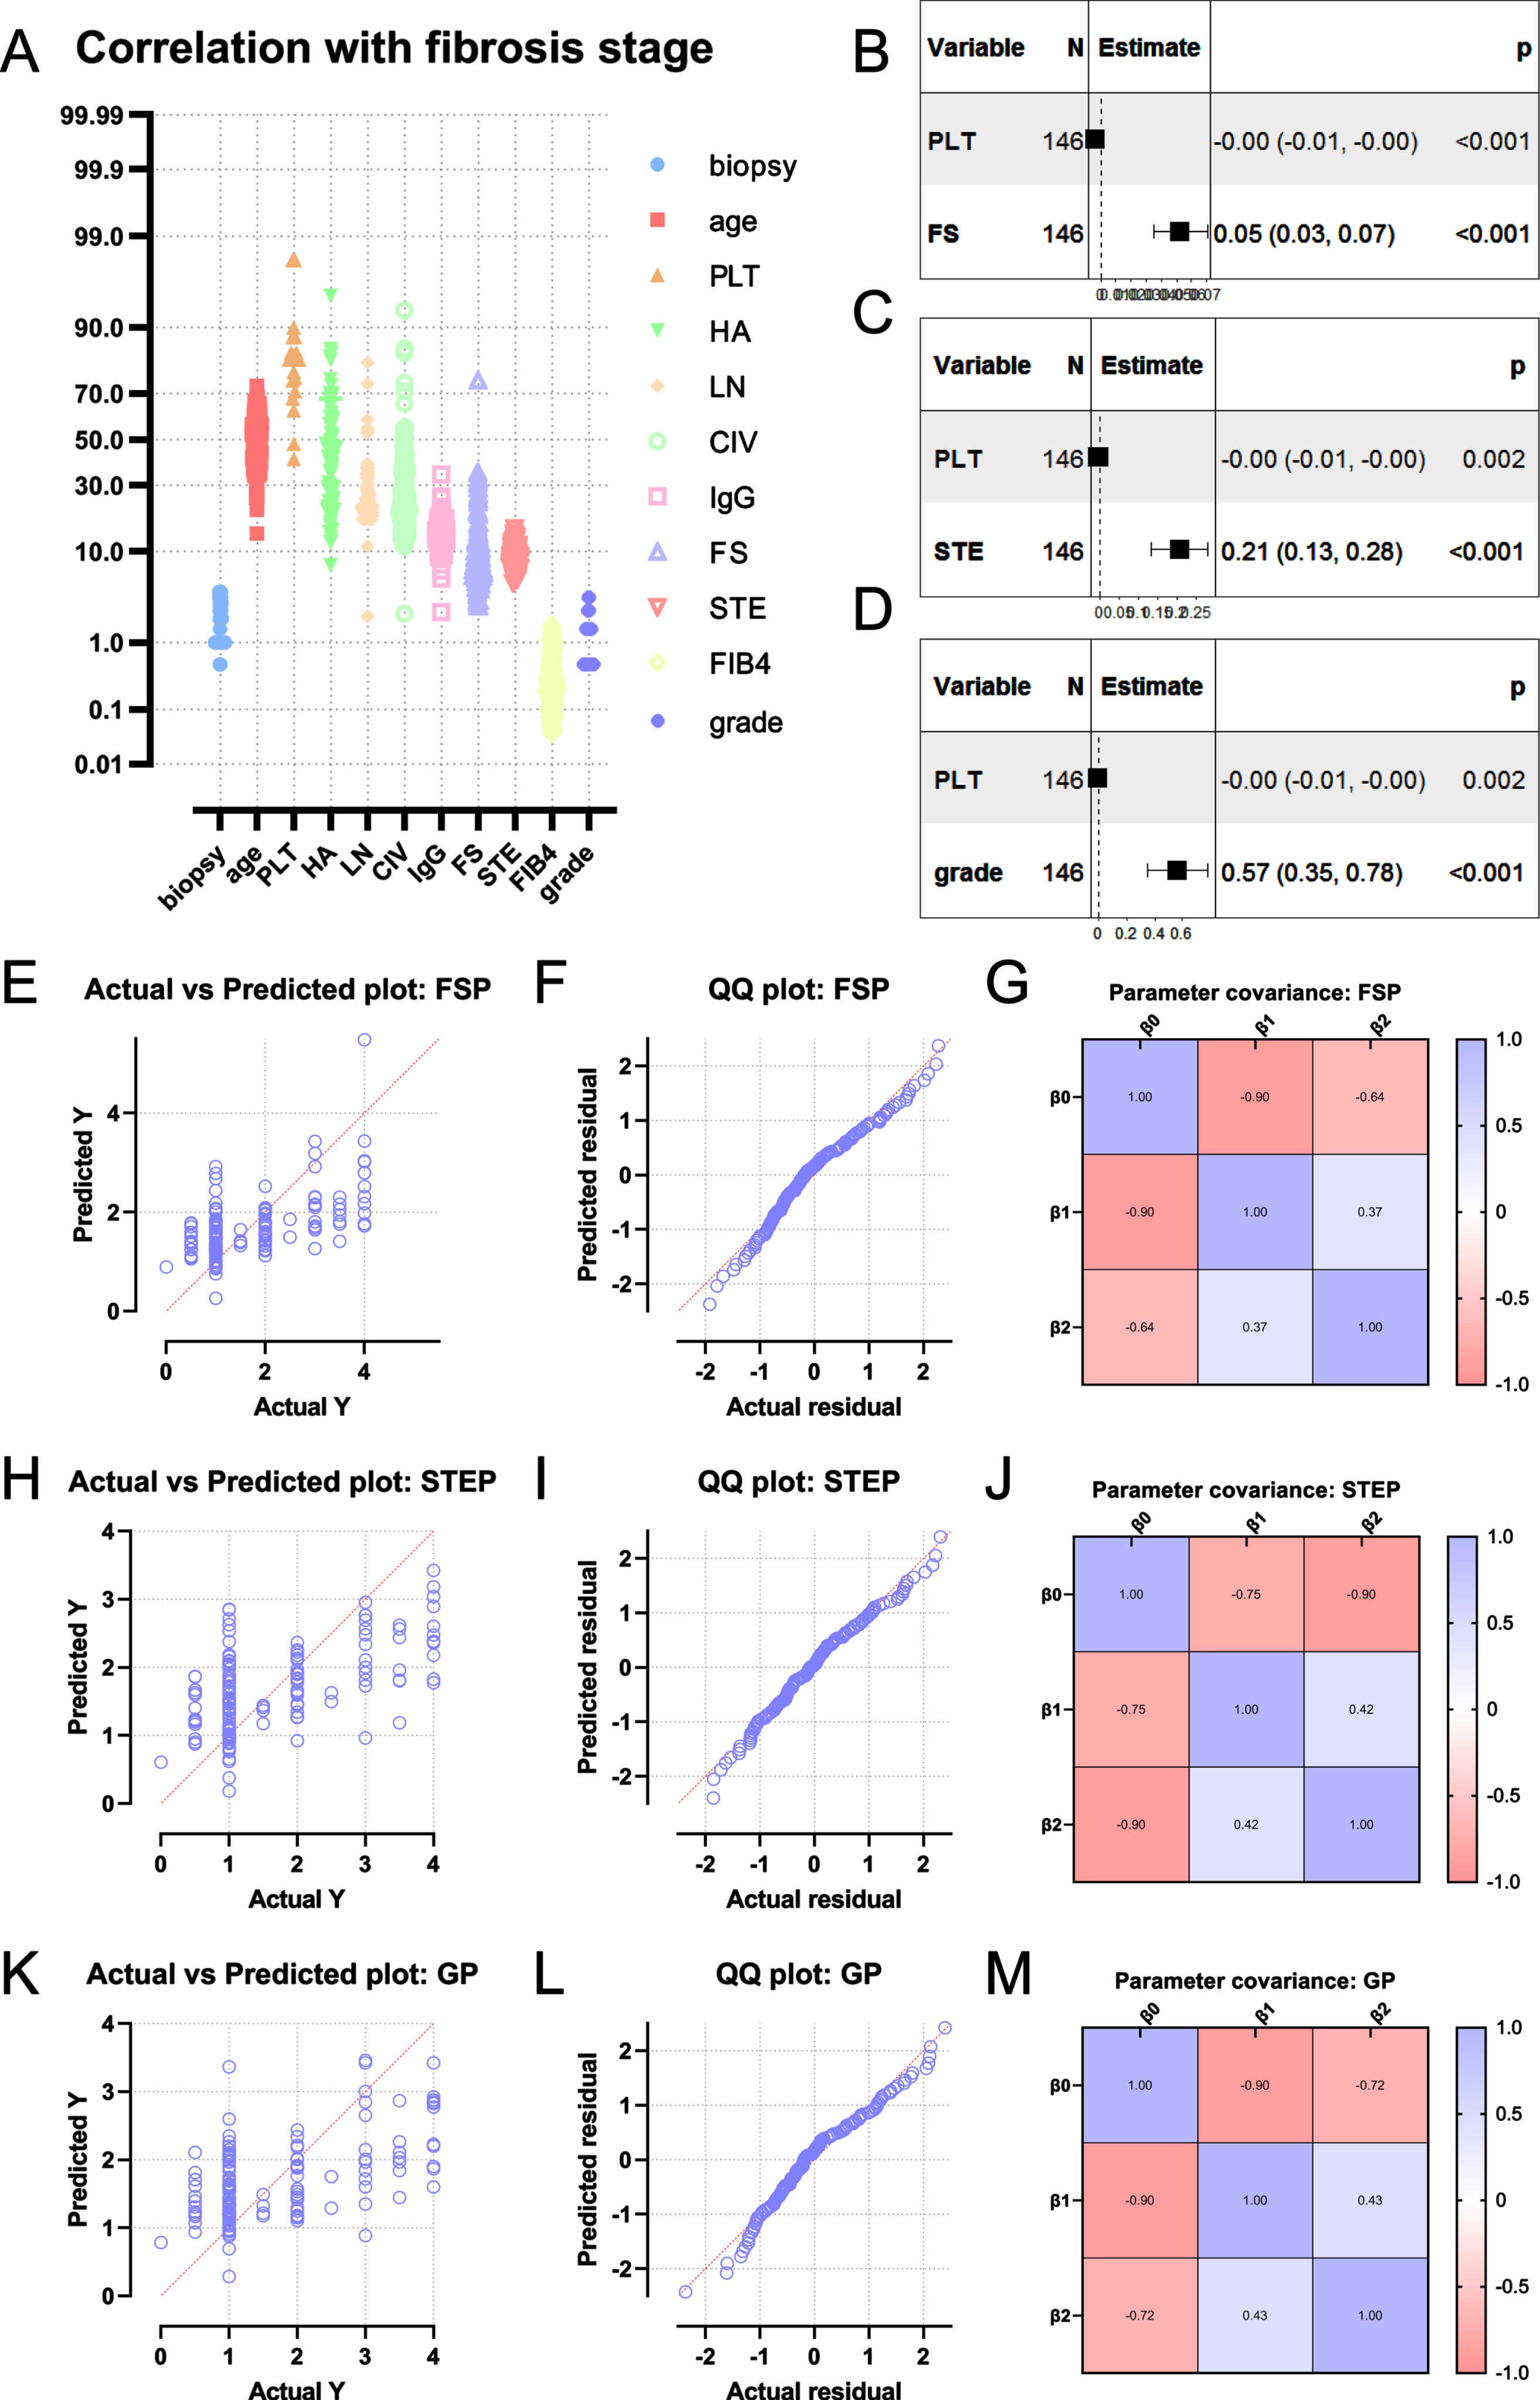
3.3Correlation of liver fibrosis with multiple indicators
Age, HA, LN, CIV, IgG, FS, STE, FIB4 were positively correlated with the degree of liver fibrosis (all P < 0.05). PLT was negatively correlated with the degree of liver fibrosis (P < 0.05). From the Spearman correlation analysis, the indexes such as FibroScan hardness value, STE hardness value, age, PLT, HA, LN, CIV, IgG, FIB4 were selected for multiple linear regression analysis. The results showed that the lower the platelet level, the higher the FS and STE values, and the higher the degree of liver fibrosis (Table 2).
Table 2
Parameters with potential predictive value for liver fibrosis
| Subject | r | P |
| Age (years) | 0.1966 | 0.0174 |
| PLT | –0.4175 | <0.0001 |
| HA | 0.3632 | <0.0001 |
| LN | 0.2448 | 0.0066 |
| CIV | 0.3844 | <0.0001 |
| IgG | 0.1657 | 0.0479 |
| FibroScan LSM | 0.5272 | <0.0001 |
| STE | 0.5261 | <0.0001 |
| FIB-4 | 0.2873 | 0.0004 |
3.4Establishment of prediction model
Based on the results of the correlation analysis, we chose FS combined with PLT and STE combined with PLT as the prediction models for the analysis. The final multivariate linear prediction model of the degree of liver fibrosis was derived: 1. FSP=0.05266*FSLSM-0.003854*PLT. 2. STEP=0.2075*STELSM-0.003568*PLT. The goodness of fit of the two models can be seen from the QQ plot (Fig. 2).
Fig. 2
Establishment of prediction model of liver fibrosis based on FibroScan or STE
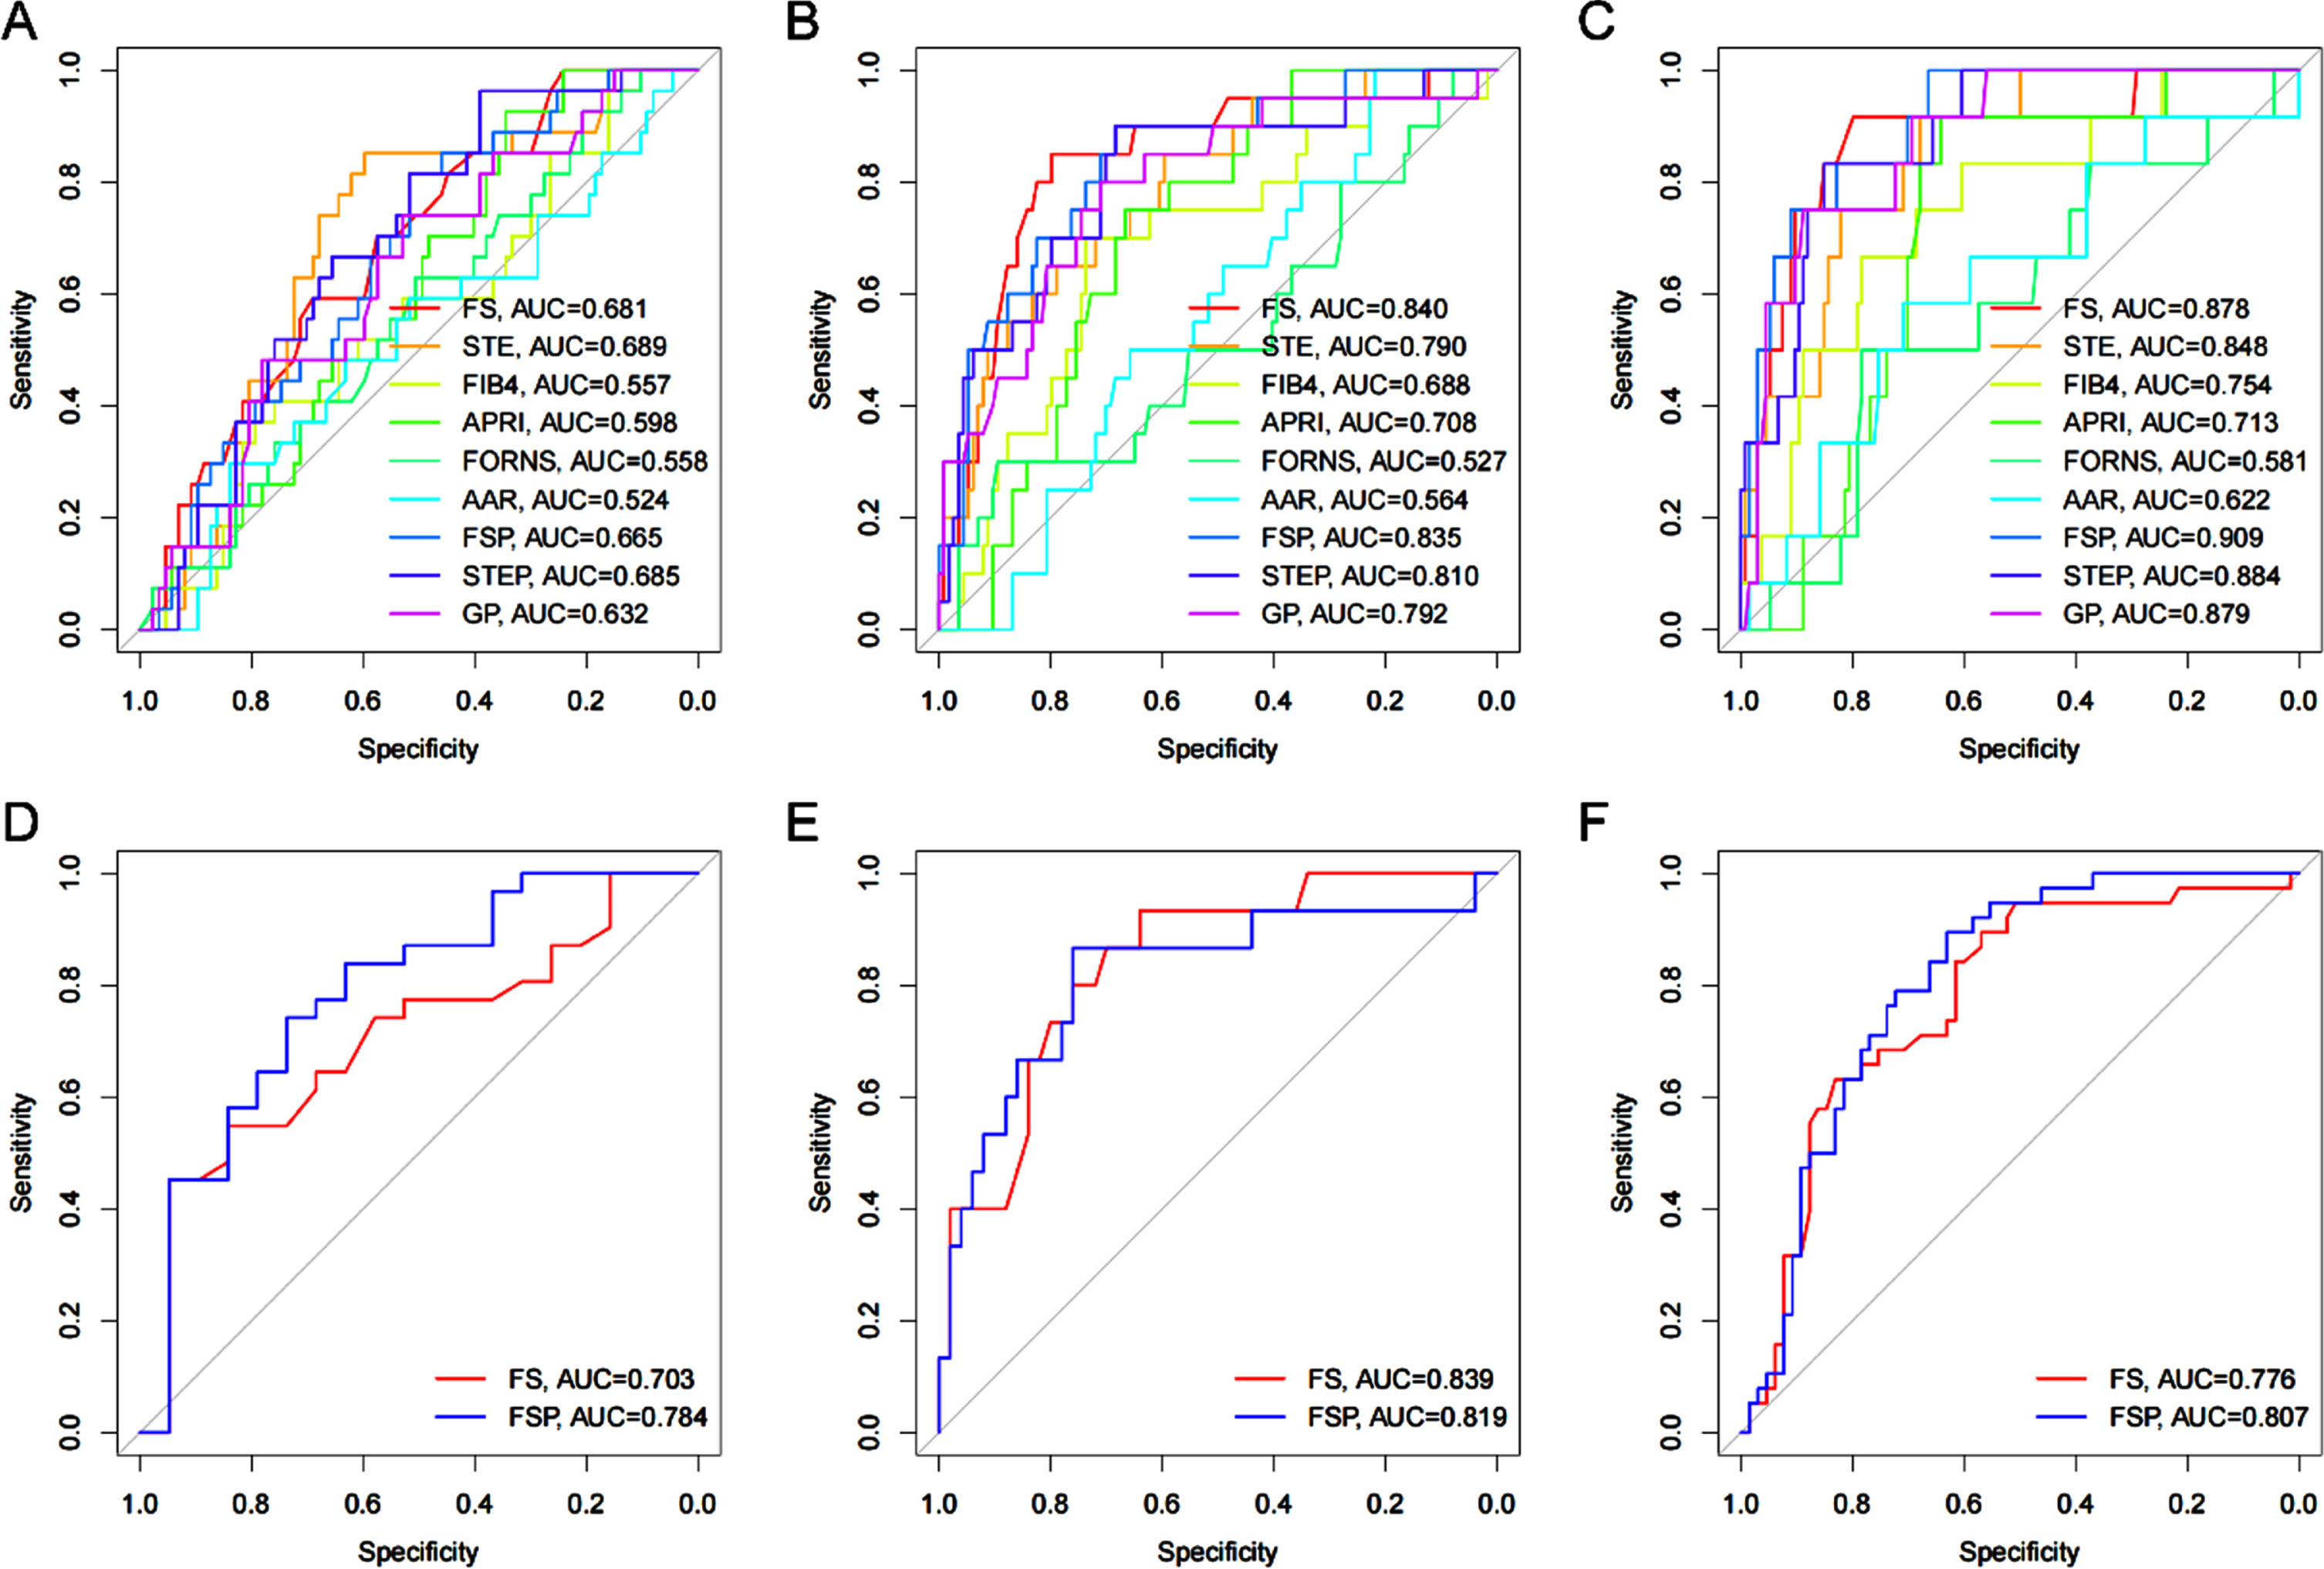
3.5Comparison of prediction models and serological models
The AUC of stage S2, S3 and S4 diagnosed by FSP was 0.665(95% CI: 0.556 0 775), 0. 835(95% CI:0.742 0.929), 0. 909 (95% CI: 0.837 0.980), specificity 81.5%, 90.0% and 100%, sensitivity 51.7%, 68.4% and 66.4% respectively. The AUC of stage S2, S3 and S4 diagnosed by STEP was 0 685(95% CI:0.581 0.789), 0. 810(95% CI:0.699 0.20), 0. 884(95% CI:0.803 0.965), the specificity was 96.3%, 90.0% and 83.3%, and the sensitivity was 89.1%, 68.4% and 85.1% respectively (Tables 3–5).
Table 3
Diagnostic efficacy of all liver fibrosis indicators and models at S2 stage
| S2 | |||||
| Subject | AUC | Sensitivity | Specificity | CUT OFF | 95% CI |
| FS | 0.681 | 0.690 | 0.593 | 7.750 | 0.571–0.790 |
| STE | 0.689 | 0.598 | 0.852 | 7.782 | 0.580–0.799 |
| FIB4 | 0.557 | 0.759 | 0.407 | 0.294 | 0.433–0.681 |
| APRI | 0.598 | 0.345 | 0.926 | 0.314 | 0.487–0.708 |
| FORNS | 0.558 | 0.506 | 0.630 | 7.746 | 0.437–0.679 |
| AAR | 0.524 | 0.839 | 0.296 | 1.219 | 0.394–0.653 |
| FSP | 0.665 | 0.517 | 0.815 | –0.426 | 0.556–0.775 |
| STEP | 0.685 | 0.391 | 0.963 | 0.729 | 0.581–0.789 |
Table 4
Diagnostic efficacy of all liver fibrosis indicators and models at S3 stage
| S3 | ||||||
| Subject | AUC | Sensitivity | Specificity | CUT OFF | 95% CI | P |
| FS | 0.840 | 0.798 | 0.850 | 9.950 | 0.741–0.939 | |
| STE | 0.790 | 0.596 | 0.850 | 8.380 | 0.685–0.895 | |
| FIB4 | 0.688 | 0.737 | 0.700 | 0.303 | 0.559–0.817 | a |
| APRI | 0.708 | 0.667 | 0.750 | 0.674 | 0.610–0.807 | b/e |
| FORNS | 0.527 | 0.895 | 0.300 | 7.765 | 0.379–0.675 | c/f |
| AAR | 0.564 | 0.219 | 1.000 | 0.530 | 0.444–0.683 | d/g |
| FSP | 0.835 | 0.684 | 0.900 | -0.215 | 0.742–0.929 | |
| STEP | 0.810 | 0.684 | 0.900 | 1.195 | 0.699–0.920 | |
a: FIB4 vs. FSP,*; b:APRI vs FSP,**; c: FORNS vs FSP,***; d: AAR vs FSP,***; e: APRI vs STEP,*; f: FORNS vs STEP,***; g: AAR vs STEP,** *: p<0.05; **: p<0.01; ***: p<0.001.
Table 5
Diagnostic efficacy of all liver fibrosis indicators and models at S4 stage
| S4 | ||||||
| Subject | AUC | Sensitivity | Specificity | CUT OFF | 95% CI | P |
| FS | 0.878 | 0.799 | 0.917 | 11.600 | 0.765-0.991 | |
| STE | 0.848 | 0.679 | 0.917 | 9.232 | 0.753-0.944 | |
| FIB4 | 0.754 | 0.784 | 0.667 | 0.414 | 0.613-0.896 | a |
| APRI | 0.713 | 0.642 | 0.917 | 0.816 | 0.599-0.826 | b/e/g |
| FORNS | 0.581 | 0.784 | 0.500 | 7.757 | 0.410-0.751 | c/f/h |
| AAR | 0.622 | 0.709 | 0.583 | 1.116 | 0.445-0.799 | d |
| FSP | 0.909 | 0.664 | 1.000 | -0.126 | 0.837-0.980 | |
| STEP | 0.884 | 0.851 | 0.833 | 1.645 | 0.803-0.965 | |
a: FIB4 vs FSP,*; b: APRI vs FSP,***; c: FORNS vs FSP,***; d: AAR vs FSP,**; e: APRI vs STEP,***; f: FORNS vs STEP,**; g: APRI vs GP,**; h: FORNS vs GP,** *: p<0.05; **: p<0.01; ***: p<0.001.
3.6External validation of the FSP model
Using the multivariate linear prediction model for the degree of liver fibrosis derived from this study, 103 patients with abnormal liver function confirmed by liver biopsy for the type of pathology in the external hospital were evaluated. The results showed that the AUC of S2, S3 and S4 stage diagnosed by FSP was 0.784, 0, 776, 0.807 (Fig. 3).
Fig. 3
A-C AUROCs of FS, STE, FIB4, APRI, FORNS, AAR, FSP, STEP for the diagnosis of liver fibrosis. D-F AUROCs of FS and FSP are used for the validation of another 103 patients with liver disease.
4Discussion
Liver fibrosis is the compensatory repair reaction of the body after the long-term action of various causes such as viruses, alcohol and drugs on the liver. Collagen fibers proliferate and accumulate in a large amount for a long time. Liver fibrosis will gradually develop into cirrhosis or even liver cancer, which seriously threatens the life and health of patients. Therefore, early diagnosis and accurate evaluation of liver fibrosis are of great significance for the treatment of liver disease, the control of disease and the reduction of the occurrence of end-stage liver disease [11].
Ultrasound elastography is a common method for noninvasive diagnosis of liver fibrosis, with simple operation and good repeatability. However, all ultrasound elastography techniques have certain limitations, so combining serological indicators to improve diagnostic efficiency has gradually become a hot topic in recent years [12, 13]. Our research is to select the best indicators related to liver fibrosis from serum biomarkers, and construct a model combined with ultrasound elastography to more accurately evaluate liver fibrosis. After statistical analysis and screening, PLT in serum biomarkers has the best correlation with liver fibrosis, so we chose PLT and ultrasound elastography to build the model.
Our study found that the AUC of FSP in S2-S4 was 0.665, 0.835 and 0.909, and the AUC of STEP in S2-S4 was 0.685, 0.810 and 0.884. The diagnostic efficacy of the two models in S2-S4 was higher than that of APRI, FIB-4, FORNS, AAR and other serological parameter models. In addition, the two models only need to obtain two indicators, ultrasound elastography and PLT, which is more convenient for clinical.
Compared with ultrasound elastography, the diagnostic efficiency of the two models in S4 phase is higher than that of ultrasound elastography, and the diagnostic efficiency in S2 and S3 phases is similar, but the specificity is significantly improved. It should be noted that the specificity of FSP in S4 phase is 100%, which seems to be inconsistent with the guidelines. We analyze the possible reasons as follows:Fibroscan has good diagnostic efficacy and specificity, especially in the S4 phase. In the guidelines, the specificity of Fibroscan in the S4 phase is 92% [14]. Meanwhile, PLT continues to decrease with the progression of liver fibrosis, especially in S4 phase, which has a very good correlation [15]. Therefore, the FSP model combined with Fibroscan and PLT has better specificity in the S4 phase. In addition, we used the FSP model to validate 103 patients with liver diseases from external hospitals, and the results further confirmed that the diagnostic efficacy of FSP is higher than that of Fibroscan.
Comparing the two models of FSP and STEP, the diagnostic efficacy of both models is similar. The AUC of stage S2 STEP is slightly higher than that of FSP, and the AUC of stage S3 and S4 FSP is slightly higher than that of STEP, but there is no statistical difference. When we apply it in clinical practice, due to the differences in the two elastic influencing factors, we can select model based on the patient’s situation [16–18]. For example, when a patient has ascites or thick subcutaneous fat, we can choose STEP, and when the patient cannot control their breath holding, we can choose FSP.
To sum up, the combined diagnostic models of ultrasound elastography and PLT have improved the diagnostic efficiency of liver fibrosis stage to a certain extent, and can help the clinical more accurate assessment of the degree of liver fibrosis. Although the study was screened according to strict inclusion and exclusion criteria, there may still be some limitations, and large sample validation is still required before clinical application.
Conflict of interest
We confirm that this work is original and has not been published elsewhere nor is it currently under consideration for publication elsewhere.
References
[1] | Merli M , Aprile F . Le linee guida sulla nutrizione della Societàeuropea per lo studio delle malattie epatiche (EASL) [The European Association for the Study of Liver (EASL) nutrition guidelines]. Recenti Prog Med. (2021) ;112: (2):103–109. doi:10.1701/3559.35370. |
[2] | European Association for Study of Liver; Asociacion Latinoamericana para el Estudio del Higado. EASL-ALEH Clinical Practice Guidelines: Non-invasive tests for evaluation of liver disease severity and prognosis. J Hepatol. (2015) ;63: (1):237–264. doi:10.1016/j.jhep.2015.04.006. |
[3] | Manduca A , Bayly PJ , Ehman RL , et al. MR elastography: Principles, guidelines, and terminology. Magn Reson Med. (2021) ;85: (5):2377–2390. doi:10.1002/mrm.28627. |
[4] | Terrault NA , Lok ASF , McMahon BJ , et al. Update on prevention, diagnosis, and treatment of chronic hepatitis B: AASLD hepatitis B guidance[J]. Clin Liver Dis (Hoboken), (2018) ;12: (1):33–34. doi:10.1002/cld.728. |
[5] | Máiz Carro L , Martínez-García MA . Use of Hyaluronic Acid (HA) in Chronic Airway Diseases. Cells. (2020) ;9: (10):2210. Published 2020 Sep 29. doi:10.3390/cells9102210. |
[6] | Dietrich CF , Bamber J , Berzigotti A , et al. EFSUMB Guidelines and Recommendations on the Clinical Use of Liver Ultrasound Elastography, Update 2017 (Long Version) [published correction appears in Ultraschall Med. 2017 Aug;38(4):e48]. EFSUMB-Leitlinien und Empfehlungen zur klinischen Anwendung der Leberelastographie, Update 2017 (Langversion) [published correction appears in Ultraschall Med. 2017 Aug;38(4):e48].. Ultraschall Med. (2017) ;38: (4):e16–e47. doi:10.1055/s-0043-103952. |
[7] | Wang K , Dong Y , Han H , Cao J , Bao J , Wang WP . Clinical application of two dimensional shear wave elastography with a propagation map in evaluating liver fibrosis in patients with liver tumors [published online ahead of print, 2022 Jun 17]. Clin Hemorheol Microcirc. 2022;10.3233/CH-221511. doi: 10.3233/CH-221511. |
[8] | Li Y , Wu S . Liver stiffness measured with two-dimensional shear wave elastography comparable to histopathology falls dominantly on the severe liver fibrosis. Clin Hemorheol Microcirc. (2021) ;79: (4):587–596. doi:10.3233/CH-211223. |
[9] | Peschel G , Grimm J , Buechler C , et al. Liver stiffness assessed by shear-wave elastography declines in parallel with immunoregulatory proteins in patients with chronic HCV infection during DAA therapy. Clin Hemorheol Microcirc. (2021) ;79: (4):541–555. doi:10.3233/CH-211193. |
[10] | Goodman ZD . Grading and staging systems for inflammation and fibrosis in chronic liver diseases. J Hepatol. (2007) ;47: (4):598–607. doi:10.1016/j.jhep.2007.07.006. |
[11] | Czaja AJ . Hepatic inflammation and progressive liver fibrosis in chronic liver disease. World J Gastroenterol. (2014) ;20: (10):2515–2532. doi:10.3748/wjg.v20.i10.2515. |
[12] | Zhong LK , Luo SY , Zhang G , et al. Construction of a predictive model for hepatitis B fibrosis based on ARFI imaging. Chinese Journal of Clinical Gastroenterology. (2020) ;32: (03):140–145. doi:CNKI:SUN:LCXH.0.2020-03-002. |
[13] | Qin H , Yin HF . The application value of transient elastography combined with APRI in the diagnosis of hepatic fibrosis in chronic hepatitis B. Anhui Medical Journal. (2015) ;36: (05):552–555. doi:10.3969/j.issn.1000-0399.2015.05.012. |
[14] | Saftoiu A , Gilja OH , Sidhu PS , et al. The EFSUMB Guidelines and Recommendations for the Clinical Practice of Elastography in Non-Hepatic Applications: Update 2018. Die EFSUMB-Leitlinien und Empfehlungen für die klinische Praxis der Elastografie bei nichthepatischen Anwendungen: Update 2018. Ultraschall Med. (2019) ;40: (4):425–453. doi:10.1055/a-0838-9937. |
[15] | Kurokawa T , Zheng YW , Ohkohchi N . Novel functions of platelets in the liver. J Gastroenterol Hepatol. (2016) ;31: (4):745–751. doi:10.1111/jgh.13244. |
[16] | Xing X , Yan Y , Shen Y , et al. Liver fibrosis with two-dimensional shear-wave elastography in patients with autoimmune hepatitis. Expert Rev Gastroenterol Hepatol. (2020) ;14: (7):631–638. doi:10.1080/17474124.2020.1779589. |
[17] | Barr RG , Ferraioli G , Palmeri ML , et al. Elastography Assessment of Liver Fibrosis: Society of Radiologists in Ultrasound Consensus Conference Statement. Radiology. (2015) ;276: (3):845–861. doi:10.1148/radiol.2015150619. |
[18] | Fang C , Lim A , Sidhu PS . Ultrasound-based liver elastography in the assessment of fibrosis. Clin Radiol. (2020) ;75: (11):822–831. doi:10.1016/j.crad.2020.01.005. |


