
Interstitial washdown during crystalloid fluid loading in graded hypovolemia –A retrospective analysis in volunteers
Abstract
BACKGROUND:
“Interstitial washdown” is an edema-preventing mechanism that implies a greater redistribution of interstitial albumin occurs whenever the capillary filtration is increased.
OBJECTIVE:
To study the effect of interstitial washdown on fluid distribution in normovolemic and hypovolemic volunteers.
METHODS:
Capillary filtration was increased by infusing 25 mL/kg Ringer’s acetate intravenously over 30 min 10 male just after withdrawal of 0, 450, and 900 mL of blood. Population volume kinetic analysis was used to assess the effects of washdown and hemorrhage on fluid distribution, using the difference in plasma dilution based on hemoglobin and albumin as biomarker of washdown.
RESULTS:
Blood withdrawal during 10–15 min recruited 100–150 mL of fluid of high albumin content to the plasma, which was probably lymph. The albumin recruitment was temporarily reduced during the fluid loading but increased from 40 min post-infusion and was then greater when preceded by hemorrhage. Simulations suggested that interstitial washdown decreased the extravascular fluid volume by 200 mL over 3 h. The plasma volume and urinary excretion both increased by approximately half this amount.
CONCLUSIONS:
Blood loss without hypotension probably recruited lymph to the plasma, but interstitial washdown played no major role in determining the distribution of crystalloid fluid after hemorrhage.
1Introduction
“Interstitial washdown” is described as a mechanism that helps to maintain the blood volume when capillary fluid leakage is increased. Washdown implies that accelerated capillary leakage boosts the lymphatic flow, thereby redistributing albumin from the interstitial fluid to the plasma [1].
Crystalloid fluid has a distribution half-life of only 8 min [2], and rapid leakage to the extravascular space can be expected to accelerate the lymphatic flow. The interstitial concentration of protein is then likely to decrease because the flow of protein via the lymph to the plasma occurs faster than the transendothelial leakage of protein.
The influence of interstitial washdown on the turnover of infusion fluids is poorly understood, largely because of the lack of a suitable methodology for studying this phenomenon. However, a kinetic method to study interstitial washdown was recently suggested [3]. This method is based on the fact that the lymph has an albumin concentration that is approximately half that of the plasma [4, 5]. Boosting the lymphatic flow can therefore be indicated by an acute enrichment of plasma albumin, and this occurs whenever the capillary leakage of fluid exceeds the albumin leakage by a factor of two (since the lymph contains 50% as much albumin as is found in the plasma).
From a practical point of view, this type of analysis can only be made in humans in connection with fluid loading. Interstitial washdown should then result in a smaller fluid-induced plasma dilution when based on albumin compared to hemoglobin (Hb). The Hb–albumin dilution difference can be used as a covariate in a volume kinetic analysis using mixed models software where maximal and minimal interstitial washdowns are contrasted.
The aim of the present report was to explore the influence of interstitial washdown on the kinetics of Ringer’s acetate solution in volunteers subjected to experimental blood loss. The hypothesis was that interstitial washdown becomes more important with greater blood losses.
2Methods
This is a retrospective analysis of data from a study where 10 healthy men with a mean age of 28 years (range 23–33) and with a mean body weight of 76 kg (65–85 kg) each underwent three fluid infusion experiments in random order, one in the normovolemic state and the others immediately after having 450 mL and 900 mL blood withdrawn cohort [6, 7]. The blood was removed from the circulation over a period of approximately 10–15 min using a blood donor set (Teruflex, Terumo Corp, Tokyo, Japan). The blood was returned after the experiment had been completed. The three experiments were separated by at least one week.
The protocol was approved by the Ethics Committee at Huddinge University Hospital (54/95; officer in charge, Lennart Kaijser) and informed consent was obtained from all volunteers.
2.1Data collection
Venous blood was collected just before and just after blood withdrawal, every 5 min for 60 min during the infusion of fluid and then every 10 min, up to 180 min, after the infusion started (total 24 time points). A small discard volume of blood was drawn before each blood collection to preclude admixture of rinsing solution, and 2 mL of 0.9% saline was then injected to prevent clotting. The blood Hb concentration was measured on a Technicon H2 (Bayer, Tarrytown, NY) and serum albumin on an Ectachem 250/950 IRC (Johnson & Johnson, Rochester MN). Duplicate blood samples drawn at baseline in all experiments ensured coefficients of variation (CV) of 1.0% and 3.0% for these analyses.
The subjects voided in the recumbent position, and the total volume was measured at the end of the study.
The systolic and diastolic arterial pressures and the heart rate were measured by a blood pressure cuff and stethoscope at 15–30 min intervals. Mean arterial pressure was taken as the diastolic pressure plus one third of the difference between the systolic and diastolic pressure.
2.2Kinetic analysis
A two-volume kinetic model with three rate constants (k12, k21, and k10) and one scaling factor between dilution and volume (Vc, central volume) was fitted to the dependent variables (frequently measured plasma dilution and total urinary excretion) [2].
The volume kinetic model implies that fluid is infused at the rate Ro into the plasma (Vc) and that the fluid is then distributed to (k12) and re-distributed from (k21) the extravascular space (Vt). Elimination occurs from Vc by urinary excretion (k10). All flow rates are proportional, by one of these rate constants (k12, k21, and k10), to the volume expansion of the respective body fluid space (Fig. 1A). The differential equations for the kinetic model are [8].
Fig. 1
(A) The kinetic model used for analysis and simulation. (B) Predictive check based on 1,000 simulations using a built-in function in the Phoenix software. Close agreement between the observed and predicted percentiles indicates that the model is robust. (C) The conditional weighted residuals (CWRES) versus the predicted plasma dilution, without considering the individual-specific covariates.
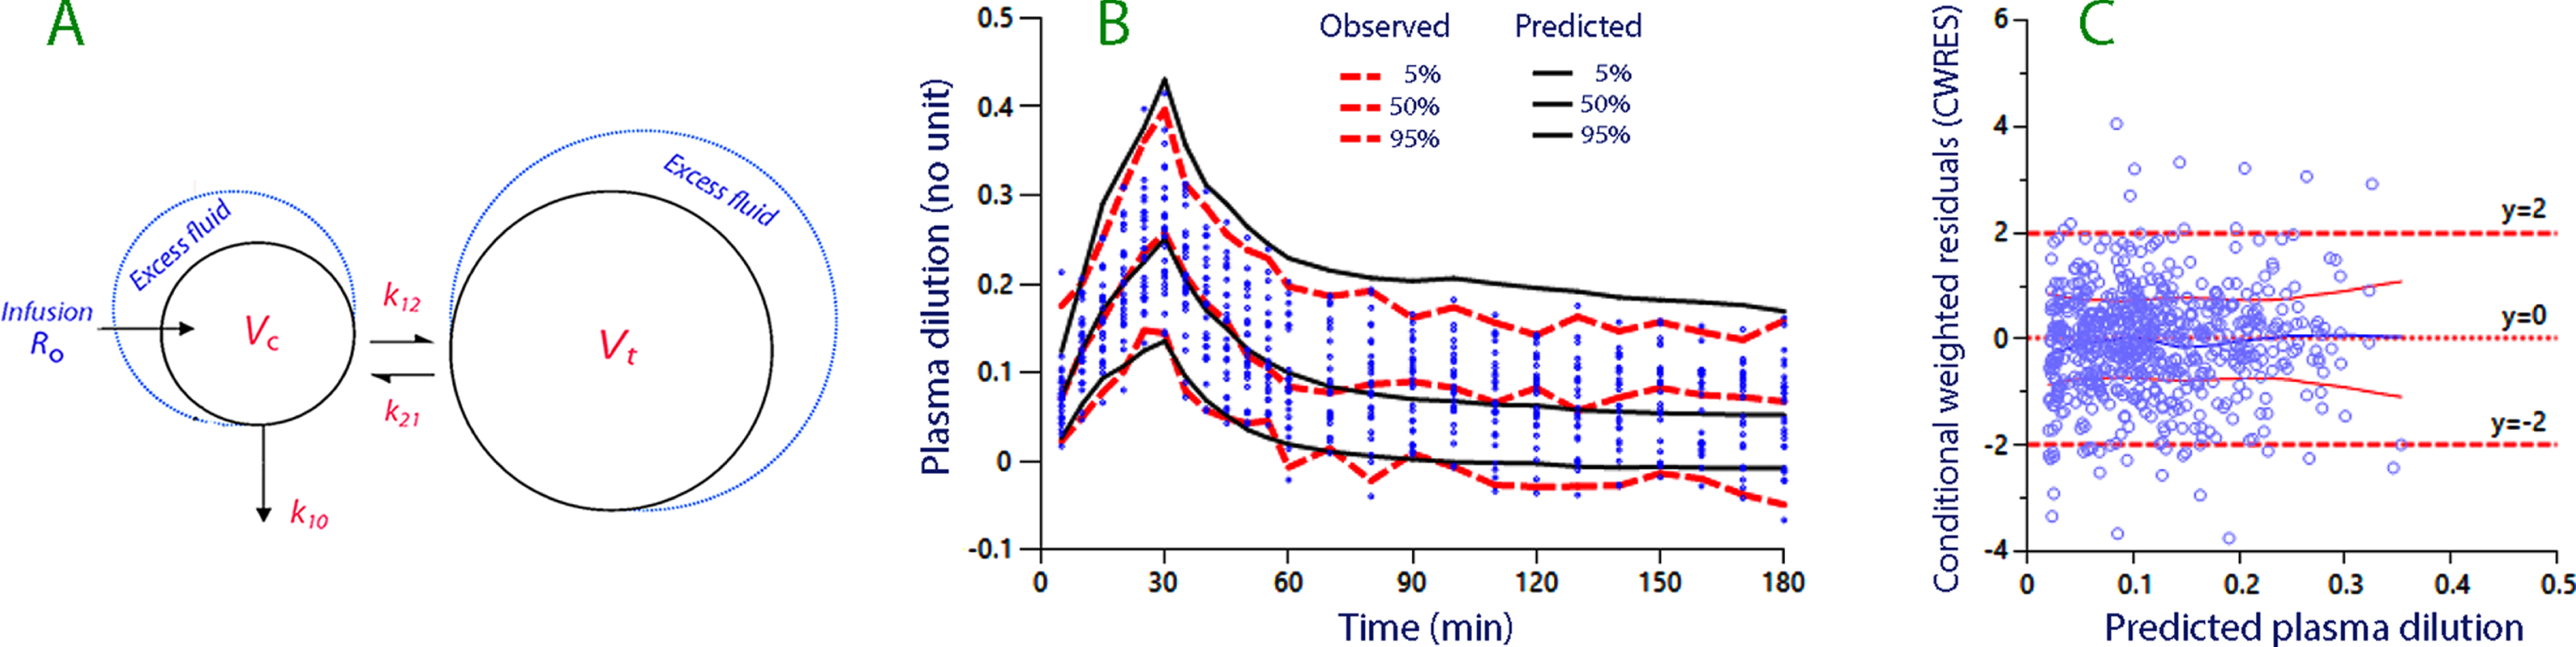
Baseline volumes are given in capital letters (Vc and Vt), expanded volumes in lower-case letters (vc and vt), and U is the urinary excretion. Hence, the volume expansion of the central fluid space is given by (vc - Vc).
The Hb-derived fractional plasma dilution used to indicate the volume expansion of Vc resulting from the infusion was given by:
The plasma dilution indicated by albumin was calculated using the same equation but without the correction for hematocrit. Each dilution was corrected for blood sampling, which amounted to 10 mL at each time point [9].
The Hb–albumin dilution difference was used as the biomarker of interstitial washdown. This difference will be < 0 in when albumin recruitment occurs more slowly than the capillary leakage of albumin. By contrast, a difference > 0 means that more albumin is returned (primarily) by lymphatic flow than is lost by capillary leakage. These considerations are valid provided that all Hb molecules remain in the circulating blood during the experiment.
The linear covariate model was chosen because the blood loss could be zero and the Hb–albumin dilution difference, entered as a time-varying covariate, could be negative. For example, assuming that k12 for an individual (ind) is affected by the hemorrhage volume, the individual-specific k12 for that individual could be related to the group mean values for k12 and hemorrhage as follows:
where Cov is the computer-estimated value of the covariate effect [10].
The criterion for accepting the hemorrhage volume or the Hb–albumin dilution difference as a covariate to a model parameter was that the inclusion should reduce the -2 LL (log likelihood) for the model by > 3.8 points (P < 0.05).
The kinetic model was simultaneously fitted to all measurements of plasma dilution and to the urinary excretion (dependent variables) in the 30 infusion experiments using the Phoenix software for nonlinear mixed effects (NLME), version 1.3 (Pharsight, St. Louis, MO) with the First-Order Conditional Estimation Extended Least Squares (FOCE ELS) as a search routine. The sandwich method was employed as the variance estimator, as it is robust for covariance misspecification. Goodness-of-fit and performance of the model were evaluated by predictive checks, residual plots, and plots of the conditional weighted residuals (CWRES).
Computer simulations using MATLAB R2018b (Math Works, Inc., Natick, MA) were used to illustrate the influence of the key covariates on the distribution of fluid between plasma (Vc) and the extravascular fluid space (Vt).
2.3Statistics
Data showing a normal distribution are reported as the mean and standard deviation (SD). Changes and between-group differences were evaluated by the repeated-measures ANOVA followed by the Scheffé test, if appropriate. Data with skewed distributions are given as the median (25th–75th percentiles limits) and changes examined by the Wilcoxon matched-pair test. Correlations between variables were examined by the linear regression, where r = correlation coefficient.
Kinetic parameters are reported as the best estimate (95% confidence interval) according to the output from the Phoenix program. The significance levels for inclusion of the covariates were taken from the Phoenix program. P < 0.05 was considered statistically significant.
3Results
3.1Plasma dilution during hemorrhage
Plasma dilution occurred spontaneously during the 10–15 min period when blood was withdrawn (“capillary refill”). Both the Hb and the serum albumin concentrations decreased (P < 0.001 and P < 0.007), but the plasma dilution was greater when based on Hb (P < 0.05; Table 1). The Hb-derived plasma dilution averaged 3.5% during withdrawal of 450 mL and 5.1% during withdrawal of 900 mL of blood, but the differences between the groups did not reach statistical significance. Three measurements were missing.
Table 1
Spontaneous dilution occurring during the 10–15 min blood withdrawal. No fluid was administered during this period. A positive Hb-albumin dilution difference suggest that the recruited fluid consisted of lymph, which contains half as much albumin as the plasma [4, 5]
| 0.45 L hemorrhage | 0.9 L hemorrhage | |
| Blood Hb (g/L) | ||
| Before | 137.8 (5.7) | 136.6 (6.3) |
| After | 135.0 (6.3) | 131.8 (5.6) |
| Serum, albumin (g/L) | ||
| Before | 38.25 (1.93) | 38.25 (2.43) |
| After | 37.63 (2.31) | 37.15 (1.86) |
| Plasma dilution (%) | ||
| Hb derived | 3.5 (1.5–4.5) | 5.1 (4.4–7.3) |
| Albumin derived | 0.0 (–1.0 to 3.9) | 2.7 (1.1–5.4) |
| Hb–albumin dilution difference (%) | 1.5 (–1.0 to 4.5) | 2.5 (0.0–5.6) |
Data are the mean (SD) or median (interquartile range) as appropriate.
3.2Arterial pressure
The mean arterial pressure was 87 (SD 10) mmHg when the infusions in the normovolemic state were initiated. The mean arterial pressure was 81 (9) mmHg and 75 (8) mmHg when 450 mL and 900 mL of blood had been withdrawn, respectively (repeated-measures ANOVA P < 0.03, the Scheffé test showing a difference at the P < 0.05 level between the normovolemic state and the 900-mL experiments).
Two volunteers reported transient nausea after withdrawal of 900 mL of blood; this was alleviated by intravenous administration of 5–10 mg ephedrine.
3.3Kinetic analysis of the infused fluid volumes
The mean infused fluid volume was 1.85 (0.16) L, which was administered at a rate of 62 (5) mL/min. The kinetic analysis comprised 678 time points. The final parameter estimates are given in Table 2.
Table 2
Volume kinetic parameters for 30 infusions of Ringer’s acetate immediately preceded by withdrawal of 0, 0.45, or 0.9 L of blood. The linear model was used for the covariance effects. The Hb–albumin dilution difference (Hb–alb diff) is the difference between the plasma dilution when indicated by blood hemoglobin and plasma albumin
| Estimates | Covariate | Best estimate | 95% CI | CV% | -2 LL |
| Kinetic parameter | |||||
| tvVc (L) | 3.98 | 3.61–4.36 | 4.8 | ||
| tvk10 (10–3 min–1) | – | 11.9 | 7.3–14.1 | 16.1 | |
| tvk12 (10–3 min–1) | – | 37.2 | 31.7–42.8 | 7.6 | |
| tvk21 (10–3 min–1) | – | 11.6 | 9.0–14.2 | 11.5 | –2366 |
| Covariate effects | |||||
| k21 | Hb–alb dilution diff | 2.86 | 0.25–5.47 | 46.4 | –2372 |
| Vc | Hb–alb dilution diff | –1.79 | –2.32 to –1.26 | –15.1 | –2480 |
| k21 | Hemorrhage (L) | 1.08 | 0.50–1.65 | 27.7 | –2489 |
| k10 | Hemorrhage (L) | –0.71 | –1.35 to –0.20 | –45.8 | –2493 |
| Vc | Hemorrhage (L) | –0.41 | –0.63 to –0.22 | –26.3 | –2500 |
| k12 | Hemorrhage (L) | 0.42 | 0.09–0.75 | 40.1 | –2506 |
tv = typical value for the group. CI = confidence interval. CV% = coefficient of variation (inter-individual). LL = log likelihood for the model during development. Decrease of -2 LL by > 3.8 points = P < 0.05. Mean Hb–albumin difference –0.022; highest 5% 0.063, lowest 5% –0.11).
The covariate analysis showed that a positive Hb–albumin dilution difference, which was used as the biomarker of washdown, accelerated the redistribution of extravascular fluid to the plasma (k21) and reduced the proportionality constant between dilution and volume (Vc). Hemorrhage affected all four kinetic model parameters.
A predictive check showed no systematic discrepancy between the measured and simulated data (Fig. 1B). The even distribution of the conditional weighted residuals (CWRES) around zero in Fig. 1C also indicates that the kinetic model was well specified. Moreover, a plot of CWRES versus time supported the good fit (not shown).
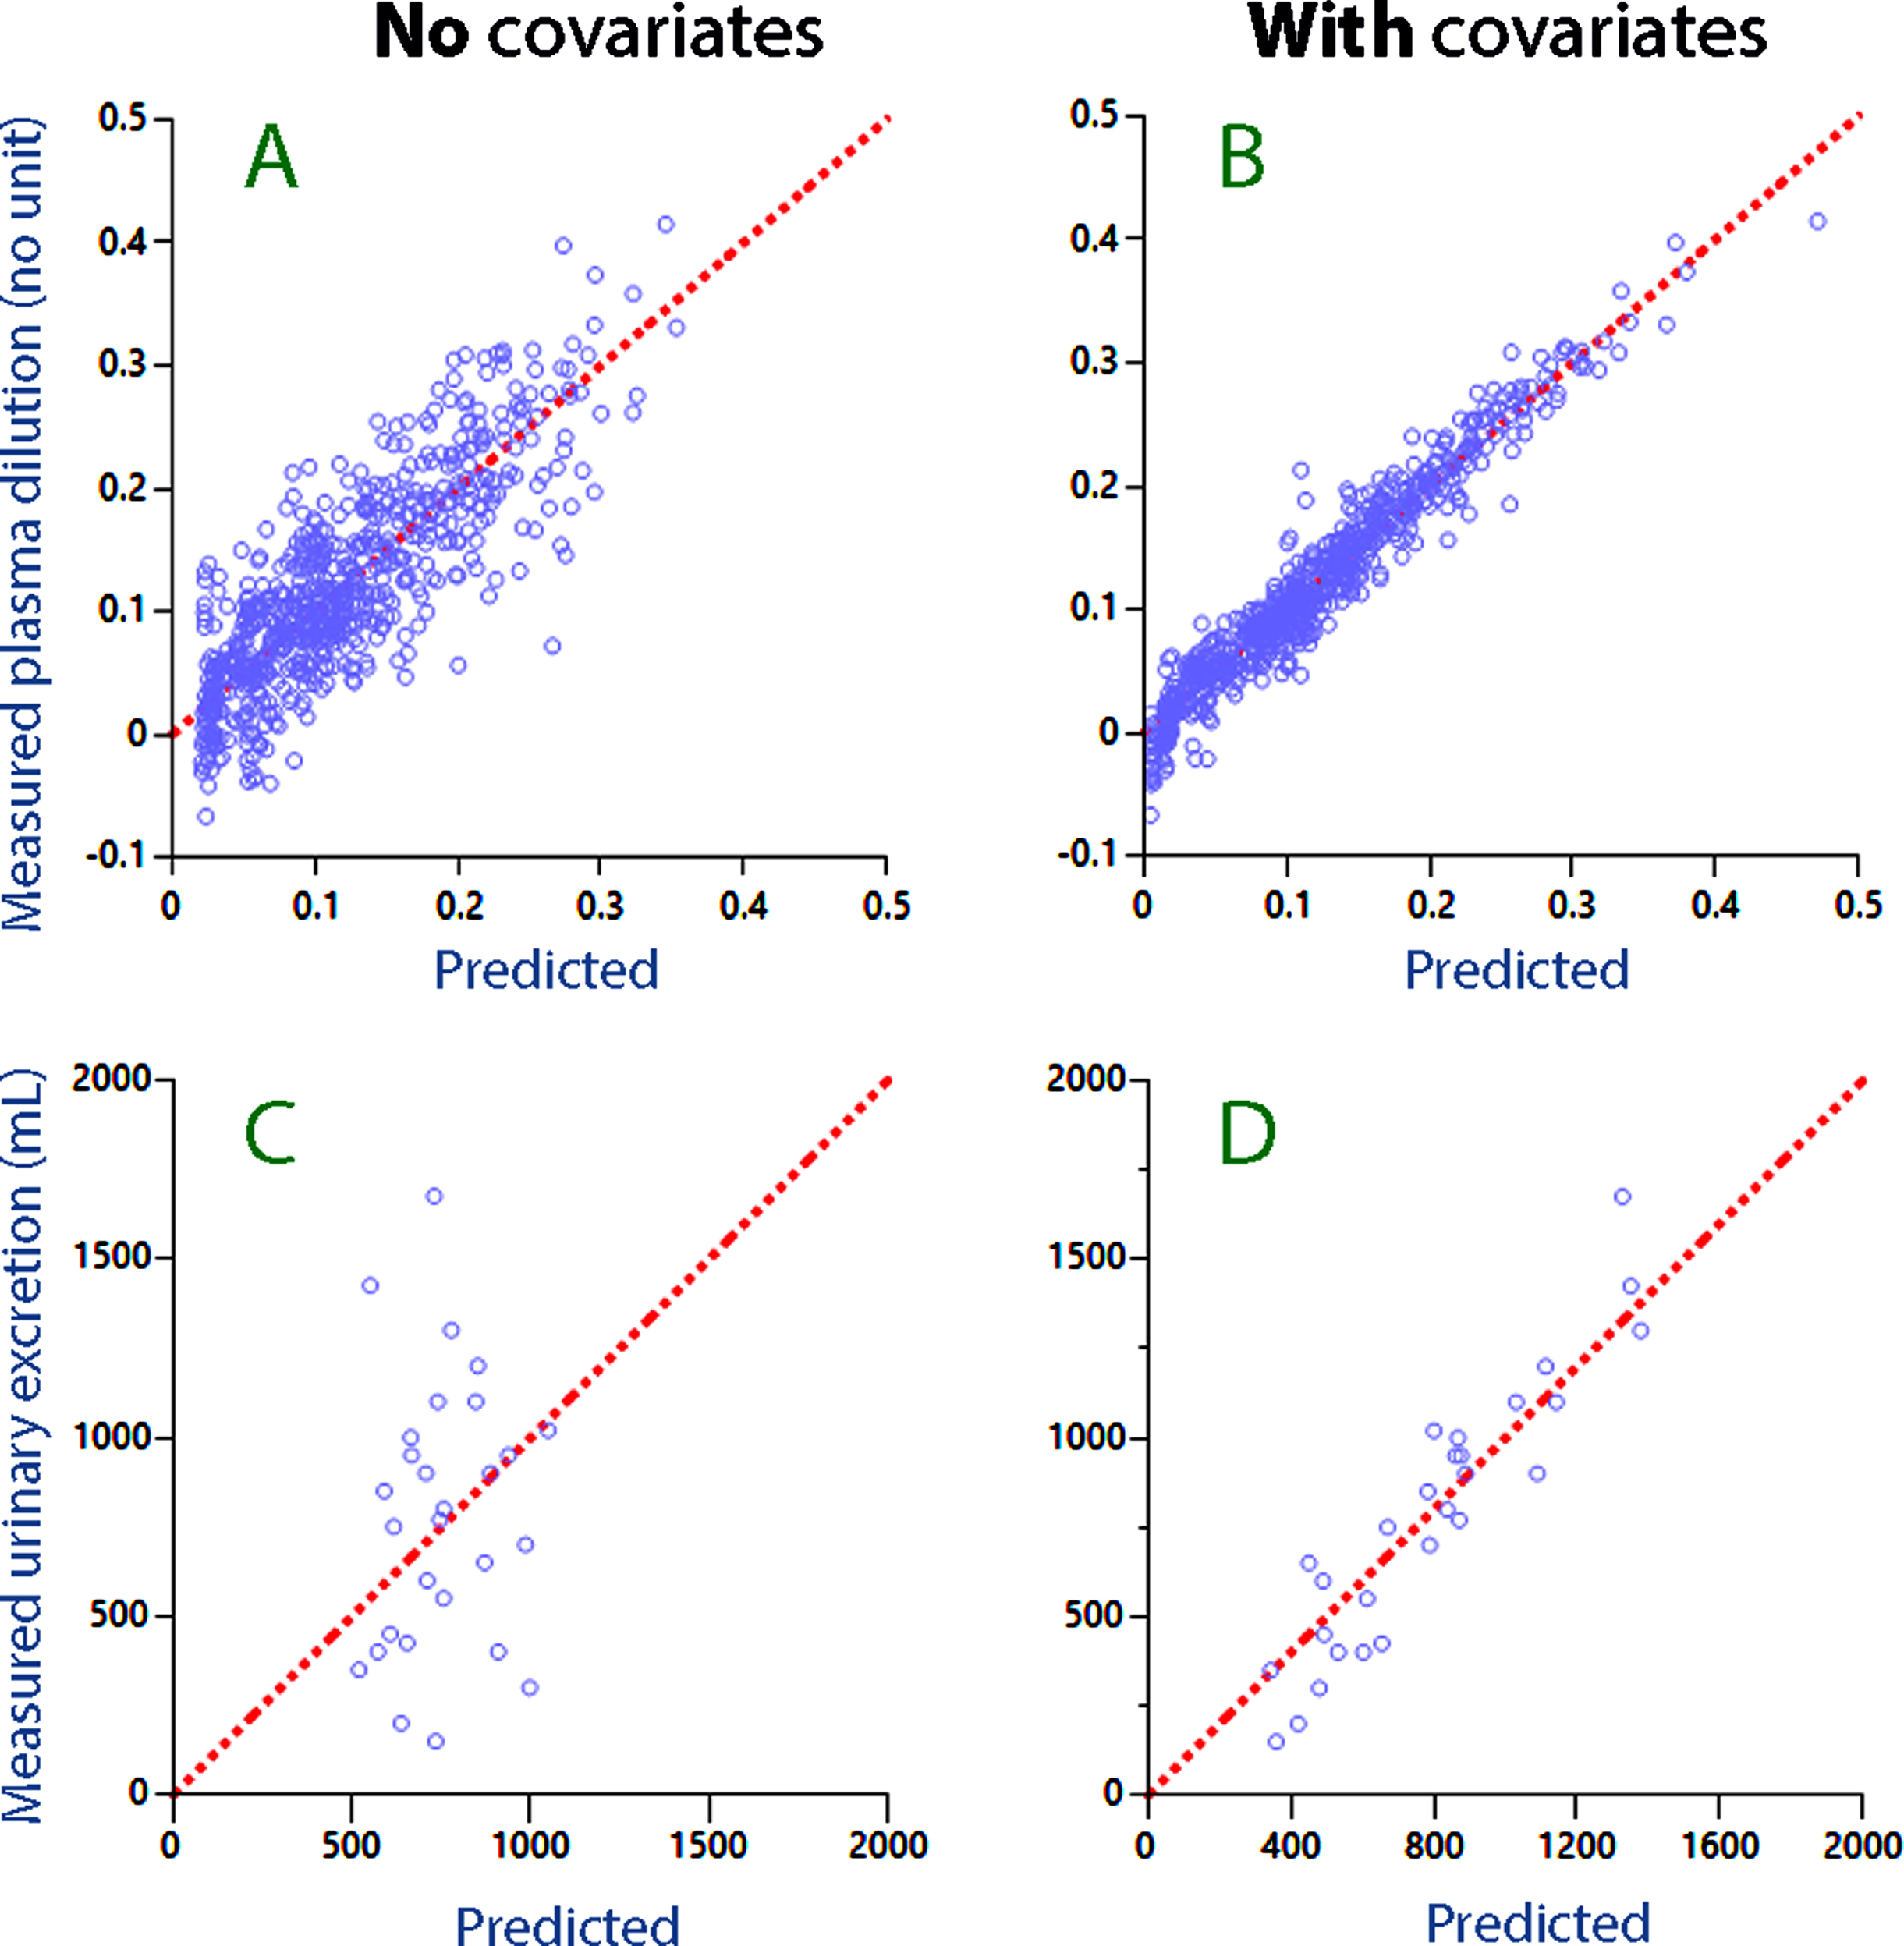
A comparison between Fig. 2A and 2B illustrates how consideration of the covariates improved the ability of the model to predict the plasma dilution. The improvement obtained when predicting the urinary excretion is shown in Fig. 2C, D.
Fig. 2
Residual plot for the predicted plasma dilution without (A) and with (B) consideration taken of covariates (i.e. Hb–albumin dilution difference and hemorrhage volume). (C, D) The same plots for the predicted urinary excretion.
The Hb–albumin dilution difference was mostly negative, especially during the distribution phase of the infused fluid (0–70 min), indicating that the capillary leakage of albumin was greater than the inflow of albumin from the lymph. For the entire experiment, the correlation coefficient was 0.47 (P < 0.012) for the relationship between the redistribution rate constant (k21) and the mean Hb–albumin dilution difference.
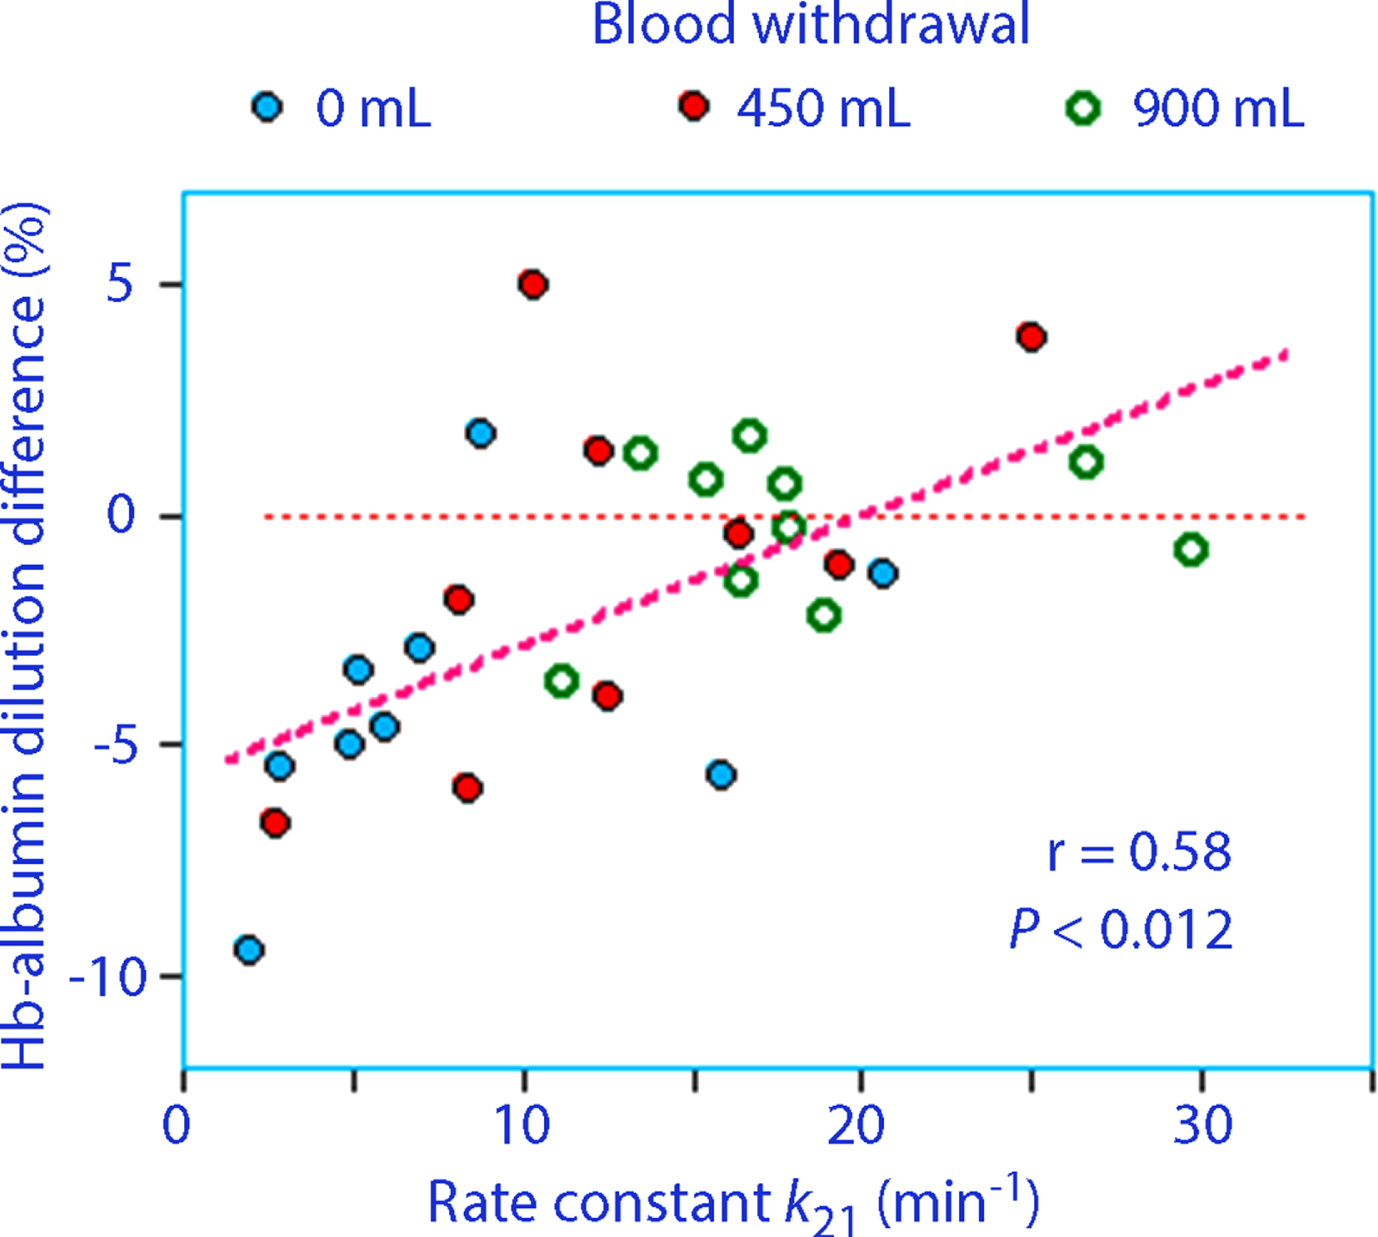
After 70 min, the Hb–albumin dilution difference became more positive for the hemorrhage experiments (Fig. 3).
Fig. 3
(A) The Hb–albumin dilution difference over time. Points and squares show mean values for a subgroup and the solid lines connect them with a third-order polynomial function. (B) The rate constant describing redistribution of extravascular fluid to the plasma (k21) versus the mean Hb–albumin difference for each volunteer during the last 100 min of the study.
3.4Simulations
Simulations of the fluid distribution between the body fluid compartments were performed using the kinetic parameters shown in Table 2. They also contrasted the difference between the minimal and maximal degree interstitial washdown by inserting the mean of the 5% lowest and 5% highest Hb–albumin dilution differences as covariate effects. A high degree of albumin recruitment by washdown corresponded to a positive Hb–albumin dilution difference.
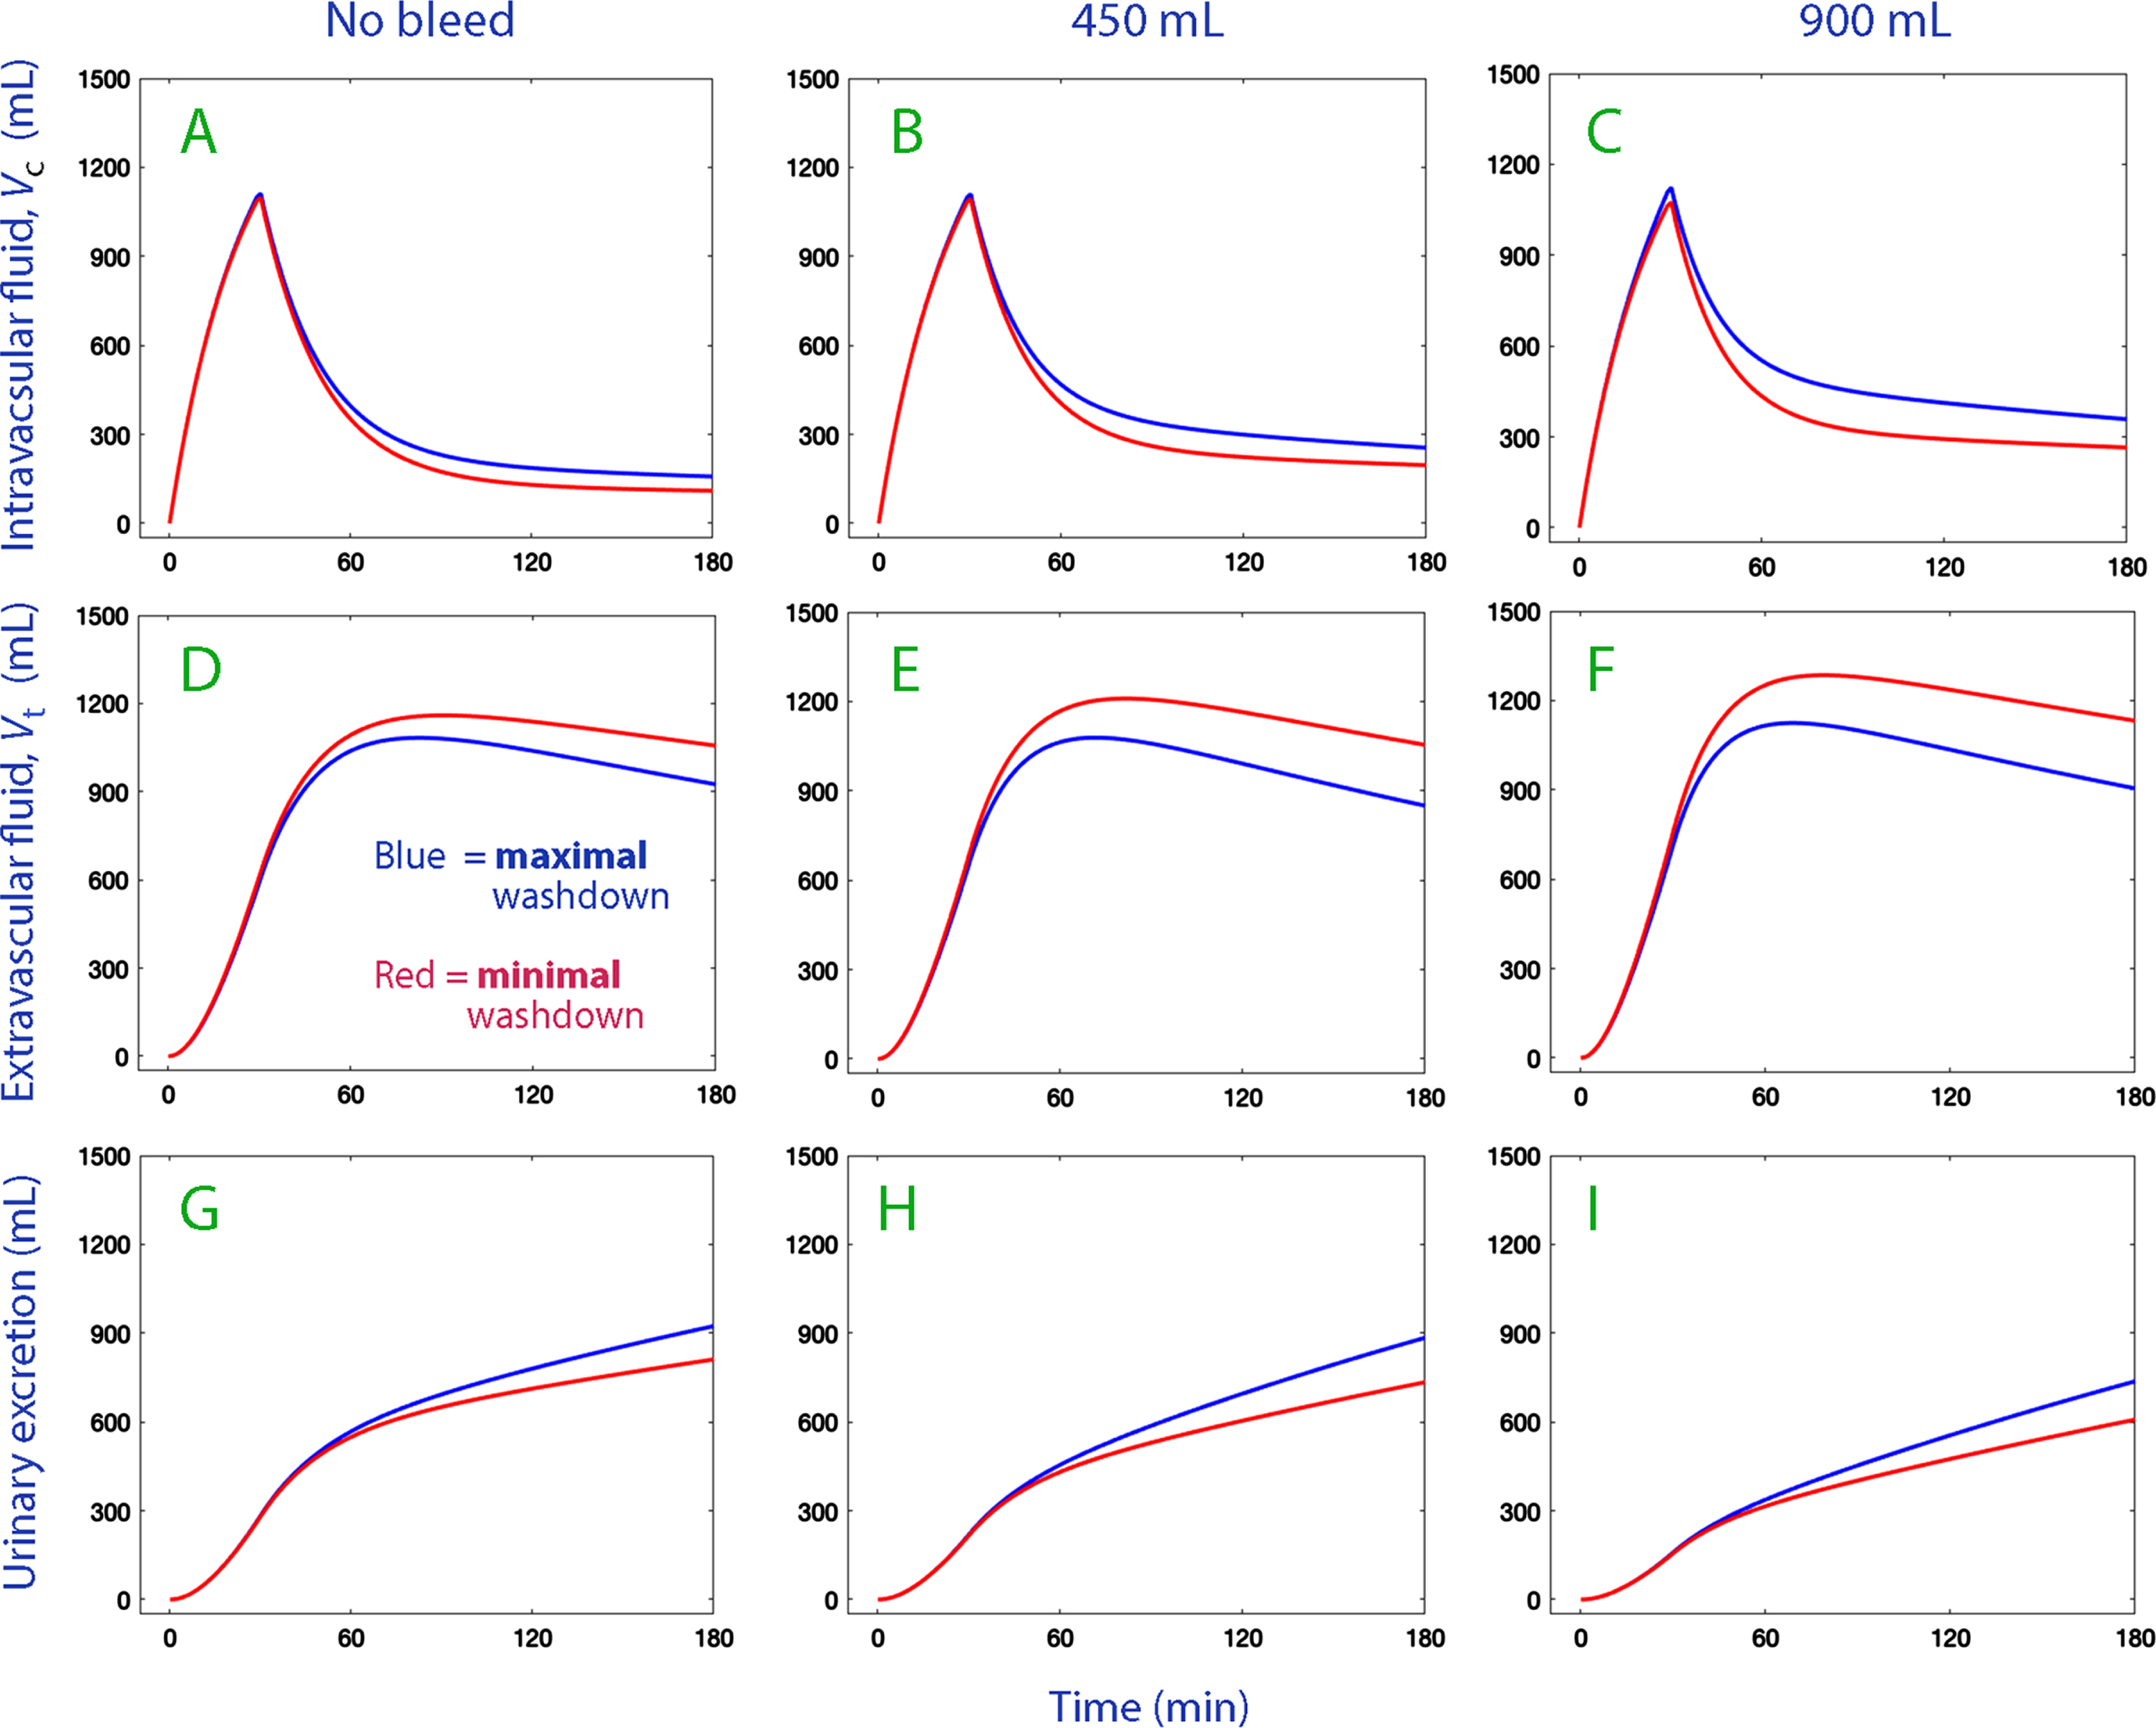
The simulation plots illustrate that the greater interstitial washdown marginally increased the expansion of the intravascular fluid volume (vc –Vc) in all three series of experiments (Fig. 4, top row). The main effect consisted of a decrease in the accumulation of infused fluid in the extravascular space (Fig. 4, middle row). The interstitial washdown also slightly increased urinary excretion in all three series of experiments (Fig. 4, lower row).
Fig. 4
Volume expansion of Vc (plasma; top row) and Vt (extravascular space; middle row) and the cumulative urinary excretion (bottom row) when 1.85 L of Ringer’s acetate is infused in volunteers (weight 76 kg) depending on whether the degree of interstitial washdown was maximal (blue lines) or minimal (red lines).
4Discussion
4.1Albumin recruitment
The relatively short time of blood withdrawal (10–15 min) in these experiments was associated with capillary refill. Based on the Hb change, the absorbed volumes can be estimated at approximately 100 mL for the smaller withdrawal and up to 150 mL for the larger withdrawal. Pure water was not recruited because the dilution of plasma albumin was far less than the Hb-derived plasma dilution (Table 1). A comparison between the two dilutions rather suggests that the recruited fluid consisted of lymph, as this fluid contains half as high a concentration of albumin as plasma [4, 5]. This capillary refill is probably explained by activation of the adrenergic fibers in the lymphatic vessels, as this increases the flow [11].
By contrast, the infusion of Ringer’s acetate was apparently associated with slowing of the albumin recruitment. This might reflect a reduction in the lymphatic flow due to a rise in the intravascular hydrostatic pressure resulting from the plasma volume expansion. Moreover, the adrenergic activation probably ceased upon alleviation of the hypovolemia. Only during the later stages of the post-infusion period did albumin become recruited at a rate that exceeded the capillary leakage. Most albumin was recruited when infusions had been preceded by a withdrawal of 900 mL of blood (Fig. 3).
The Hb–albumin dilution difference correlated positively with the kinetic parameter k21, thereby supporting that the model-predicted redistribution of fluid corresponds to lymphatic flow.
The wide span of data between the subjects allowed the use of covariance analysis to illustrate how fluid kinetics was influenced by minimal (5% from lowest) and maximal (5% from highest) albumin recruitment. The Hb–albumin dilution difference then served as a biomarker for the returned lymphatic volume and not only for its albumin content.
4.2Flow rates of fluid and albumin
The kinetic analysis revealed that the Ringer infusion increased capillary leakage of fluid by [k12 x (vc–Vc)] from a baseline of approximately 7 mL/min to a maximum almost 6 times higher (Table 2). By contrast, the rate of the redistribution of fluid from the extravascular space peaked at 10 mL/min above the baseline flow and would then carry 0.3 g of albumin/min if the lymph had an albumin concentration that was 50% of the plasma concentration. The capillary leakage of albumin normally averages 0.1 g/min.
At the nadir of the redistribution, at 60–70 min, the Hb–albumin difference began to increase. A previous study showed that the albumin concentration of recruited fluid decreases over time [3], and this probably contributes to the finding that the Hb–albumin dilution difference was not consistently positive during the post-infusion phase.
If all recruited fluid had consisted of lymph, the present data suggest that the albumin concentration of the recruited fluid would average only 15–25% of the plasma concentration. However, the data do not exclude that some of the fluid recruited by k21 entered the plasma by translocation across the capillary wall at this stage of the study.
4.3Crystalloid fluid distribution
The simulations show that the albumin recruitment summarized as “interstitial washdown” was associated a change of the distribution of Ringer’s acetate, but not by very much. The fraction of this accelerated redistribution of lymph that can be accounted for by its albumin content increased both the plasma volume and the urinary excretion by 50–100 mL over the 3 h study period.
Only small differences in fluid distribution were found between the three study groups. The simulations question whether increased lymphatic flow plays a major role in determining the fluid distribution in hypovolemic subjects once volume loading has been initiated. A comparison between the pre-infusion and post-infusion data even suggests that albumin recruitment operates more effectively without than with volume loading, although the hypovolemia is more rapidly restored when crystalloid fluid is infused.
4.4Hemorrhage
The covariate effects of hemorrhage on the kinetics of Ringer’s solution can be numerically compared with interstitial washdown in Table 2. Hemorrhage alone reduced the urinary excretion and slightly accelerated both the capillary leakage and redistribution of fluid (k12 and k21). This shows that hemorrhage redistributed fluid regardless of the Hb–albumin dilution difference. The inhibition of the urinary excretion that accompanies hemorrhage seems to be the main factor that increases the plasma volume expansion.
When reviewing the plots of the fluid distribution in hemorrhage experiments, we should note that the experiments were initiated at a hypovolemia of 350 mL and 750 mL, respectively (i.e., the withdrawn blood volume minus the pre-infusion capillary refill). Normovolemia was not fully restored at 3 h, and clearly not following the removal of 900 mL of blood. Normovolemia was achieved at the end of infusion, but only transiently. Therefore, a bolus infusion of crystalloid fluid should be followed by a lower rate of infusion rather than by discontinuation if normovolemia is to be maintained [7]. However, the present study suggests that a continued infusion could maintain the low degree of interstitial washdown, i.e., the lymphatic flow would still be retarded.
Both the modest hypovolemia post-infusion in the hemorrhaged volunteers and the reduced intravascular hydrostatic pressure that developed when the distribution function ended probably explain why the interstitial washdown mechanism once again came into play.
4.5Literature
The physiologist Andrew Guyton, in his standard textbook, claims that the increase in the lymphatic flow and the decrease in the interstitial protein concentration by interstitial washdown are two of three major mechanisms that prevent edema [1]. The third mechanism is the negative interstitial pressure, which maintains a low compliance for volume expansion.
Aukland & Reed, in 1993, concluded that most of the literature about washdown consists of experiments in isolated animal tissues, where an integrated whole-body view is difficult to obtain [11]. Judgments about of the importance of protein washdown rest on mathematical models based on standard physiological data and on data retrieved from various settings in animals [12].
A later experimental study of myocardial edema in dogs suggests that washout might not reduce the interstitial colloid osmotic pressure as much as previously believed, as the washout preferentially involves large protein molecules, such as albumin [13]. A recent review confirms the lack of new data on the topic [14].
A previous study using the same methodological approach as used in the present study showed negative covariance between the Hb–albumin dilution difference and the urinary excretion [3]. A similar dependence was close to reaching statistical significance in the present study. However, only a small number of covariates could be tested with confidence here, as the present study included no more than 30 experiments.
The previous work also showed that the interstitial washdown mechanism has limits. Higher Hb–albumin dilution differences were associated with faster redistribution (higher k21) and with accelerated capillary leakage of fluid (higher k12) but the albumin content of the redistributed fluid apparently became attenuated over time.
4.6Clinical implications
Distribution of infused crystalloid fluid in healthy humans assume an undisturbed equilibration of volume between the intra- and extravascular spaces. Hence, leakage of infused fluid to the extravascular space is expected to increase the return flow to the plasma. However, the present study, which used albumin dilution as biomarker, suggests that the return flow by the lymphatic route is low until an infusion ends, which is probably due to that the fluid-induced rise of the intravascular hydrostatic pressure opposes lymphatic flow. Therefore, lengthy infusions may be more likely to cause peripheral edema than short or intermittent infusions. A free interval exceeding the post-infusion distribution period of 30 min would be enough to allow free equilibration of volume between the lymphatics and the plasma to be restored. This finding was no different when the fluid administration was preceded by rapid withdrawal of blood. On the other hand, the simulations showed the effect of interstitial washdown on the fluid distribution was limited when the infusion time was only 30 min.
Different rates of infusion were not studied here, but previous work shows that the return flow to the plasma is retarded by very high infusion rates (>50 mL/min). By contrast, infusion of small volumes of crystalloid (approximately 300 mL over 15 min) do not distribute to the extravascular space at all but remains exclusively in the plasma [15].
4.7Limitations
Capillary filtration is proportional to the arterial pressure [7]. A study of anesthesia induction showed that a drop in the mean arterial pressure of 50% will reduce the rate of distribution by 75% and the rate of elimination by 90% [16]. The variations in arterial pressure in the present study were smaller but low pressure is still likely to have slightly retarded the rate of distribution [7] and elimination [17]. However, the present data material was too small to mathematically separate the effects of arterial pressure and hemorrhage volume on the fluid kinetics.
The predominantly negative Hb-albumin dilution difference once the infusions of Ringer’s had been initiated elicits the question of whether Hb corrected for hematocrit and albumin have precisely the same volume of distribution. A 10% larger volume of distribution for albumin is suggested by the “hematocrit factor” needed align findings of isotope measurements of red cell volume and albumin mass with the measured peripheral hematocrit [17]. Other evidence suggests that the fluid-induced dilution of Hb and albumin may reflect the distribution of the infused fluid rather than of the biomarker used to derive dilution [18]. However, this difference does not matter much as the relative differences between the maximal and minimal Hb-albumin dilution differences were likely to be the same although their distribution volumes differed.
The data used in the present study have previously been used in studies of other aspects of the experiments, apart from the importance of interstitial washdown [6, 7].
5Conclusions
The albumin balance between the extravascular and intravascular fluid indicated that albumin recruitment is stimulated by withdrawal of blood but is depressed by crystalloid volume loading. Accelerated redistribution of both albumin and fluid to the plasma (“interstitial washdown,” probably being mostly lymph) had only a marginal influence on the distribution of crystalloid fluid, although hemorrhage strengthened the mechanism.
Acknowledgments
Departmental funds were used. The author is grateful to the Dr. Dan Drobin who helped to collect the data in the original reports. Dr Drobin has approved republication.
Conflict of interest
RGH has received a research grant from Grifols for studies of 20% albumin and is Member of Baxter’s IV Fluid Therapy management Advisory Board.
Availability of data
The original data used for the kinetic analysis can be obtained from the author on request.
References
[1] | Guyton AC , Hall JE . The body fluid compartments: extracellular and intracellular fluids; interstitial fluid and edema. Textbook of Medical Physiology. 9th ed. Philadelphia: W.B. Saunders Company 1996, pp. 312. |
[2] | HahnRG . Understanding volume kinetics, Acta Anaesthesiol Scand (2020) ;64: :570–8. |
[3] | Hahn RG , Dull RO . Interstitial washdown and vascular albumin refill during fluid infusion: novel kinetic analysis from three clinical trials, Intensive Care Med Ex (2021) ;9: :44. |
[4] | Rutili G , Arfors K-E . Protein concentration in interstitial and lymphatic fluids from the subcutaneous tissue, Acta Physiol Scand (1977) ;99: :1–8. |
[5] | PoulsenHL . Interstitial fluid concentrations of albumin and immunoglobulin G in normal men, Scand J Clin Lab Invest (1974) ;34: :119–22. |
[6] | Drobin D , Hahn RG . Volume kinetics of Ringer’s solution in hypovolemic volunteers, Anesthesiology (1999) ;90: :81–91. |
[7] | Hahn RG , Drobin D , Li Y , Zdolsek J . Kinetics of Ringer’s solution in extracellular dehydration and hemorrhage, Shock (2020) ;53: :566–73. |
[8] | HahnRG . Renal water conservation and the volume kinetics of fluid-induced diuresis; a retrospective analysis of two cohorts of elderly men, Clin Exp Pharm Physiol (2021) ;48: :310–7. |
[9] | Gunnström M , Zdolsek J , Hahn RG . Plasma volume expansion and fluid kinetics of 20% albumin during general anesthesia and surgery lasting for more than 5 hours, Anesth Analg (2022) ;134: :1270–9. |
[10] | Owen JS , Fiedler-Kelly J . Introduction to population pharmacokinetic/pharmacodynamic analysis with nonlinear mixed effects models. Hoboken, Wiley & Sons. (2014) . |
[11] | Aukland K , Reed RK . Interstitial-lymphatic mechanisms in the control of extracellular fluid volume, Physiol Rev (1993) ;73: :1–78. |
[12] | Reed RK , Bowen BD , Bert JL . Microvascular exchange and interstitial volume regulation in the rat: implications of the model, Am J Physiol (1989) ;257: :2081–91. |
[13] | Stewart RH , Geissler HJ , Allen SJ , Laine GA . Protein washdown as defense mechanism against myocardial edema, Am J Physiol Heart Circ Physiol.H (2000) ;279: :1864–8. |
[14] | Stewart RH . A modern view of the interstitial space in health and disease, Front Vet Sci (2020) ;7: :609583. |
[15] | Hahn RG , Drobin D , Zdolsek J . Distribution of crystalloid fluid changes with the rate of infusion: a population-based study, Acta Anaesthesiol Scand (2016) ;60: :569–78. |
[16] | Hahn RG . Distribution of crystalloid fluid during onset of anesthesia-induced hypotension, Perioper Medicine (2021) ;10: :34. |
[17] | Hahn RG . Arterial pressure and the rate of elimination of crystalloid fluid, Anesth Analg (2017) ;124: :1824–33. |
[18] | Lawson HC . The volume of blood –a critical examination of methods for its measurement. In: Handbook of Physiology. Sect 2. Circulation Vol I. Am Physiol Soc, 1962, Washington. |
[19] | Hahn RG . Water content of the endothelial glycocalyx layer estimated by volume kinetic analysis, Intensive Care Med Ex (2020) ;8: :29. |


