
Red blood cell sedimentation rate measurements in a high aspect ratio microchannel
Abstract
BACKGROUND:
The erythrocyte sedimentation rate (ESR) test is commonly used in clinical practice for monitoring, screening and diagnosing pathological conditions and diseases related to the inflammatory response of the immune system. Several ESR techniques have been developed over the years improving the reliability, the precision and the duration of the measurement.
OBJECTIVE:
In the present study a new low cost micro-ESR technique is described providing the major advantage of reducing the measurement time and the blood sample volume by multiple times compared to the commercial methods.
METHODS:
Blood samples were obtained from healthy donors within the age group of 24–28 years and the haematocrit was adjusted to 30%, 40% and 50%. The ESR of the samples was measured utilizing a surface tension driven (STD) microfluidic chip and a monitoring device.
RESULTS:
The evaluation of the method showed a high correlation (0.94, p < 10–5) at all haematocrit levels with the commercial instrument indicating the feasibility of the technique.
CONCLUSIONS:
This micro-ESR technique provides the potential for a simple, low cost and fast tool for ESR measurement using low blood volume acquired by finger prick.
1Introduction
The erythrocyte sedimentation rate (ESR) is a very common diagnostic tool that measures the settlement rate of the red blood cells (RBCs) in a test tube. An increased rate might indicate the presence of an inflammatory response of the immune system, which can be correlated with a number of diseases such as rheumatoid arthritis, myocardial infarction, sickle cell anaemia, some cancers, diabetes and others [1–3]. Nowadays, the ESR is mostly used for monitoring the progress of an inflammatory disease and for predicting responsiveness to treatment rather than as a diagnostic method [4–7].
The sedimentation of the red blood cells can be affected by multiple physiological and pathological parameters, such as the fibrinogen and haemoglobin concentrations, the haematocrit, the ratio of other plasma proteins, the lipid concentration in the plasma, the plasma viscosity, the pH, and other [6, 8–12]. Morphological and other mechanical factors of the RBC should be also considered in the sedimentation process. These include the shape, the mass and the rigidity of the red blood cells [4, 13–15] or even the characteristic properties of the formed aggregate network, expressed as a soft-colloid gel [16, 17]. The procedure of the erythrocyte sedimentation can be described in three phases: aggregation, precipitation, and packing. The parameters that affect each phase might differ, however the phase of aggregation is considered as the most influential to the outcome of the test [18].
The Westergren ESR test has been standardised as a method, and is considered as the reference technique for ESR measurement. The Westergren method requires a 200 mm open-ended pipette with internal diameter of 2.55 mm. The anti-coagulated blood sample is placed in the pipette and after 1 hour the distance between the surface meniscus of blood that has been settled, and the upper point of the pipette is measured. This distance corresponds to the sedimentation rate of the blood sample in mm per hour. In the recent decades, several new techniques for ESR measurement methods have been introduced. A variety of techniques are based on the Westergren technique using pipettes with alternative lengths or diameters resulting in decreased measurement times and blood volumes [19]. Also, alternative techniques estimate the ESR by correlating the aggregation intensity to sedimentation rate values. These techniques require low blood sample volumes ( 50μl), and they can evaluate the ESR even within 20 seconds, using anticoagulated blood [20, 21] or whole blood in a EDTA coated microchannel [22].
However, the majority of the traditional ESR methods involve a relatively large volume of blood which in many cases can be a concern, especially in paediatric haematology or for patients who monitor their ESR frequently. A few micro-ESR methods have been developed that require a smaller quantity of blood to perform. These micro-ESR methods measure the sedimentation by introducing pipettes or glass capillary tubes with lower volumes and smaller dimensions. A glass capillary tube, 75 mm long with 1.2 mm internal diameter, has been systematically studied and showed a good correlation with the Westergren method. The protocol requires mixing the whole blood sample (4 drops of blood) with anticoagulant on a glass slide; then the sample enters the attached tube, due to capillary forces, and the measurement occurs within 20 min [14, 23]. Similar studies have correlated a variety of alternative pipette volumes as a tool for micro-ESR measurement against the standard Westergren pipette [3, 24].
In the present study we perform micro-ESR measurements utilizing a custom-made device, in order to illustrate the principle of operation and the validity of the approach. This device provides an automated way of ESR measurement while it creates an integrated working-station for performing additional haematological tests, i.e. estimation of aggregation and coagulation indices.
2Experimental methods
2.1Sample preparation
Healthy human blood was donated via venepuncture and collected in anticoagulant vacutainers (citrate BD, 3.2% concentration). The protocol for this work was approved by the Cyprus Bioethics Committee ref.: EEBK/EP/2019/19. The RBCs were separated from whole blood via centrifugation (15 minutes at 1100 G) and then resuspended in their native plasma at haematocrits of 30%, 40% and 50%. The samples were used within 4 hours of extraction.
2.2Microfluidic chip fabrication
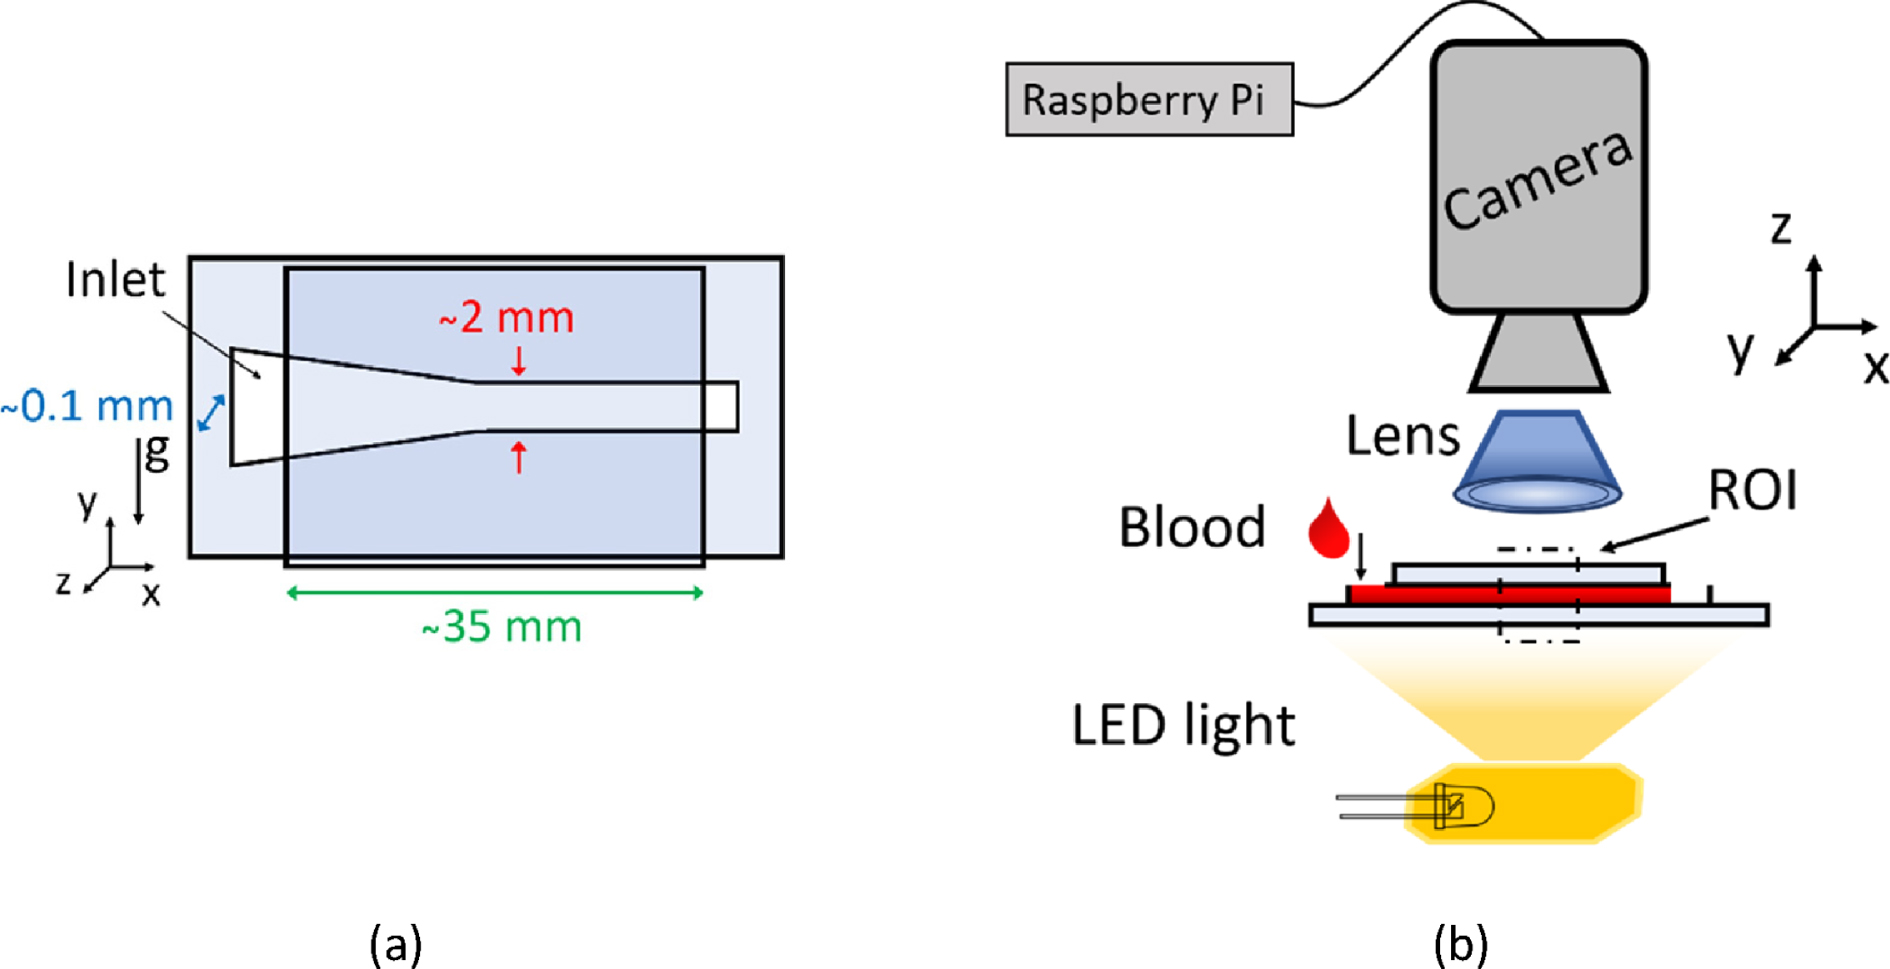
The geometry of the testing channel was chosen in order to favour the surface tension driven (STD) flow, as described in detail by Pasias et al. 2022 [25]. A high aspect ratio channel (>20 : 1) was adopted, with a converging geometry of 3 degrees inclination for the first part of the channel, followed by a straight section of 2 mm (±0.1 mm) width, which is the imaging area; the effective length of the channel was 35 mm (Fig. 1a). The design of the channel was engraved on a double-sided adhesive tape (TESA) with ∼100μm thickness, using a commercial cutter (Silhouette Portrait 2). The channel was sealed between two glass slides (Deltalab). It is known that the chemistry of material that blood is in contact with has an influence on protein adhesion [26–28]. This might cause platelet adhesion and interfere with the results of ESR measurement. However, in this study the use of glass walls with anticoagulated samples minimise any thrombogenic effects. The inlet and the outlet of the microfluidic chip were open to the atmosphere allowing the fluid to flow within the channel.
Fig. 1
(a) Schematic of the microfluidic chip. The erythrocyte sedimentation is captured along the y-axis (direction of gravity). (b) Schematic of the experimental set-up for monitoring and measuring ESR. The flow of blood through the microfluidic chip is surface tension driven.
3Experimental set up
Micro-ESR: An ESR-monitoring device developed in-house, and was used for the acquisition of the data (Fig. 1b). The data consisted of images, captured by a camera/microprocessor set-up. The main parts of the device include the processor (Raspberry Pi 4), the camera (Arducam 8MP 1080P), an LED light and a 2X magnifying lens attached on the camera. Initially the width direction of the chip and device was oriented parallel to the lab bench; a near-drop volume of ∼25μl from the prepared blood sample was deposited in the inlet of the chip with a micro pipette, initiating a surface tension driven flow until the blood sample reached the outlet of the channel (flow duration ∼3 seconds). At that point the device (and chip) was tilted by 90 degrees, so the direction of gravity was parallel to the width of the channel (y-axis) (see Fig. 1a), commencing the image acquisition. The camera acquisition frequency was set to 0.2 Hz (i.e. one image per five seconds) and the total measuring time was 15 minutes, while the image resolution of the measurements was 12μm/pixel. The ESR from each sample was measured 2 times at minimum.
Commercial ESR instrument: The ESR was measured with the commercial ESR analyser device (Smart Rate 10, Jokoh LTD, Kawasaki, Japan) following the manufacturers protocol for ESR measurement of 30 min. The preloaded anticoagulant (3.2% sodium citrate) was removed from the specified vacuum glass tubes, of 120 mm length and 8 mm diameter, before adding blood volume of 1.3 ml from the prepared blood samples. The dependency of RBC aggregation on temperature, could affect the resulted ESR also [29], however in this study the experiments were conducted in constant room temperature (25°C±1 °C), and it is assumed that the commercial and the in-house built device operate in this temperature also.
3.1Data processing
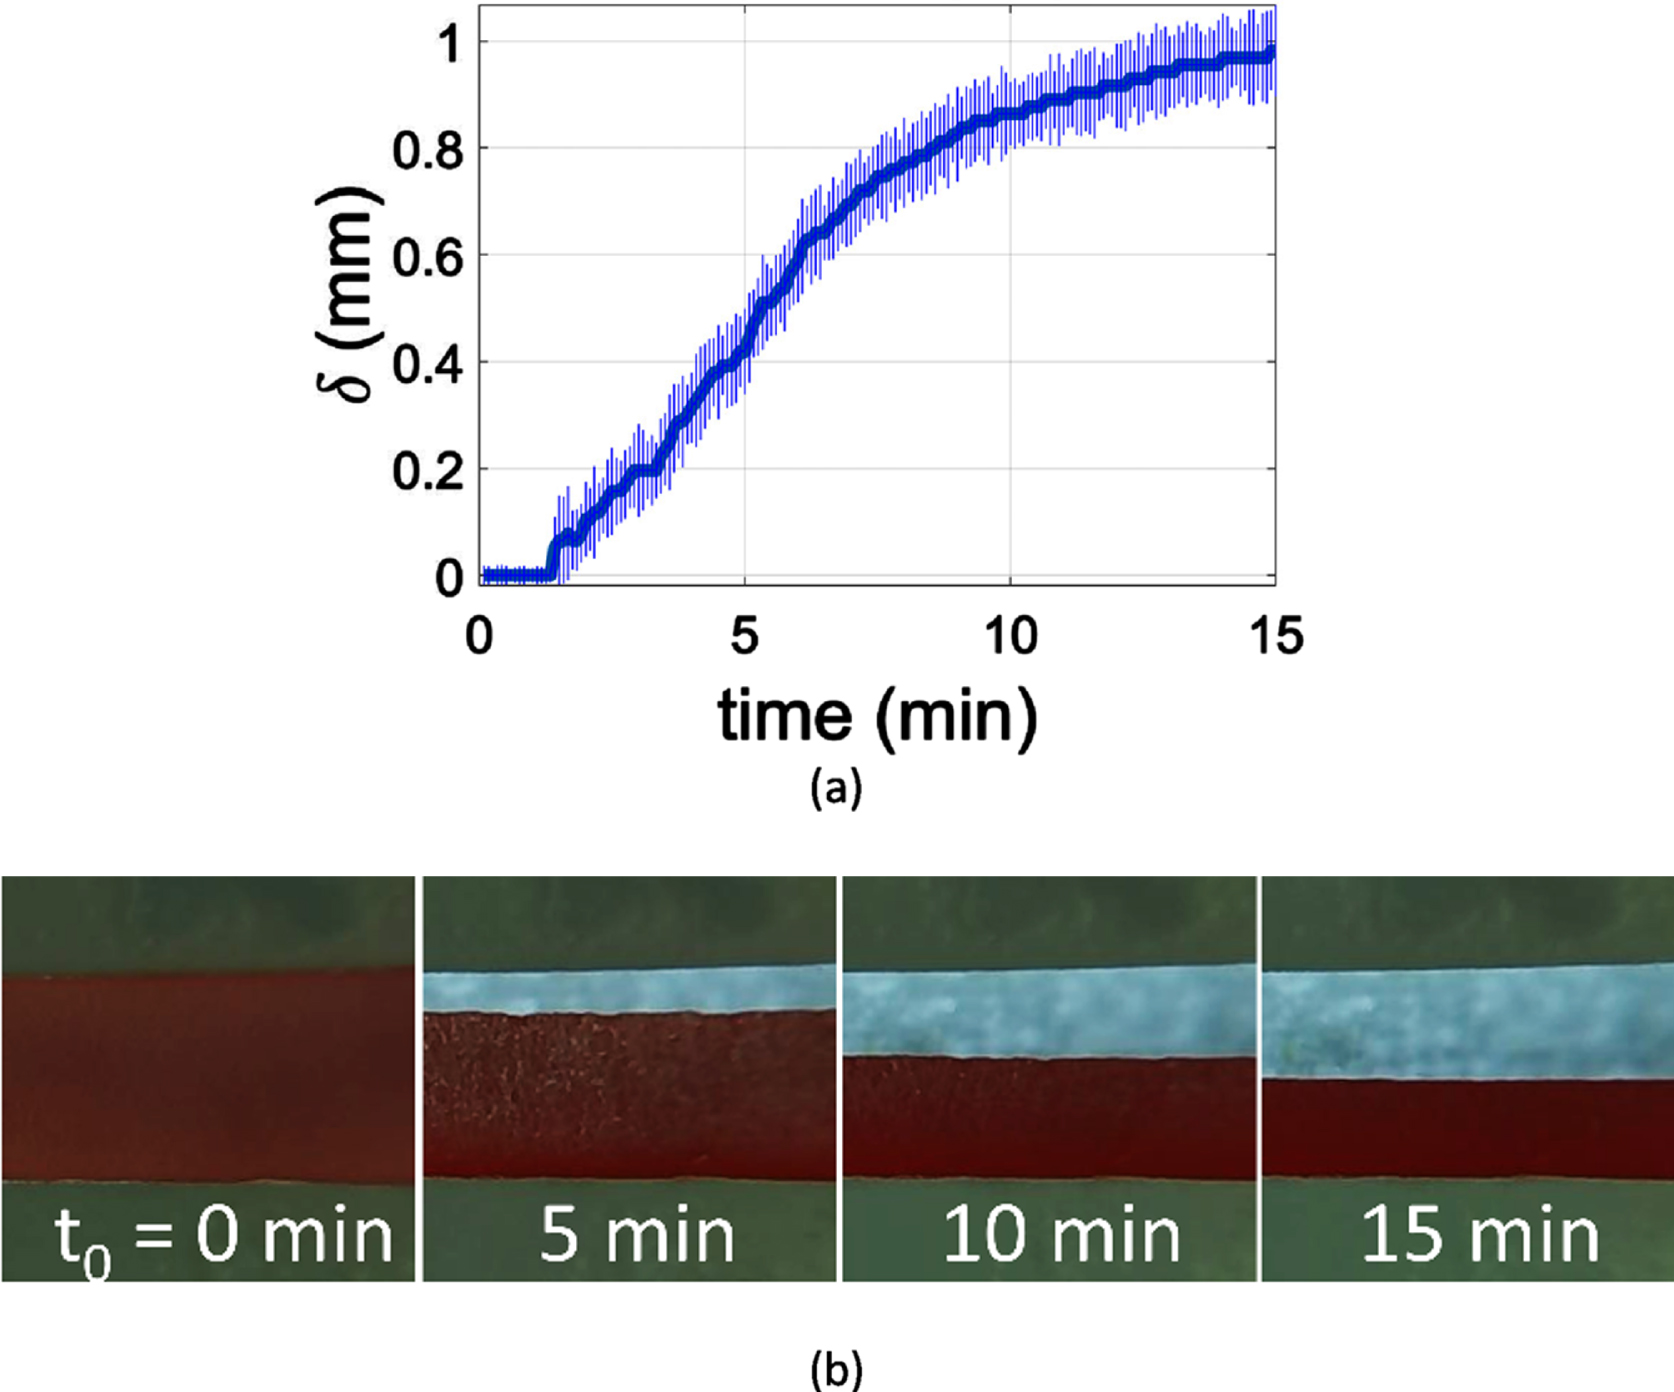
The acquired images were processed in MATLAB, to calculate the average vertical displacement of the RBC layer, δ, in time (Fig. 2a). The sedimentation velocity, or sedimentation rate values, were accordingly calculated as
Fig. 2
(a) Measurement of the average blood layer width along the channel in the period of 15 minutes; the error bars correspond to the standard deviation of the measurement. (b) Erythrocyte sedimentation as captured in the channel at 5 min, 10 min and 15 min for a 30% haematocrit blood sample.
4Results
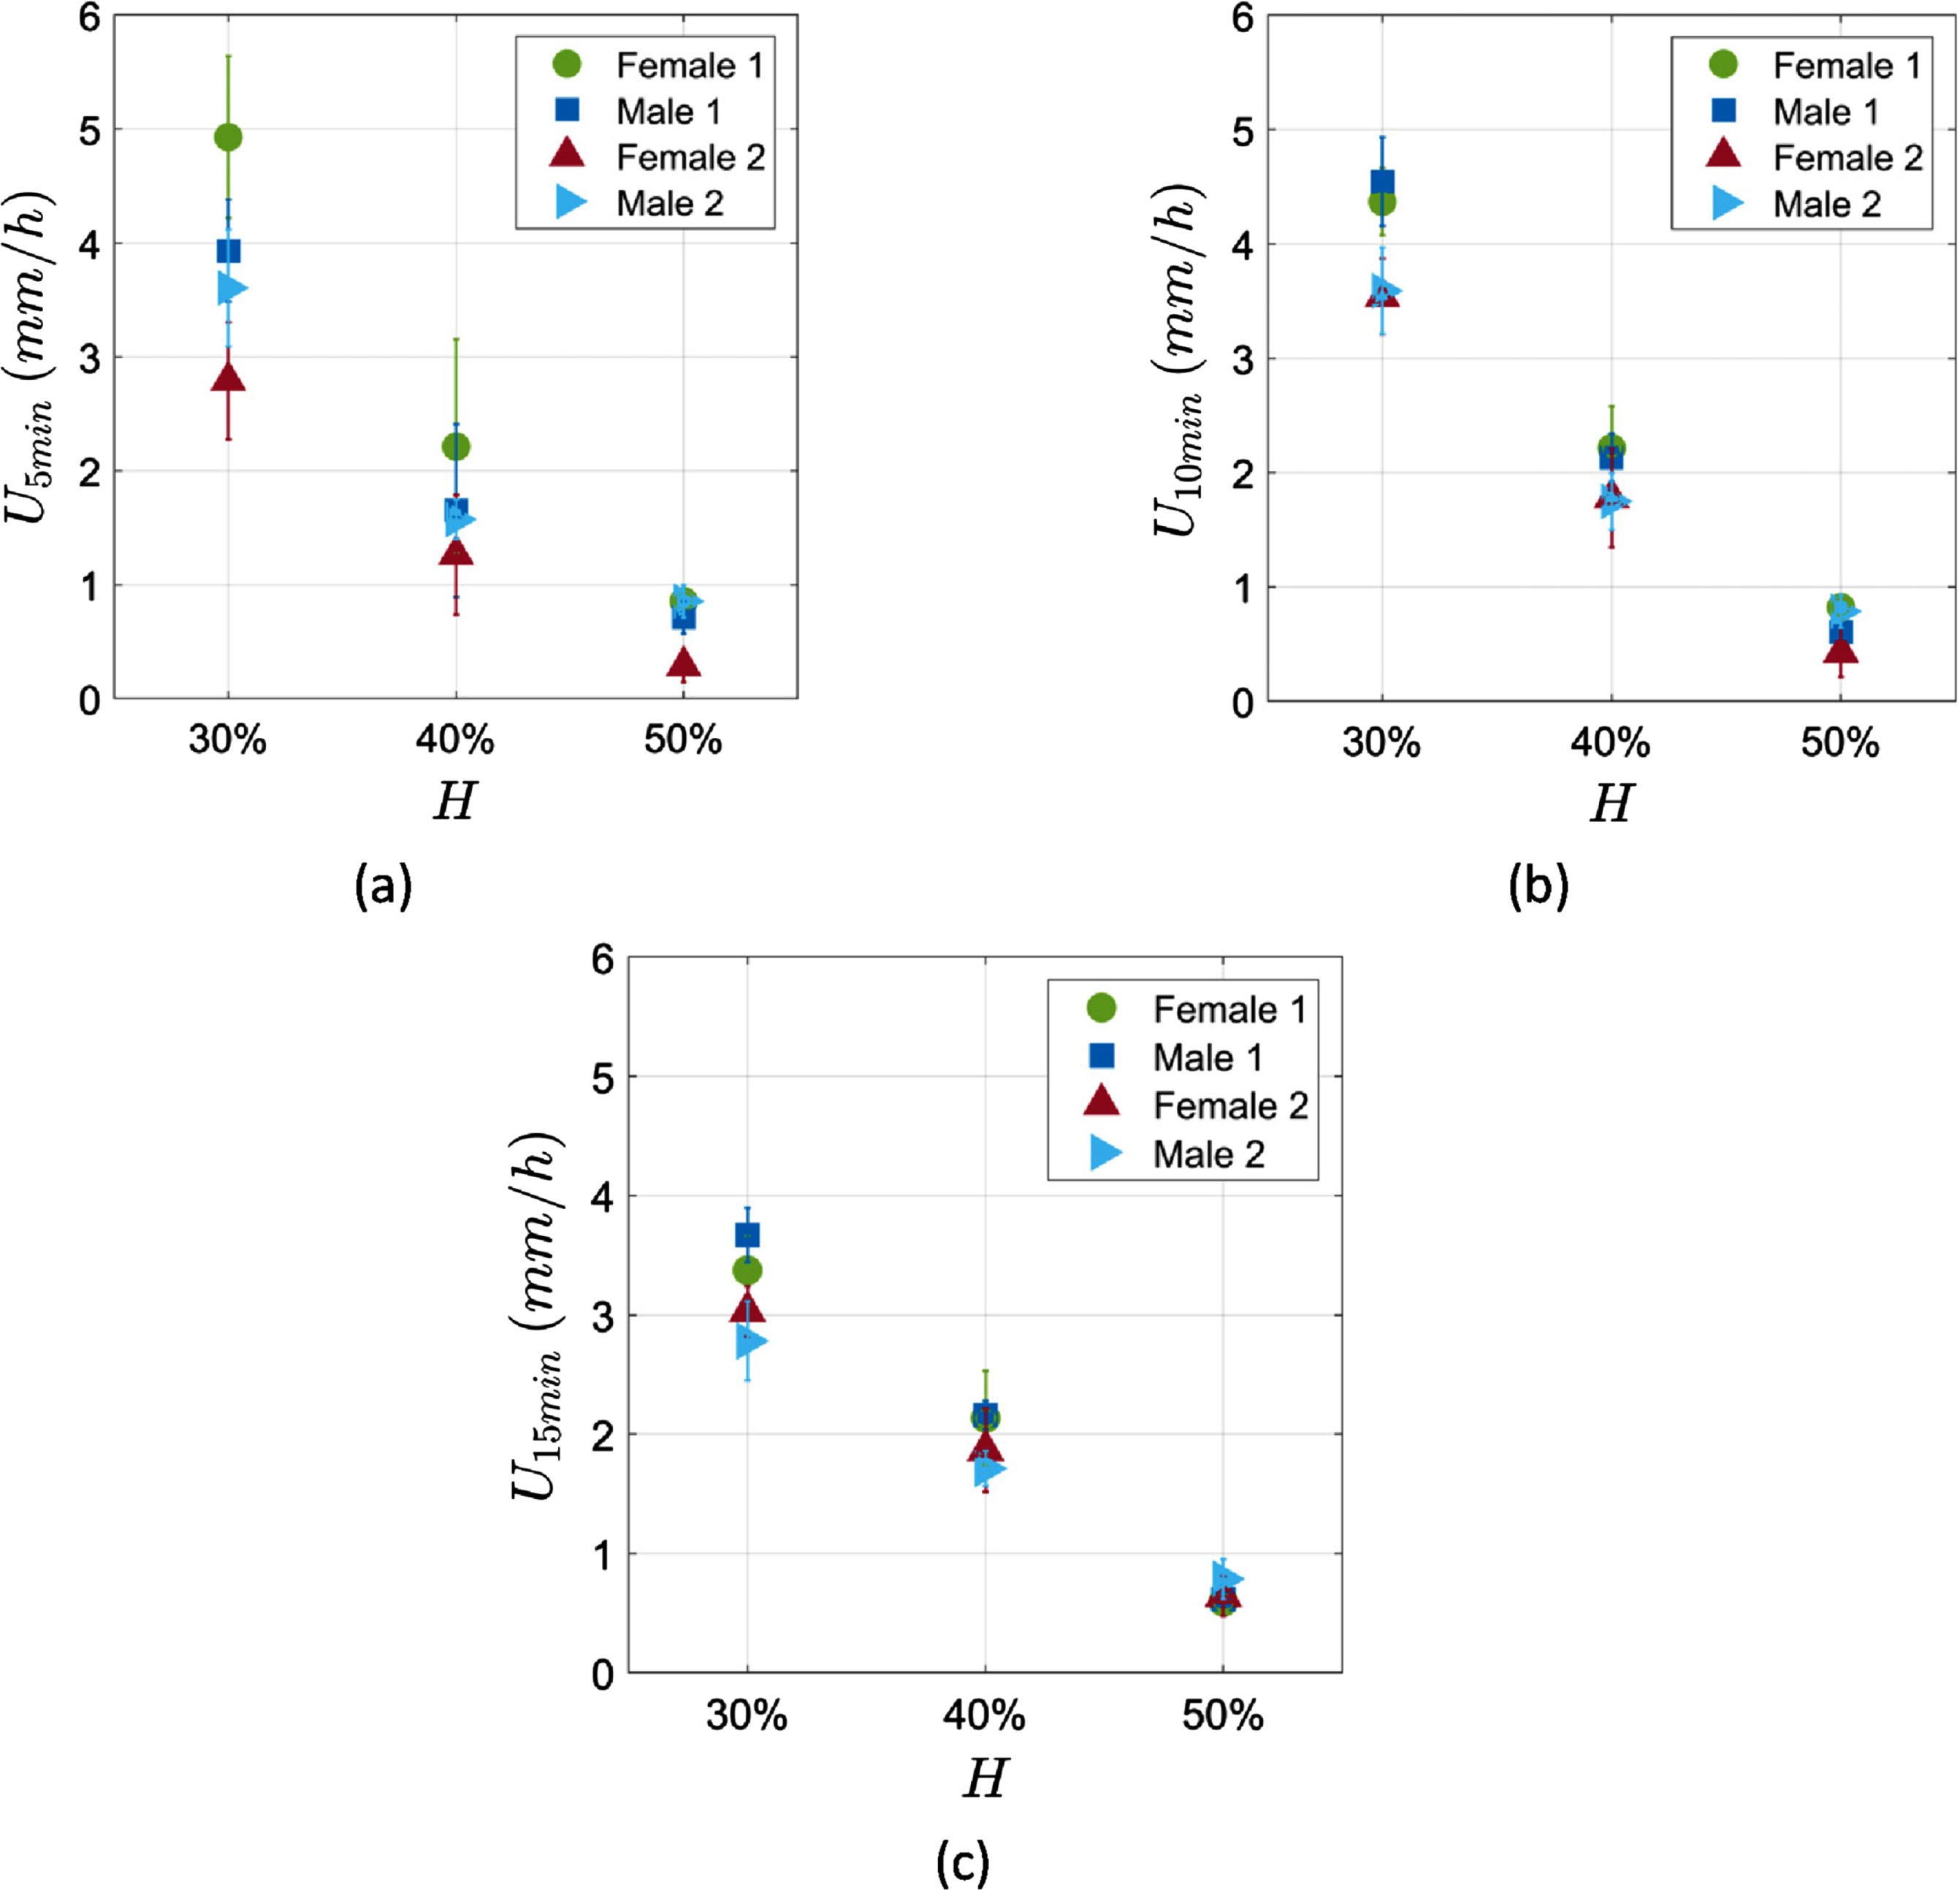
Blood samples from four different healthy donors were examined. The donors were two females and two males within a similar age group of 24 to 28 years old. Each sample was standardised to three haematocrits of 30%, 40% and 50% as described in the experimental methods section. Figure 3 shows the ESR measurements in the microchannel for each sample at the three different haematocrits, at 5 min, 10 min and 15 min of measurement time. The ESR results show a statistically significant behaviour which is inversely proportional to the sample haematocrit as it should be expected [11]. At the lowest haematocrit (30%) the range of the ESR results is higher indicating higher dispersion in the measurements compared to the 40% and 50% haematocrits.
Fig. 3
ESR measurements in the microchannel of the 4 donors at three different haematocrits. (a) at 5 min (b) at 10 min and (c) at 15 min of measurement time. The error bars correspond to the measurement and the repeatability uncertainties.
The ESR measurements obtained by the microchannels were compared to the ESR obtained by a commercial ESR analyser device (Smart Rate 10, by Jokoh); Figure 4 (a, b and c) shows this comparison for each time frame of measurement (5 min, 10 min and 15 min). The correlation between the two methods was tested with the Pearson test. The ESR measurements in the first 5 min has a very high linear correlation of 0.94 (p < 10–5) with the commercial device, while the measurements at 10 min and 15 min also show a high correlation of 0.87 (p < 10–3) and 0.81 (p < 10–2) respectively (Table 1).
Fig. 4
ESR measurements correlation between a commercial ESR analyser device (Smart Rate 10 by Jokoh in mm/h) and the microchannel ESR estimation method for (a) 5 min, (b) 10 min and (c) 15 min. The applied linear fitting is also demonstrated.
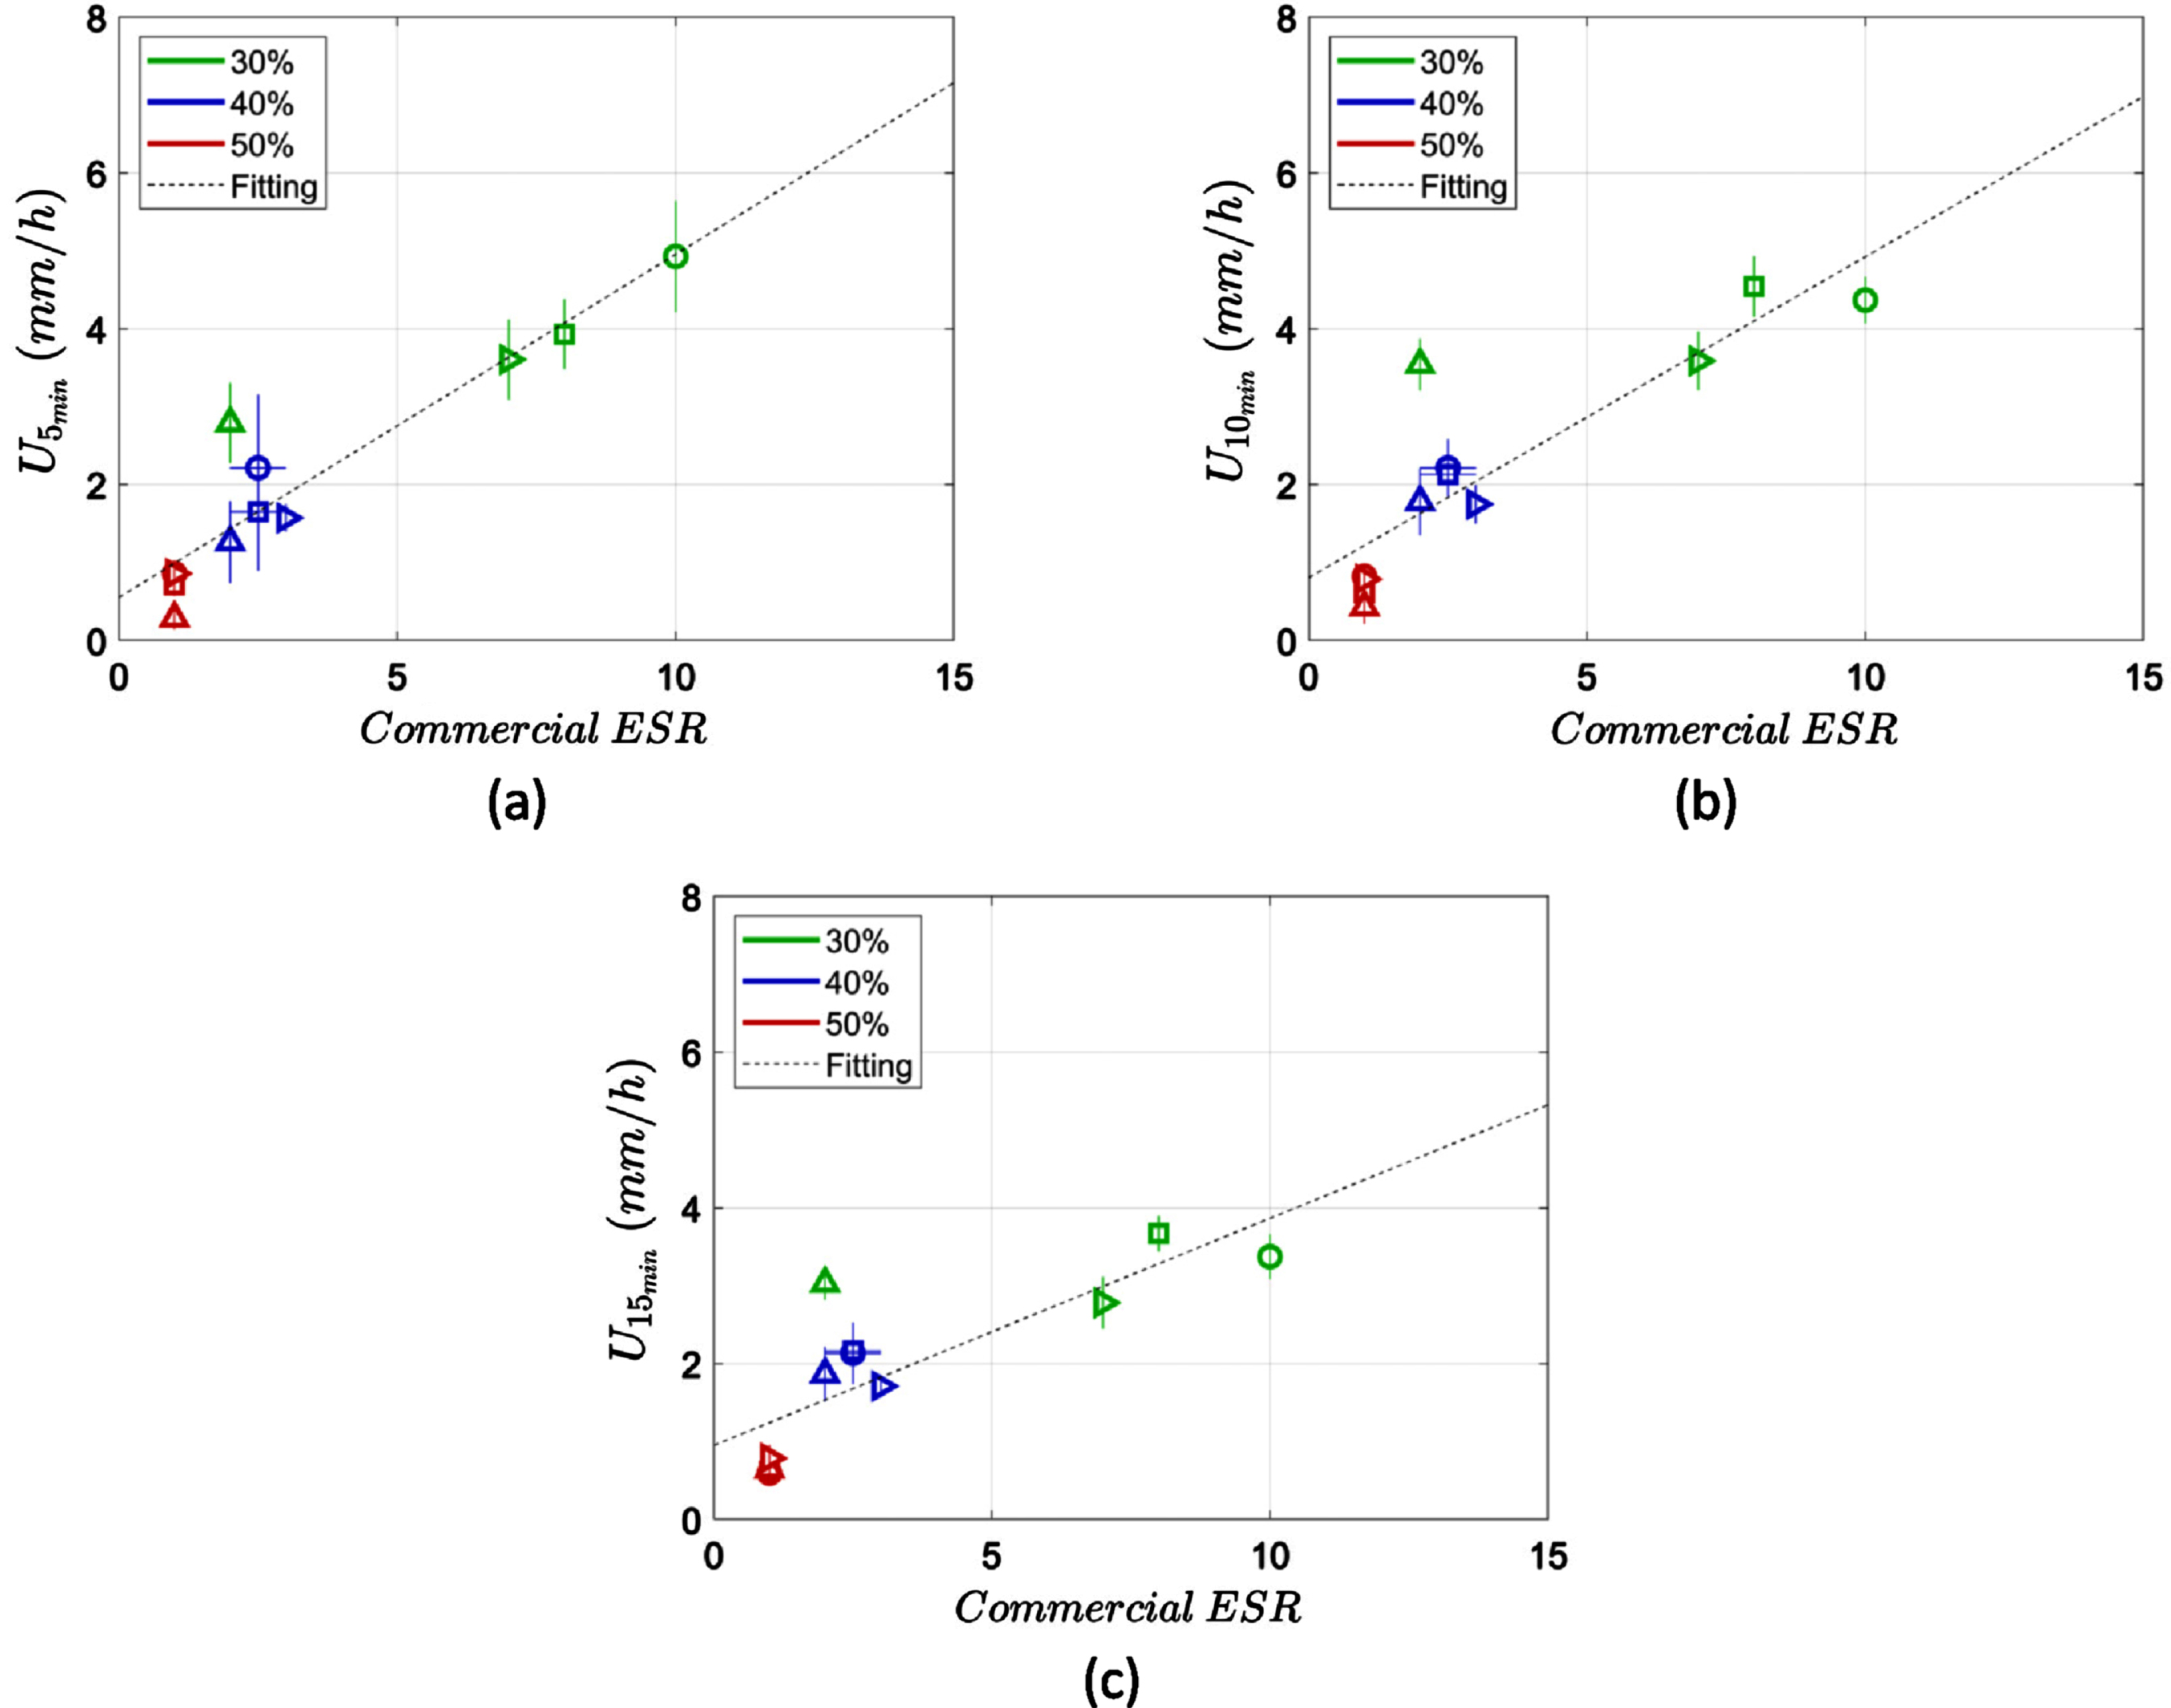
The linear relationship between the ESR measurements in the microchannel and the commercial ESR analyser indicates a correction factor between the two measurements. A linear regression was applied to the data as shown in Fig. 4. In particular the parameters P1 and P2 from the Equation 1 were calculated and demonstrated in Table 2. The r2 value of the fitting was also calculated corresponding to the square of Pearson’s correlation coefficient (Table 2).
Table 1
Pearson correlation test coefficients and p-values for the ESR in the microchannel against the Jokoh ESR
| ESR in channel | Pearson’s (r) | p-value |
| 5 min | 0.94 | <10–5 |
| 10 min | 0.87 | <10–3 |
| 15 min | 0.81 | <10–2 |
Table 2
The coefficients, P1 and P2, of the linear relationships between the ESR in the microchannel and the commercial ESR measurement. r2 is the square of Pearson’s correlation coefficient indicating the coefficient of determination
| ESR in channel | P1 | P2 | r2 |
| 5 min | 0.44 | 0.55 | 0.88 |
| 10 min | 0.41 | 0.81 | 0.76 |
| 15 min | 0.29 | 0.95 | 0.66 |
(1)
5Discussion
In this study a new micro-ESR measurement technique was evaluated and validated by correlating the results with a conventional ESR analyser. The short characteristic length (~2 mm) of the used microchannel is expected to produce a lower ESR compared to the commercial ESR analyser which uses tubes with length of 120 mm and a diameter of 8 mm. Indeed, this scale effect has been observed in many micro-ESR studies that use capillary tubes with smaller dimensions than the conventional tubes used in commercial instruments [3, 14, 23, 24].
The study showed that the micro-ESR obtained at 5 min had the highest correlation with the commercial ESR instrument measurements of 30 minutes. This result means that ESR can be successfully estimated within this time frame, using a factor or approximately 0.5 (Table 2), hence reducing the measuring time by multiple times compared to the conventional ESR techniques (or the current micro-ESR measurement techniques).
The regression of the data did not consider any age variation of the donors since the samples were obtained from donors of the same age group (24–28 years old). Rotstein et al., [20] added an extra parameter to the linear regression considering the age of the patient. This issue shall be examined in an appropriately designed study for the specific purpose.
The ESR was found to be sensitive to haematocrit showing a strong negative correlation within the measured time frames, i.e. 5 min, 10 min and 15 min (Fig. 3). In agreement to these results, the relation of ESR to haematocrit has been found to be inversely proportional by the majority of studies [11, 30–34], while the opposite dependence has been also reported [35]. Thereby in the clinical evaluation of ESR the haematocrit is simultaneously considered.
A brief delay, before the initiation of erythrocyte sedimentation, was observed at the first few minutes of the measurements as it is exhibited in Fig. 2a. The delay can be attributed to the mechanism of aggregation which is not instantaneous but it gradually intensifies with time. This delay has been found to be dependent on the globulin and fibrinogen concentrations in the plasma [33], which are also responsible for the RBC aggregation. Moreover, the sedimentation delay is associated to the time needed for the development of cracks within the body of the weak, colloidal-gel like, structure of the RBC aggregation network [36, 37]. It has been also observed that the delay of sedimentation increases significantly with haematocrit as the connectivity within the ‘erythrocyte gel’ gets stronger with haematocrit [16].
Figure 3 also illustrates the reproducibility of the method, in the form of the standard deviation of the mean values in each case. It is observed that in the 10- and 15-minute cases (graphs in Fig. 3b and c) the coefficient of variation (ratio of the standard deviation and mean value) is as low as 10%. In the 5-minute case the maximum coefficient of variation observed, for one particular case, is approximately 30%, however in the rest of the cases the coefficient is found below of approximately 20%.
In this study a new automated ESR measurement technique was evaluated and validated. This method has been evaluated as quicker than the conventional ESR analysis methods providing an automated way of precise ESR measurement. The short measuring time required alongside the low blood volume needed advances the potential for a finger prick use avoiding venepuncture. The main issue that may hinder the use of whole blood from finger prick is the possible impact of coagulation that could impede the erythrocyte sedimentation. The adhesive properties of platelets to glass [38] might further influence the sedimentation process in that case. A solution would be the addition of anticoagulant in the microchannels, similarly to the anticoagulant addition in the blood vacutainer tubes. This method was applied before [22]; the channel was washed with an EDTA solution and dried before use preventing the coagulation to occur during the measurement.
Limitations and sources of uncertainty in this study include the effect of channel dimensions and geometry, the surface properties of the material as well as the environmental conditions such as temperature and humidity.
In order to obtain reproducible results, the aforementioned parameters were kept constant within this set of experiments. The micro/mili scale dimensions of the channel could promote hyperaggregation but such effects have not been observed in our experiments.
The possible evaporation of the fluid that might occur at the entrance and exit of the microchannel, can be considered negligible due to the relatively long distance of the observation point from the entrance and exit.
The particular sample size and the age range of the study illustrated the operation principle of this ESR microfluidic measurement. More experiments are required to strengthen the statistical analysis by examining a larger sample size, extending the age range and the use of pathological blood samples.
6Conclusion
The micro-ESR measurement technique presented in this study has strong correlation with the commercial ESR analysers, while it provides some significant advantages. As mentioned the time frame that the measurement occurs can be limited to 5 min, reducing importantly the total time of ESR estimation. The reduced blood volume that is required allows the potential for a daily use by patients and serve as an option for an in-home ESR measurement method, as its automated fashion provides safety to operators and limits the analytic imprecision of the human factor. The custom-made ESR-monitoring, device that is used for the ESR measurement, provides the major advantage of creating a working station for in-home use, capable of measuring further haematological indices related to coagulation and aggregation.
Acknowledgments
This work was co-funded by the European Regional Development Fund and the Republic of Cyprus through the Research and Innovation Foundation (ref.: EXCELLENCE /0918/0215). We also thank Dr A. Darras and Prof. C. Wagner from Saarland University, for the useful discussions regarding various aspects of the work.
References
[1] | Sabio H , McKie VC . Modified (mixed) erythrocyte sedimentation rate in sickle cell anemia, Clin Hemorheol Microcirc (1992) ;12: (4):587–92. 10.3233/CH-1992-12412. |
[2] | Ying P , Lu T , Xu Y , Miu Y , Xue Y , Huang Z , et al. Preoperative erythrocyte sedimentation rate in patients with rheumatoid arthritis predicts deep vein thrombosis following total knee arthroplasty, Clin Hemorheol Microcirc (2022) ;81: (1):23–31. 10.3233/CH-211286.. |
[3] | Douglas SE , Randolph TR . Development of a micro-ESR system with potential for in-home use, Clin Lab Sci (2007) ;20: (1):12–9. |
[4] | Sox HC Jr. , Liang MH . The erythrocyte sedimentation rate, Guidelines for rational use. Ann Intern Med (1986) ;104: (4):515–23. |
[5] | Higgins C . Erythrocyte sedimentation tests as an aid to diagnosis, Nurs Times (1997) ;93: (6):60–1. |
[6] | Pawlotsky Y , Goasguen J , Guggenbuhl P , Veillard E , Jard C , Pouchard M , et al. ESR: An erythrocyte sedimentation rate adjusted for the hematocrit and hemoglobin concentration, Am J Clin Patho (2004) ;122: (5):2–10.. 10.1309/8H4L-45F5-G0G1-VKY1 |
[7] | van der Maas A , van den Ende CHM , van Eerd J , Fransen J , den Broeder AA . The use of different methods for rapid determination of the ESR induces DAS28 misclassification in clinical practice, Clin Exp Rheumatol (2010) ;28: (4):477–82. |
[8] | Caswell M , Stuart J . Storage of blood samples for measurement of plasma viscosity and erythrocyte sedimentation rate, Clin Hemorheol Microcirc (1992) ;12: (2):309–15. 10.3233/CH-1992-12216.. |
[9] | Rampling MW , Whittingstall P , Linderkamp O . The effects of fibrinogen and its plasmin degradation products on the rheology of erythrocyte suspensions, Clin Hemorheol (1984) ;4: (6):533–43. |
[10] | Harkness J . Comparison of the E.S.R. and plasma viscosity tests., Clin Hemorheol (1989) ;9: (1):35–9. |
[11] | Shi Y-D , Lian Z-J . An equation relating erythrocyte sedimentation rate(ESR) to hematocrit(Hct) and its implication, Clin Hemorheol (1988) ;8: (5):669–78. |
[12] | Krüger-Genge A , Sternitzky R , Pindur G , Rampling M , Franke RP , Jung F . Erythrocyte aggregation in relation to plasma proteins and lipids, J Cell Biotechnol (2019) ;5: (1):65–70. 10.3233/JCB-189014.. |
[13] | Rabe A , Kihm A , Darras A , Peikert K , Simionato G , Dasanna AK , et al. The erythrocyte sedimentation rate and its relation to cell shape and rigidity of red blood cells from chorea-acanthocytosis patients in an off-label treatment with dasatinib, Biomolecules (2021) ;11: (5). 10.3390/biom11050727. |
[14] | Movassaghi S , Sharifi ZN , Soleimani M , Joghataii MT , Hashemi M , Shafaroodi H , et al. Effect of pentoxifylline on ischemia-induced brain damage and spatial memory impairment in rat, Iran J Basic Med Sci (2012) ;15: (5):1083–90. |
[15] | Lee SB , Kim Y-S , Kim JH , Park K , Nam JS , Kang S , et al.Use of RBC deformability index as an early marker of diabetic nephropathy, Clin Hemorheol Microcirc (2019) ;72: (1):75–84. 10.3233/CH-180434. |
[16] | Darras A , Dasanna AK , John T , Gompper G , Kaestner L , Fedosov DA , et al. Erythrocyte Sedimentation: Collapse of a High-Volume-Fraction Soft-Particle Gel, Phys Rev Lett (2022) ;128: (8):10.1103/PhysRevLett.128.088101.. |
[17] | Dasanna AK , Darras A , John T , Gompper G , Kaestner L , Wagner C , et al. Erythrocyte sedimentation: Effect of aggregation energy on gel structure during collapse, Phys Rev E (2022) ;105: (2):10.1103/PhysRevE.105.024610. |
[18] | Zhao T-X , Lockner D . Electrical impedance and erythrocyte sedimentation rate (ESR) of blood, BBA - Biomembr (1993) (2):243–8. 10.1016/0005-2736(93)90411-R. |
[19] | Koepke JA . Welcome innovation in erythrocyte sedimentation testing, Am J Clin Pathol (2002) ;118: (1):11–2. 10.1309/JW5K-5CH2-WWLW-W1FW. |
[20] | Rotstein R , Fusman R , Berliner S , Levartovsky D , Rogowsky O , Cohen S , et al. The feasibility of estimating the erythrocyte sedimentation rate within a few minutes by using a simple slide test, Clin Lab Haematol (2001) ;23: (1):21–5. 10.1046/j.1365-2257.2001.00361.x.. |
[21] | Plebani M , Piva E . Erythrocyte sedimentation rate: Use of fresh blood for quality control, Am J Clin Pathol (2002) ;117: (4):621–6. 10.1309/QB1G-6FRR-DNWX-BKQ9. |
[22] | Isiksacan Z , Asghari M , Elbuken C . A microfluidic erythrocyte sedimentation rate analyzer using rouleaux formation kinetics, Microfluid Nanofluidics. (2017) ;21: (3):10.1007/s10404-017-1878-7. |
[23] | Preet K , Anchinmane V , Sankhe S . Evaluation of micro-ESR method with Westergren method for determination of erythrocyte sedimentation rate, Int J Res Med Sci (2018) ;6: (2):628–31. |
[24] | Adhikari D . Erythrocyte Sedimentation Rate, Measurement by Capillary Tube Method, (micro-ESR)- Best Method for Neonate and Small Children, J Med Sci Clin Res (2017) ;1: :22135–7. |
[25] | Pasias D , Koutsokeras L , Passos A , Constantinides G , Balabani S , Kaliviotis E . Effects of biomechanical properties of blood on surface tension-driven flows in superhydrophilic channels, Phys Fluids (2022) ;34: (5):10.1063/5.0088643. |
[26] | Neffe AT , Von Ruesten-Lange M , Braune S , Luetzow K , Roch T , Richau K , et al. Poly(ethylene glycol) grafting to poly(ether imide) membranes: Influence on protein adsorption and thrombocyte adhesion, Macromol Biosci (2013) ;13: (12):1720–9. 10.1002/mabi.201300309. |
[27] | Krüger-Genge A , Tondera C , Hauser S , Braune S , Görs J , Roch T , et al. Immunocompatibility and non-thrombogenicity of gelatin-based hydrogels, Clin Hemorheol Microcirc.-50. 10./CH- (2021) ;77: (3):335–50. 10.3233/CH-201028. |
[28] | Braune S , Latour RA , Reinthaler M , Landmesser U , Lendlein A , Jung F . In Vitro Thrombogenicity Testing of Biomaterials, Adv Healthc Mater (2019) 8: (21):10.1002/adhm.201900527. |
[29] | Neumann F-J , Schmid-Schönbein H , Ohlenbusch H . Temperature-dependence of red cell aggregation, Pflügers Arch Eur J Physiol (1987) ;408: (5):524–30. 10.1007/BF00585080. |
[30] | Poole JCF , Summers GAC . Correction of E.S.R. in Anaemia, Br Med J (1952) ;1: (4754):353–6. 10.1136/bmj.1.4754.353. |
[31] | Bull BS , Brecher G . An evaluation of the relative merits of the Wintrobe and Westergren sedimentation methods, including hematocrit correction, Am J Clin Pathol (1974) ;62: (4):502–10. 10.1093/ajcp/62.4.502. |
[32] | Baskurt O , Neu B , Meiselman HJ . Red blood cell aggregation. Red Blood Cell Aggregation. 2011. |
[33] | Hung WT , Collings AF , Low J . Erythrocyte sedimentation rate studies in whole human blood, Phys Med Biol (1994) ;39: (11):1855–73. 10.1088/0031-9155/39/11/005. |
[34] | Jacobson DM , Slamovits TL . Erythrocyte Sedimentation Rate and Its Relationship to Hematocrit in Giant Cell Arteritis, Arch Ophthalmol (1987) ;105: (7):965–7. 10.1001/archopht.1987.01060070101037. |
[35] | Pribush A , Meyerstein D , Meyerstein N . The mechanism of erythrocyte sedimentation, Part The global collapse of settling erythrocyte network. Colloids Surfaces B Biointerfaces (2009) ;75: (1):224–7. 10.1016/j.colsurfb.200908.037. |
[36] | Buscall R , Choudhury TH , Faers MA , Goodwin JW , Luckham PA , Partridge SJ . Towards rationalising collapse times for the delayed sedimentation of weakly-aggregated colloidal gels., Soft Matter (2009) ;5: (7):1345–9. 10.1039/b805807e. |
[37] | Bartlett P , Teece L , Faers M . Sudden collapse of a colloidal gel, Phys Rev E (2012) ;85: :21404. |
[38] | George JN . Direct assessment of platelet adhesion to glass: a study of the forces of interaction and the effects of plasma and serum factors, platelet function, and modification of the glass surface, Blood (1972) ;40: (6):862–74. 10.1182/blood.v40.6.862.862. |


