
Performance comparison of the PFA-200 and Anysis-200: Assessment of bleeding risk screening in cardiology patients
Abstract
BACKGROUND:
Assessment of platelet function is important in the management of patients who are subject to operation as well as at potential risk of hemorrhagic complications.
OBJECTIVE:
This study aimed to evaluate a new platelet assays (Anysis-Epinephrine, Anysis-ADP) and to compare them with PFA-200 in cardiology visiting patients and inpatients.
METHODS:
Citrated blood samples were collected from 184 patients for ADP test and 163 patients for EPI test, who visited Korea University Guro Hospital with written consent. The PFA-200 assay gives a test result the closure time (CT) until the blood flow rate decreases to 10% of the initial value, whereas Anysis-200 assay does a blood flow migration distance (MD) until blood flow completely stops. According to the results of PFA closure time (CT), the tested samples were classified as either negative control or positive group. The measurements were simultaneously conducted with two devices and compared.
RESULTS:
The sensitivity and specificity of Anysis-200 C/EPI kit in comparison to PFA-200 C/EPI kit was 87.5% and 85.7%, respectively. Regarding C/ADP kit, the sensitivity and specificity of Anysis-200 was 96.9% and 87.5%, respectively. In addition, the sums of sensitivity and specificity are greater than 150% for both of EPI and ADP. Also, it was found that likelihood ratio and odd ratio for each assay provide useful additional information. Since the Cohen’s kappa coefficients value between the two devices was relatively high, the equivalence between the two devices was confirmed.
CONCLUSIONS:
Anysis-200, a novel platelet function analyzer has showed excellent agreements with PFA-200 with high agreement rates and precision. Anysis-200 assay would be useful in assessing bleeding risk management as well as abnormal platelet reactivity at point of care.
1Introduction
Abnormal platelet hyper-reactivity is correlated with venous thromboembolism (VTE) [1, 2] as well as cardiovascular diseases [3–6]. Furthermore, a recent studies reported that COVID-19 was strongly related with VTE [7]. Thus, platelet function test has been considered as an important information to set up-up the treatment strategy. However, bleeding is the most feared complication of anticoagulant treatment of VTE and the bleeding risk is varied with treatment time-dependent manner. For instance, when patients start to receive thrombolytic treatment, they used to yield high risk of bleeding in the first months of anticoagulant treatment [8]. Clinical guidelines on the treatment of VTE suggest incorporating assessment of bleeding with available tools and methods, if possible [9, 10].
In response to the clinical needs, several platelet assays are now available for assessing the antiplatelet therapeutic response such as Platelet Function Analyzer-200 (PFA-200, Siemens Healthineer, Munich, Germany) and Multiplate Analyzer (MPA, Roche Diagnostics, Rotkreuz, Switzerland). PFA-200 adopted a platelet aggregation-induced flow closure in a pressure-driven flow, whereas MPA adopted an electrical impedance changes between tow electrodes with platelet adhesion and aggregation. Both methods can examine degree of platelet aggregation after activating platelets with various agonists. Typical agonists are adenosine diphosphate (ADP) and epinephrine for bleeding risk screening and arachidonic acid (AA) for Aspirin response test. These methods have been validated with a light transmission aggregometry (LTA), which is regarded as the “gold standard” method [11, 12]. However, the LTA is labor intensive and time-consuming method, which restricts its use in routine laboratory testing [13, 14].
Anysis-200 analyzer (Rheo Meditech Inc., Seoul, Korea) has been newly introduced as a POC device for platelet function testing (ADP, epinephrine) as well as assessment of antiplatelets assay (Aspirin, P2Y12). Recent clinical studies reported that Anysis-200 demonstrated the equivalent performance for screening patients for patients with abnormal platelet function compared to the PFA-200 [15] and VerifyNow [16, 17], respectively. In the present study, we aimed to re-evaluate the performance Anysis-200 in screening patients with abnormal platelet functions in cardiology patients in comparison to PFA-200. The Anysis-200 analyzer provides the results with the migration distance (MD) of blood through microfluidic system and the MD is compatible with closure time (CT) obtained by PFA-200.
2Materials and methods
2.1Patient samples
ADP and EPI performance analyses each incorporated 184 and 163 whole blood samples, respectively, that were collected at Korea University Guro Hospital between April 2020 and December 2020. The exclusion criteria for this study were as follows: platelet count < 100×109/L, hematocrit < 35% and > 60%, abnormal value of either prothrombin time or activated partial thromboplastin time within the previous 1 month, pregnancy, and use of anticoagulation agents. The study protocol was approved by the Institutional Review Board of Korea University Guro Hospital (IRB No. 2019GR0390), and written informed consent was obtained from all patients before study enrolment.
Blood samples were obtained using 21-G needles and collected into 3.2% sodium-citrate tubes (0.109 mol/L buffered sodium citrate; BD Vacutainer Systems, Franklin Lakes, NJ, USA) in both the Anysis-200 assays and PFA-200. After blood collection, the tubes were gently inverted (five to six times). During the transportation, special care was taken to avoid agitation-induced platelet activation. Thereafter, the blood samples were left still at room temperature for 30 min prior to the test. All tests were performed within 120 min after blood collection to minimize the risk of time dependent platelet malfunction. According to the results of PFA closure time (CT), the tested samples were classified as either negative control or positive group.
2.2Anysis-200 platelet function analyzer
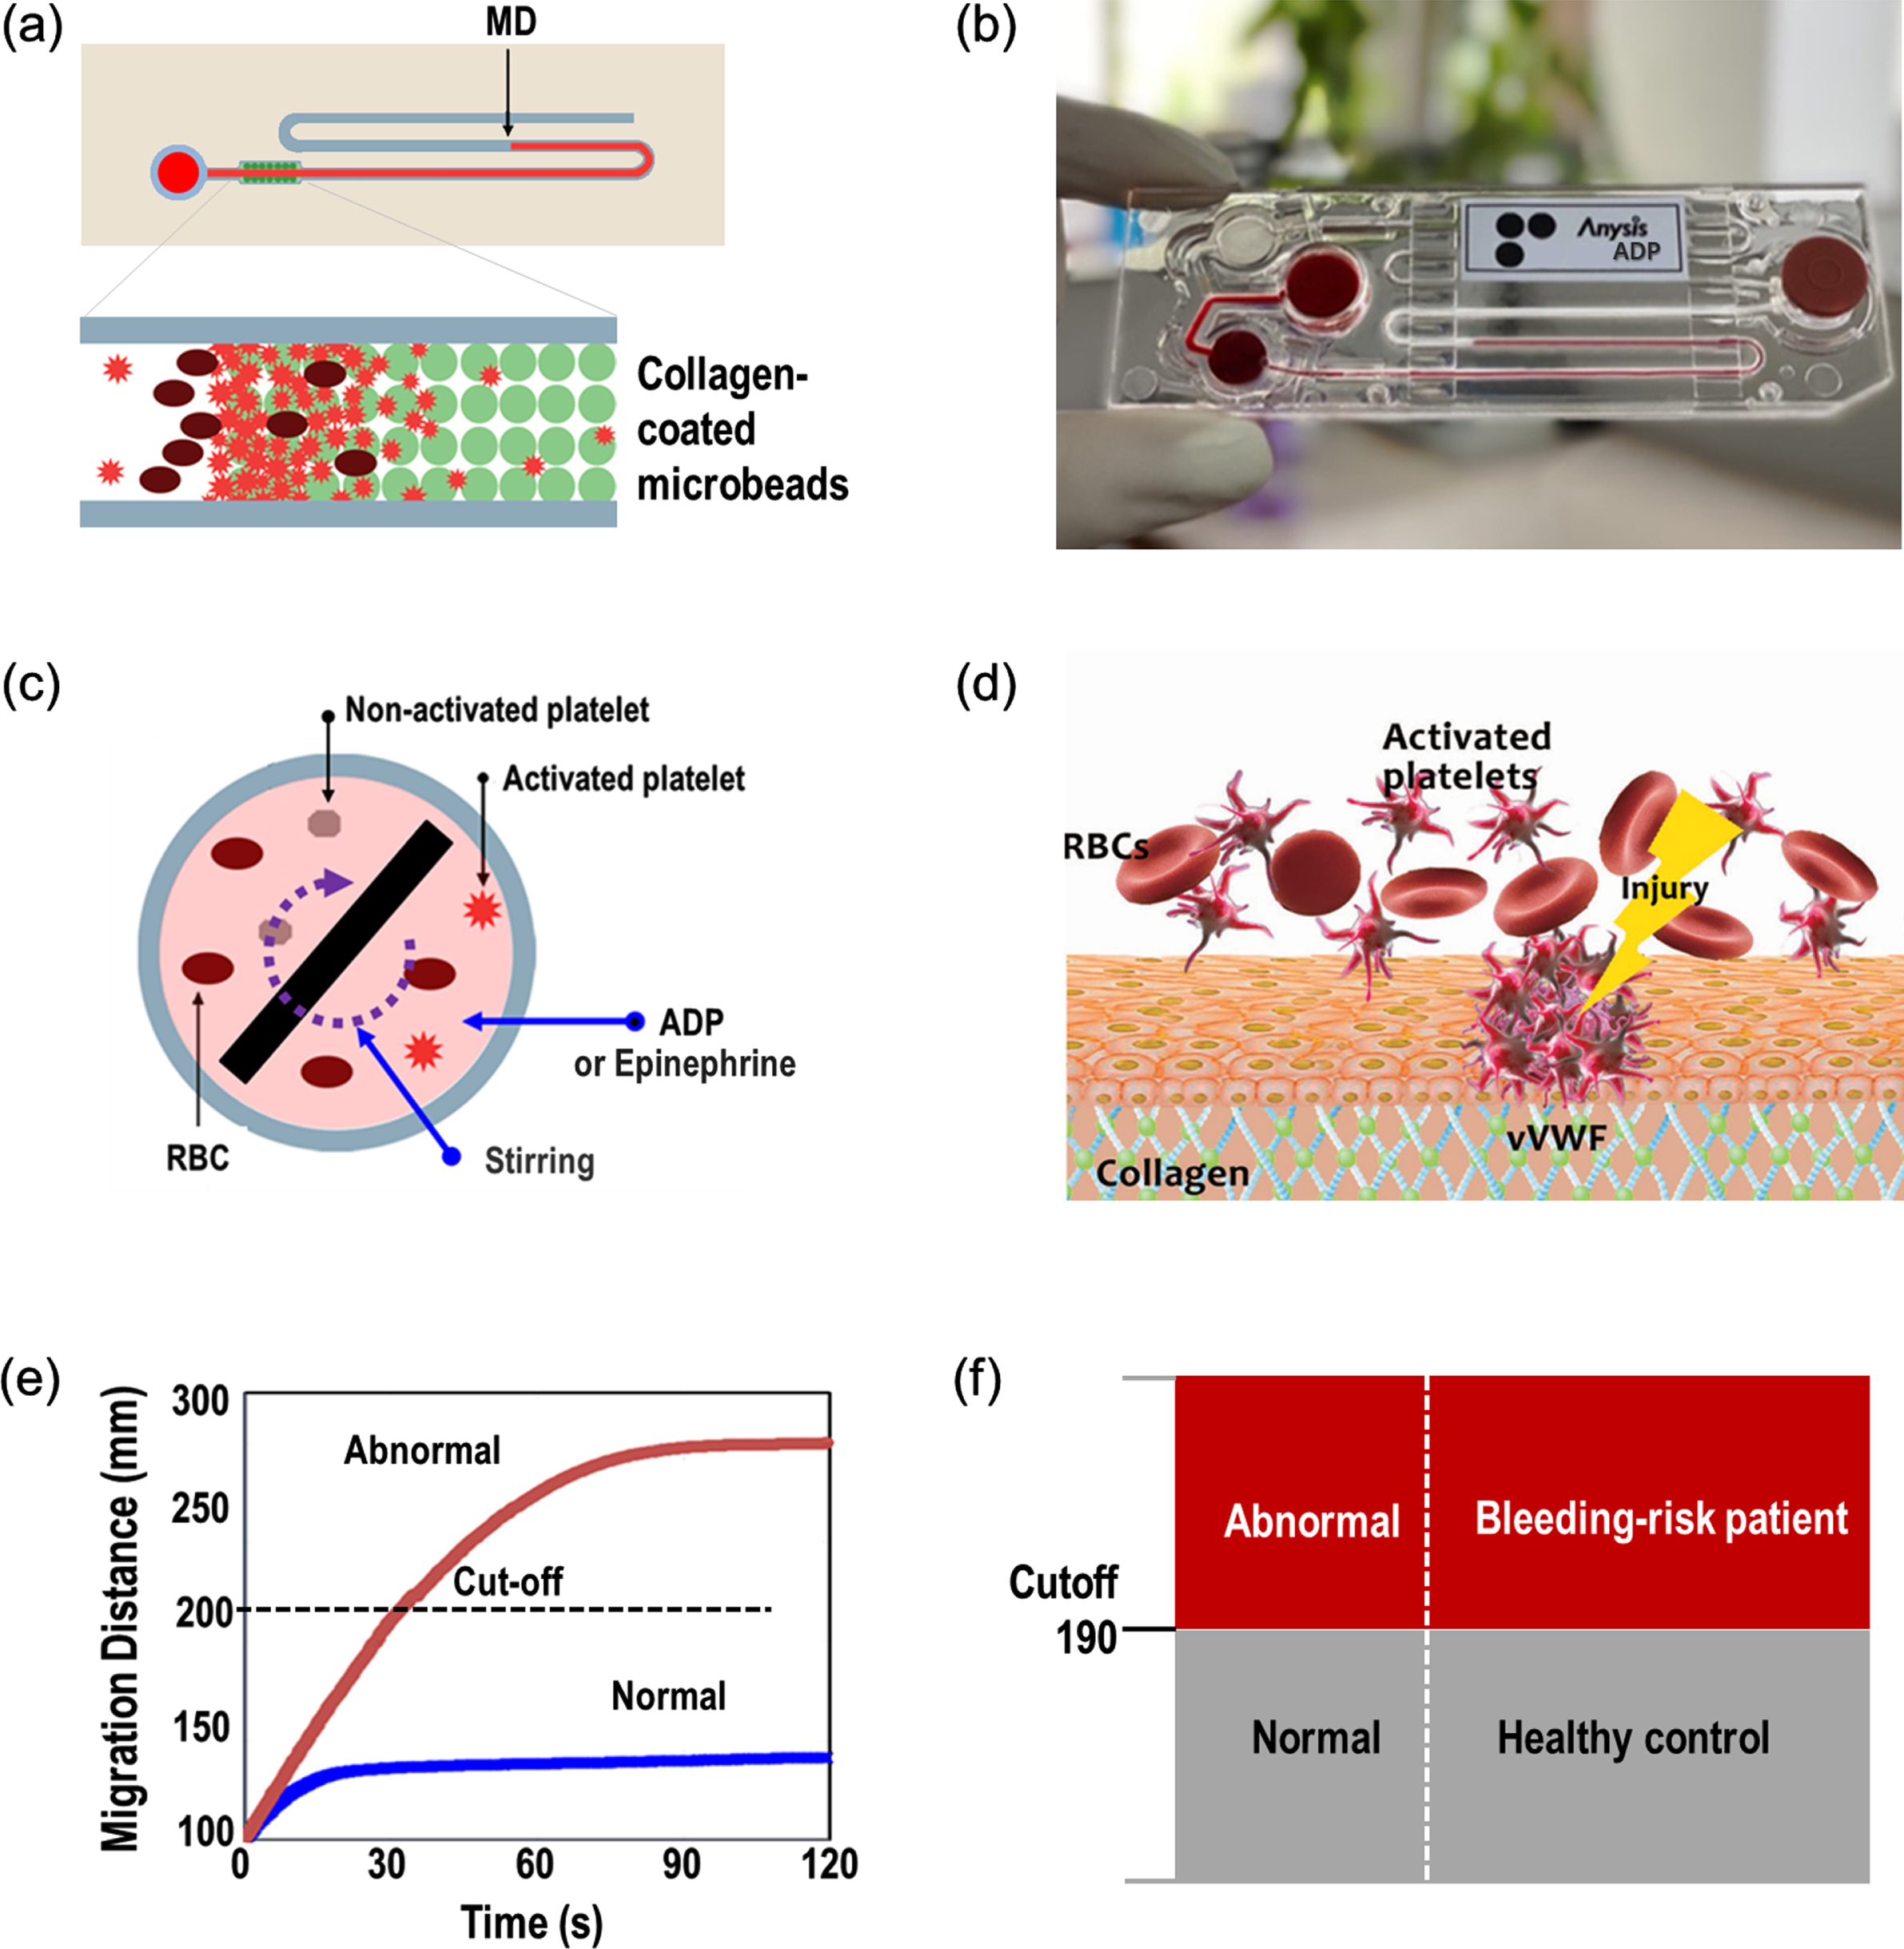
Anysis-200 analyzer is a platelet function test system with a disposable microfluidic test cartridge, as shown in Fig. 1. The test cartridge consists of a sample inlet, sample chamber, a plastic microtube containing a bead-packed section, and a waste chamber. A stirrer in the sample chamber for mixing agonist with blood is remotely driven by magnetics. Then, activated platelets in the upstream sample chamber start to flow and may adhere to the surface of extracellular matrix (ECM) of injured blood vessel in the downstream. The agents used in this study were ADP and epinephrine, and their concentrations in the sample chamber were 1.2μM and 0.5μM, respectively. For bleeding risk screening, collagen was chosen as the ECM material. In the test cartridge, thousands of microbeads coated with collagen were packed and inserted right after the sample chamber and thus all blood cells including platelets should pass through the bead pores. For collagen conjugation, the microbeads were suspended in a collagen solution [25 mg/mL in acetic acid buffer solution (50 mM, pH = 5.0)] and shaken gently for 24 h at room temperature. The pore size is big enough for white blood cells and red blood cells to freely flow through pores. However, when a few platelets adhered to the bead surface, blood cells may not freely flow through them. Eventually, the pores among beads may completely blocked by platelet aggregation with other blood cells. For abnormal bloods, the blockage may be retarded and yield a long migration distance. With provided cutoff value of the migration distance, one can determine whether the tested sample is normal or not. The cutoff values of MD are 210 for epinephrine test and 190 for ADP, respectively. Further detailed description of Anysis-200 can be found elsewhere [18–21].
Fig. 1
Operating principle of the Anysis-200 assay. (a) Schematic representation of the assay system for platelet adhesion and aggregation, (b) photograph of Anysis-ADP test kit, (c) activation of platelets with mixing agonist (either ADP or epinephrine), (d) schematic of platelet adhesion on in-vivo extracellular matrix such as collagen, (e) migration distance variation with time until the flow stop for normal and abnormal, (f) decision with cutoff migration distance.
2.3Platelet function analyzer (PFA)-200
Assessment on PFA-200 (Siemens Canada, Mississauga, Ontario, Canada) was conducted using 800μL of each citrated blood sample with cartridges containing collagen-adenosine diphosphate (COL/ADP) and collagen-epinephrine (COL/EPI)-coated membranes for platelet activation. The CT values (s), defined as the time taken by platelets to occlude the orifice and to block the whole blood flow, were measured. The prolonged CTs were defined as CT≥250 sec (C/EPI) and≥110 sec (C/ADP) according to the manufacturer’s instructions. Any closure time greater than 300 sec is reported as 300 sec. According to measurements of PFA-200, participating patients were divided into two groups (negative control versus positive group).
2.4Statistical analysis
Normally distributed data were expressed as mean±standard deviation. The sensitivity and specificity were analyzed considering the results from PFA-200 as abnormal and normal control. Pairwise agreement between the two platelet function assays was assessed using Cohen’s kappa coefficient. Cohen’s kappa coefficient results were interpreted as follows: values≤0 meant no agreement and 0.01–0.20 none to slight, 0.21–0.40 fair, 0.41–0.60 moderate, 0.61–0.80 substantial, and 0.81–1.00 denoted almost perfect agreement [22]. P < 0.05 was considered statistically significant. All statistical analyses were performed by using MedCalc version 12.1.4 software (MedCalc Software, Mariakerke, Belgium).
3Results
3.1Descriptive characteristics and hematologic parameters
For the comparison between ADP analyses of Anysis-200 and PFA-200, a total of 134 male and 50 female patients, aged 65.6±9.8 years (mean±SD), were included (Table 1). Among them, and 103 and 68 patients were diagnosed with hyperlipidemia and diabetes, respectively. The platelet count was 214±54×109/L (mean±1SD).
Table 1
Baseline patient characteristics
| Variable | ADP test (N = 184) | EPI test (N = 163) |
| Age (years), mean±SD | 65.60±9.76 | 65.95±9.14 |
| Male sex, n (%) | 134 (72.8%) | 110 (67.5%) |
| Risk factors | ||
| Diabetic mellitus, n (%) | 68 (37.0%) | 67 (41.1%) |
| Hyperlipidemia, n (%) | 103 (56.0%) | 87 (53.4%) |
| Medicines | ||
| Aspirin, n (%) | 40 (21.7%) | 53 (32.5%) |
| P2Y12 inhibitors, n (%) | 35 (19.0%) | 17 (10.4%) |
| DAPT, n (%) | 64 (34.8%) | 59 (36.2%) |
| Laboratory findings | ||
| RBCs (×1003/μL) | 4.5±0.4 | 4.5±0.5 |
| WBCs (×1003/μL) | 6.7±2.0 | 6.9±2.3 |
| Platelets (×1003/μL) | 213.7±54.0 | 224.2±61.5 |
| Hemoglobin (g/dL) | 14.0±1.3 | 14.0±1.4 |
| Hematocrit (%) | 41.9±3.7 | 41.8±4.0 |
| PT (s) | 13.0±0.6 | 12.8±0.7 |
| aPTT (s) | 32.8±2.5 | 32.4±2.9 |
| Glucose (mg/dL) | 103.6±12.6 | 105.0±17.9 |
Continuous data are shown as mean±1SD.
As for the comparison between EPI analyses of Anysis-200 and PFA-200, a total of 110 male and 53 female patients, aged 66.0±9.1 years (mean±SD), were included (Table 1). Among them, 87 and 67 patients were diagnosed with hyperlipidemia and diabetes, respectively. The platelet count for these patients was 224±62×109/L (mean±SD). The clinical characteristics of the patients included in the EPI and ADP study are both shown in Table 1.
3.2Comparative measurements between the two platelet function assays
Table 2 summarizes the measurement results for ADP and epinephrine test. The tested samples were classified as either negative control or positive groups according to the results of PFA closure time (CT). The cutoff CT value of PFA-200 were 110 s for ADP and 250 s for epinephrine tests, respectively. Throughout the analytical performance analysis, the corresponding cutoff values of Anysis-200 were determined as 190 for ADP and 210 for epinephrine tests, respectively.
Table 2
Comparison of migration distances for ADP, epinephrine test between negative controls and positive measured with PFA-200 and Anysis-200
| Test | Method (cutoff) | Group (number of samples) | Mean±SD | P-value |
| ADP (n = 184) | PFA-200 (CT≥110) | Negative control (n = 120) | 80.4±14.9 | < 0.0001 |
| Positive (n = 64) | 152.3±61.5 | |||
| Anysis-200 (MD≥190) | Negative control (n = 120) | 153.5±37.8 | < 0.0001 | |
| Positive (n = 64) | 255.7±28.1 | |||
| Epinephrine (n = 163) | PFA-200 (CT≥250) | Negative control (n = 91) | 133.1±41.8 | < 0.0001 |
| Positive (n = 72) | 289.2±16.2 | |||
| Anysis-200 (MD≥210) | Negative control (n = 91) | 174.3±34.4 | < 0.0001 | |
| Positive (n = 72) | 246.7±32.3 |
First, for ADP test, the mean CT value in the normal control group (n = 120) was 80.4±14.9 s, whereas that in abnormal group (n = 64) was 152.3±61.5 s. Similarly, Anysis-ADP showed MD values of 153.5±37.8 mm for negative control (n = 120) and 255.7±28.1 mm for positive group (n = 64), respectively. For both PFA-200 and Anysis-200, the level of statistical significance between negative and positive groups (p-value) was less than 0.001. Meanwhile, for epinephrine test of PFA-200, the mean CT value in the negative control group (n = 91) was 133.1±41.8 s, whereas that in positive group (n = 72) was 289.2±16.2 s (p < 0.0001). Similarly, Anysis-Epinephrine showed MD values of 174.3±34.4 mm for negative control and 246.7±32.3 mm for positive group (p < 0.0001). Table 3 describes distribution results of negative and positive groups with normal distribution and boxplot.
Table 3
Distribution of negative and positive groups for ADP and epinephrine tests
| Method based on normal distribution | Boxplot | |||||
| Group | Mean | Lower limit (90%CI) | Upper limit (90%CI) | Median | Lower fence | Upper fence |
| Anysis-ADP | ||||||
| Negative (n = 120) | 153.5 | 79.3 (69.4–89.2) | 227.6 (217.7–237.5) | 139 | 115 | 196 |
| Positive (n = 64) | 255.7 | 200.7 (190.6–210.7) | 310.0 (300.7–320.9) | 268 | 262 | 268 |
| Anysis-Epinephrine | ||||||
| Negative (n = 91) | 174.3 | 106.8 (96.4–117.1) | 241.8 (231.5–252.1) | 167 | 115 | 262 |
| Positive (n = 72) | 246.7 | 183.3 (172.4–194.2) | 310 (299.1–320.9) | 268 | 186 | 268 |
Figure 2 (a) and (b) describe the scattering plot and receiver operating characteristic (ROC) curve for ADP test comparing Anysis-200 and PFA-200. With the cutoff value of 190 mm (MD), the sensitivity and specificity of Anysis-200 was 96.9% (95% CI, 89.2%–99.6%) and 87.5% (95% CI, 80.2%–92.8%), respectively. Also, the area under curve (AUC) is 0.946. The correlation between Anysis-200 and PFA-200 for ADP test was very strong. The agreement rate between Anysis-200 and PFA-200 was 0.61 (Cohen’s kappa coefficient, κ), which is interpreted as good agreement between two devices. In addition, Fig. 2 (c) and (d) also describe distribution results of negative and positive groups with normal distribution method and boxplot, respectively.
Fig. 2
(a) Scatter plot comparing Anysis-200 and PFA-200 for ADP, (b) receiver operating characteristic curve for ADP, (c) normal distribution of MD values for negative and positive with upper and lower limits (90% CI) in ADP test, (d) boxplot of MD values for negative and positive in ADP test.
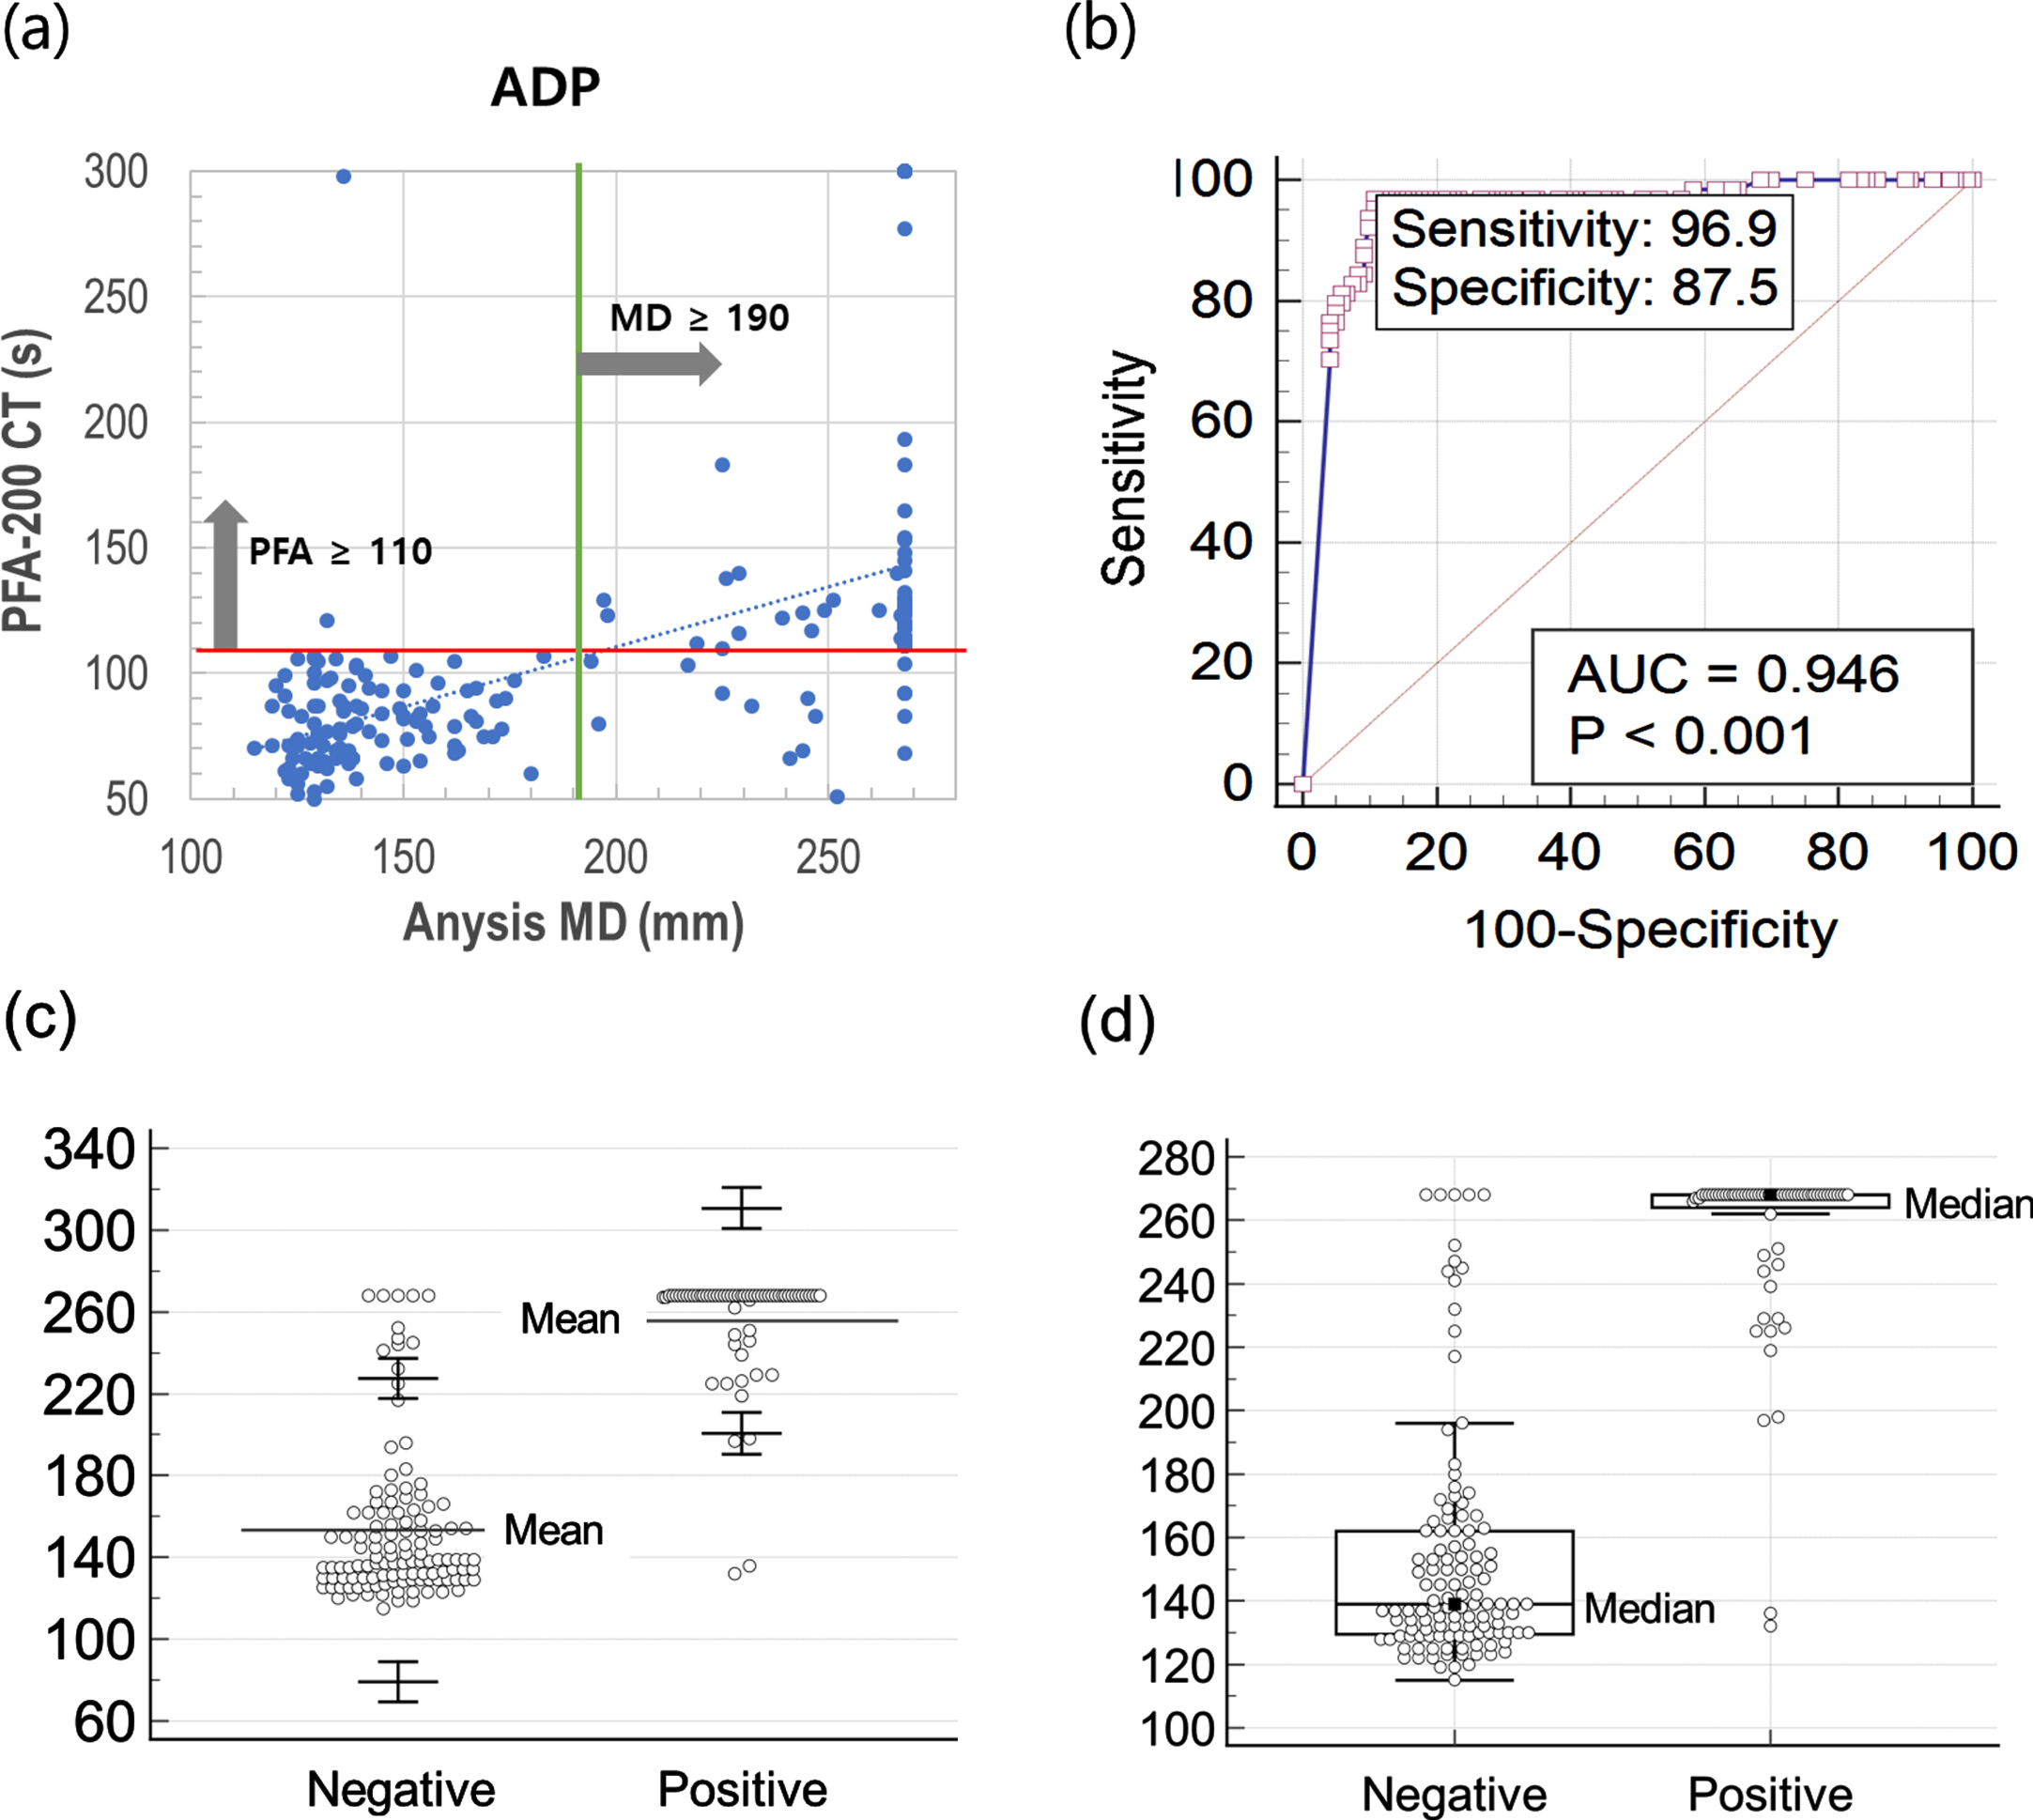
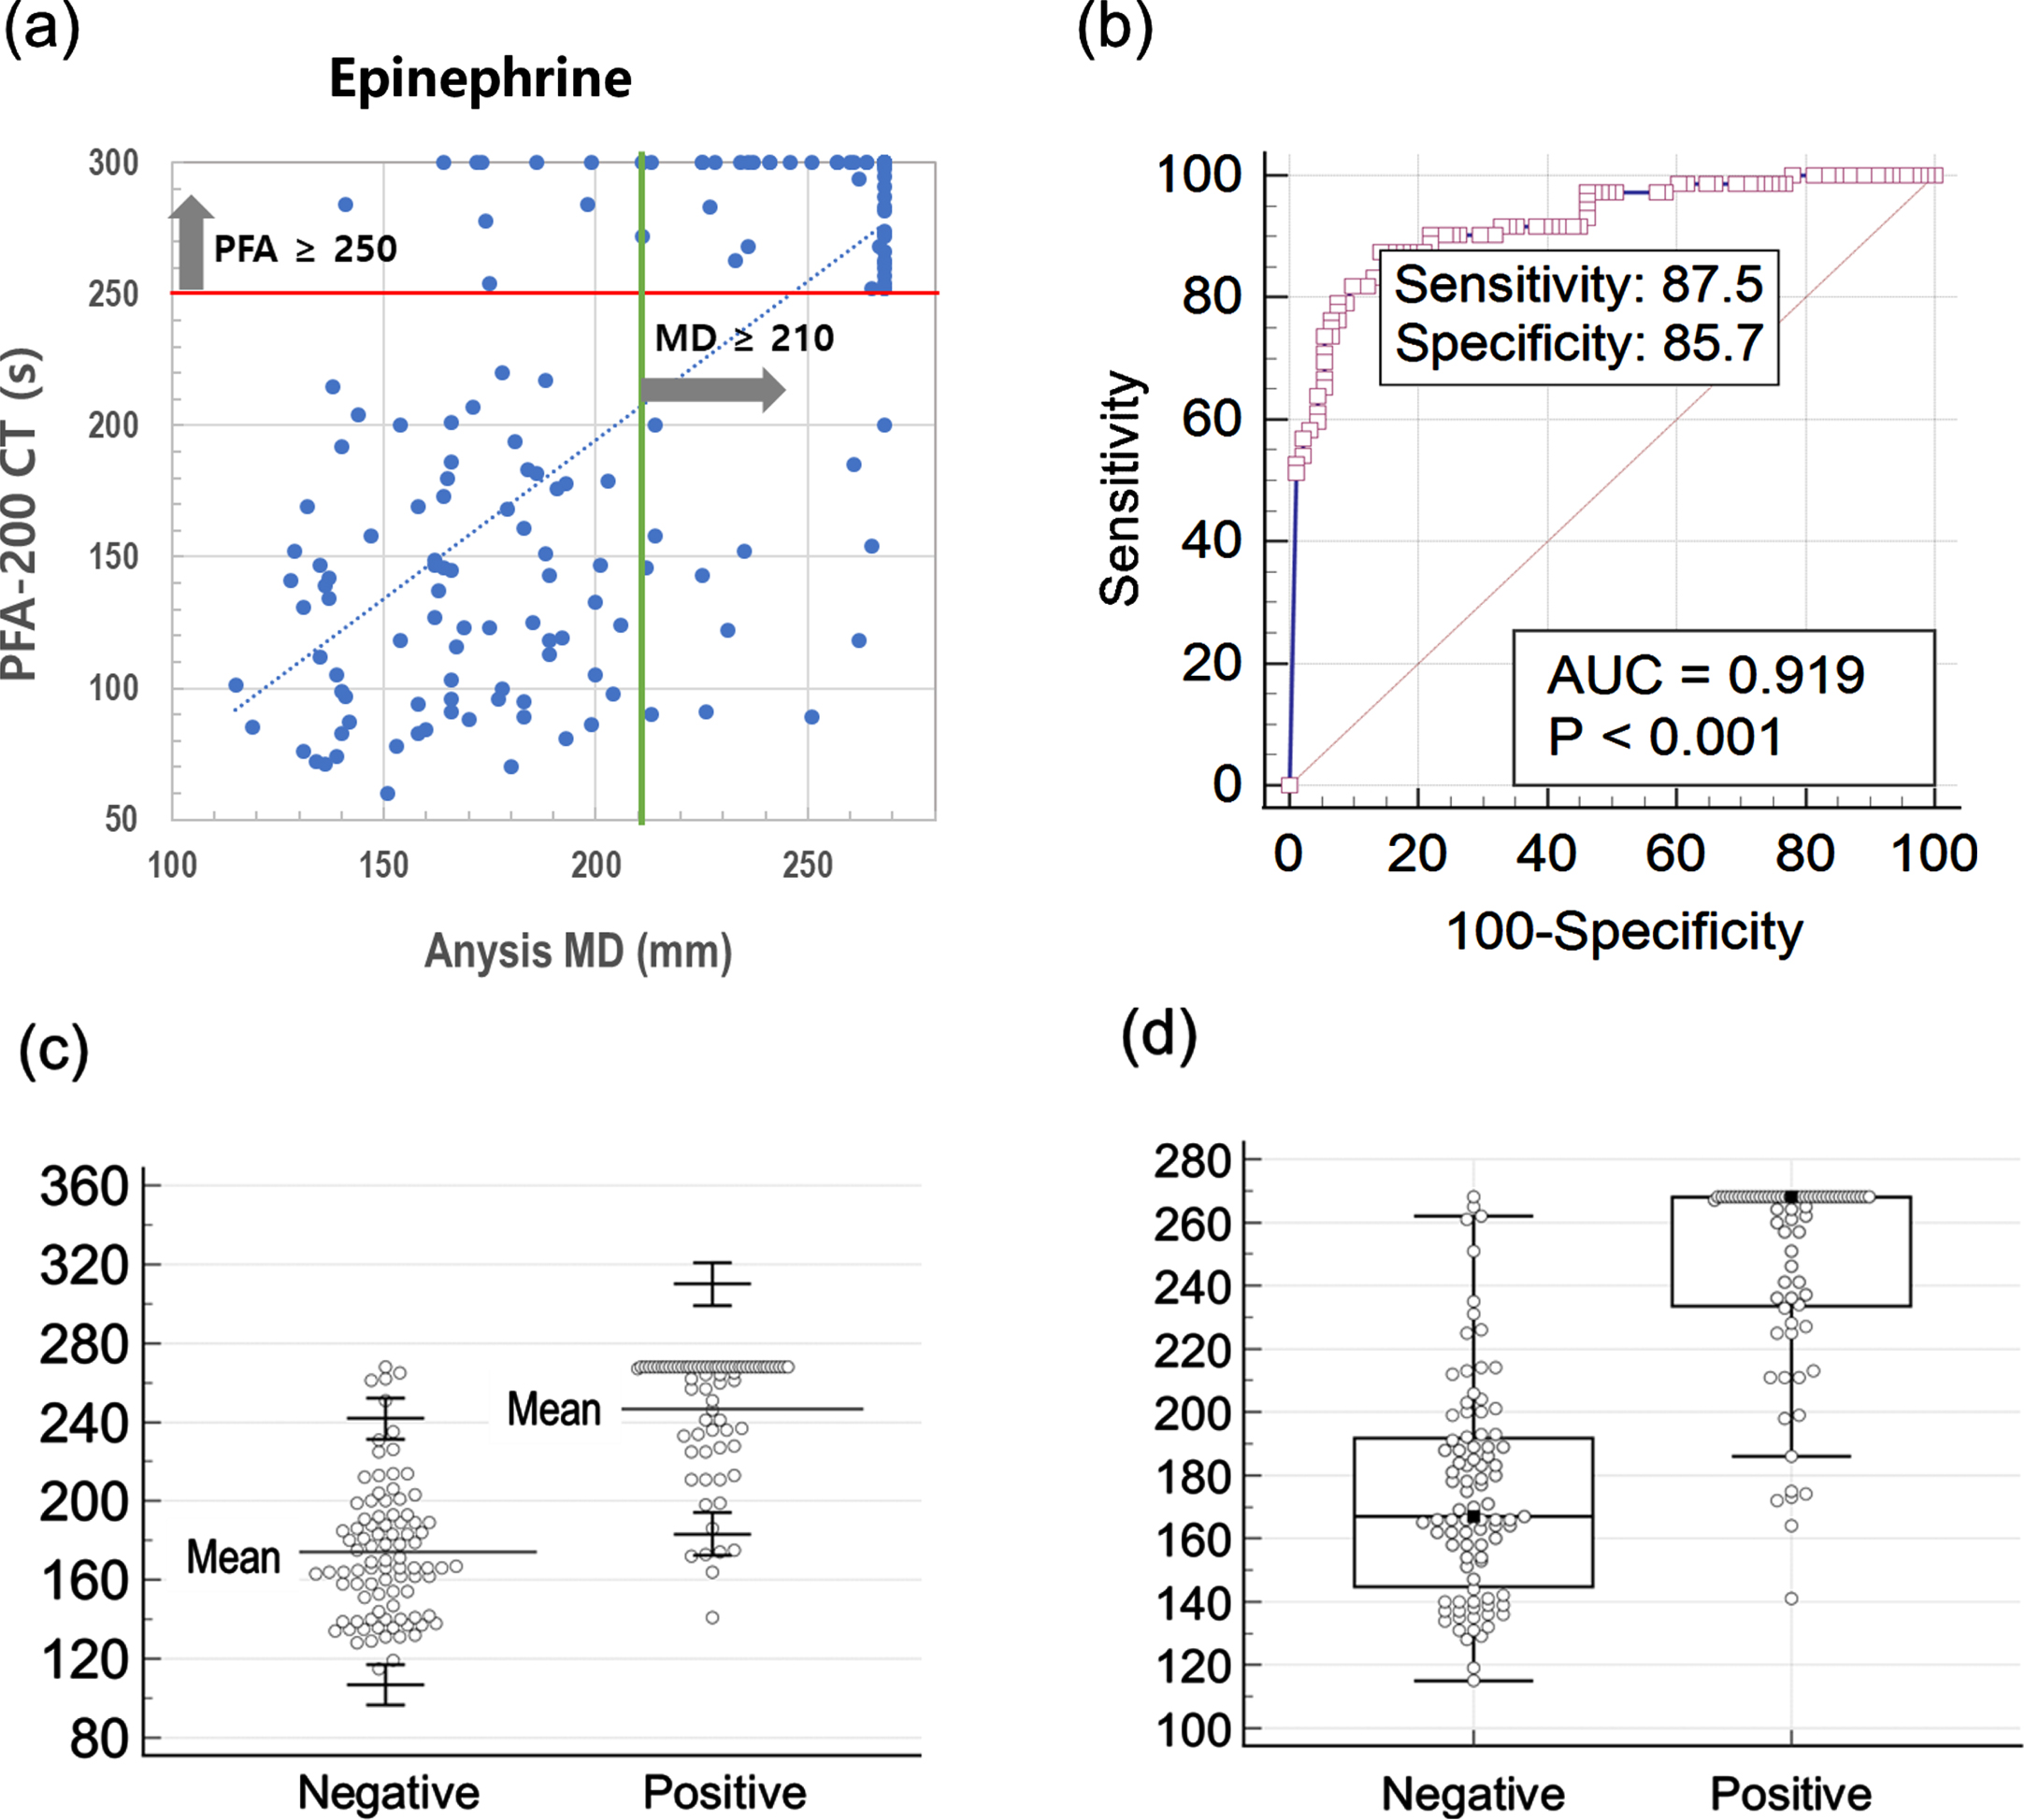
Figure 3 (a) and (b) describe the scattering plot and receiver operating characteristic (ROC) curve for Epinephrine test comparing Anysis-200 and PFA-200. With the cutoff value of 210 mm (MD), the sensitivity and specificity of Anysis-200 was 87.5% (95%CI, 77.6%–94.1%) and 85.7% (95% CI, 76.8%–92.2%), respectively. Also, the area under curve (AUC) is 0.919. The correlation between Anysis-200 and PFA-200 for EPI test was strong. The agreement rate between Anysis-200 and PFA-200 was 0.59 (Cohen’s kappa coefficient, κ), which is interpreted as good agreement between two devices. In addition, Fig. 3 (c) and (d) also describe distribution results of negative and positive groups with method based on normal distribution and boxplot, respectively.
Fig. 3
(a) Scatter plot comparing Anysis-200 and PFA-200 for epinephrine test, (b) receiver operating characteristic curve for epinephrine test, (c) normal distribution of MD values for negative and positive with upper and lower limits (90% CI) in epinephrine test, (d) boxplot of MD values for negative and positive in epinephrine test.
4Discussion
The present study compared two devices which adopt their own unique techniques to assess platelet aggregation levels. Interestingly, both PFA-200 and Anysis-200 adopted a similar mechanism of flow path closure via platelet aggregation. The dimensions of the flow path to be blocked are 150μm of an aperture in collagen-coated membrane for PFA-200 and 13μm of multiple voids formed in a microbeads-packed tube for Anysis-200, respectively [21]. A study reported that if a characteristic length of the test section is less than 90μm, the effect of adhesion may be stronger than that of aggregation and vice versa [24]. Furthermore, the PFA system adopted the closure time (CT) until the aperture is blocked, whereas Anysis system did the migration distance (MD) of blood until the voids are blocked. Even for the different characteristics between two devices, the agreement rate between them was found to be relatively high [15]. In the present study, the kappa coefficient for ADP was 0.61 and 0.59 for EPI –which indicates good agreement of both types of analyses between PFA-200 and Anysis-200.
Over the decades, a variety of platelet function tests have been introduced based on unique principles of operation from light transmission aggregometer by Gus Born [25] and microfluidic aggregometric method [26]. Owing to the development of these various devices, operational convenience and test time have been greatly improved and their clinical application has been significantly expanded. However, since these platelet function tests were developed without standardized guidelines, there was a serious problem that the test results between devices did not match each other. Thus, there have been some efforts to provide standard guidelines for platelet function tests including agonist concentrations [27]. For the ADP test, the recommended concentrations of ADP is 2–10μM and that of Anysis-ADP test is 1.2μM. The agonist concentrations for various method and instruments listed in Table 4 [28, 29]. The present Anysis system followed the recommended values, whereas some of them do not. As we reported earlier, high concentration of agonists would result in excessive activation of platelets, leading to false diagnosis of platelet function [30, 31]. Thus, the selection of agonist concentration requires extreme care.
Table 4
Comparison of agonist concentrations in commercial assays
| Agonists [antagonist] | Collagen (μg/mL) | ADP (μM) | Epinephrine (μM) | AA (μM) | [PGE1] (nM) |
| Recommended concentration (optimal) | 1–25 (1.25) | 2–10 (2.5) | 0.5–10 (5) | 0.5–1.6 (1.0) | |
| LTA | 1.5 | 3–10 | 5 | 0.3–0.5 | – |
| MEA (Roche) | 1.5 | 6.4 | 5 | 0.5 | 9.4 |
| PFA-100 (Siemens) | – | 20 | 100 | – | – |
| VerifyNow (Accumetrix) | – | 20* | – | 1000 | 22* |
| Anysis (Rheomeditech) | 25 | 1.2 (2*) | 0.5 | 144 | 0.6* |
*P2Y12 test, AA: Arachidonic acid.
In the present study, sensitivity, specificity and AUC are 87.5%, 85.7% and 0.919, respectively, for Anysis-Epinephrine; and 96.9%, 87.5% and 0.946, respectively, for Anysis-ADP. For a general screening test, there are a few rules of thumb as follows: 1) The sum of sensitivity and specificity (S + S) [32]; 2) area under the curve (AUC); 3) likelihood ratio for a positive test result (LR+) or Likelihood ratio for a negative test result (LR-); and 4) diagnostic odds ratio (D = LR+/LR-) [33]. According to these rules, we summarized the present results in Table 5. First, the sums of Sensitivity+Specificity are 173.2% for Anysis-Epinephrine and 184.4% for Anysis-ADP, respectively. These two values are much higher than the threshold value of 150%. Second, both values of AUC are also ranked in the highest regions of accuracy. Third, LR+ and LR–for epinephrine and ADP also showed second highest rank with providing useful additional information. The diagnostic odds ratios for them are 40.8 and 215.3, respectively, which are much higher than the 20. Last, the diagnostic odds ratio is known for relatively independent of changes in prevalence and spectrum of sensitivity and specificity. Considering the guidelines of these rules, the diagnostic performance of the Anysis-200 was confirmed to be equivalent to that of PFA-200.
Table 5
Various indexes to representing diagnostic performance
| Definition &classification | EPI | ADP | |
| Sensitivity (%) | 87.5 | 96.9 | |
| Specificity (%) | 85.7 | 87.5 | |
| Sen + Spe (%) | Sensitivity+ Specificity≥1.5 (150%) | 173.2 | 184.4 |
| AUC | AUC > 0.9: high accuracy | 0.919 | 0.946 |
| 0.7∼0.9: moderate accuracy | |||
| 0.5∼0.7: low accuracy | |||
| LR+ | Sensitivity/(1-Specificity) | 6.12 | 7.75 |
| > 10: having potential to alter clinical decisions | |||
| 5∼10: providing useful additional information | |||
| < 5: rarely to alter clinical decisions | |||
| LR- | (1-Sensitivity)/Specificity | 0.15 | 0.036 |
| < 0.1: having potential to alter clinical decisions | |||
| 0.1∼0.2: providing useful additional information | |||
| 0.33∼3: rarely to alter clinical decisions | |||
| Diagnostic Odds Ratio | (= LR+/LR-) > 20 | 40.8 | 215.3 |
Acknowledgments
This research was supported by the Seoul R&D Project (no. BT200171).
Conflicts of interest
The authors report no potential conflicts of interest relevant to this article.
Ethical approval
This study was approved by Institutional Review Board, Korea University Guro Hospital (approval no. 2019GR0390) and performed in accordance with the declaration of Helsinki. The participants provided informed consent for participation in the study.
References
[1] | Puurunen MK , Hwang SJ , O’Donnell CJ , Tofler G , Johnson AD . Platelet function as a risk factor for venous thromboembolism in the Framingham Heart Study. Thromb Res. (2017) ;151: :57–62. doi: 10.1016/j.thromres.2017.01.010 |
[2] | Vázquez-Santiago M , Vilalta N , Cuevas B , Murillo J , Llobet D , Macho R , Pujol-Moix N , Carrasco M , Mateo J , Fontcuberta J , et al. Thromb Res. (2018) ;169: :57–63. |
[3] | Puurunen MK , Hwang SJ , Larson MG , Vasan RS , O’Donnell CJ , Tofler G , Johnson AD . ADP Platelet Hyperreactivity Predicts Cardiovascular Disease in the FHS (Framingham Heart Study). Am Heart Assoc (2018) ;7: (5). |
[4] | Reinthaler M , Braune S , Lendlein A , Landmesser U , Jung F . Platelets and coronary artery disease: Interactions with the blood vessel wall and cardiovascular devices. Biointerphases. (2016) ;11: (2):029702. doi: 10.1116/1.4953246 |
[5] | Martínez-Quintana E , Rodríguez-Hernández JL , Riaño-Ruiz M , Rodríguez-González F . Mean platelet volume and major adverse cardiovascular events in congenital heart disease patients. Clin Hemorheol Microcirc. (2019) ;72: (4):327–37. |
[6] | Braune S , Groß M , Walter M , Zhou S , Dietze S , Rutschow S , Lendlein A , Tschöpe C , Jung F . Adhesion and activation of platelets from subjects with coronary artery disease and apparently healthy individuals on biomaterials. J Biomed Mater Res B Appl Biomater. (2016) ;104: (1):210–7. |
[7] | Di Minno A , Ambrosino P , Calcaterra I , Di Minno MND . COVID-19 and Venous Thromboembolism: A Meta-analysis of Literature Studies. Semin Thromb Hemost. (2020) ;46: (7):763–71. doi: 10.1055/s-0040-1715456 |
[8] | Frederikus AK , Menno VH . How I assess and manage the risk of bleeding in patients treated for venous thromboembolism. Clinical Trials & Observations, ood. (2020) ;135: (10):724–34. |
[9] | Kearon C , Akl EA , Ornelas J , et al. Antithrombotic therapy for VTE disease: CHEST Guideline and Expert Panel Report. Chest. (2016) ;149: (2):315–52. |
[10] | Konstantinides SV , Meyer G , Becattini C , et al. The Task Force for the diagnosis and management of acute pulmonary embolism of the European Society of Cardiology (ESC). 2019 ESC Guidelines for the diagnosis and management of acute pulmonary embolism developed in collaboration with the European Respiratory Society (ERS): The Task Force for the diagnosis and management of acute pulmonary embolism of the European Society of Cardiology (ESC). Eur Respir J. (2019) ;54: (3):2019. |
[11] | Andres O , Henning K , Strauss G , Pflug A , Manukjan G , Schulze H . Diagnosis of platelet function disorders: A standardized, rational, and modular flow cytometric approach. Platelets. (2018) ;29: (4):347–56. |
[12] | Begent NA , Born GV . Quantitative investigation of intravascular platelet aggregation. J Physiol. (1970) ;210: (1):40P–41P. |
[13] | Jennings I , Woods TA , Kitchen S , Walker ID . Platelet function testing: practice among UK National External Quality Assessment Scheme for Blood Coagulation participants, 2006. Journal of clinical pathology. (2008) ;61: (8):950–4. |
[14] | Cattaneo M . Light transmission aggregometry and ATP release for the diagnostic assessment of platelet function. Seminars in Thrombosis and Hemostasis. (2009) ;35: (2):158–67. |
[15] | Park SJ , Yoon J , Seo HS , Lim CS . Performance evaluation of the Anysis-200 platelet function analyzer in cardiac patients. Clin Hemorheol Microcirc. 2020. doi: 10.3233/CH-190801 |
[16] | Chung YH , Lee KA , Cho M , Shin S , Lee BK . Performance comparison of platelet function analyzers in cardiology patients: Verify Now and Anysis-200 aspirin assays, Clinical Hemorheology and Microcirculation. (2021) ;76: (1):33–42. |
[17] | Piao JX , Yoo CY , Kim SY , Whang Y-W , Shin S , Choi CU . Assessment of therapeutic platelet inhibition in cardiac patients: Comparative study between VerifyNow-P2Y12 and Anysis-P2Y12 assay, Clinical Hemorheology and Microcirculation, Accepted. |
[18] | Song SH , Lim CS , Shin S . Migration distance-based platelet function analysis in a microfluidic system. Biomicrofluidics. (2013) ;7: (6):64101. |
[19] | Song SH , Lim CS , Shin S . Scalable evaluation of platelet aggregation by the degree of blood migration. Appl Phys Lett. (2013) ;103: :243702. |
[20] | Lee H , Kim G , Lim C , Lee B , Shin S . A simple method for activating the platelets used in microfluidic platelet aggregation tests: stirring-induced platelet activation. Biomicrofluidics. (2016) ;10: :064118. doi: 10.1063/1.4972077 |
[21] | Xu S , Piao J , Lee BK , Lim CS , Shin S . Platelet thrombus formation by upstream activation and downstream adhesion of platelets in a microfluidic system. Biosensors and Bioelectronics. (2020) ;165: :112395. |
[22] | McHugh ML . Interrater reliability: the kappa statistic. Biochemia medica. (2012) ;22: (3):276–82. |
[23] | Janssen P , Bergmeijer T , Godschalk T , Le T , Breet N , Kelder JC , et al. The effect of correcting VerifyNow P2Y12 assay results for hematocrit in patients undergoing percutaneous coronary interventions. J Thromb Haemost. (2017) ;15: :618–23. |
[24] | Casa LDC , Ku DN . Geometric design of microfluidic chambers: Platelet adhesion versus accumulation. Biomedical Microdevices. (2014) ;16: :115–26. doi: 10.1007/s10544-013-9811-7 |
[25] | Born GV . Aggregation of blood platelets by adenosine diphosphate and its reversal. Nature. (1962) ;194: :927–929. |
[26] | Xu S , Piao J , Lee BK , Lim CS , Shin S . Platelet thrombus formation by upstream activation and downstream adhesion of platelets in a microfluidic system. Biosensors and Bioelectronics. (2020) ;165: :112395. |
[27] | Harrison P , Mackie I , Mumford A , Briggs C , Liesner R , Winter M , Machin S . Guidelines for the laboratory investigation of heritable disorders of platelet function. British Journal of Haematology. (2011) ;155: :30–44. doi: org/10.1111/j.1365-2141.2011.08793 |
[28] | Le Blanc J , Mullier F , Vayne C , Lordkipanidzé M . Advances in Platelet Function Testing—Light Transmission Aggregometry and Beyond. J Clin Med. (2020) ;9: :2636. |
[29] | Sun P , McMillan-Ward E , Mian R , Israels SJ . Comparison of light transmission aggregometry and multiple electrode aggregometry for the evaluation of patients with mucocutaneous bleeding. Int J Lab Hematol. (2019) ;41: :133–40. |
[30] | Piao J , Yoo C , Kim SY , Whang YW , Choi CU , Shin S . Performance comparison of aspirin assay between anysis and verifynow: Assessment of therapeutic platelet inhibition in patients with cardiac diseases, Clinical Hemorheology and Microcirculation. 2021; DOI: 10.3233/CH-211171 |
[31] | Piao J , Yoo C , Kim SY , Whang YW , Choi CU , Shin S . Assessment of therapeutic platelet inhibition in cardiac patients: Comparative study betweenVerify Now-P2Y12 and Anysis-P2Y12 assay, Clinical Hemorheology and Microcirculation. 2021; DOI: 10.3233/CH-211104. |
[32] | Power M , Fell G , Wright M . Principles for high-quality, high-value testing. BMJ Evidence-Based Medicine. (2013) ;18: (1):5–10. |
[33] | Fischer JE , Bachmann LM , Jaeschke R . A readers’ guide to the interpretation of diagnostic test properties: clinical example of sepsis. Intensive Care Medicine. (2003) ;29: (7):1043–1051. |


