
Herd immunity or suppression strategy to combat COVID-19
Abstract
Some months ago, severe acute respiratory syndrome coronavirus 2 (SARS-CoV-2) broke out in Wuhan, China, and spread rapidly around the world. Some states, such as the Netherlands, Germany, Great Britain, Sweden and the USA initially focused on keeping the restrictions for economy and society as low as possible. The responsible authorities were of the opinion - and still are e.g. in Sweden - that it is sufficient enough to protect particularly vulnerable persons such as the elderly or people with pre-existing conditions. The idea behind this is that as soon as 60 to 70 percent of the population is infected with a pathogen, a so-called “herd immunity” has developed. However, the increasing numbers of deaths and modelling studies showed the expected overload of the hospitals. Therefore, most countries decided for a temporary lockdown with the exception of Sweden.
Based on the number of the total population, three times more people died from COVID-19 in Sweden (2679 deaths per 10 million inhabitants) compared to Germany (6848 deaths per 80 million inhabitants). The comparison Sweden versus Taiwan is even worse because 1072 times more people died in Sweden based on the number of the population (6 deaths per 24 million inhabitants).
In the face of the lack of an antiviral treatment and the lack of a protective vaccine one must state Taiwan has made the best out of the pandemic situation whereas Sweden failed completely.
Each state is currently pursuing its own strategies to cope with the SARS-CoV-2 pandemic that started in December 2019 in Wuhan, China. On January 21, the first imported case appeared in the USA and on January 24, SARS-CoV-2 emerged globally in many other countries including Europe where first cases were reported from France [1–4]. Some states, such as the Netherlands, Germany, Great Britain, Sweden and the USA initially focused on keeping the restrictions for economy and society as low as possible. Mass gatherings were initially neither prohibited nor were there strict regulations on social distancing or hygiene rules. The responsible authorities were of the opinion - and still are e.g. in Sweden - that it is sufficient enough to protect particularly vulnerable persons such as the elderly or people with pre-existing conditions. For the rest of the population, infection with the virus is certainly accepted, and even sought. The idea behind this is that as soon as 60 to 70 percent of the population is infected with a pathogen, a so-called “herd immunity” has developed. The procedure was as follows: The virus was to be suppressed only by gradual measures so that enough people could become infected. The strategy was an attempt to build up herd immunity so that “enough of us who will only show mild symptoms can become immune”. This was the statement of Sir P. Vallance, the British governments’ chief scientific adviser on March 13, 2020. However, after modelling studies of the epidemic by Imperial College London showed the expected overload of the hospitals. As a consequence, the British government abruptly changed the strategy 16 March 16 and decided for a temporary lockdown. The Netherlands and Germany also left herd immunity strategy to cope COVID-19. Figure 1 shows the clear reaction of the lockdown for Germany: the new infections per day in relation to the population of the respective country were continuously and significantly decreasing.
Fig.1
Daily SARS-COV-2 infections per respective number of inhabitants for Sweden (blue line), Germany (grey line) and Taiwan (orange line) Data were obtained from the following source: ECDC (https://www.ecdc.europa.eu/en/publications-data/download-todays-data-geographic-distribution-covid-19-cases-worldwide). The data obtained from the above listed sources is put in to a context described herein with. Our policy regarding the information format is prioritizing Open Source and Free Software. We therefore make all data retrieved and analyzed hereby available at corona.milliways.online.
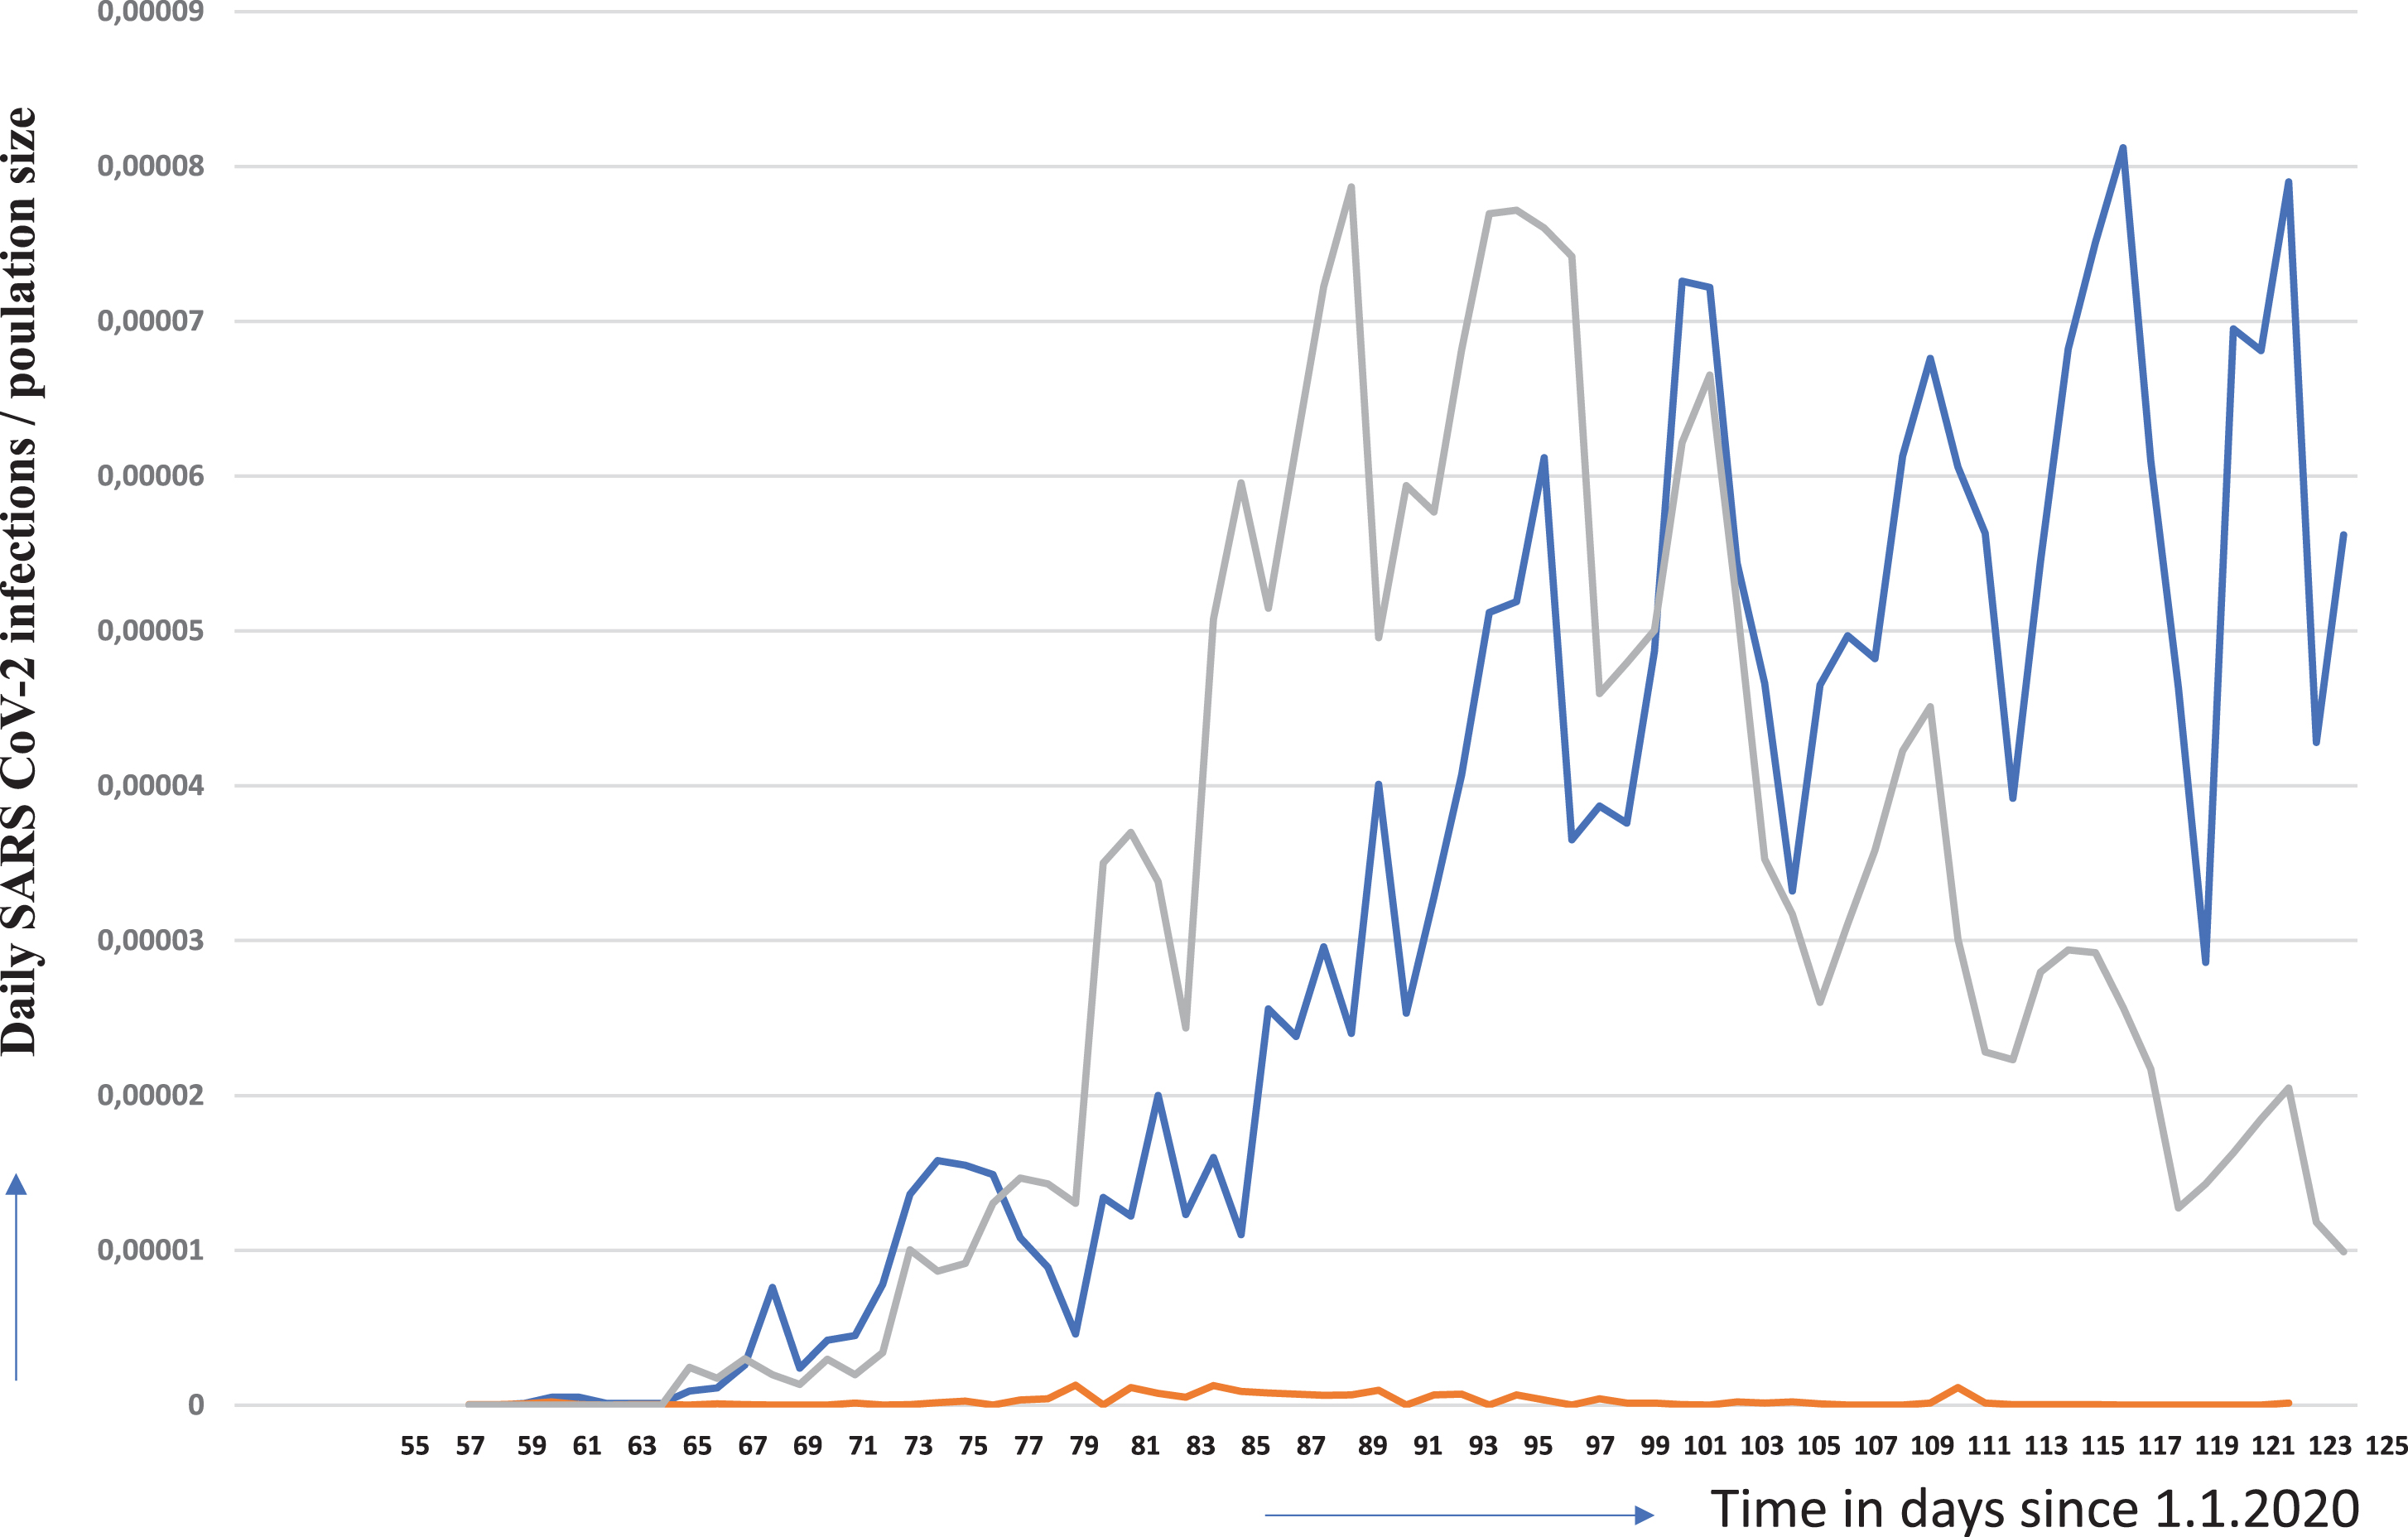
Sweden followed a strategy that is almost equivalent to the herd immunity. Restaurants, shops and fitness studios are also open. Border closures have not taken place. Only secondary schools and universities have been closed. Older people are advised to avoid social contacts. Those who feel symptoms of a possible Covid-19 disease should be placed in home quarantine.
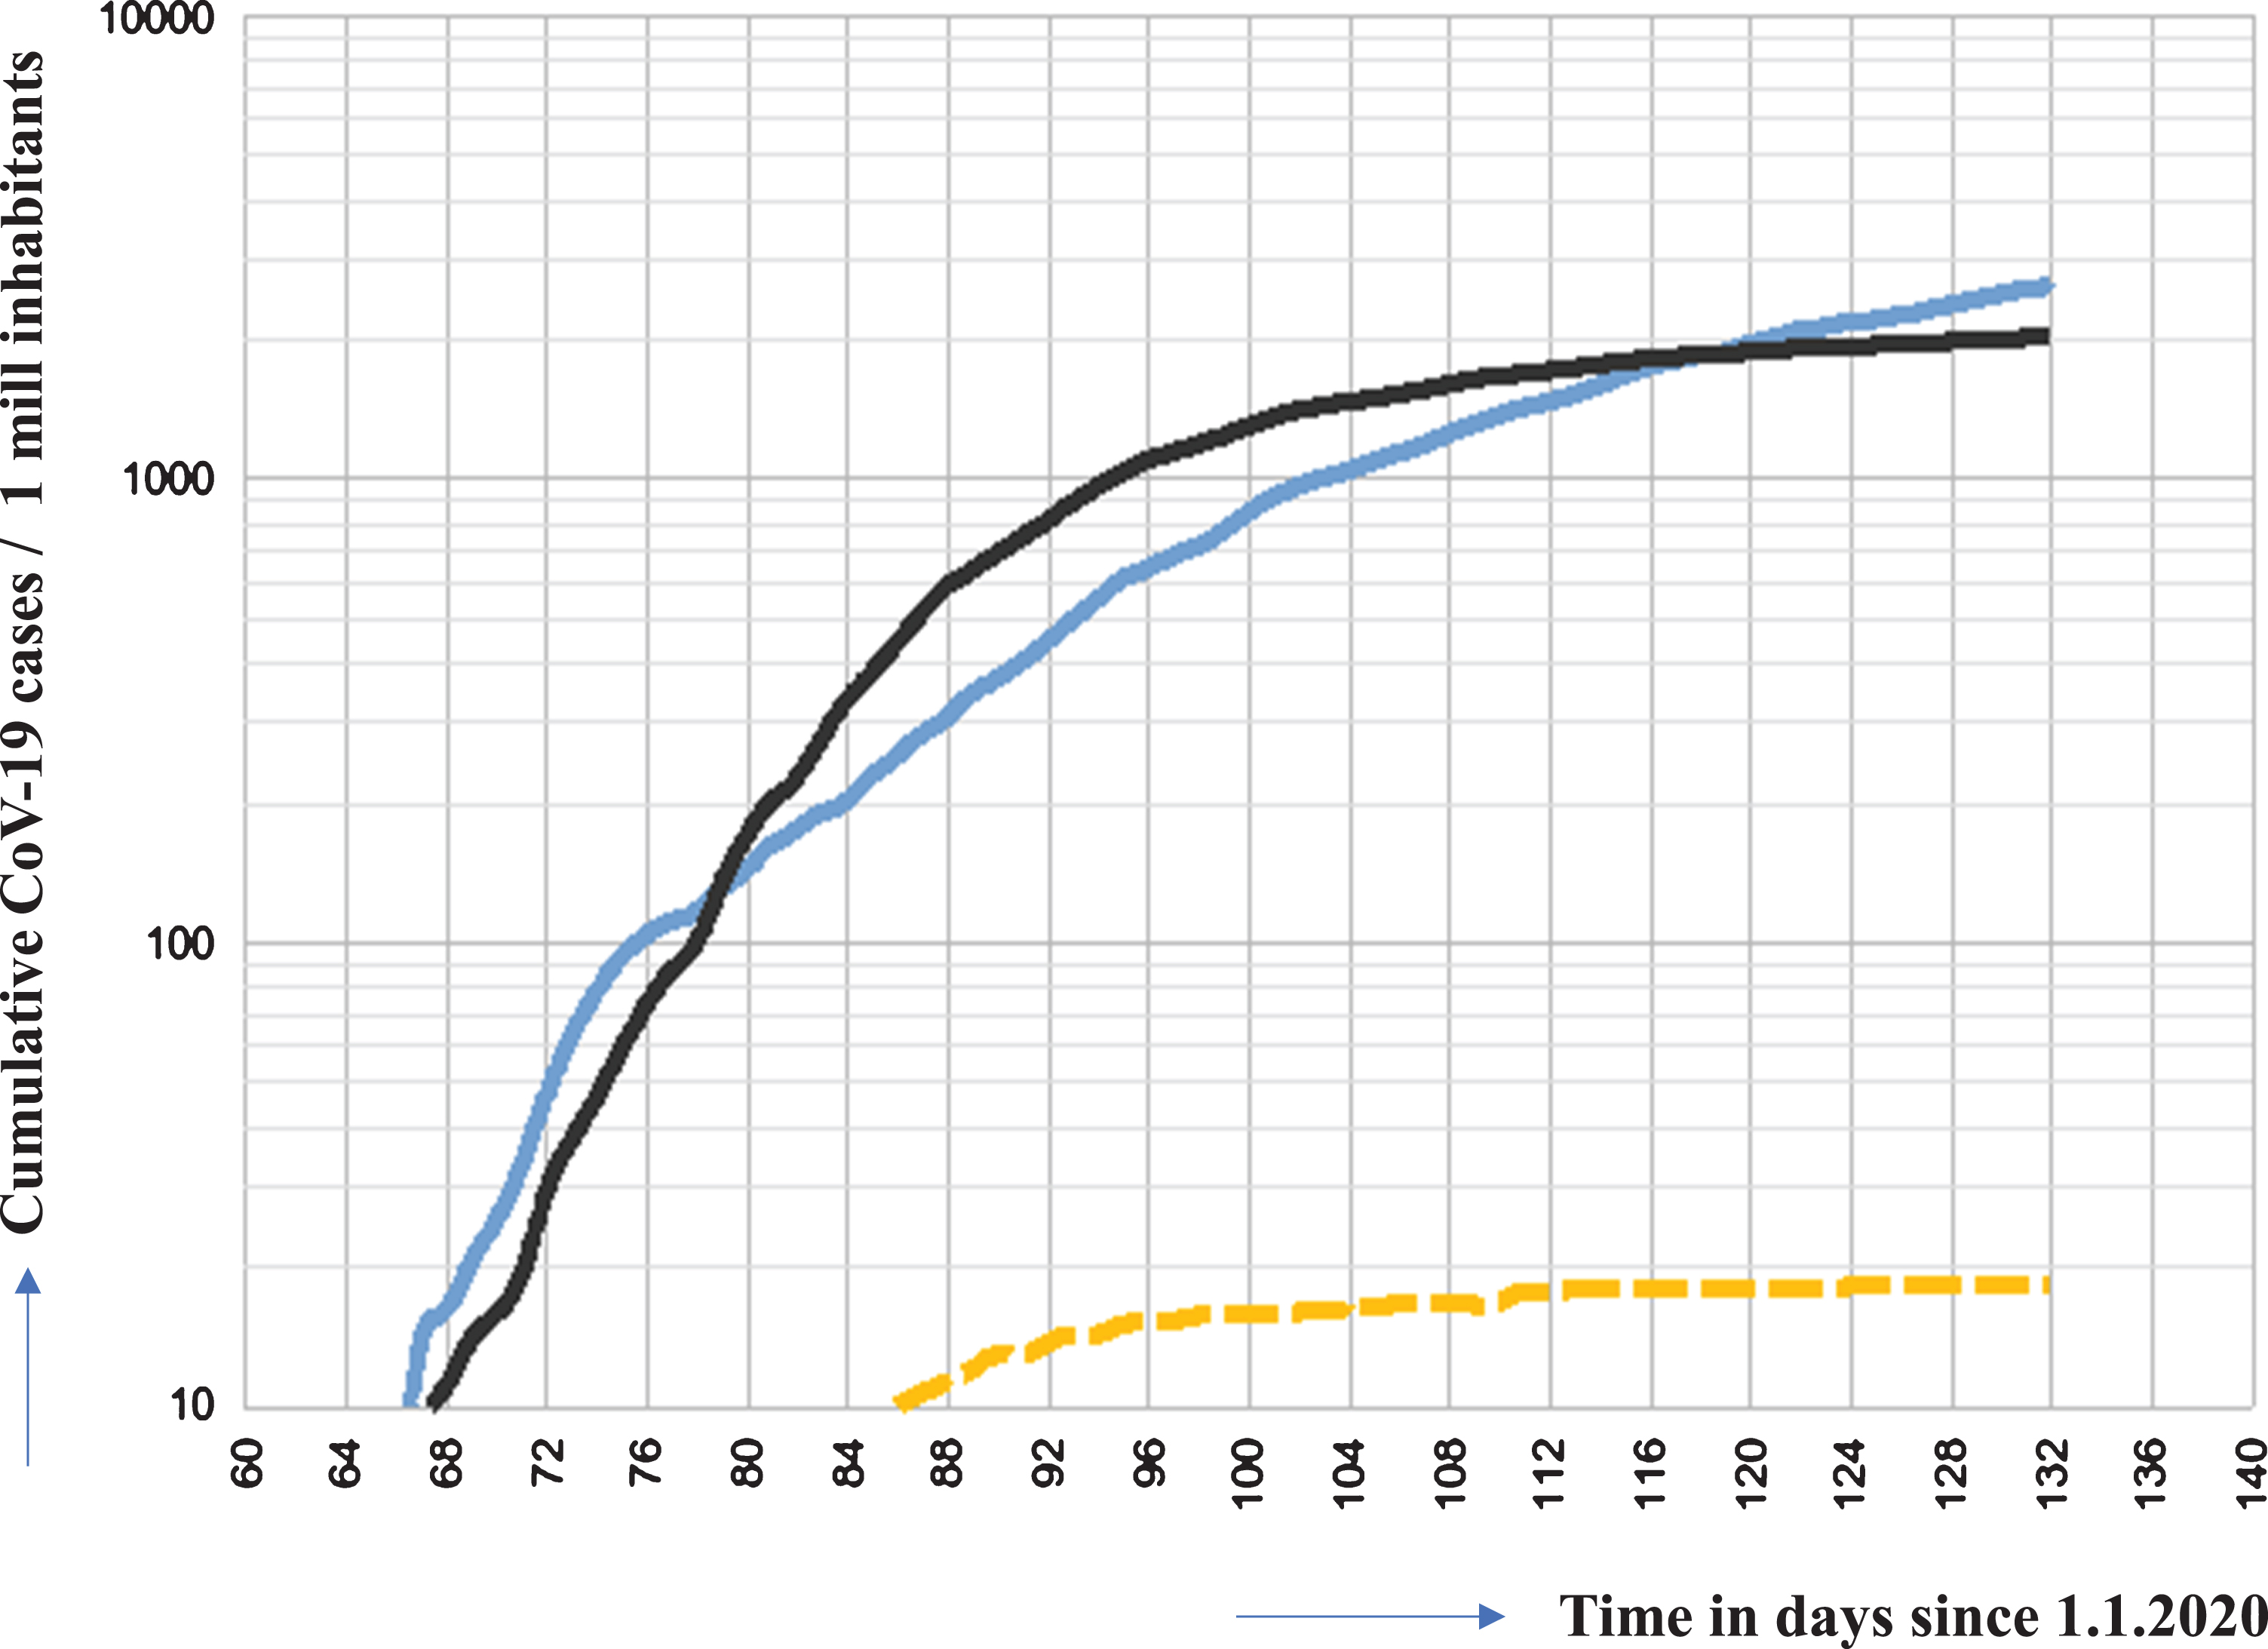
This figure clearly shows two findings. The course of the pandemic and the spread of the virus in those countries from day 56 (2020/25/2) until day 124 (2020/5/3). The course of the SARS-COV-2 pandemic in Sweden could be interpreted that a plateau has been reached. However, the further development of the situation remains to be elucidated. In any case, the Swedish health authority Folkhälsomyndigheten was wrong when it reported that most new cases occurred on April 15. That was when the curve had reached its highest point. The further course of the curve indicates an ongoing increase, although the dynamic has slowed down. However, it is possible that a plateau-phase has been reached. In contrast, the cumulative graph of daily infections is still increasing in Sweden while in Germany almost, and more importantly in Taiwan, a plateau seems to be reached since many days (see Fig. 2).
Fig.2
Cumulative case numbers of infections in Sweden (blue line), Germany (black line) and Taiwan (orange line) in relation to 1 Mill people Data were obtained from the following source: ECDC (https://www.ecdc.europa.eu/en/publications-data/download-todays-data-geographic-distribution-covid-19-cases-worldwide). The data obtained from the above listed sources is put in to a context described herein with. Our policy regarding the information format is prioritizing Open Source and Free Software. We therefore make all data retrieved and analyzed hereby available at corona.milliways.online.
Swedens’ advantages in fighting the pandemic are the high proportion of single households in large cities, the sparse population outside the conurbations around Stockholm (more than a third of those infected and more than half of those dying of Covid-19 are from the Stockholm area), Gothenburg and Malmö, and the generally high level of prosperity.
Based on the number of the total population, three times more people died from COVID-19 in Sweden (2679 deaths per 10 million inhabitants) compared to Germany (6848 deaths per 80 million inhabitants). The comparison Sweden versus Taiwan is even worse because 1072 times more people died in Sweden based on the number of the population (6 deaths per 24 million inhabitants).
The rise in the curve of normalized mortality rates for Sweden is still much steeper than for Germany (see Fig. 3), so that the mortality rate is likely to drift even further apart (unless Sweden takes significant countermeasures).
Fig.3
Cumulative deaths of SARS COV-2 infected patients in Germany, Sweden (blue line), Germany (black line) and Taiwan (until day 134 (2020/05/13) 6 cases. Cannot be shown in this representation. Data points lie almost on the x-axis). Data were obtained from the following source: ECDC (https://www.ecdc.europa.eu/en/publications-data/download-todays-data-geographic-distribution-covid-19-cases-worldwide). The data obtained from the above listed sources is put in to a context described herein with. Our policy regarding the information format is prioritizing Open Source and Free Software. We therefore make all data retrieved and analyzed hereby available at corona.milliways.online.
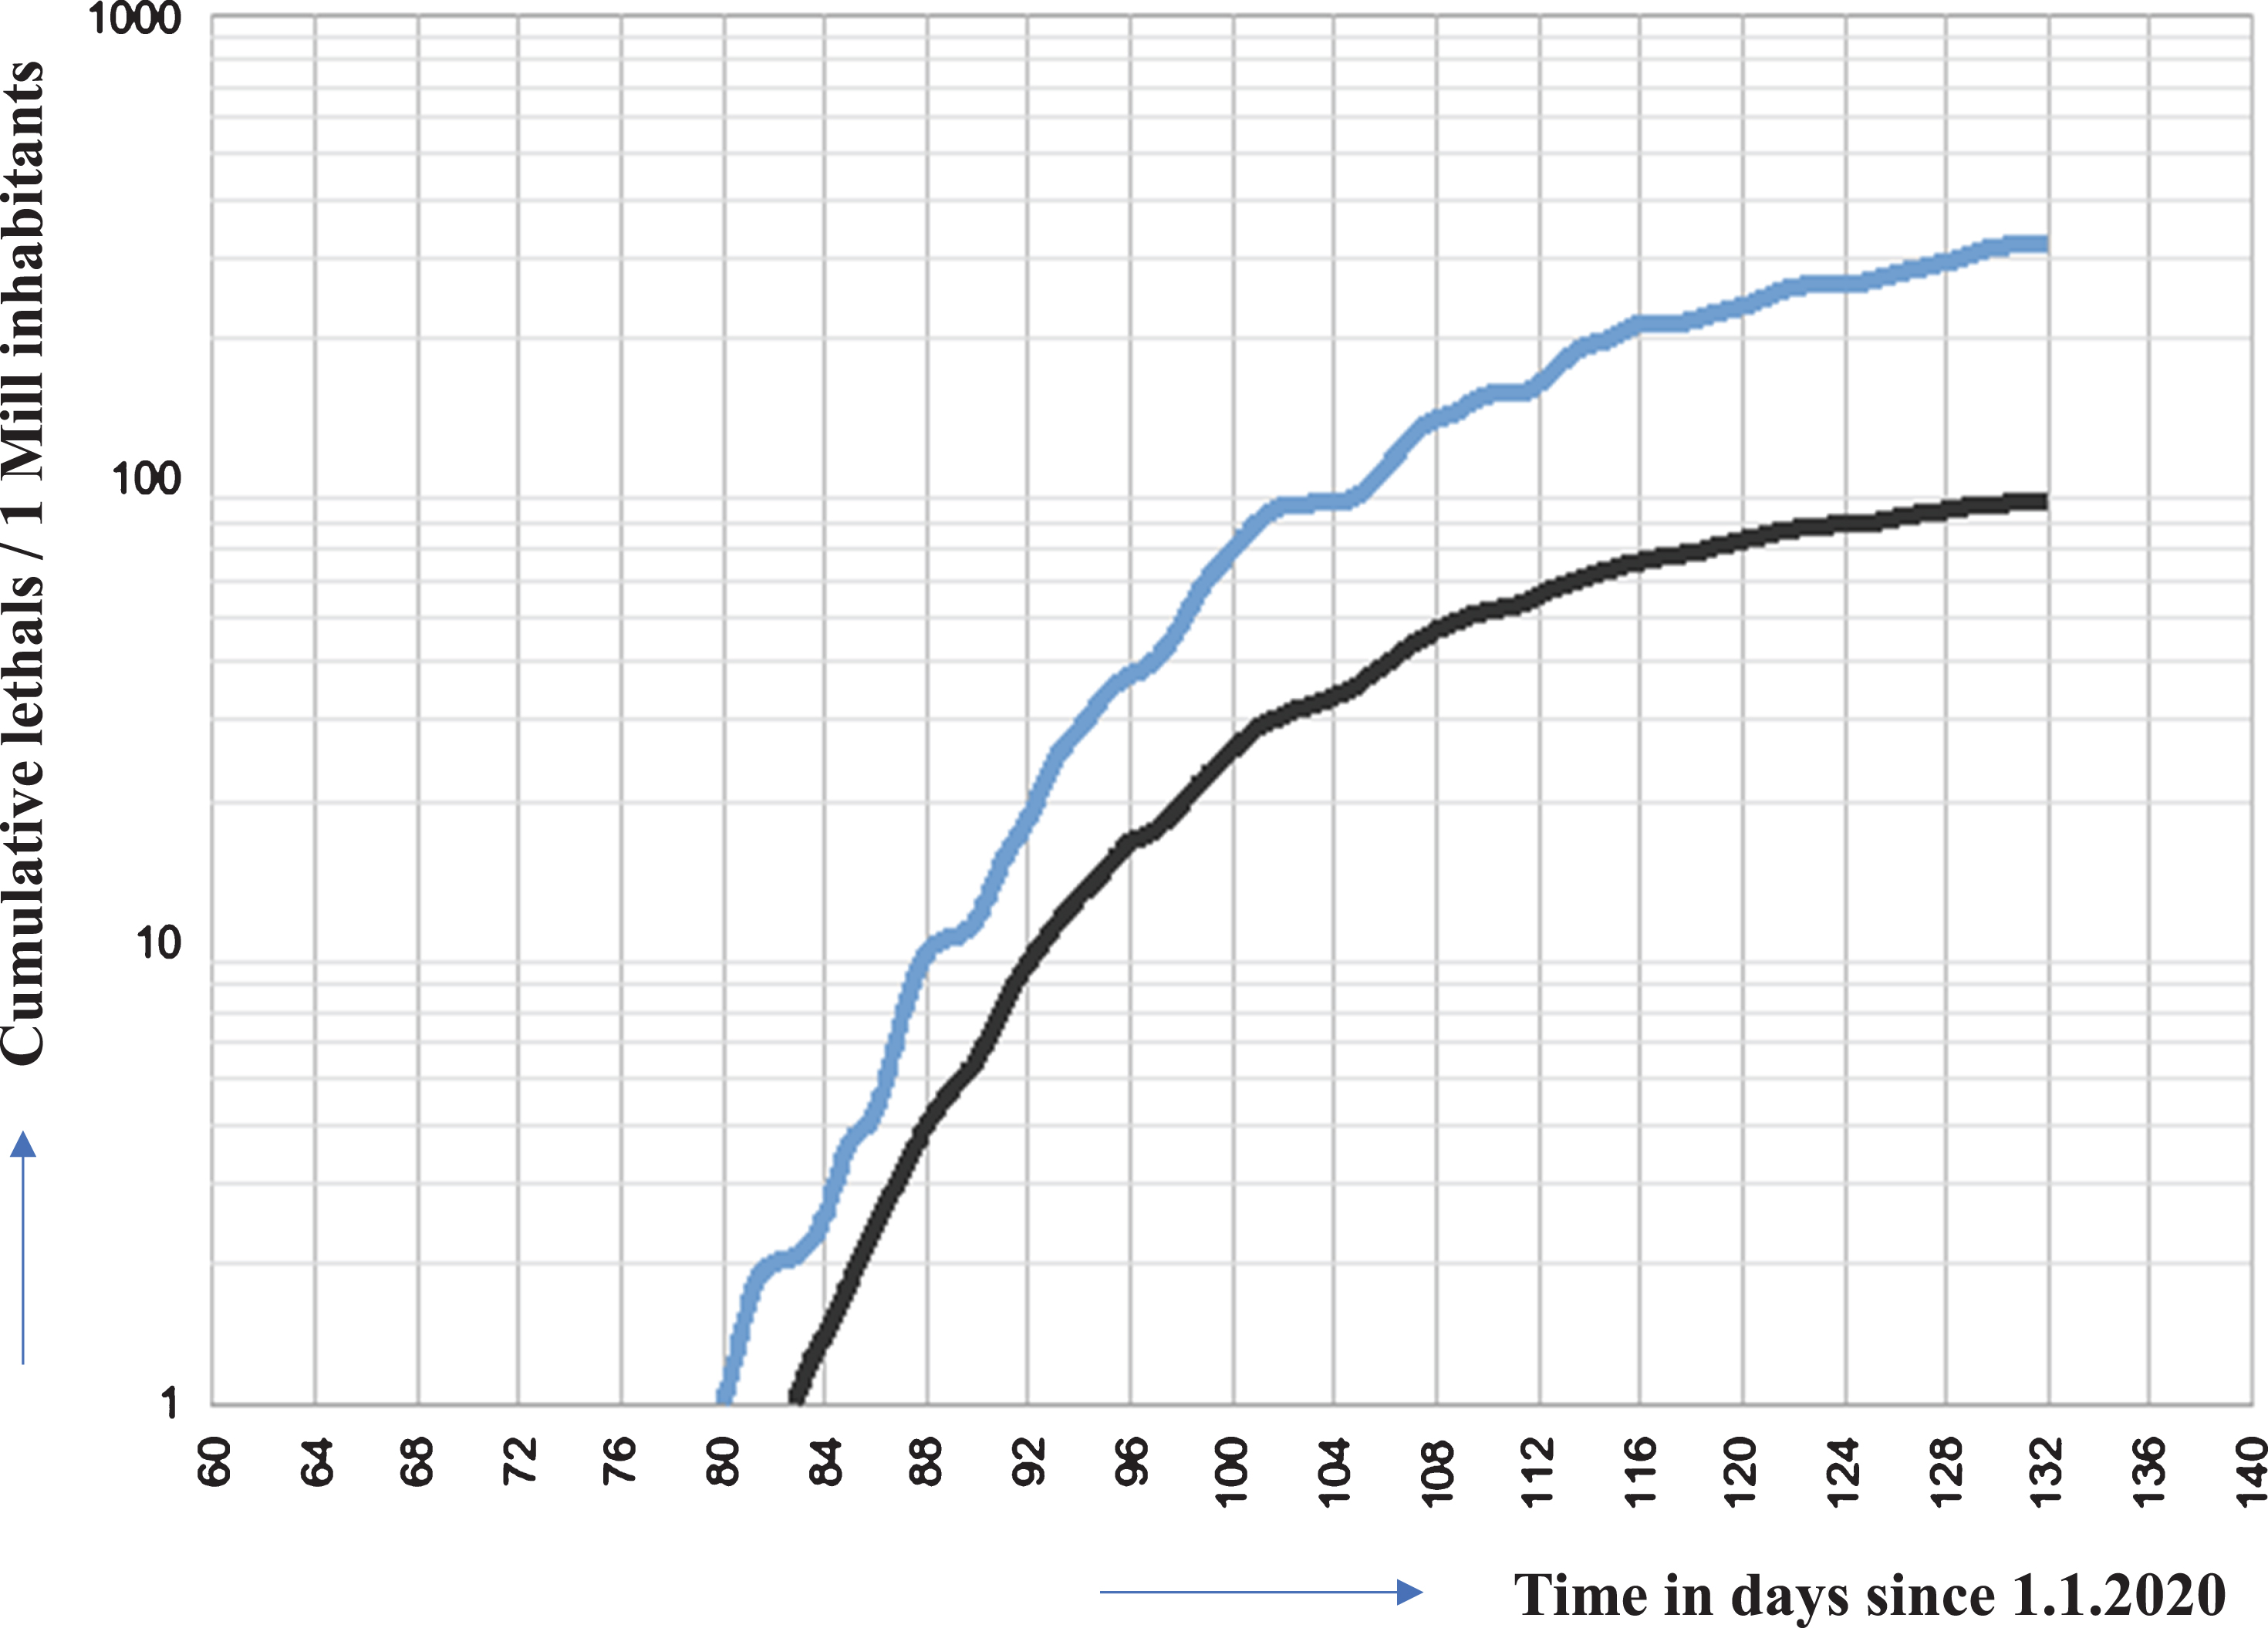
This shows how effective the rigorous implementation of protective measures in Taiwan has been in preventing both infection and death. Unlike the European countries, Taiwan reacted very early [4]; “Following the SARS experience of 2003, a National Health Command Centre (NHCC) was established with the Central Epidemic Command Centre (CECC) as the central coordinating body. The CECC has rapidly produced and implemented a list of at least 124 action items including border control from the air and sea, case identification (using new data and technology), quarantine of suspicious cases, proactive case finding, resource allocation (assessing and managing capacity), reassurance and education of the public while fighting misinformation, negotiation with other countries and regions, formulation of policies toward schools and childcare, and relief to businesses [5]. These measures were so effective that only 6 patients died from a total of 397 confirmed infections in a population of more than 24 million people.”
It is currently unclear how long immunity lasts after SARS-COV-2 infection. There are four other corona viruses circulating in the world population causing common cold, pneumonia and bronchitis. However, not much is known about cross protection. Antibodies to SARS-CoV-1 have been described to be detected up to 2 years after infection, this might render people to be susceptible again for reinfection after three years [6]. A time-limited SARS-CoV-2 immunity would make it necessary that reinfection occurs to keep up herd immunity and the infestation of a country may take even longer than individual immunity. However, there are no data on the clinical course of re-infected people and the impact T-cell immunity to prevent severe clinical outcome.
In the face of the lack of an antiviral treatment and the lack of a protective vaccine one must state Taiwan has made the best out of the pandemic situation whereas Sweden failed completely.
A lot of patients who survived the severe COVID-19 are suffering from severe sequelae especially after multiple thrombotic processes in the vascular system [7] involving lung, liver, spleen and kidney [8–10] and other organs. Today, prevention is the only and best tool we have to prevent severe COVID-19 cases and unnecessary late sequelae or deaths. The motto must be prevention first, since we all have only one life.
A recent simulation study by the universities of Uppsala and Stockhom [11] illustrated, that if the current measures will be continued (day101), 100,000 people in Sweden would die of corona virus. If social distancing were to be implemented consistently, the study shows that the figure would be just over 20,000.
References
[1] | Kinross P , Suetens C , Gomes Dias J , et al. Rapidly increasing cumulative incidence of coronavirus disease (COVID-19) in the European Union/European Economic Area and the United Kingdom, 1 January to 15 March 2020. Euro Surveill. (2020) ;25. |
[2] | Bernard Stoecklin S , Rolland P , Silue Y , et al. First cases of coronavirus disease 2019 (COVID-19) in France: surveillance, investigations and control measures, January 2020. Euro Surveill. (2020) ;25. |
[3] | Johnson HC , Gossner CM , Colzani E , et al. Potential scenarios for the progression of a COVID-19 epidemic in the European Union and the European Economic Area, March 2020. Euro Surveill. (2020) ;25. |
[4] | Jung F , Krieger V , Hufert FT , Küpper J-H . How we should respond to the Coronavirus SARS-CoV-2 outbreak: A German perspective. Clin Hemorheol Microcirc. (2020) ; DOI: 10.3233/CH-170277 |
[5] | Wang CJ , Ng CY , Brook RH . Response to COVID-19 in Taiwan. Big Data Analytics, New Technology, and Proactive Testing. JAMA. (2020) ;323: (14):1341–1342. |
[6] | Wu L-P , Wang N-C , Chang Y-H , Tian X-Y , Na D-Y , Li-Zhang Y , Zheng L , Lan T , Wang L-F , Liang G-D . Duration of Antibody Responses after Severe Acute Respiratory Syndrome. Emerging Infectious Diseases. (2007) ;13: :1562–1564. |
[7] | Spiezia L , Boscolo A , Poletto F , et al. COVID-19-related severe hypercoagulability in patients admitted to intensive care unit for acute respiratory failure. Thromb Haemost. (2020) . |
[8] | Jung EM , Stroszczinski C , Jung F . Contrast enhanced ultrasonography (CEUS)1to detect abdominal microcirculatory2disorders in severe cases of COVID-193infection: First experience. Clin Hemorheol Microcirc. (2020) . DOI: 10.3233/CH-209003 |
[9] | Borgel D , Bianchini E , Lasne D , Pascreau T , Saller F . Inflammation in deep vein thrombosis: a therapeutic target? Hematology. (2019) ;24: (1):742–750. |
[10] | Barco S , Russo M , Vicaut E , Becattini C , Bertoletti L , Beyer-Westendorf J , Bouvaist H , Couturaud F , Danays T , Dellas C , Duerschmied D , Empen K , Ferrari E , Galiè N , Jiménez D , Klok FA , Kostrubiec M , Kozak M , Kupatt C , Lang IM , Lankeit M , Meneveau N , Palazzini M , Pruszczyk P , Rugolotto M , Salvi A , Sanchez O , Schellong S , Sobkowicz B , Meyer G , Konstantinides SV . Incomplete echocardiographic recovery at 6 months predicts long-term sequelae after intermediate-risk pulmonary embolism. A post-hoc analysis of the Pulmonary Embolism Thrombolysis (PEITHO) trial. Clin Res Cardiol. (2019) ;108: (7):772–778. |
[11] | Gardner JM , Willem L , van der Wijngaart W , Kamerlin SCL , Brusselaers N , Kasson P . Intervention strategies against COVID-19 and their estimated impact on Swedish healthcare capacity. MedRxiv, doi: 10.1101/2020.04.11.20062133 |


