
Pilot clinical study of quantitative ultrasound spectroscopy measurements of erythrocyte aggregation within superficial veins
Abstract
BACKGROUND:
An enhanced inflammatory response is a trigger to the production of blood macromolecules involved in abnormally high levels of erythrocyte aggregation.
OBJECTIVE:
This study aimed at demonstrating for the first time the clinical feasibility of a non-invasive ultrasound-based erythrocyte aggregation quantitative measurement method for potential application in critical care medicine.
METHODS:
Erythrocyte aggregation was evaluated using modeling of the backscatter coefficient with the Structure Factor Size and Attenuation Estimator (SFSAE). SFSAE spectral parameters W (packing factor) and D (mean aggregate diameter) were measured within the antebrachial vein of the forearm and tibial vein of the leg in 50 healthy participants at natural flow and reduced flow controlled by a pressurized bracelet. Blood samples were also collected to measure erythrocyte aggregation ex vivo with an erythroaggregometer (parameter S10).
RESULTS:
W and D in vivo measurements were positively correlated with the ex vivo S10 index for both measurement sites and shear rates (correlations between 0.35–0.81, p < 0.05). Measurement at low shear rate was found to increase the sensitivity and reliability of this non-invasive measurement method.
CONCLUSIONS:
We behold that the SFSAE method presents systemic measures of the erythrocyte aggregation level, since results on upper and lower limbs were highly correlated.
1Introduction
Since there is no clinical way to monitor acute inflammation on the bedside, blood biomarkers (mainly cytokines and plasma proteins) remain the only available indicators of severe inflammation leading to possible hypotension and sepsis [1]. However, these biomarkers are not amenable to follow progression of the acute inflammatory response in critically ill patients due to the requirement of repeated blood sampling and delay in receiving these laboratory measures. There is thus a need for inflammation monitoring, as this condition may be reversed with appropriate timely treatment [2].
Inflammation modulates the level of red blood cell (RBC) aggregation. Erythrocytes, which naturally tend to form rouleaux-type structures, do form, however, more compact clump-type aggregates, whenever inflammatory plasma molecules and conditions affecting their cellular membrane’s properties are present [3–5]. It has long been demonstrated that ultrasound is sensitive to the presence of RBC aggregation and that the backscattered signal from flowing blood is enhanced with the aggregate size [6–9]. Quantitative ultrasound (QUS) methods are nowadays well known for their ability to provide non-invasive information on tissue microstructures [10]. Among QUS approaches, modeling of the backscatter coefficient with a spectral descriptor has been widely applied to various organ tissues. The structure factor size and attenuation estimator (SFSAE) was specifically developed to analyze a dense medium such as blood constituted by a high volume concentration of acoustic scatterers [11, 12]. An in vivo proof-of-concept using the SFSAE model of the backscatter coefficient was reported on diabetic patients with poor metabolic control [13]. Recently, Garcia-Duitama et al. [14] proposed a protocol to insure reproducibility of backscatter ultrasound measurements of RBC aggregation and demonstrated the need for controlling the venous flow to maintain a low shear rate condition.
In this study, we aimed at exploring different strategies that would be compatible with ultrasound measurements in critical care units. Measures were repeated to evaluate the robustness of proposed methods. Our hypothesis is that it is possible to acquire ultrasound data at the bedside using a bracelet positioned over the vein of interest to control the flow, and an ultrasound device and a post-processing computer algorithm to measure RBC aggregation based on the SFSAE model.
2Materials and methods
2.1Outlines
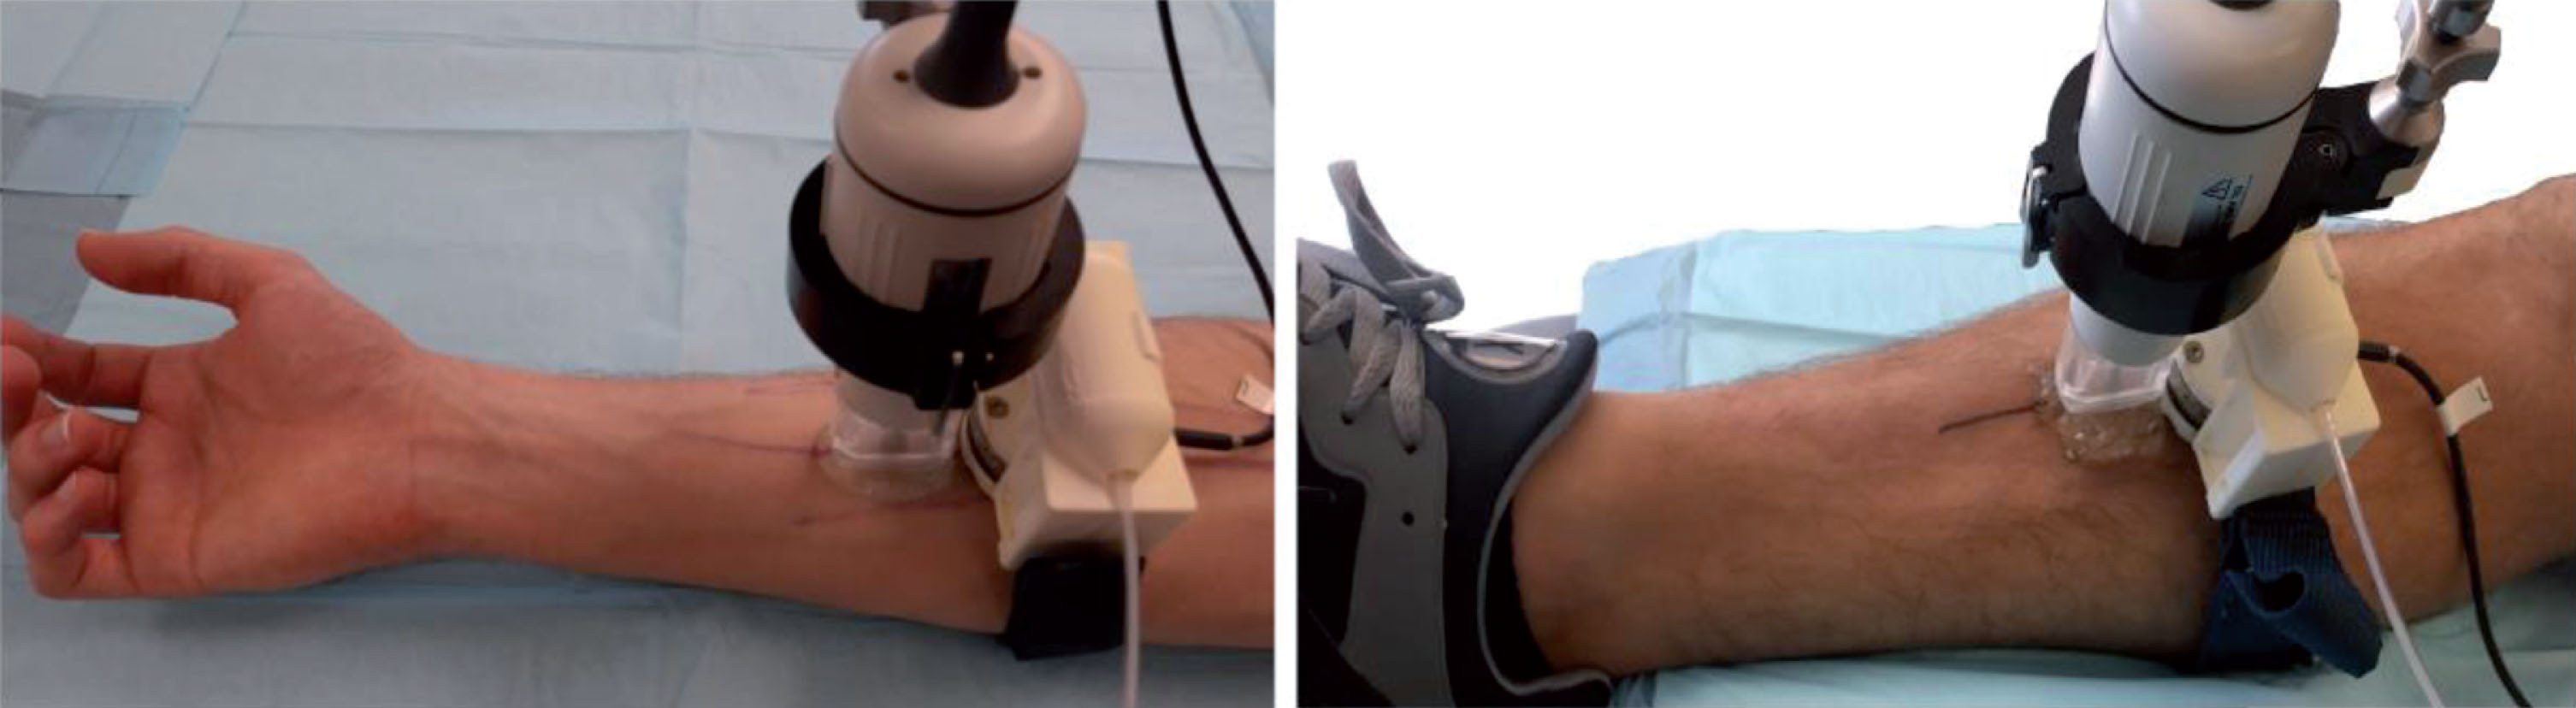
For this pilot clinical evaluation, healthy volunteers were selected and measurements were repeated to evaluate the intra-subject variability. A homemade bracelet to control the blood flow was designed (Fig. 1), and a computer platform to monitor measurements was developed. The monitoring system allows a user to visualize the B-mode ultrasound image of the vein and to record radiofrequency (RF) data. RF images are then processed using a particle image velocimetry algorithm to measure the maximum blood velocity so as to provide feedback to the user for adjusting the pressure applied by the bracelet over the vein to reduce the blood flow. Acquired RF data at a predetermined low shear rate and under natural flow were used to measure RBC aggregate structural parameters with the SFSAE algorithm. Measurements were performed on two vascular sites that would be accessible for patient monitoring.
2.2Subject recruitment and protocol
After approval by the Ethics Committee of the Centre Hospitalier de l’Université de Montréal (CHUM) and having obtained signed informed consents, fifty participants (25 men and 25 women) were enrolled in this pilot study. Men and women were aged 43.9±19.4 and 46.7±18.6 years old, and their body mass indices (BMI) were 24.3±4.4 and 25.1±3.1, respectively. This cohort involved European (43), Asian (4) and North-African ancestries (3) participants. Some of them self-reported having at least one of the following chronic disease conditions: type 2 diabetes (3), lupus (1), aortic aneurysm (1), high cholesterol (9) and hypertension (5). Participants were lying down on an exam bed and ultrasound data were acquired on the palmer side of the forearm on the antebrachial vein, and on the tibial vein on the front of the leg. Ultrasound acquisitions were performed with a high-frequency scanner (Vevo770, 35 MHz central frequency probe #RMV-703, Visualsonics, Toronto, Canada). For each measurement site, veins with a diameter larger than 1 mm were quested to facilitate ultrasound post-processing. After the ultrasound probe was set in place with a rigid stand, a B-mode image was acquired to measure the vein depth, which corresponds to the span between the skin surface and the closer vessel wall. The internal vein diameter was also measured in this manner before each assessment of RBC aggregation.
2.3Low shear rate acquisition procedure using the designed bracelet
As introduced earlier, a homemade pneumatic compression bracelet (Fig. 1) was designed to apply a smooth pressure on the skin over the vein for regulating the flow and reducing the shear rate into the blood vessel. This was based on Garcia-Duitama et al. experiments [14] that have shown that keeping a pre-measuring low residual venous shear rate enables reproducible in vivo RBC aggregation measurements. The bracelet was positioned 10 mm downstream to the ultrasound acquisition site. After positioning the ultrasound probe, the blood flow was initially stopped by inflating the pneumatic device and then released to validate that the bracelet could control the blood flow. The compression bracelet included an embedded load cell (mini40, ATI Industrial Automation, Apex NC., USA) allowing real-time measurement of the force applied on the skin. The load cell controller was calibrated and sent the applied force [in Newton] through a RS232 communication directly to a Matlab program (version 2014a, Natick, Ma, USA) every second. Five ultrasound measurements were made with and without the flow controlling bracelet to measure the intra-subject variability, so as to reach low shear rate and natural shear rate conditions, respectively. An infrared instrument was used prior to ultrasound probe and bracelet positioning to facilitate the identification of the venous architecture (model AV400, AccuVein, Huntington, NY, USA). With a non-permanent pen, the vasculature was mapped on the surface of the skin and a straight venous segment without major bifurcations within a distance of at least 40 mm was selected. When such a vein segment was not available (17 cases for the leg and one for the forearm), only measurements without bracelet were performed (i.e., natural flow).
Fig.1
Picture showing the load cell mounted on the pneumatic bracelet device, the venous architecture of the forearm and leg marked with ink, and the Visualsonics ultrasound probe RMV-703 positioned over the region of the measure.
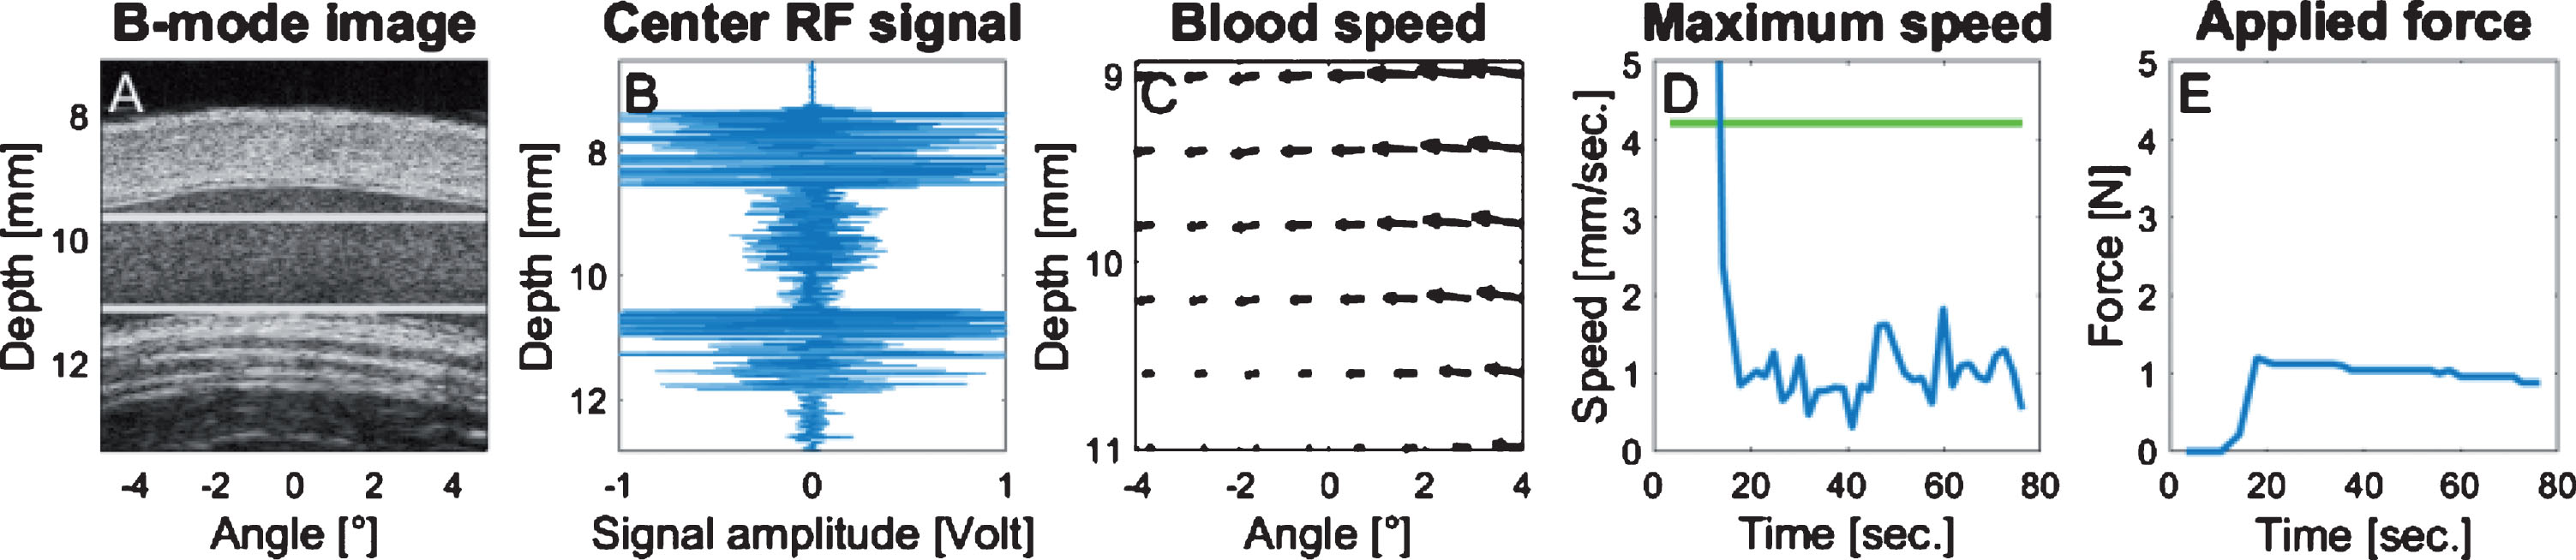
Acquired RF echoes were amplified (model 5900PR, Panametrics inc, Waltham, Ma, USA) and recorded using a 12-bit 250 MHz digitizer (GageScope 12501, Dynamic Signals LLC, Lockport, IL, USA) at a frame rate of 26 per second. A computer platform interface (Fig. 2), developed in Matlab, allowed monitoring the blood flow velocity within the vein (Fig. 2D), and the pressure applied by the bracelet (Fig. 2E). The blood flow velocity was computed using a particle image velocimetry (PIV) algorithm [15] applied on RF blood signals. The maximum velocity in the central portion of the vein (horizontal lines in Fig. 2A) was determined every second and used to manually control the pressure into the bracelet. The RF data quality control (Fig. 2B) displayed an A-line at the center of the B-mode image to validate that no saturation occurred in the blood signal (data clipping would affect the computation of the backscatter coefficient). The B-mode quality control (Fig. 2A) displayed the central position of the vein that was adjusted to match the transducer focus depth at 10 mm, thus ensuring an optimum signal-to-noise ratio.
Fig.2
Illustration of the control panel used during data acquisition. Each panel was automatically refreshed over time. (A) Longitudinal B-mode image of the vein; (B) acquired radiofrequency ultrasound data (depth versus normalized amplitude); (C) displacement map of the blood flow, the length of each vector corresponds to the instant displacement. The blood speed map region corresponds to the region delimited by the 2 white horizontal lines within the flow stream of panel A. (D) Maximum flow velocity within the blood speed map over time (in mm/s versus s), the green line corresponds to the threshold limit according to the vein diameter; (E) force applied by the bracelet and monitored by the force sensor over time (in Newton versus s).
During bracelet inflated pressure adjustment, the maximum blood velocity was monitored instead of the mean shear rate for convenience purpose. Indeed, instead of computing the shear rate from PIV data using the spatial derivative of the velocity field, which would require a real-time vessel wall segmentation to determine the vein boundary, it was determined experimentally that a low residual shear rate condition could be fulfilled if the maximum speed remained close to 1 mm/sec. This method was suitable for most participants, even those with very small venous flow. For every measurement, the bracelet pressure was gradually increased until the maximum blood velocity into the vein reached 1 mm/s (Fig. 2D). When the optimum pressure allowing the targeted maximum speed was attained (Fig. 2E), one minute was allowed prior to RF ultrasound data acquisition to ensure a stabilized RBC aggregation condition. Then, the bracelet pressure was released and one minute was left between every repeated acquisition.
2.4Natural shear rate measurements
Natural shear rate measurements were made after controlled flow acquisitions; whenever applicable, the ultrasound probe was left in place to maintain the same recording site within the vein. The protocol for natural flow acquisitions was the same as described above. The bracelet was deflated and left in place. A one minute waiting period was left between every repeated acquisition. Because the natural blood flow velocity produced PIV aliased measures (velocity too high considering the frame rate), the maximum blood velocity was assessed using pulsed Doppler ultrasound after the last acquisition of repeated measurements.
2.5Backscatter coefficient assessment and SFSAE modeling
Details on QUS SFSAE estimation can be found elsewhere [16]. A fourth-order Butterworth bandpass filter (15–37 MHz) was first applied on RF signals. Then, a region of interest (ROI) was manually delineated within the central region of the vein lumen (Fig. 3A). To avoid computing SFSAE values with RF data corresponding to the vessel wall, the segmentation was made to reject signals too close (less than 64 samples) to the vessel boundary. The ROI was then partitioned into resolution cells of 5 scanlines laterally, each comprising 128 samples axially with 50% overlap.
Fig.3
B-mode (A) and parametric images of D and W (B and C, respectively) computed for the segmented region (red boundaries in A) of the vessel lumen of patient ID number 29. D is the mean RBC aggregate diameter and W is the packing factor. Regions close to the vessel wall are intentionally not selected to compute the backscatter coefficient only for blood flow signals. Black areas in B and C correspond to missing information due to a poor correlation between the backscatter coefficient and the SFSAE spectral model.
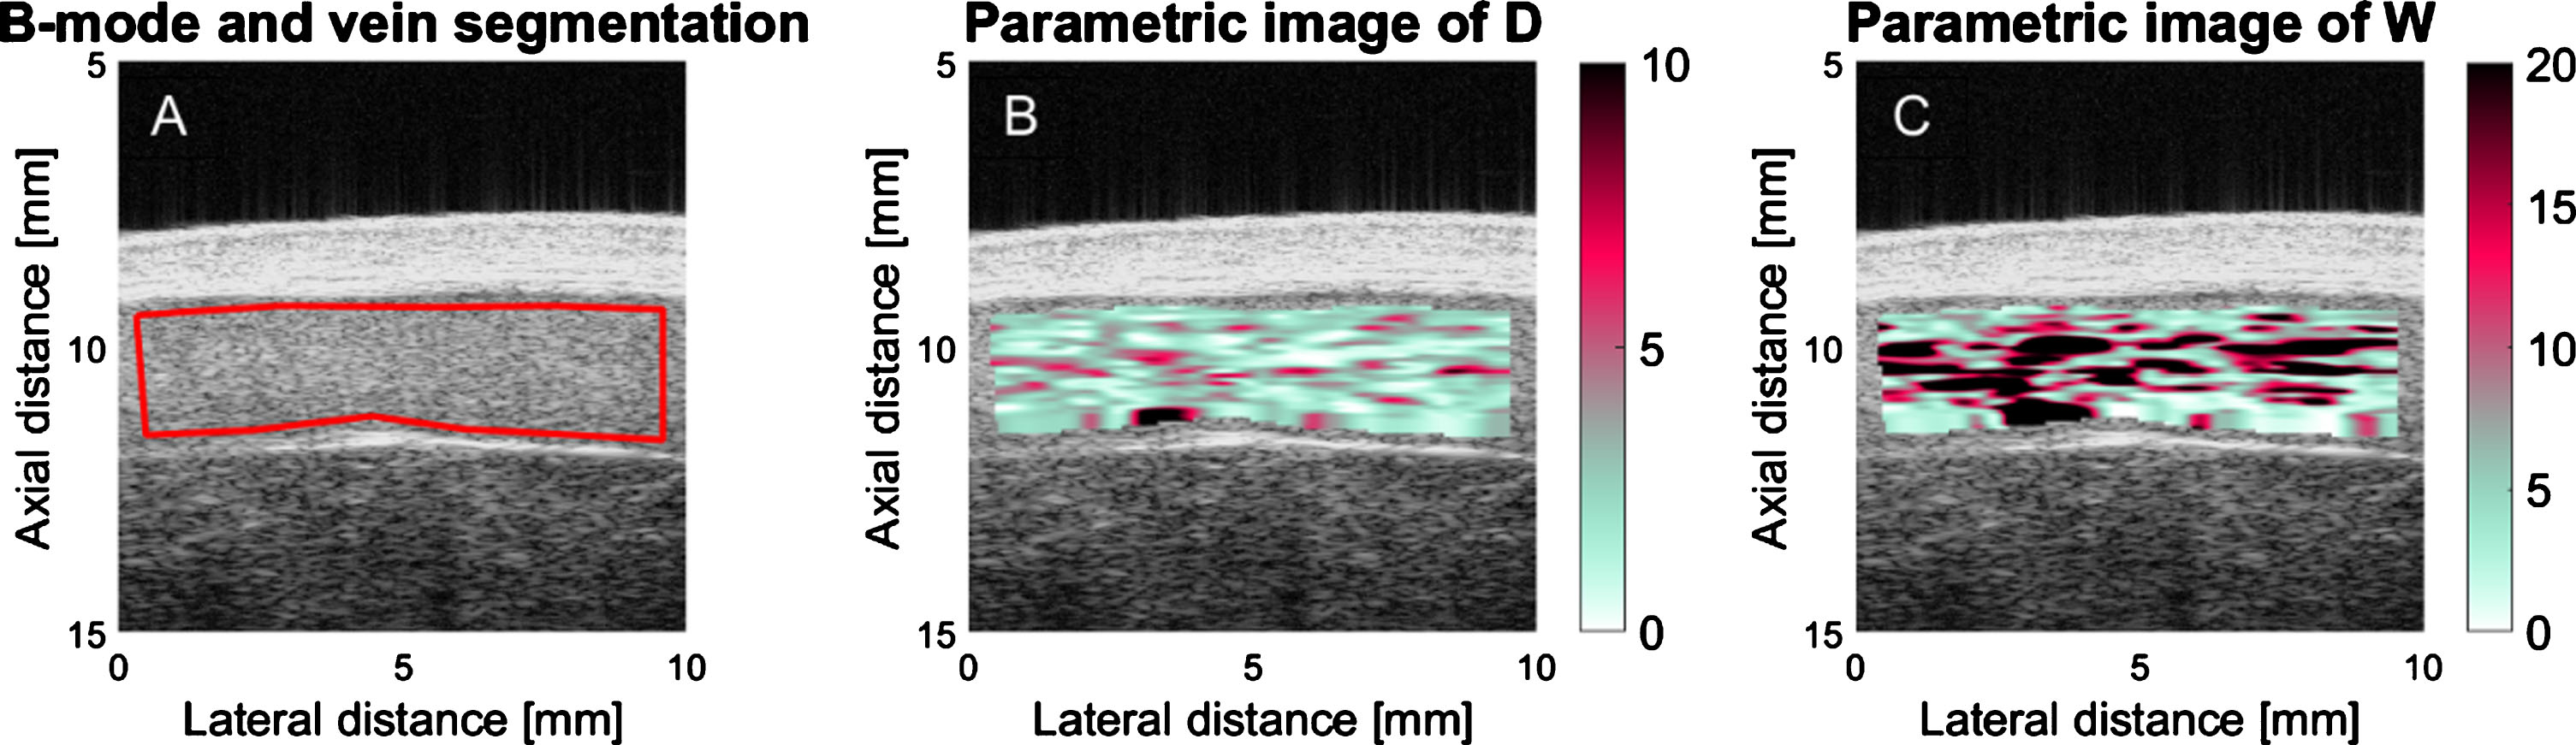
The mean experimental backscatter coefficient as a function of frequency was computed for every resolution cell, and averaged in the time-domain over 20 consecutive images prior to processing the SFSAE method. In order to compensate for instrument dependent signal conditioning, the reference backscatter coefficient method was used [17]. Two parameters of the SFSAE method were computed: D and W (Fig. 3B, C). D represents the mean diameter of aggregates (expressed in RBCs diameter assuming isotropic clustering). W corresponds to the packing factor (dimensionless), which describes the compactness of aggregates. Both D and W parameters increase with the enhancement of RBC aggregation. Based on simulations [18], it was demonstrated that W = C1 × D2 + C2, where constants C1 and C2 are close to 1.0 and 0.0, respectively. Values of these constants are influenced by the hematocrit that is an input parameter of the SFSAE model. The blood hematocrit of each participant was measured by micro centrifugation.
To filter outliers in parametric images of D (Fig. 3B) and W (Fig. 3C), SFSAE spectral models from resolution cells providing poor fits with experimental backscatter coefficients were rejected (i.e., if the correlation R2 within the frequency bandwidth of 15–37 MHz was below 0.5, see [19]). To extract a representative value of the aggregation state, median values of D and W were computed within the segmented venous ROI. The median was then averaged over 5 repeated measurements, prior to computation of correlations with other parameters (see below).
2.6Ex vivo assessment of RBC aggregation
A 4 mL blood sample was taken less than 2 hours before or after US examination for all participants. Blood hematocrit was adjusted to 40% with autologous plasma and processed in an erythroaggregometer (Regulest, Florange, France). The aggregation index at 10 sec (S10) was computed, which is a dimensionless parameter proportional to the RBC aggregation kinetics [20]. This measure corresponds to the relative surface under the reflected laser backscatter curve during the first 10 sec after applying a high shear rate to disaggregate RBCs. This value was used as a gold standard reference to compare with the proposed ultrasound method for assessing the systemic RBC aggregation level of flowing blood.
2.7Data reporting and statistical analysis
The SFSAE D and W parameters are presented as mean±standard deviation (SD) computed over all measurements for a given configuration. The reliability of the SFSAE method was assessed by computing the intraclass correlation coefficient (ICC) between 5 repetitive measurements. The ICC and its 95% confidence interval were computed using R statistical software (version 3.2.5, R Foundation, Vienna, Austria). An ICC between 0.75 and 0.9 corresponds to a good reliability, whereas a value between 0.5 and 0.75 indicates moderate reliability [21]. Spearman correlation was computed between D, W, and ex vivo S10 measurements, since these parameters vary non-linearly as a function of erythrocyte aggregation. To verify the potential influence of gender on values of D, W and S10, Student t-tests were used. The mean intra-subject variability was calculated as the variance divided by the mean of the 5 repeated measurements and averaged over all participants. Repeated ANOVA (RANOVA) tests were performed to evaluate any relationship between the 5 repeated SFSAE measures and the measurement order, and any relationship between the force applied and the measurement order. The median shear rate within the selected vein was estimated by substitution of the measured maximum velocity and vessel diameter into the Ostwald-De Waele power law model [22]. See Appendix 1 for a mathematical description of this model.
3Results
This protocol required acquisition of 1000 ultrasound datasets (50 patients, two recording sites, two flow conditions, five repetitive measurements). However, as given in Table 1, only 760 RF acquisitions could be performed. In the forearm, the vessel size was too small (1 person) or a collateral vein was too close to the measurement location, thus preventing a stable shear rate condition at low flow (1 person). Over the leg, we observed more tortuosity of the tibial vessel and shorter segments length without collateral veins. Moreover, the measurement with a bracelet was more complicated over the ankle due to its curvature because the footprint of the pneumatic occluder was designed to apply a force perpendicular to the limb. Consequently, 36 individuals over 50 could be studied over the leg at natural flow, and 19 at reduced flow.
Table 1
Technical parameters associated with the ultrasound acquisition protocol for two locations (forearm and leg) and two blood flow conditions (one requiring a bracelet to apply a compression on the vein, the other at natural flow)
| Forearm with bracelet | Forearm natural flow | Leg with bracelet | Leg natural flow | |
| Number of measurements | 48 | 49 | 19 | 36 |
| Bracelet applied force | 1.5±1.2 N | – | 2.7±1.9 N | – |
| Maximum blood velocity | 0.6±0.3 | 28±2 | 0.6±0.4 | 28.2±3.2 |
| mm / s | mm / s | mm / s | mm / s | |
| Estimated shear rate | 0.8±0.2 s–1 | 37.8±22.3 s–1 | 0.7±0.3 s–1 | 37.4±38.2 s–1 |
| Coefficient of variation of the shear rate | 30% | 59% | 38% | 102% |
| Deepness of the vein | 1.8±0.8 mm | 1.9±0.5 mm | ||
| Diameter of the vein | 1.5±0.4 mm | 1.4±0.4 mm | 1.8±0.7 mm | 1.6±0.6 mm |
Fifty patients were scanned for at least 1 of the 4 measurement configurations. Values are mean±standard deviation. Reported values are the force measured by the load cell at the stabilized flow shear rate. The maximum velocity was measured by PIV (with the bracelet) or pulsed Doppler (at natural flow). The estimated shear rate was obtained using Equation 2 for every vein diameter and maximum blood velocity (see Appendix 1). The coefficient of variation of the estimated shear rate corresponds to the standard deviation to mean ratio. The deepness and diameter of the vein were measured from B-mode images. The maximum blood velocity target was fixed at 1 mm / s when the flow was controlled with the bracelet.
3.1Adjustment of the applied force to reduce the flow
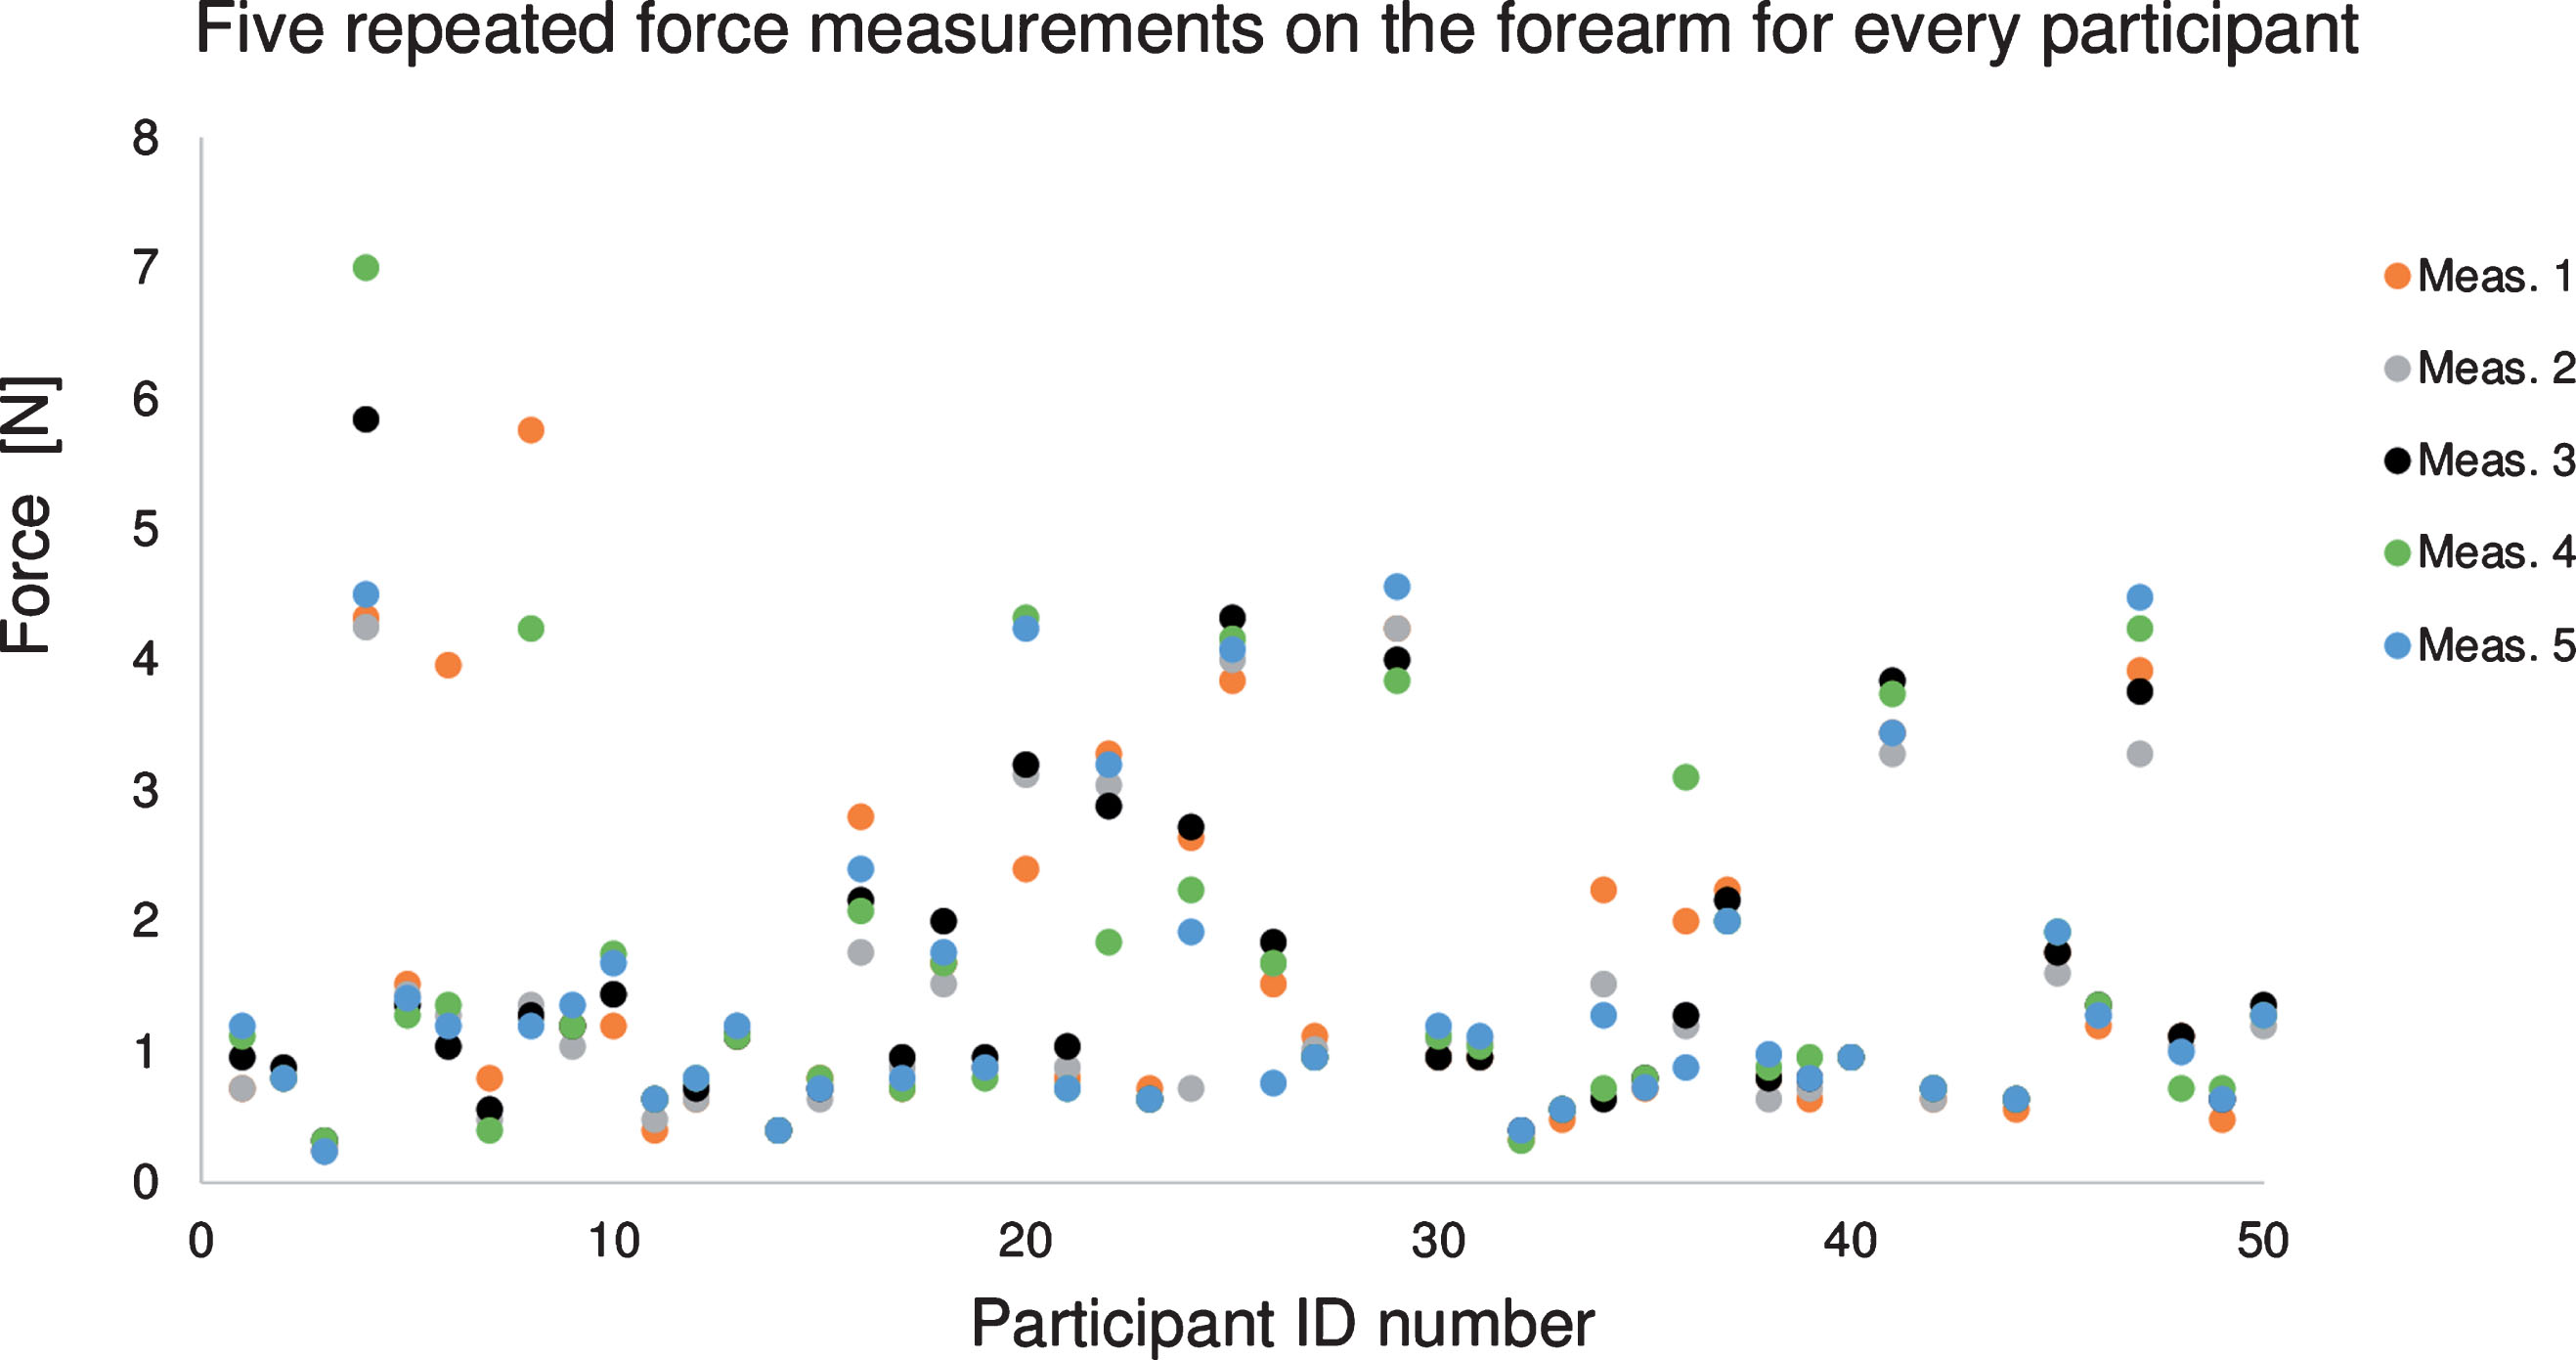
The force applied by the pneumatic occluder to reduce the flow within the brachial vein of the forearm was quite small at 1.5±1.2 N (Table 1). Over the leg, the required force to adjust the flow was slightly higher at 2.7±1.9 N. Figure 4 reports the applied force on the forearm for every subject. For a single participant, the required force was similar along the 5 measurements (mean intra-subject variability of 16% and 17% on the forearm and leg, respectively). Between participants, the mean applied force varied from 0.3 to 5.2 N (inter-subject variability of 76% and 70% on the forearm and leg, respectively). For both venous sites, the patient age, vein’s depth, and BMI were not correlated with the applied force required to control the flow. Measurements showed no trend between the force applied and the acquisition order (p-value >0.05) for both forearm and leg (i.e., no memory effect).
Fig.4
Applied force required to reduce the blood flow within the vein to the targeted maximal blood velocity of 1 mm/sec for 5 repeated ultrasound measurements on the forearm of every participant. Participants #28 and #43 had no data for this configuration. The color of data points corresponds to the order in which measurements were taken. There was no association between the calibrated force applied on the skin and the measurement order (p-value >0.05 among 5 measurements).
3.2Ultrasound SFSAE aggregation measurements
The mean value, standard deviation and intraclass correlation coefficient (ICC) of D and W for all measurement configurations are shown in Table 2. When looking at averaged values of D or W, it can be noticed that they are similar for measurements on the arm or the leg. The same observation holds for the standard deviation and the intraclass correlation coefficient. As expected, both D and W showed higher values at low shear rate. In general, ICCs reveal better reliability for D than W. With ICC values higher than 0.75, measurements presented a good reliability except for W at natural shear rates, which presented moderate reliability. According to reported ICC values, the leg site seemed a better location for quantitative ultrasound aggregation measurements.
Table 2
Comparison of SFSAE ultrasound parameters D and W measured on the forearm and leg at low and natural shear rates
| SFSAE | Forearm | Leg | ||||
| measurements | N | SFSAE±SD | ICC [95% CI] | n | SFSAE±SD | ICC [95% CI] |
| D, low shear | 48 | 1.46±0.35 | 0.84 [0.77, 0.90] | 19 | 1.45±0.33 | 0.87 [0.77, 0.94] |
| W, low shear | 5.46±2.73 | 0.77 [0.68, 0.85] | 6.65±2.30 | 0.88 [0.79, 0.95] | ||
| D, natural shear | 49 | 0.67±0.20 | 0.78 [0.69, 0.86] | 36 | 0.66±0.18 | 0.81 [0.72, 0.88] |
| W, natural shear | 1.39±0.70 | 0.66 [0.54, 0.77] | 1.86±0.85 | 0.68 [0.56, 0.80] | ||
Values are mean±standard deviation of 5 repeated ultrasound measurements for every configuration. The intraclass correlation coefficient (ICC) and its confidence interval are also presented. An ICC between 0.75 and 0.9 corresponds to a good reliability of the measurement. N: number of participants.
3.3SFSAE repeatability
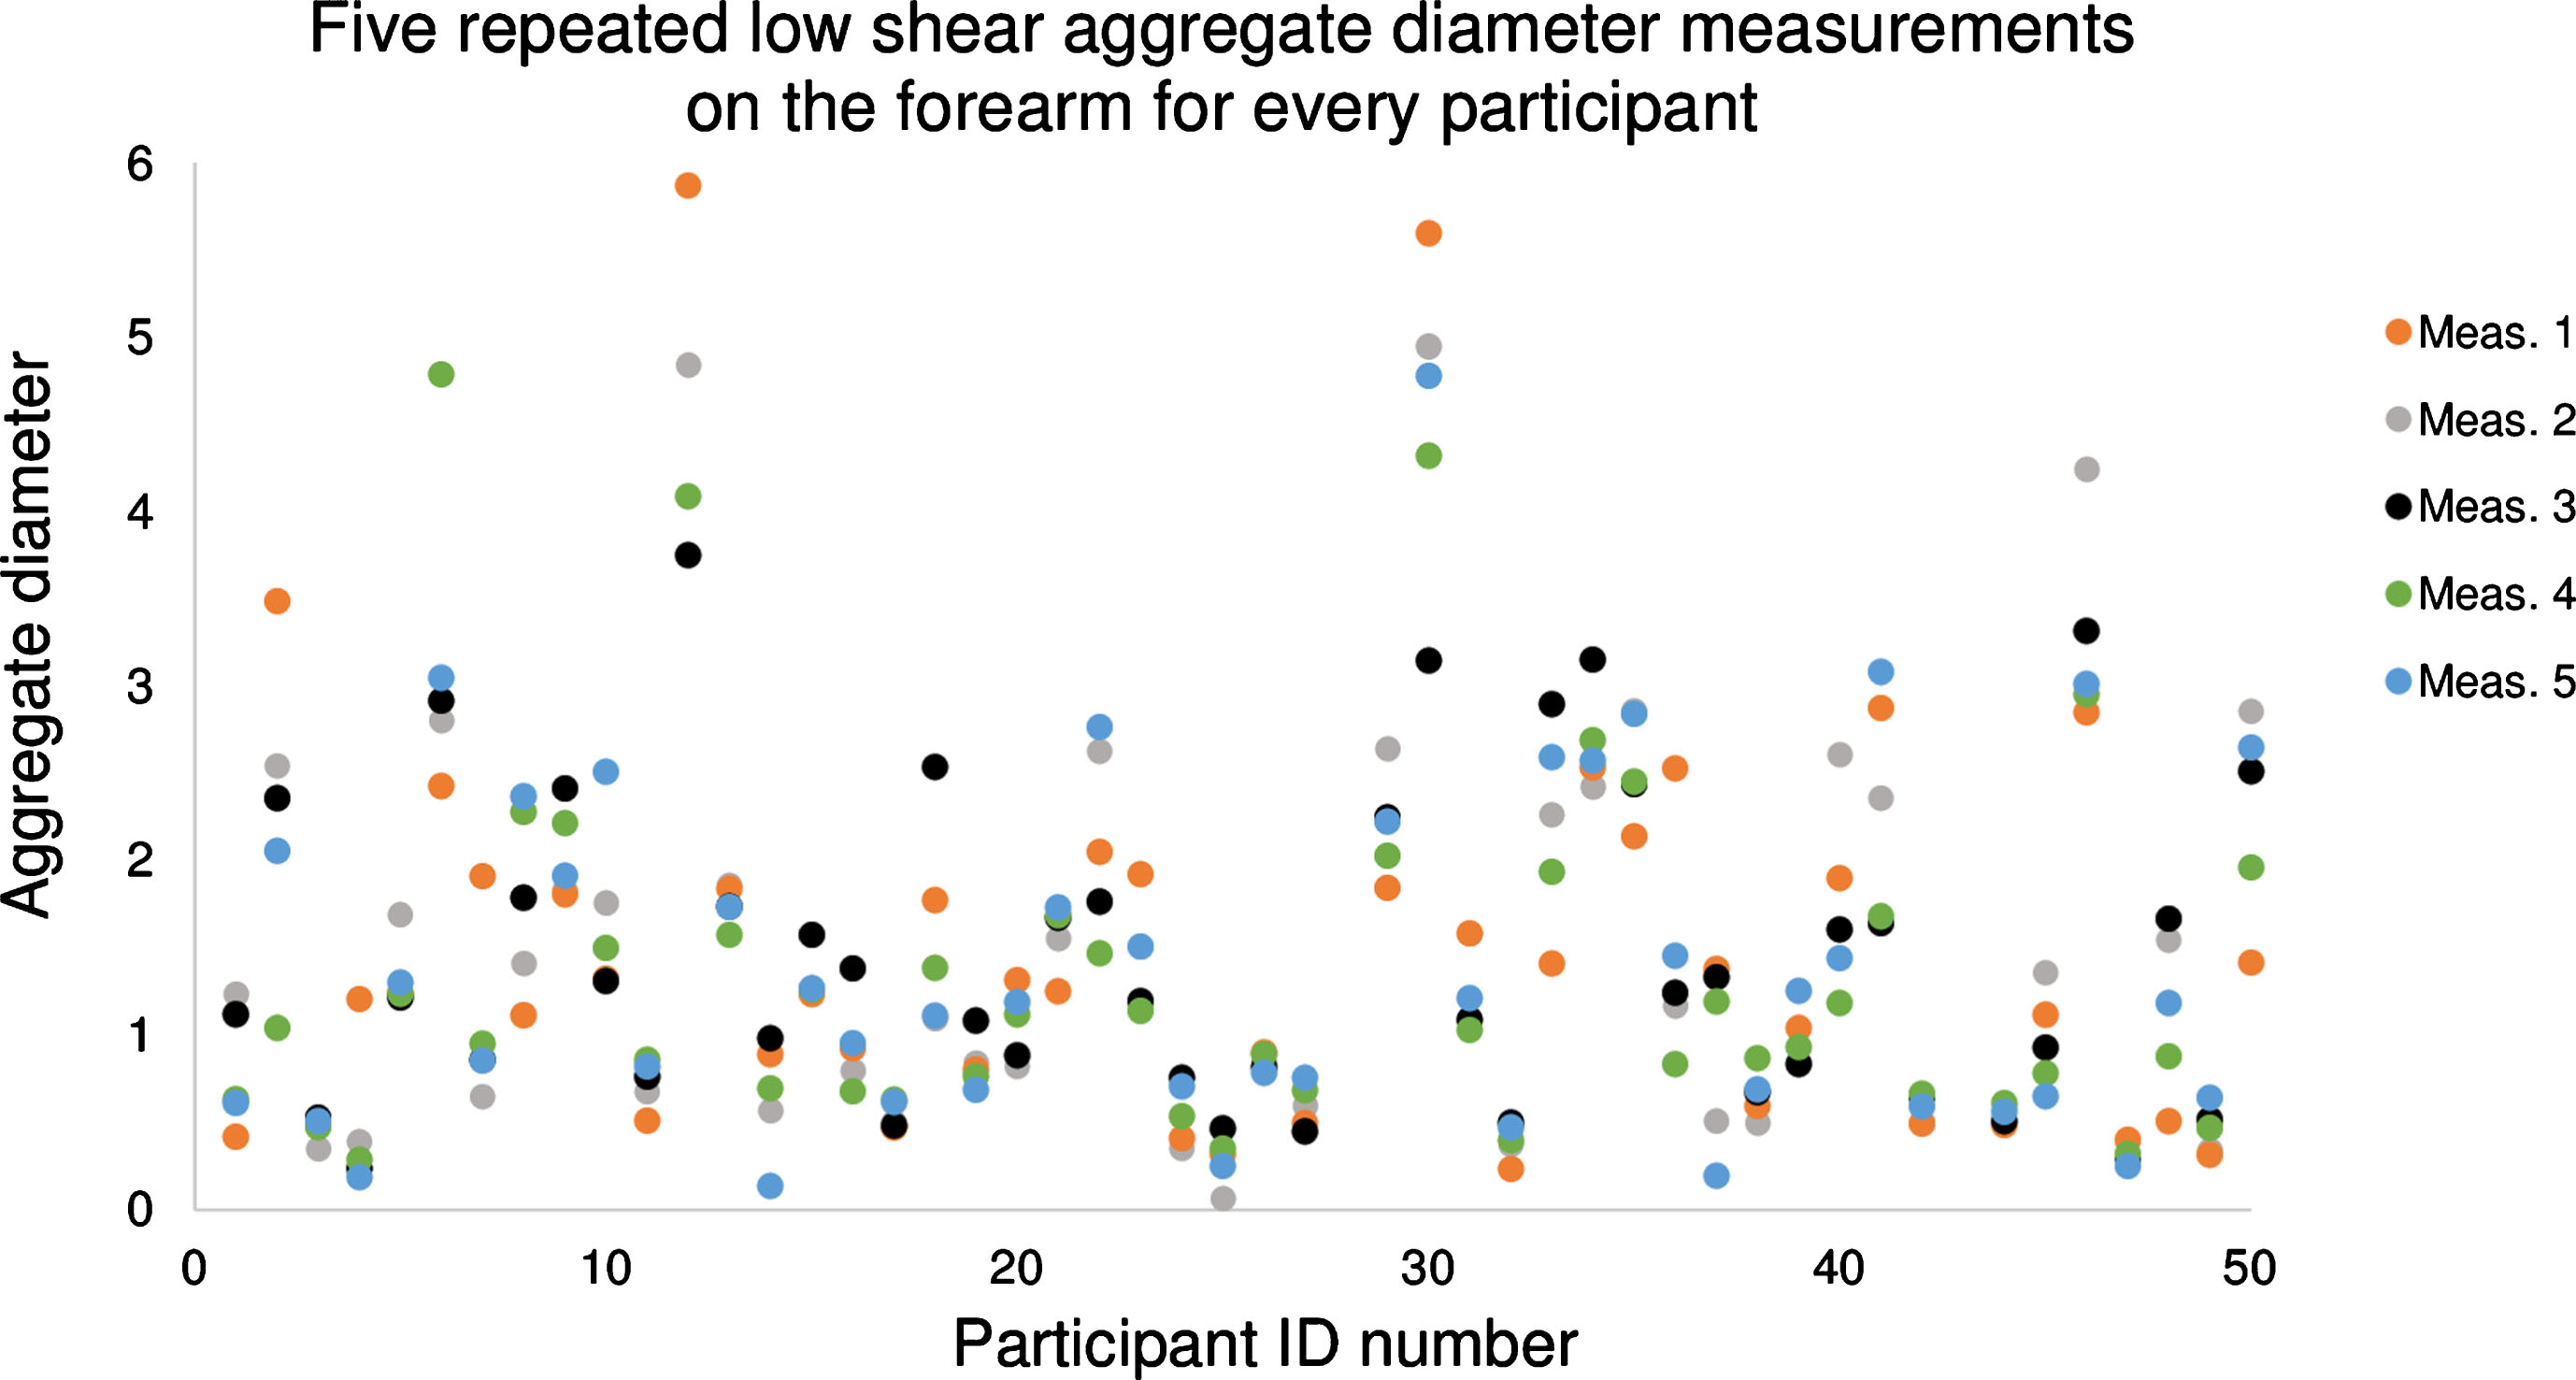
In the remaining of this manuscript, to simplify figure displays, only the SFSAE parameter D is reported (similar results were obtained for W). To illustrate all data points used to compute a single value in Table 2, all individual measurements of D at low shear rate on the forearm are displayed in Fig. 5. The mean value of D for this configuration was 1.46, with an intra-subject variability of 26.3%, ranging from 5.7% (participant #26) to 91.5% (participant #4). The color of data points corresponds to the order in which measurements were taken. Measurements showed no trend between data point values and their acquisition order in the sequence of 5 measures (p-values >0.05 for both forearm and leg configurations).
Fig.5
Plot of 5 measured values of the ultrasound aggregation diameter (parameter D) on the forearm at a low shear rate for every participant. Participants #28 and #43 had no data for this configuration. The color of data points corresponds to the order in which measurements were taken. There was no association between the aggregate diameter and the measurement order (p-value >0.05 among 5 measurements).
3.4Relation between forearm and leg measurements
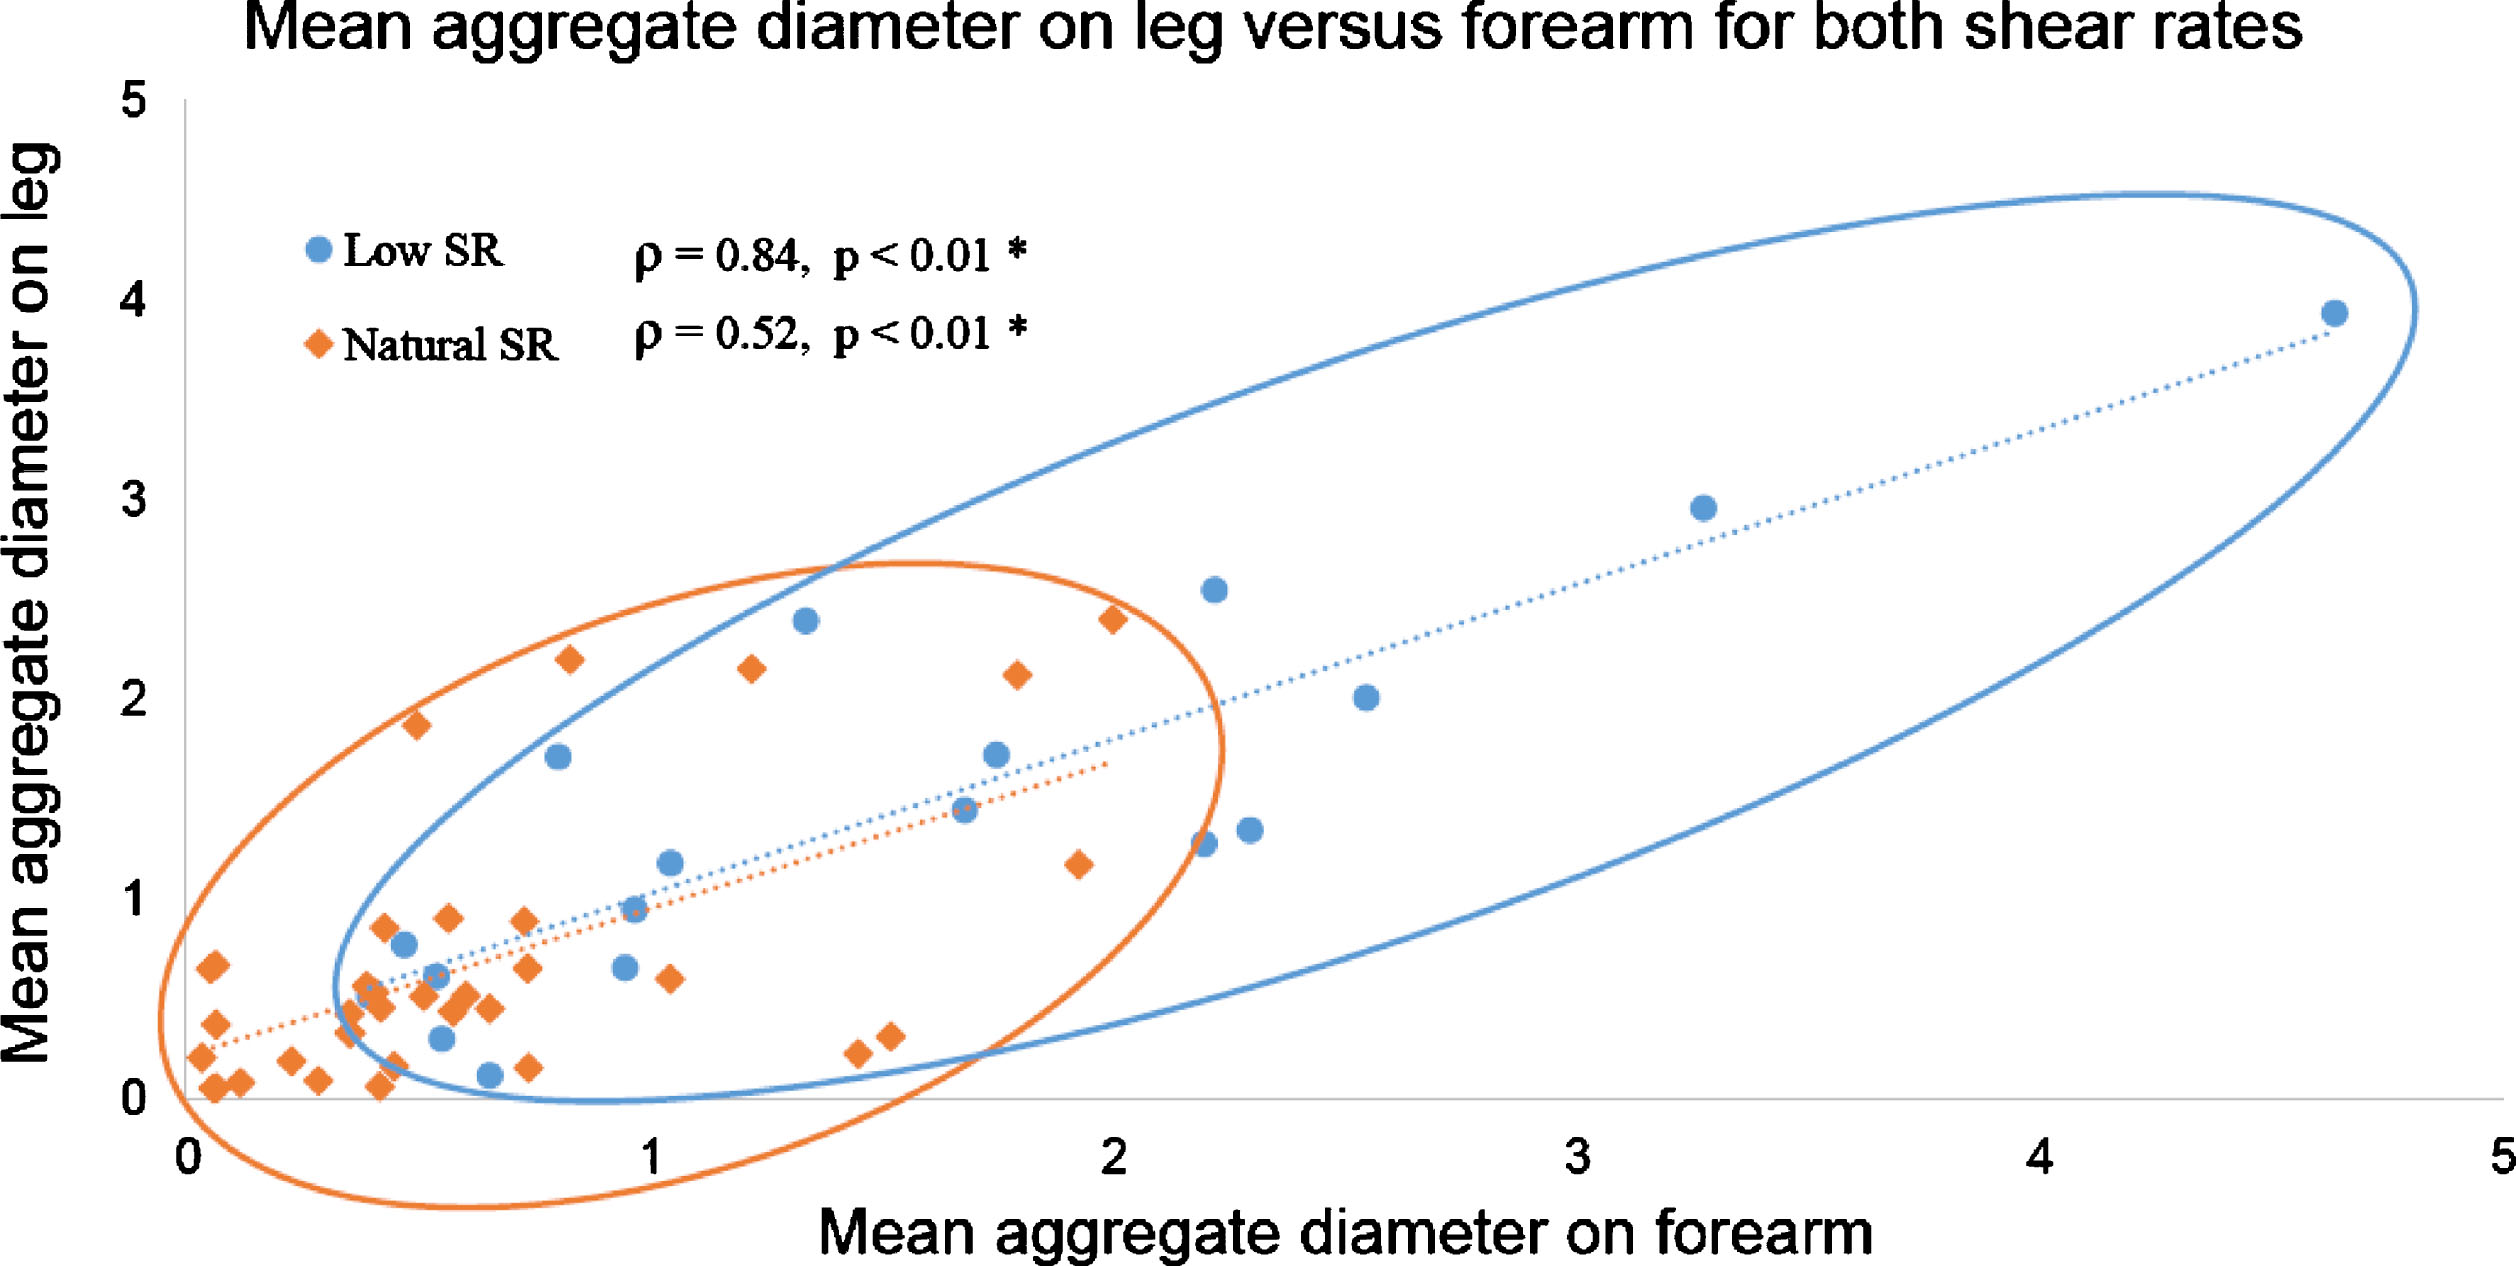
Measurements of D on the leg and on the forearm were correlated as displayed in Fig. 6 for both shear rate conditions. Low shear rate measurements spread well along the regression line (round blue dataset over the blue dotted line) with a coefficient of determination of 0.77. This strong relation is confirmed by the Spearman’s correlation coefficient ρ= 0.84 (p-value <0.01). Results were similar for W at low shear rate (ρ= 0.78, p-value <0.01). At natural shear rate, less variation in RBC aggregation between individuals was noticed; measurements of D in Fig. 6 were packed close to the origin (orange diamond dataset). Correlation coefficients for D and W between the leg and the forearm at natural flow were the same at ρ= 0.52 (p-values <0.01).
Fig.6
Aggregate diameter (D parameter) on the forearm and leg are proportional for measurements at low shear (blue) and natural shear rate (orange) conditions. SR: shear rate.
3.5Relation between natural and low shear rate measurement conditions
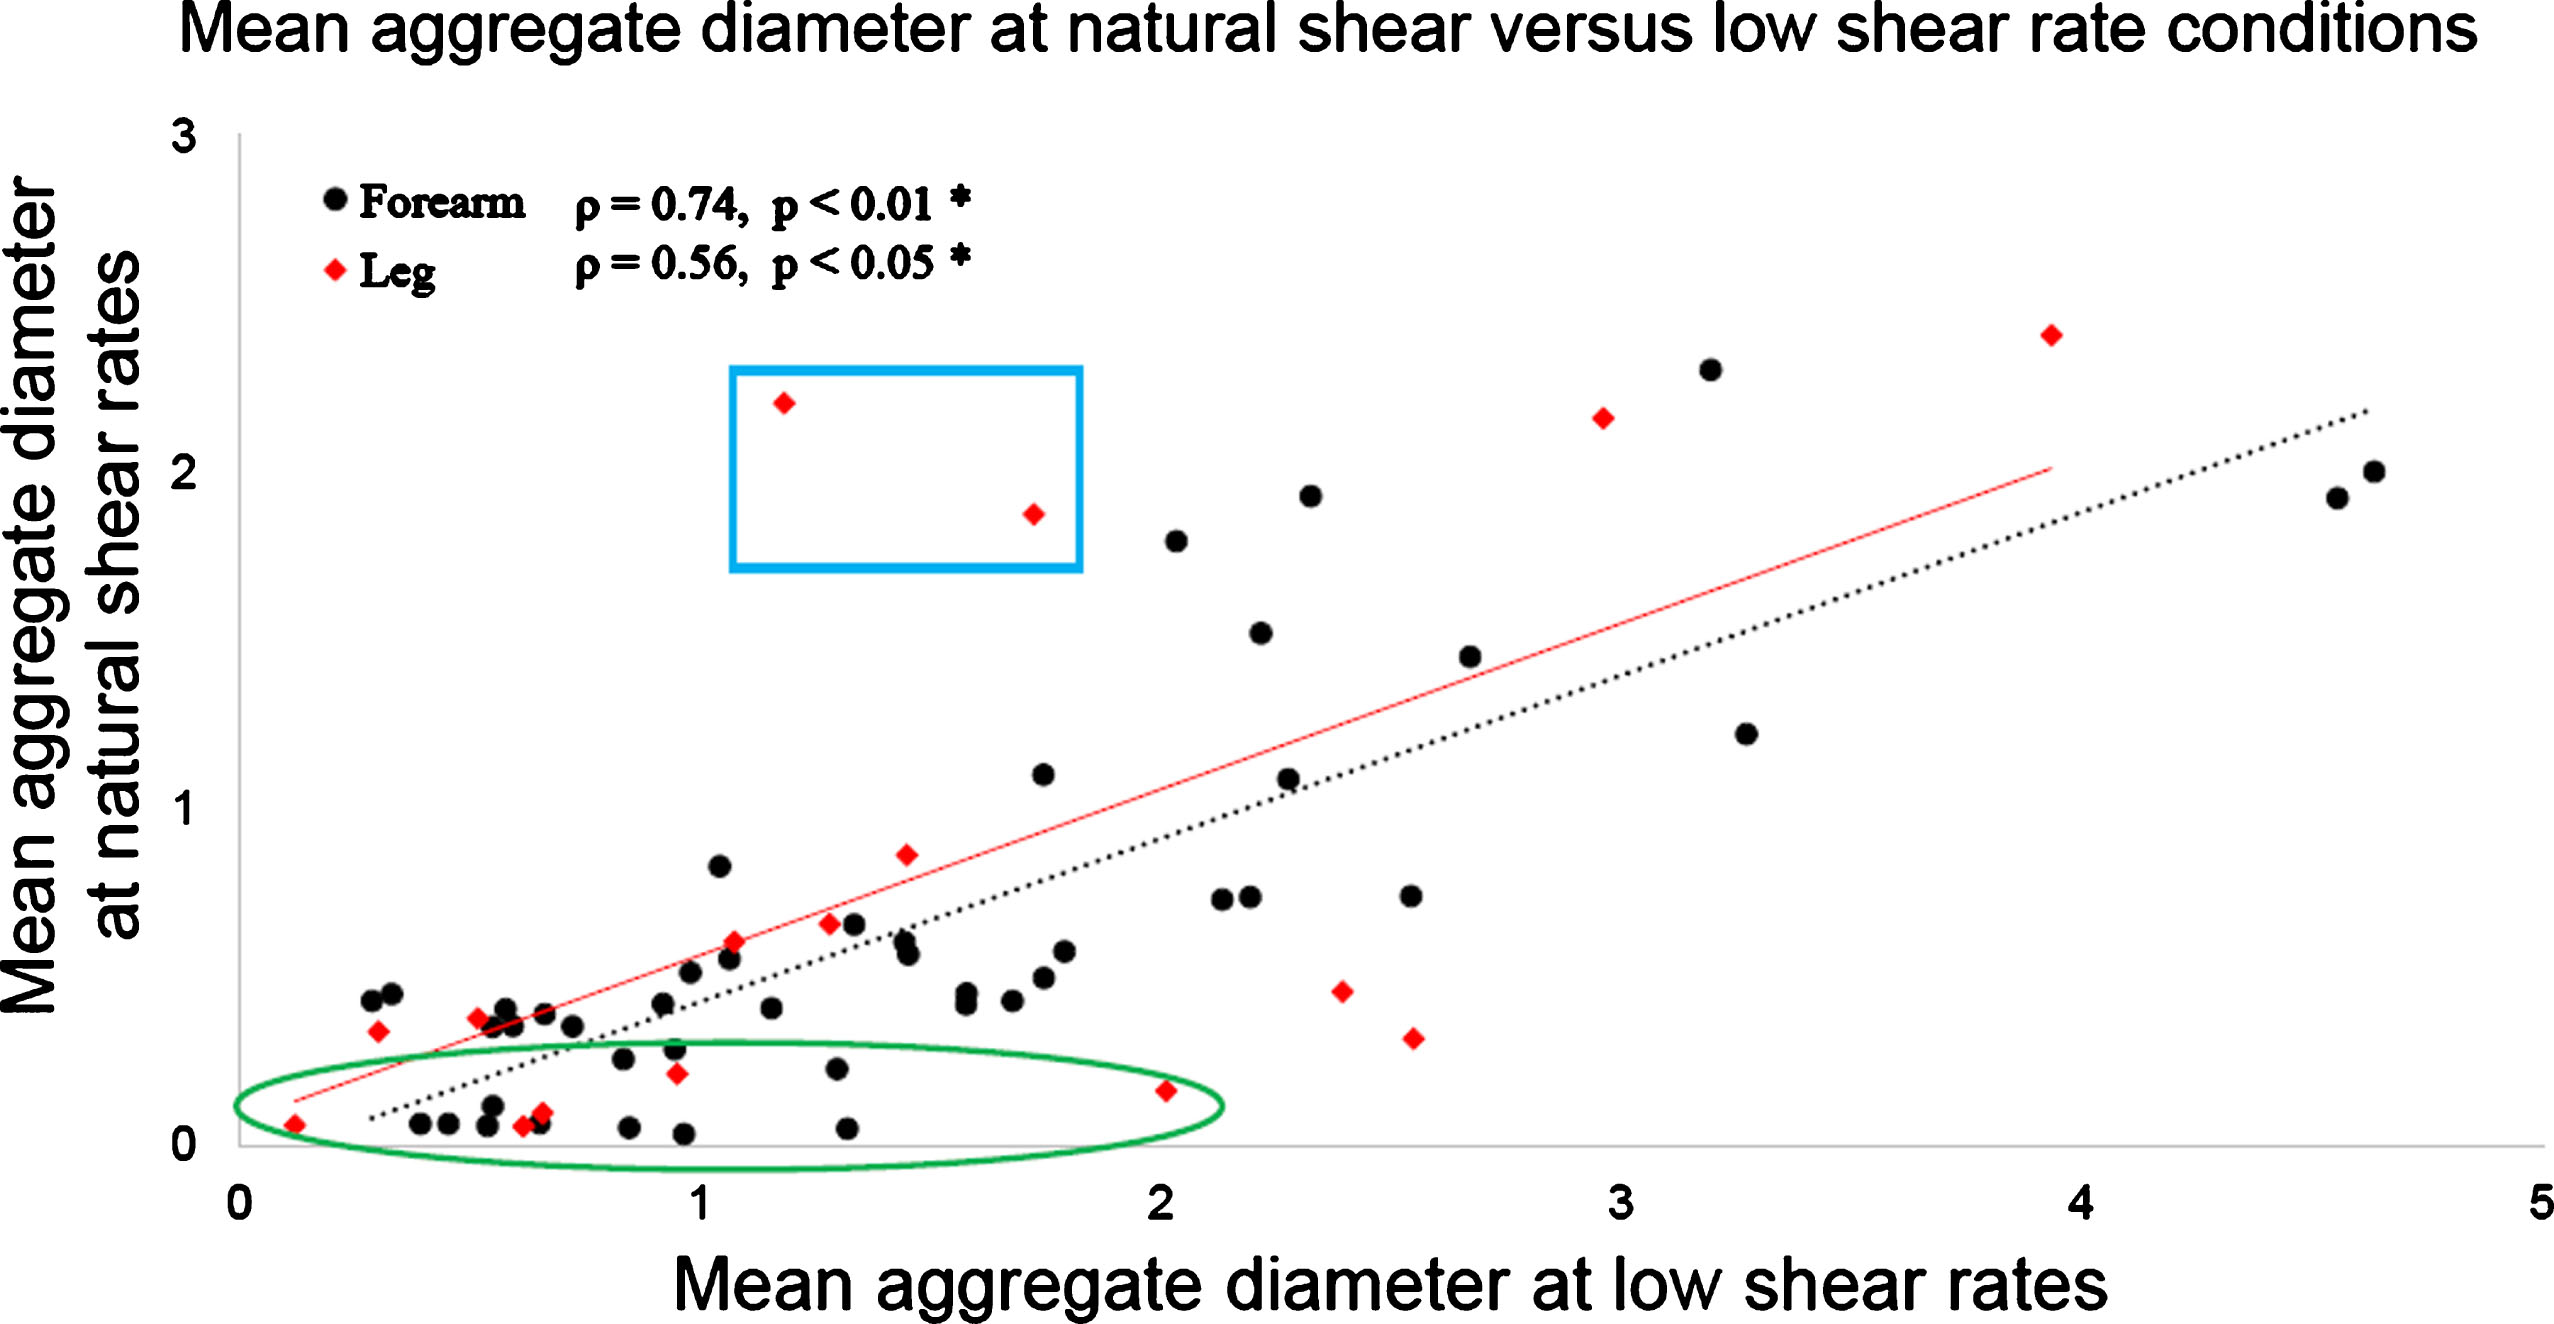
Figure 7 compares D values that were measured for each participant at natural and low shear rate conditions. Both forearm (black dot dataset) and leg (red diamond dataset) measurements are displayed on this figure and present similar trends. Similarities of measurements at both shear rates are confirmed by Spearman’s correlation coefficients ρ = 0.74 (p-value <0.01) for the forearm, and ρ = 0.56 (p-value = 0.025) for the leg. With W, correlations were ρ = 0.76% (p-value <0.01) for the forearm, and ρ = 0.44 (p-value = 0.090, non-significant) for the leg. As noticed in Fig. 7, some measurements were close to the abscissa, as highlighted by the green ellipse. For these participants, the natural blood velocity measured by Doppler ultrasound was higher than for the other participants, on average 38 mm/s compared to 23 mm/s. For these individuals, the natural shear rate was too high to promote aggregation. In these particular cases, D values given by the SFSAE method at natural shear was close to 0.1 compared to 1.0 for measurements at low shear rate on the same participant. Above the regression line are two participants presenting high D values at natural shear and lower D at low shear rate, as highlighted by the blue box. The natural blood flow speed for these two participants was too small to be measured by Doppler ultrasound, whereas at reduced flow controlled by the bracelet the mean velocity measured by PIV was around 0.5 mm/s.
Fig.7
SFSAE D parameter on both forearm and leg at natural shear rate versus low shear rate conditions. The low shear obtained by using the compression bracelet increased the range of D values for participants with naturally high venous flow (green ellipse), and contributed to standardise measurements for those with very low venous flow (blue box).
3.6Ex vivo S10 versus SFSAE aggregation measurements
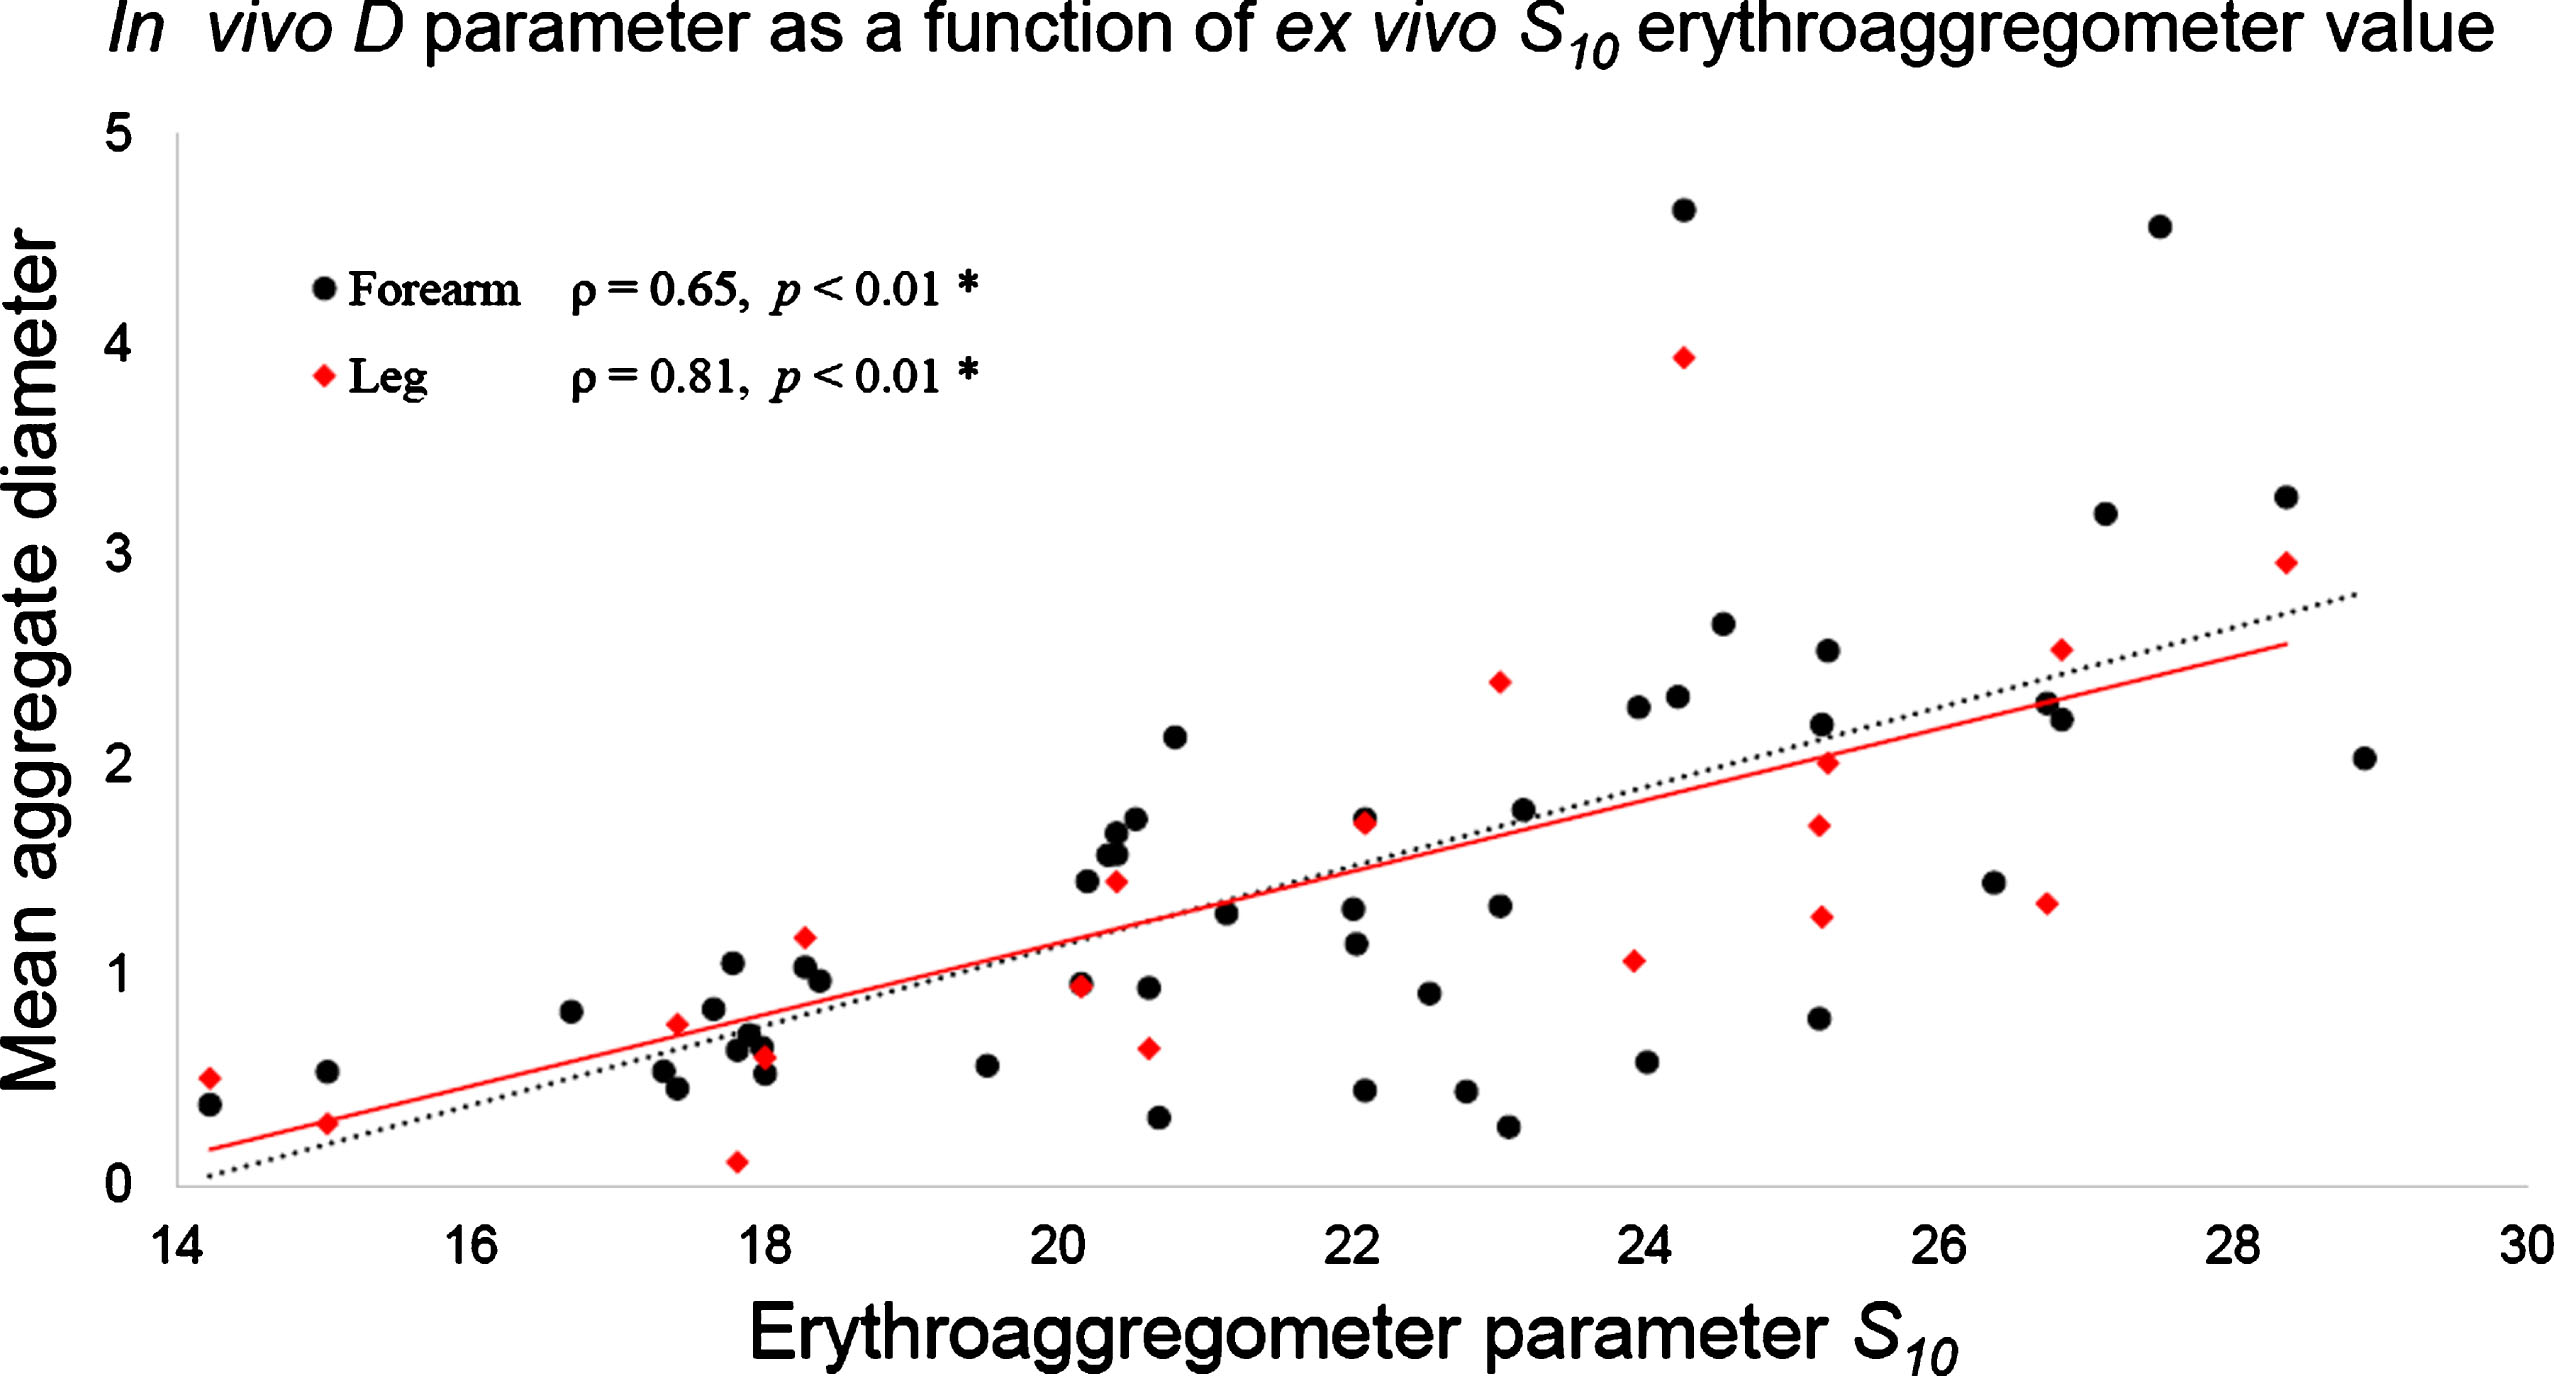
RBC aggregation measurements made on blood samples using the erythroaggregometer ranged from 14.2 to 28.9 (21.6±3.6). Since S10 and in vivo SFSAE parameters describe laser and ultrasound RBC aggregate backscattering properties, respectively, it was interesting to explore the relation between both approaches. Figure 8 presents D at low shear rate as a function of the ex vivo parameter S10. One can notice that D tends to increase proportionally with S10. Similar relations were noticed for D at natural flow and for W at both flow conditions (not shown). Significant correlation coefficients were measured between D or W assessed on the forearm at both shear rates and S10 (0.64 < ρ <0.72, p-values <0.01). SFSAE measurements on the leg at low shear rate condition were also correlated with S10 (for D: ρ= 0.81, p-value <0.01; and for W: ρ= 0.76, p-value <0.01). However, SFSAE measurements at natural flow on the leg were weakly correlated with S10 (for D: ρ= 0.35, p-value = 0.09, non-significant; and for W: ρ= 0.34, p-value = 0.04).
Fig.8
SFSAE D parameter on both forearm and leg at low shear rates versus the ex vivo erythroaggregometer parameter S10. D values increased proportionally with S10, as shown by the linear fitting curve.
4Discussion
Several contributions were made in this study. A computer interface was designed to monitor acquired RF data, to adjust the blood flow velocity to obtain the targeted low shear rate value, and to display in real-time the force applied by the pressurized bracelet on the vein. This is the first study to evaluate the repeatability of SFSAE parameters D and W. We could also establish that SFSAE measurements on the antebrachial vein of the forearm or tibial vein of the leg provided similar assessment of the systemic level of RBC aggregation. Significant correlations could also be demonstrated between in vivo assessments of RBC aggregation and ex vivo laboratory measures of the aggregation kinetics.
4.1Adjustment of the force applied to reduce the blood flow
As seen in Fig. 4, a wide range of applied pressure was required among participants to reduce the venous flow to the targeted value. Indeed, Garcia-Duitama et al. [14] proposed keeping the shear rate below 3 s–1 for obtaining measurements under stable aggregation conditions. However, as reported in Table 1, the shear rate at natural flow was on average 37 s–1, approximately. Consequently, this means that without any flow control, the shear rate in the vein would be well above the proposed threshold for optimum measures. Also, as noticed in Fig. 7, two participants had natural flow close to stasis (blue box) and values of D (and W) higher than under the controlled flow condition. For these participants, the use of the bracelet was not helpful to control the blood flow. Thus, according to results of Figs 4 and 7, a standard pressure that would apply to all participants to reduce the blood flow could not be established. Also, as demonstrated by Garcia-Duitama et al. [14], assessing RBC aggregation under stasis condition could not be a solution. Indeed, this approach is not reproducible because the natural flow before stoppage would provide variable RBC aggregation states affecting the aggregation kinetics and ultrasound measurements.
As indicated in Table 1, standard deviations of the shear rate at natural flow were quite large, especially in lower limbs. Coefficients of variation of 59% and 102% at natural flow were reduced to 30% and 38% under controlled flow. Therefore, the bracelet was useful to avoid variable measurements under natural flow due to the different states of RBC aggregation; see data in the green ellipse of Fig. 7. By decreasing the shear rate, RBC aggregation was enhanced and better controlled, and a wider range of D and W could be observed, reflecting different levels of aggregation. However, even if coefficients of variation on reported shear rates were lower when the bracelet was used, corresponding ICCs with the bracelet were 0.45 in the forearm and 0.49 in the leg, showing poor reliability of the shear rate control. This suggests that the blood flow adjustment technique and device could be further improved. An automatic control of the blood pressure applied by the bracelet through a feedback loop would undoubtedly provide greater stability of the blood flow and better repeatability of the aggregation measurement. In addition, because only 19 out of 50 measurements could be performed on the leg site at low shear rate, this also supports the need of redesigning a new compression device. A rotating bracelet with a different footprint coupled with a miniaturised transducer might be more adapted for measurements over the leg (ankle).
4.2Ultrasound SFSAE aggregation measurements
4.2.1SFSAE robustness
The reliability of SFSAE parameters was tested using the intraclass correlation coefficient (ICC). Results in Table 2 showed an overall good reliability for D and W. The best ICC scores were obtained for low shear rate measurements with excellent values ranging from 0.77 to 0.88, thus showing the relevance of controlling the blood flow. In general, ICCs indicated better reliability for D than W. The relation W ≈ D2 between the two parameters leads to larger values and larger coefficients of variation for W and therefore a lower robustness. This relation could also explain why D and W are correlated together (0.86 < ρ <0.96, p-values <0.001) when considering all measurements, and thus reporting figures on D’s results only was justified.
Baskurt et al. [23] already discussed the fact that the in vivo shear rate history could affect aggregation measurements. With most erythroaggregometer laboratory instruments, a high shear rate is applied to break RBC rouleaux and clumps before assessing the kinetics of aggregation. For in vivo assessments, we previously concluded that maintaining a residual flow for a given period of time improved the repeatability of ultrasound measurements of RBC aggregation [14]. To limit the memory effect (i.e., RBC aggregation depending on the shear rate history), a bracelet was designed to locally control the blood flow in the vein; a cuff as used to measure blood pressure would not be adequate as it would stop the flow in all peripheral veins of the limb. Also, in the current study, a one minute waiting period was used to measure RBC aggregation after reducing the flow. Moreover, a one minute waiting at natural flow was also allowed to let RBCs retrieve their natural aggregation state before taking another measurement. It was interesting to notice from Fig. 5 that the waiting period of one minute between measurements was sufficient to avoid any memory effect. Indeed, no trend was noticed between the value of D and the order of measurements. The choice of large veins for measurements (mean diameters between 1.43–1.82 mm, Table 1) likely contributed to the robustness of D and W because the natural flow (around 28 mm / s, Table 1) seemed sufficient to return to the natural aggregation state within one minute.
4.2.2Relation between forearm and leg measurements
In the past, in vivo assessment of RBC aggregation with the ultrasound SFSAE method has been conducted in diabetes mellitus patients with poor metabolic control (proof-of-concept study) [13]. Ultrasound measurements were performed within the cephalic vein in the proximal portion of the forearm and the saphenous vein in the distal portion of the leg. Hyper aggregation was detected in diabetic patients within both forearm and foot veins but correlation between measurements at both sites was not assessed in that study. Results in Table 2 showed very similar values of both SFSAE parameters between measurements in the forearm and the leg. This relation is confirmed by the correlation ρ= 0.84 for D (p-value <0.0001) and ρ= 0.75 for W (p-value <0.001) between measurements made at these two sites with the bracelet. When measured at natural flow, the correlation for both parameters was not as good but significant (ρ= 0.52, p-value = 0.001 for D; and ρ= 0.46, p-value <0.01 for W). We can therefore consider ultrasonic assessment of erythrocyte aggregation as a systemic measure since values taken at two distinct sites were highly correlated.
The idea of a systemic measurement of erythrocyte aggregation was already proposed by Kitamura & Kawasaki [9]. As far as we know, this study was the first to present a systemic quantitative measurement of RBC aggregation within a vein using ultrasound. However, their measurements remained greatly influenced by the echogenicity of blood that was not assessed using the instrument independent backscatter coefficient. The current SFSAE modeling was based on fitting the spectral content of the backscatter coefficient. In the light of the present study, it is conceivable to provide to intensivists a quantitative RBC aggregation measure that is related to systemic inflammation [1]. RBC aggregation assessed by the proposed SFSAE model has also been shown to be a prognostic measure of venous thrombosis [24]. A limitation of the current method based on high-frequency ultrasound imaging (35 MHz) might be the difficulty of imaging deep vessels because ultrasound attenuation depends on frequency. It is theoretically feasible to measure local differences in RBC aggregation, which would be relevant to characterize diseases such as the diabetic foot syndrome, critical limb ischemia or gangrene [25, 26] but measurements would be limited to superficial vessels (deepness limited to a few mm at 35 MHz).
4.2.3Relation between natural and low shear rate measurements
The impact of the shear rate on erythrocyte aggregation has long been described [27]. Cloutier & Qin [28, 29] went one step further by demonstrating the relation between the shear rate and ultrasound backscattering for various aggregating blood samples. A common technique to measure erythrocyte aggregation ex vivo consists in controlling the shear rate in a mechanical set-up, such as a Couette or a microfluidic device [23]. As discussed earlier, this is more challenging in vivo and the use of a bracelet equipped with a pneumatic occluding device allowed obtaining reproducible results on RBC aggregation. Measurements performed at a low shear rate allowed determining consistent aggregation level for all participants.
As reported in Fig. 6 and as expected, the aggregate diameter was larger at low shear rate (blue circle dataset) than at natural shear rate (orange diamond dataset). In Fig. 7, every participant, except the two with data in the blue box discussed above, had an aggregate diameter close to twice bigger at low shear than at natural shear. The data in the green ellipse revealed a large difference in aggregate diameters at natural versus low shear rates. This could be explained by the presence of high venous blood flow for these participants. Again, this is emphasizing the importance of reducing and controlling the blood flow because otherwise it would not have been possible to identify the varying aggregation levels for these participants. Interestingly in Fig. 6, natural and low shear rate measurements exhibited the same trend between measurement sites (i.e., a slope close to 1). This observation illustrates the consistency of the proposed method despite the drastic difference in blood flow conditions, as the mean shear rate was close to 50 times lower (Table 1) for measurements with bracelet than without.
The coefficient of variation, defined as the standard deviation to mean ratio, allows comparing the variability of different measurement categories. Mean and standard deviation values reported in Table 2 for SFSAE parameters gave higher variability at natural shear than at low shear. For example, coefficients of variation for aggregate diameters measured at the forearm’s site were 24% and 30% at low and natural shear rates, respectively. Likewise, the coefficient of variation for the reference aggregation measure S10 was 17%. The fact that the coefficient of variation was slightly larger for ultrasound than ex vivo measurements illustrates the need for a good shear rate control device.
However, conditions of hyper-aggregation could reduce the importance of a precise shear rate control on measurements since aggregates would be more shear rate resistant. Using ex vivo erythroaggregometer, the strength of aggregates has been defined as the minimum shear rate threshold necessary to partially dissociate RBC aggregates. Le Devehat et al. [30] measured increased partial dissociation threshold (PDT) of 54.5 s–1 for diabetic patients with severe leg ischemia versus 47.0 s–1 for healthy subjects. The same conclusion was reached by El Bouhmadi et al. [31] who found an increased PDT of 78.1 s–1 for women suffering from ovarian cancer versus 52.6 s–1 for women in the control group. Our team using an ultrasound mean reported that a shear rate as high as 200 s–1 was necessary to break RBC aggregates in patients with diabetes mellitus and poor metabolic control [32]. It is therefore possible to hypothesize that in the context of hyper-aggregation, we may have a larger range of shear rates on which the ultrasound assessment of RBC aggregation would be consistent.
4.3Ex vivo S10 vs SFSAE aggregation measurements
When the blood flow was controlled with the bracelet, strong correlations were observed between D and W parameters and the ex vivo S10 reference standard. This finding remained valid for measurements on forearm’s and leg’s sites (Fig. 8). Consequently, as discussed above, ultrasonic measurements of RBC aggregation can be seen as a local measure reflecting a systemic property. At the natural shear rate, the same trend was observed on the forearm’s site but not on the leg, where data showed weak and non-significant correlations with S10. In our cohort, S10= 21.6±3.6, which is close to the value of 23±4 reported for healthy subjects [5].
4.4Limitations
The sample size of this cohort was too small to study the influence of diseases, age, drugs, native hematocrit or ethnicity on aggregation parameters D, W or S10. However, Student t-tests showed significant differences in D and W values between men and women. This difference in RBC aggregation according to sex was already reported using ex vivo laser backscatter measurements [34]. On the other hand, a relation between obesity and erythrocyte aggregation has also been described [35–37]. The current cohort was composed of healthy participants having a BMI around 25 and did not include obese individuals. However, a significant correlation was nevertheless noticed between the BMI and S10 (ρ= 0.54, p-value <0.01), but not between BMI and SFSAE parameters.
Some limitations still hamper the immediate use of this technology for clinical diagnosis. The current bulky ultrasound system may not be optimum for use in critical care or surgery units. A compact ultrasound device would be more appropriate for these applications. Furthermore, acquisitions were performed at 35 MHz, which is not a typical frequency used by clinical scanners that operate typically between 3 to 15 MHz. Consequently, a dedicated portable miniaturized bed-site high-frequency ultrasound system would need to be developed. Such system would ideally include a monitor displaying time-varying D and W parameters. Indeed, for monitoring RBC aggregation and thus systemic inflammation, the specific value of a given parameter might be less crucial than its evolution over time under similar flow conditions. From a clinical point of view, it is difficult to predict whether the venous flow will remain constant throughout the aggregation monitoring procedure. This is why it seemed more appropriate to control the venous flow and to adjust it at a very low shear for which RBC aggregation is promoted in order to maintain a margin if the patient’s condition deteriorates. It would eventually be important to assess the day-to-day or week-to-week reproducibility of SFSAE measures. Thus to summarize, challenges remain important but feasible.
5Conclusions
Although the shear rate control may still require further improvements for in vivo measurements of erythrocyte aggregation, this study has demonstrated the feasibility of obtaining reproducible and non-invasive values in a clinical context. Structural parameters D and W describing RBC aggregation followed the same behavior at low and natural shear rate conditions, albeit values being higher at low shear rate. For monitoring RBC aggregation and thus systemic inflammation, the specific value of a given parameter might be less crucial than its evolution over time under similar flow conditions. From a clinical point of view, it is difficult to predict whether the venous flow will remain constant throughout the aggregation monitoring procedure. This is why it seemed more appropriate to control the venous flow and to adjust it at a very low shear for which RBC aggregation is promoted in order to maintain a margin if the patient’s condition deteriorates.
In vivo results at low shear showed strong correlations between D and W, and the ex vivo S10 aggregation parameter, no matter the measurement site. For the detection of hyper-aggregation, standardized flow measurements might remain important to compare results from patient to patient, even though the confounding impact of the shear rate might be less critical. This study also showed that a bracelet equipped with a pressurized device was useful to control the blood flow and to obtain standardized in vivo measurement conditions. In routine clinical practice, the patient’s forearm is often used for intravenous infusion of saline solution, vascular pressure monitoring, oxygen saturation measurements, etc . . . In this study, results obtained at leg’s and forearm’s sites were found to be correlated. Measurements followed the same tendency in both upper and lower limbs and this behavior was observed for both shear rates. The conceptualization of a new rotational bracelet design with a different footprint could allow optimizing measurements on patient’s legs, which would facilitate monitoring in critical care units.
Appendices
Appendix 1: In vivo median shear rate estimation
The median shear rate can be conveniently approximated when the maximum blood velocity is known. To better approximate the blunted velocity profile characteristic of a non-Newtonian fluid such as blood, the blood viscosity was measured in a low shear viscometer (ProRheo LS300, Althengstett, Germany) over a range of shear rates varying from 0.5 to 100 s–1. The blood kinematic viscosity, μ, was then fitted by least squares to the classical power law of Ostwald-De Waele [22]
(1)
(2)
(3)
In Equation 3, Q corresponds to the volumetric blood flow, defined as a function of the maximum flow speed, vmax, occurring at the central axis of the vein, as
(4)
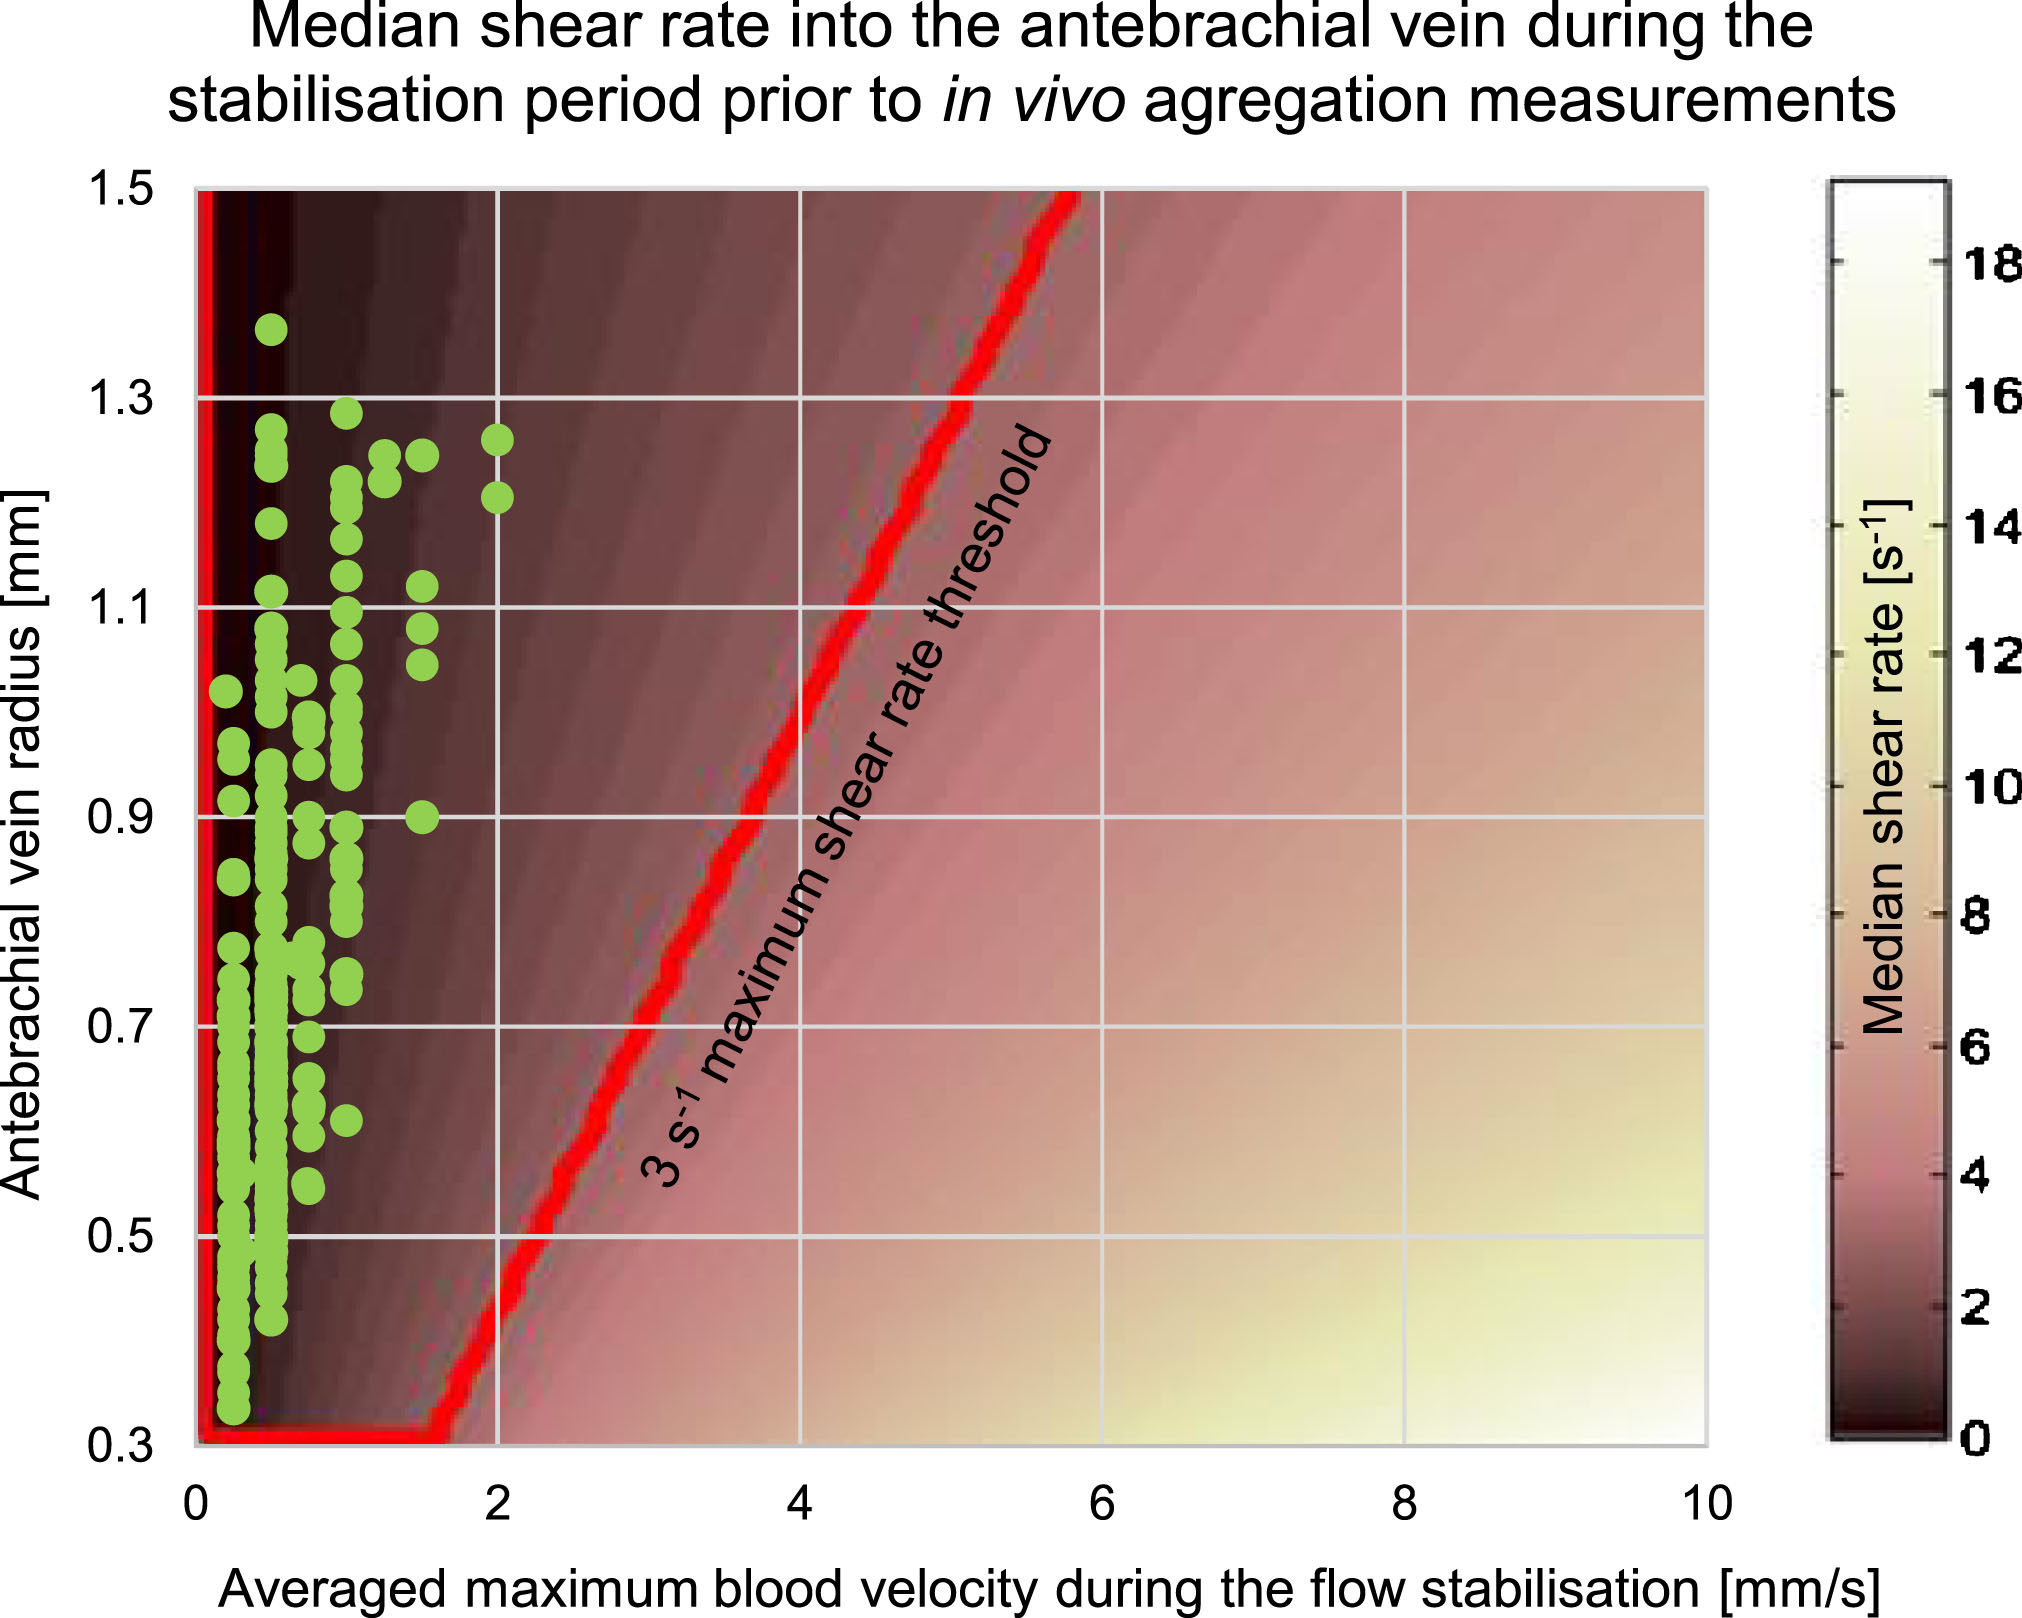
We used porcine blood experiments to approximate coefficients a and b: a= 17.52±4.88 and b= –0.33±0.07. This was justified by the fact that porcine RBC aggregation is close to that of normal human blood [33]. Using Equation 2 and establishing a shear rate threshold at 3 s–1, we could verify in Fig. 9 that all median shear rates for reported antebrachial experiments were below that threshold. The targeted region corresponds to the red trapezoid in Fig. 9 where the y-axis indicates the measured vein radius and the x-axis is the maximum velocity. A plot similar to Fig. 9 was used for tibial measurements. Note that for a median shear rate under the threshold value of 3 s–1, the relation between vmax and the vein radius corresponds approximately to vmax ≤ 4 × r.
Fig.9
Median shear rate in tube flow. The radius corresponds to the size of the antebrachial vein. The red box indicates the region for which the shear rate was less than 3 s–1. Green dots show estimated shear rates for every measurements made with the bracelet on the forearm.
Acknowledgments
This study was financially supported by the Natural Sciences and Engineering Research Council of Canada (Collaborative Health Research Program #508337-17 and Engage Program #503381-16), and by the Canadian Institutes of Health Research (grant #CPG-151959). Authors want to thanks René Gosselin and Richard Côté from Menodys Inc. (Longueuil, Québec, Canada) for the helpful discussions and access to the AccuVein instrument, and every participants for their contribution to this pilot study.
References
[1] | Gyawali P , Ziegler D , Cailhier JF , Denault A , Cloutier G . Quantitative measurement of erythrocyte aggregation as a systemic inflammatory marker by ultrasound imaging: A systematic review. Ultrasound in Medicine & Biology. (2018) ;44: (7):1303–17. |
[2] | Urbach J , Shapira I , Branski D , Berliner S . Acute phase response in the diagnosis of bacterial infections in children. The Pediatric Infectious Disease Journal. (2004) ;23: (2):159–60. |
[3] | Imaizumi K , Shiga T . Effect of immunoglobulins and IgG-fragments on the human erythrocyte aggregation studied by a rheoscope combined with image analyzer. Biorheology. (1983) ;20: (5):569–77. |
[4] | Rampling MW , Whittingstall P , Linderkamp O . The effects of fibrinogen and its plasmin degradation products on the rheology of erythrocyte suspensions. Clinical Hemorheology and Microcirculation. (1984) ;4: (6):533–43. |
[5] | Weng X , Cloutier G , Beaulieu R , Roederer GO . Influence of acute-phase proteins on erythrocyte aggregation. American Journal of Physiology-Heart and Circulatory Physiology. (1996) ;271: (6):H2346–52. |
[6] | Boynard M , Lelievre JC , Guillet R . Aggregation of red blood cells studied by ultrasound backscattering. Biorheology. (1987) ;24: (5):451–61. |
[7] | Sigel B , Machi J , Beitler JC , Justin JR , Coelho JC . Variable ultrasound echogenicity in flowing blood. Science. (1982) ;218: (4579):1321–3. |
[8] | Yuan Y , Shung K . Ultrasonic backscatter from flowing whole blood. I: Dependence on shear rate and hematocrit. J Acoust Soc Am. (1988) ;84: (1):52–8. |
[9] | Kitamura H , Kawasaki S . Detection and clinical significance of red cell aggregation in the human subcutaneous vein using a high-frequency transducer (10 MHz): A preliminary report. Ultrasound in Medicine and Biology. (1997) ;23: (6):933–8. |
[10] | Mamou J , Oelze ML . (Eds.)., Quantitative Ultrasound in Soft Tissues, Heidelberg: Springer, (2013) , p. 226. |
[11] | Franceschini E , Yu FT , Cloutier G . Simultaneous estimation of attenuation and structure parameters of aggregated red blood cells from backscatter measurements. The Journal of the Acoustical Society of America. (2008) ;123: (4):EL85–91. |
[12] | Yu FT , Cloutier G . Experimental ultrasound characterization of red blood cell aggregation using the structure factor size estimator. The Journal of the Acoustical Society of America. (2007) ;122: (1):645–56. |
[13] | Tripette J , Nguyen LC , Allard L , Robillard P , Soulez G , Cloutier G . In vivo venous assessment of red blood cell aggregate sizes in diabetic patients with a quantitative cellular ultrasound imaging method: Proof of concept. PloS One. (2015) ;10: (4):e0124712. |
[14] | Garcia-Duitama J , Chayer B , Garcia D , Goussard Y , Cloutier G . Protocol for robust in vivo measurements of erythrocyte aggregation using ultrasound spectroscopy. Ultrasound in Medicine & Biology. (2017) ;43: (12):2871–81. |
[15] | Garcia D . A fast all-in-one method for automated post-processing of PIV data. Experiments in Fluids. (2011) ;50: (5):1247–59. |
[16] | Franceschini E , Yu FT , Destrempes F , Cloutier G . Ultrasound characterization of red blood cell aggregation with intervening attenuating tissue-mimicking phantoms. The Journal of the Acoustical Society of America. (2010) ;127: (2):1104–15. |
[17] | Wang SH , Shung KK . An approach for measuring ultrasonic backscattering from biological tissues with focused transducers. IEEE Transactions on Biomedical Engineering. (1997) ;44: (7):549–54. |
[18] | Saha RK , Franceschini E , Cloutier G . Assessment of accuracy of the structure-factor-size-estimator method in determining red blood cell aggregate size from ultrasound spectral backscatter coefficient. The Journal of the Acoustical Society of America. (2011) ;129: (4):2269–77. |
[19] | Oelze ML , O’Brien WD Jr . Application of three scattering models to characterization of solid tumors in mice. Ultrasonic Imaging. (2006) ;28: (2):83–96. |
[20] | Donner M , Siadat M , Stoltz JF . Erythrocyte aggregation: Approach by light scattering determination. Biorheology. (1988) ;25: (1-2):367–76. |
[21] | Koo TK , Li MY . A guideline of selecting and reporting intraclass correlation coefficients for reliability research. Journal of Chiropractic Medicine. (2016) ;15: (2):155–63. |
[22] | Ostwald W . Ueber die rechnerische Darstellung des Strukturgebietes der Viskosität. Colloid & Polymer Science. (1929) ;47: (2):176–87. |
[23] | Baskurt O , Boynard M , Cokelet G , Connes P , Cooke BM , Forconi S , Liao F , Hardeman MR , Jung F , Meiselman HJ , Nash G , Nemeth N , Neu B , Sandhagen B , Shin S , Thurston G , Wautier JL . New guidelines for hemorheological laboratory techniques. Clinical Hemorheology and Microcirculation. (2009) ;42: (2):75–97. |
[24] | Yu FTH , Armstrong JK , Tripette J , Meiselman HJ , Cloutier G . A local increase in red blood cell aggregation can trigger deep vein thrombosis: Evidence based on quantitative cellular ultrasound imaging. J Thrombosis & Haemostasis. (2011) ;9: 481–8. |
[25] | Khodabandehlou T , Vimeux M , Dévéhat CL . Measurements of transcutaneous oxygen pressure and changes in blood rheology as markers of prognosis of critically ischemic limb in diabetes mellitus patients. The International Journal of Lower Extremity Wounds. (2003) ;2: (1):13–8. |
[26] | Mantskava M , Momtselidze N , Pargalava N , Mchedlishvili G . Hemorheological disorders in patients with type 1 or 2 diabetes mellitus and foot gangrene. Clinical Hemorheology and Microcirculation. (2006) ;35: (1, 2):307–10. |
[27] | Schmid-Schönbein H , Gaehtgens P , Hirsch H . On the shear rate dependence of red cell aggregation in vitro . The Journal of Clinical Investigation. (1968) ;47: (6):1447–54. |
[28] | Cloutier G , Qin Z . Ultrasound backscattering from non-aggregating and aggregating erythrocytes - A review. Biorheology. (1997) ;34: (6):443–70. |
[29] | Cloutier G , Qin Z . Shear rate dependence of ultrasound backscattering from blood samples characterized by different levels of erythrocyte aggregation. Annals of Biomedical Engineering. (2000) ;28: (4):399–407. |
[30] | Le Devehat C , Khodabandehlou T , Vimeux M . Impaired hemorheological properties in diabetic patients with lower limb arterial ischaemia. Clinical Hemorheology and Microcirculation. (2001) ;25: (2):43–8. |
[31] | El Bouhmadi A , Laffargue F , Brun JF . Aggregability and disaggregability of erythrocytes in women suffering from ovarian cancer: Evidence for an increased disaggregation threshold. Clinical Hemorheology and Microcirculation. (2000) ;22: (2):91–7. |
[32] | Cloutier G , Zimmer A , Yu F , Chiasson JL . Increased shear rate resistance and fastest kinetics of erythrocyte aggregation in diabetes measured with ultrasound. Diabetes Care. (2008) ;31: (7):1400–2. |
[33] | Weng X , Cloutier G , Pibarot P , Durand LG . Comparison and simulation of different levels of erythrocyte aggregation with pig, horse, sheep, calf, and normal human blood. Biorheology. (1996) ;33: (4 & 5):365–77. |
[34] | Pignon B , Adjizian JC , Donner M , Stoltz JF , Potron G . Mesure de l’agrégation érythrocytaire par rétrodiffusion laser. Détermination des valeurs normales. Influence de différents facteurs. In Hémorhéologie et Agrégation Érythrocytaire. Théorie et Applications Cliniques. Cachan, Édition Médicales Internationales, France, Vol. 3, 1991, pp. 53–64. |
[35] | Guiraudou M , Varlet-Marie E , Raynaud de Mauverger E , Brun JF . Obesity-related increase in whole blood viscosity includes different profiles according to fat localization. Clinical Hemorheology and Microcirculation. (2013) ;55: (1):63–73. |
[36] | Solá E , Vayá A , Corella D , Santaolaria ML , Espana F , Estellés A , Hernández-Mijares A . Erythrocyte hyperaggregation in obesity: Determining factors and weight loss influence. Obesity. (2007) ;15: (8):2128–34. |
[37] | Samocha-Bonet D , Lichtenberg D , Tomer A , Deutsch V , Mardi T , Goldin Y , Abu-Abeid S , Shenkerman G , Patshornik H , Shapira I , Berliner S . Enhanced erythrocyte adhesiveness/aggregation in obesity corresponds to low-grade inflammation. Obesity Research. (2003) ;11: (3):403–7. |


