
Blood storage alters mechanical stress responses of erythrocytes
Abstract
BACKGROUND: Erythrocytes undergo irreversible morphological and biochemical changes during storage. Reduced levels of deformability have been reported for stored erythrocytes. Erythrocyte deformability is essential for healthy microcirculation.
OBJECTIVE: The aim of this study is to evaluate shear stress (SS) induced improvements of erythrocyte deformability in stored blood.
METHODS: Deformability changes were evaluated by applying physiological levels of SS (5 and 10 Pa) in metabolically depleted blood for 48 hours and stored blood for 35 days with citrate phosphate dextrose adenine-1 (CPDA-1). Laser diffractometry was used to measure erythrocyte deformability before and after application of SS.
RESULTS: Erythrocyte deformability, as a response to continuous SS, was significantly improved in metabolically depleted blood, whereas it was significantly impaired in the blood stored for 35 days with CPDA-1 (p≤0.05). The SS-induced improvements of deformability were deteriorated due to storage and relatively impaired according to the storage time. However, deformability of stored blood after exposure to mechanical stress tends to increase at low levels of shear while decreasing at high SS levels.
CONCLUSION: Impairment of erythrocyte deformability after storage may contribute to impairments in the recipient’s microcirculation after blood transfusion. The period of the storage should be considered to prevent microcirculatory problems and insufficient oxygen delivery to the tissues.
1Introduction
Red blood cells (RBC) are exposed to various shear stresses (SS) in blood flow as they go through capillaries in the circulatory system. One of the unique features of RBCs is their ability to change shape in response to external forces [1]. This important phenomenon defines their mechanical behavior and function, since decreased deformability is known to cause problems during oxygen delivery to tissues in microcirculation [2]. RBCs for blood transfusions are routinely stored for up to 35 or 42 days, depending on the conditions of preservation [3]. During storage, RBCs undergo a series of biochemical and biomechanical changes, called ‘storage lesions’ that reduce their survival and function [4]. Storage lesions include prominent alterations in RBC morphology such as shape changes from a discoid to a spherocytic phenotype [5]. These shape changes are the results of irreversible membrane losses due to the formation of vesicles which may cause reduced deformability [6].
Most current blood storage solutions are composed of dextrose, phosphate, adenine, and citrate [7]. CPDA-1 (Citrate phosphate dextrose adenine-1) is one of the anticoagulant solutions that allows RBC concentrates to be stored at 4°C for 35 days [8]. Cold storage of blood at temperatures between 1–6°C slows down RBC metabolism and decreases the need for energy. This leads to a reduction in ATP levels and loss of function of ATP dependent cation pumps (Na+/K+ and Ca++). As a consequence, intracellular potassium levels decrease drastically and sodium and calcium start to accumulate within the cytoplasm [9]. ATP depletion may be one of the main concerns for blood storage. It is reported by Card et al. that a decrease in deformability was observed when ATP level was lower than 30% of the initial value [10]. Under these circumstances, superoxide radicals damage lipids and proteins of the RBC membrane [11]. Lipid peroxidation disturbs phospholipid asymmetry of RBC membrane, and this leads to the externalization of phosphatidylserine (PS) to the outer leaflet of the membrane and facilitates RBC adhesion to endothelial cells [3]. Oxidative stress is a possible mechanism contributing to microvesicle formation during storage and therefore causes loss of membrane deformability [12]. Moreover, a significant decrease in RBC deformability after 2 to 4 weeks of storage was shown in several studies by different methods [13–17].
Erythrocytes deform in response to SS. RBC deformability increases under microvascular level SS (e.g. 5–10 Pa) [18]. This increment in RBC deformability returns to initial level within seconds after removing SS. Our previous study showed that the time course of improvement in RBC deformability is related with magnitude of SS and the time course of recovery response of RBC to SS is associated with the length of application time [18]. This mechanical response has been assumed to be a physiologically important phenomenon, affecting microvascular blood flow. The improvement in RBC deformability means that red cells are expected to change their shapes more easily under a given SS and reduce microcirculatory flow resistance. The present study evaluated SS-induced improvements of RBC deformability using two different storage models. Whole blood was either stored in cold conditions for 35 days with citrate phosphate dextrose adenine-1 (CPDA-1) or stored at room temperature for 48 hours to assess changes in RBC deformability at physiological levels of SS under various storage times and conditions.
2Materials and methods
2.1Experimental design
The methodologies for blood collection and preparation used in this study depend on the two different storage models which are detailed below:
(1) Metabolic depletion: Peripheral blood was collected from anterior brachial veins of healthy donors using vacuum tubes containing sodium heparin (15 IU/ml). The hematocrit of the blood samples was adjusted to 40% with autologous plasma. Heparinized blood samples were studied on the same day, within 4 hours of the blood collection and the remaining blood samples were incubated for 48 hours at room temperature. Blood samples were incubated on a tube roller mixer with a low rate of speed.
(2) Storage with CPDA-1: Blood samples were taken from healthy donors, aged between 20 and 39 years, using injectors with 21 gauge needles without sodium heparin. Five milliliters of whole blood was immediately mixed with 700μl CPDA-1. Control samples were studied on the same day, within 4 hours of blood collection. The remaining samples were incubated for 35 days on a tube roller mixer at +4°C and the measurements were performed on the 7th and 35th days of incubation with CPDA-1. The hematocrit of blood samples was adjusted to 40% with autologous plasma prior to measurements.
This study was approved by Ethics Committee of Koc University School of Medicine (IRB: 020/2012) and an informed written consent was obtained from each subject participated in the study.
2.2Application of shear stress to blood samples
Continuous SS at physiological levels of 5 and 10 Pa were applied to blood suspensions using a laser-assisted optical rotational cell analyzer (LORRCA MaxSis, Mechatronics, Netherlands). The device has a co-axial couette type cylindrical shearing system which consists of inner and outer cylinders with a gap in between them. As the sample was applied into the gap, the SS was obtained using the rotational speed of the outer cylinder and the viscosity of the suspending medium (viscosity: 29.6 mPa.s). A laser beam was directed through the sheared sample and the diffraction pattern reflected by the deformed cells was captured by a CCD camera and then analyzed. As the SS continued, deformability was measured as elongation index (EI) and recorded by the device. EI was calculated as follows: EI = (a– b)/(a + b) where ‘a’ is the vertical axis and ‘b’ is the horizontal axis of the diffraction pattern. An increased EI at any given SS indicates greater RBC deformability [19]. The experiments were conducted at 37°C.
2.3Measurement of RBC deformability as a response to applied shear stress
Whole blood samples were diluted in polyvinylpyrrolidone (PVP) solutions (Mechatronics, Hoorn, Netherlands) with a dilution ratio of 1/200. RBC deformability was measured by applying ten different SS as follows: 0.3, 0.53, 0.94, 1.65, 2.91, 5.15, 9.09, 16.04, 28.32 and 50 Pa. The RBC deformability was determined by the change in the elongation index (EI) with applied SS. Then, constant 5 and 10 Pa SS were applied continuously for 300 seconds and EI was recorded versus time. After continuous SS exposure for 300 seconds, RBC deformability was measured again with a delay of 10 seconds under same conditions. Maximal RBC elongation index (EImax) and the SS required for one-half of this maximal deformation (SS1/2) were calculated by the linear Lineweaver-Burke (LB) model [20]. The SS1/2/EImax ratio was also calculated as a normalized measure of SS1/2 [21].
3Statistical analysis
Data are presented as mean±standard error (SE) unless otherwise stated. Two-way mixed model ANOVA followed by Bonferoni’s multiple comparisons test was performed for the comparisons of before and after deformability measurements. The time course of EI changes was analyzed by non-linear curve fitting. SS1/2 and EImax values were calculated by Lineweaver-Burke approach. All data analyses were performed with GraphPad v4 software package (GraphPad software, La Jolla, CA). Level of significance is accepted to be 0.05 throughout the study.
4Results
4.1Deformability of stored blood before and after shear stress applications
RBC deformability was evaluated on the first day of blood collection and on the 7th and 35th days of storage with CPDA-1 (Table 1). Blood stored for 7 days had significantly increased EI values at low levels of SS between 0.94 and 2.91 Pa, compared to fresh blood samples before the application of continuous SS. In contrast, blood stored for 35 days had significantly reduced EI values at high SS levels between 5.15 and 50 Pa. RBC deformability both in fresh and stored blood increased after continuous SS applications. Control samples (1st day) had higher EI values after continuous 5 and 10 Pa SS exposure and this elevation was significant at low levels of SS up to 5.15 Pa. In blood stored for 7 days, after continuous SS application of 5 Pa, RBC deformability was significantly increased between 0.3 and 5.15 Pa SS. Interestingly, following the continuous SS application of 10 Pa, a significant increase in deformability was observed at all SS levels except 16.04 Pa in samples stored for 7 days. In blood stored for 35 days, after the application of continuous 5 and 10 Pa SS, RBC deformability was significantly increased at low SS levels up to 5.15 Pa (Table 1). Therefore, the level of improvement in deformability upon application of continuous 5 and 10 Pa SS depends on the duration of bloodstorage.
Table 1
Deformability measurements (EI = Mean±SD) before and after continuous shear stress (SS) in the fresh blood (1st day) and, on the 7th and 35th days of storage with CPDA-1 (n = 11 in each group)
| Shear | Before SS | After 5 Pa SS | After 10 Pa SS | ||||||
| Stress (Pa) | EI | EI | EI | ||||||
| 1st Day | 7th Day | 35th Day | 1st Day | 7th Day | 35th Day | 1st Day | 7th Day | 35th Day | |
| 0.3 | 0.046±0.02 | 0.054±0.01 | 0.074±0.01δ,φ | 0.071±0.02* | 0.093±0.02*,ɛ | 0.096±0.02*,ɛ | 0.073±0.02* | 0.094±0.02*,γ | 0.095±0.01*,γ |
| 0.53 | 0.107±0.02 | 0.118±0.02 | 0.119±0.02δ | 0.132±0.03* | 0.144±0.02*,ɛ | 0.133±0.02* | 0.128±0.02* | 0.150±0.02*,γ | 0.131±0.01*,Ω |
| 0.94 | 0.184±0.03 | 0.197±0.02δ | 0.186±0.02φ | 0.206±0.03* | 0.222±0.03*,ɛ | 0.200±0.03*,Σ | 0.207±0.03* | 0.228±0.02*,γ | 0.200±0.02*,Ω |
| 1.65 | 0.271±0.03 | 0.290±0.02δ | 0.267±0.03φ | 0.291±0.03* | 0.315±0.03*,ɛ | 0.286±0.03*,Σ | 0.290±0.03* | 0.316±0.02*,γ | 0.284±0.02*,Ω |
| 2.91 | 0.373±0.03 | 0.388±0.02δ | 0.361±0.03φ | 0.392±0.02* | 0.407±0.02*,ɛ | 0.377±0.03*,ɛ,Σ | 0.388±0.03* | 0.408±0.02*,γ | 0.375±0.02*,γ,Ω |
| 5.15 | 0.462±0.02 | 0.466±0.02 | 0.437±0.02δ,φ | 0.473±0.02 | 0.479±0.02* | 0.445±0.02ɛ,Σ | 0.472±0.02 | 0.482±0.01* | 0.448±0.02γ,Ω |
| 9.09 | 0.527±0.02 | 0.523±0.02 | 0.487±0.02δ,φ | 0.533±0.01 | 0.532±0.01 | 0.495±0.02ɛ,Σ | 0.534±0.01 | 0.538±0.01* | 0.498±0.02γ,Ω |
| 16.04 | 0.569±0.02 | 0.561±0.03 | 0.523±0.02δ,φ | 0.574±0.01 | 0.571±0.01 | 0.533±0.02ɛ,Σ | 0.576±0.01 | 0.572±0.01 | 0.534±0.02γ,Ω |
| 28.32 | 0.594±0.02 | 0.584±0.04 | 0.545±0.02δ,φ | 0.599±0.01 | 0.595±0.01 | 0.556±0.02ɛ,Σ | 0.601±0.01 | 0.599±0.01* | 0.556±0.02γ,Ω |
| 50.0 | 0.609±0.01 | 0.599±0.04 | 0.558±0.02δ,φ | 0.614±0.01 | 0.611±0.02 | 0.569±0.02ɛ,Σ | 0.617±0.01 | 0.615±0.01* | 0.570±0.02γ,Ω |
*Significance between before and after SS in each group (p≤0.05). δSignificance of control group with 7th and 35th day groups before SS (p≤0.05). ɛSignificance of control group with 7th and 35th day groups after 5 Pa SS (p≤0.05). γSignificance of control group with 7th and 35th day groups after 10 Pa SS (p≤0.05). φSignificance between 7th and 35th day groups before SS (p≤0.05). ΣSignificance between 7th and 35th day groups after 5 Pa SS (p≤0.05). ΩSignificance between 7th and 35th day groups after 10 Pa SS (p≤0.05).
When compared to controls, RBC deformability of the blood stored for 7 days was elevated up to 9.09 Pa level after exposure to continuous 5 and 10 Pa SS. This SS-induced improvement in deformability was statistically significant at low SS that ranged between 0.3 and 2.91 Pa (p < 0.05). The increment in deformability was estimated as 4% at 2.91 Pa level. After applying continuous 5 and 10 Pa SS to the blood stored for 35 days, RBC deformability began to decrease from the level of 0.94 Pa. The significant reduction in deformability was observed at high SS that ranged between 2.91 and 50 Pa levels when compared to the 1st day group (p < 0.05, Table 1). This downward change in deformability was 3.7% at 2.91 Pa level. The reduction in deformability at high SS levels was also observed in stored blood for 7 days though it was not significant. However mechanic stress-induced improvements of deformability were deteriorated in the blood stored for 35 days at high SS levels above 2.91 Pa. A decrease in deformability is related to the storage duration before the continuous SS application, and similar results have been observed after the continuous SS applications as well.
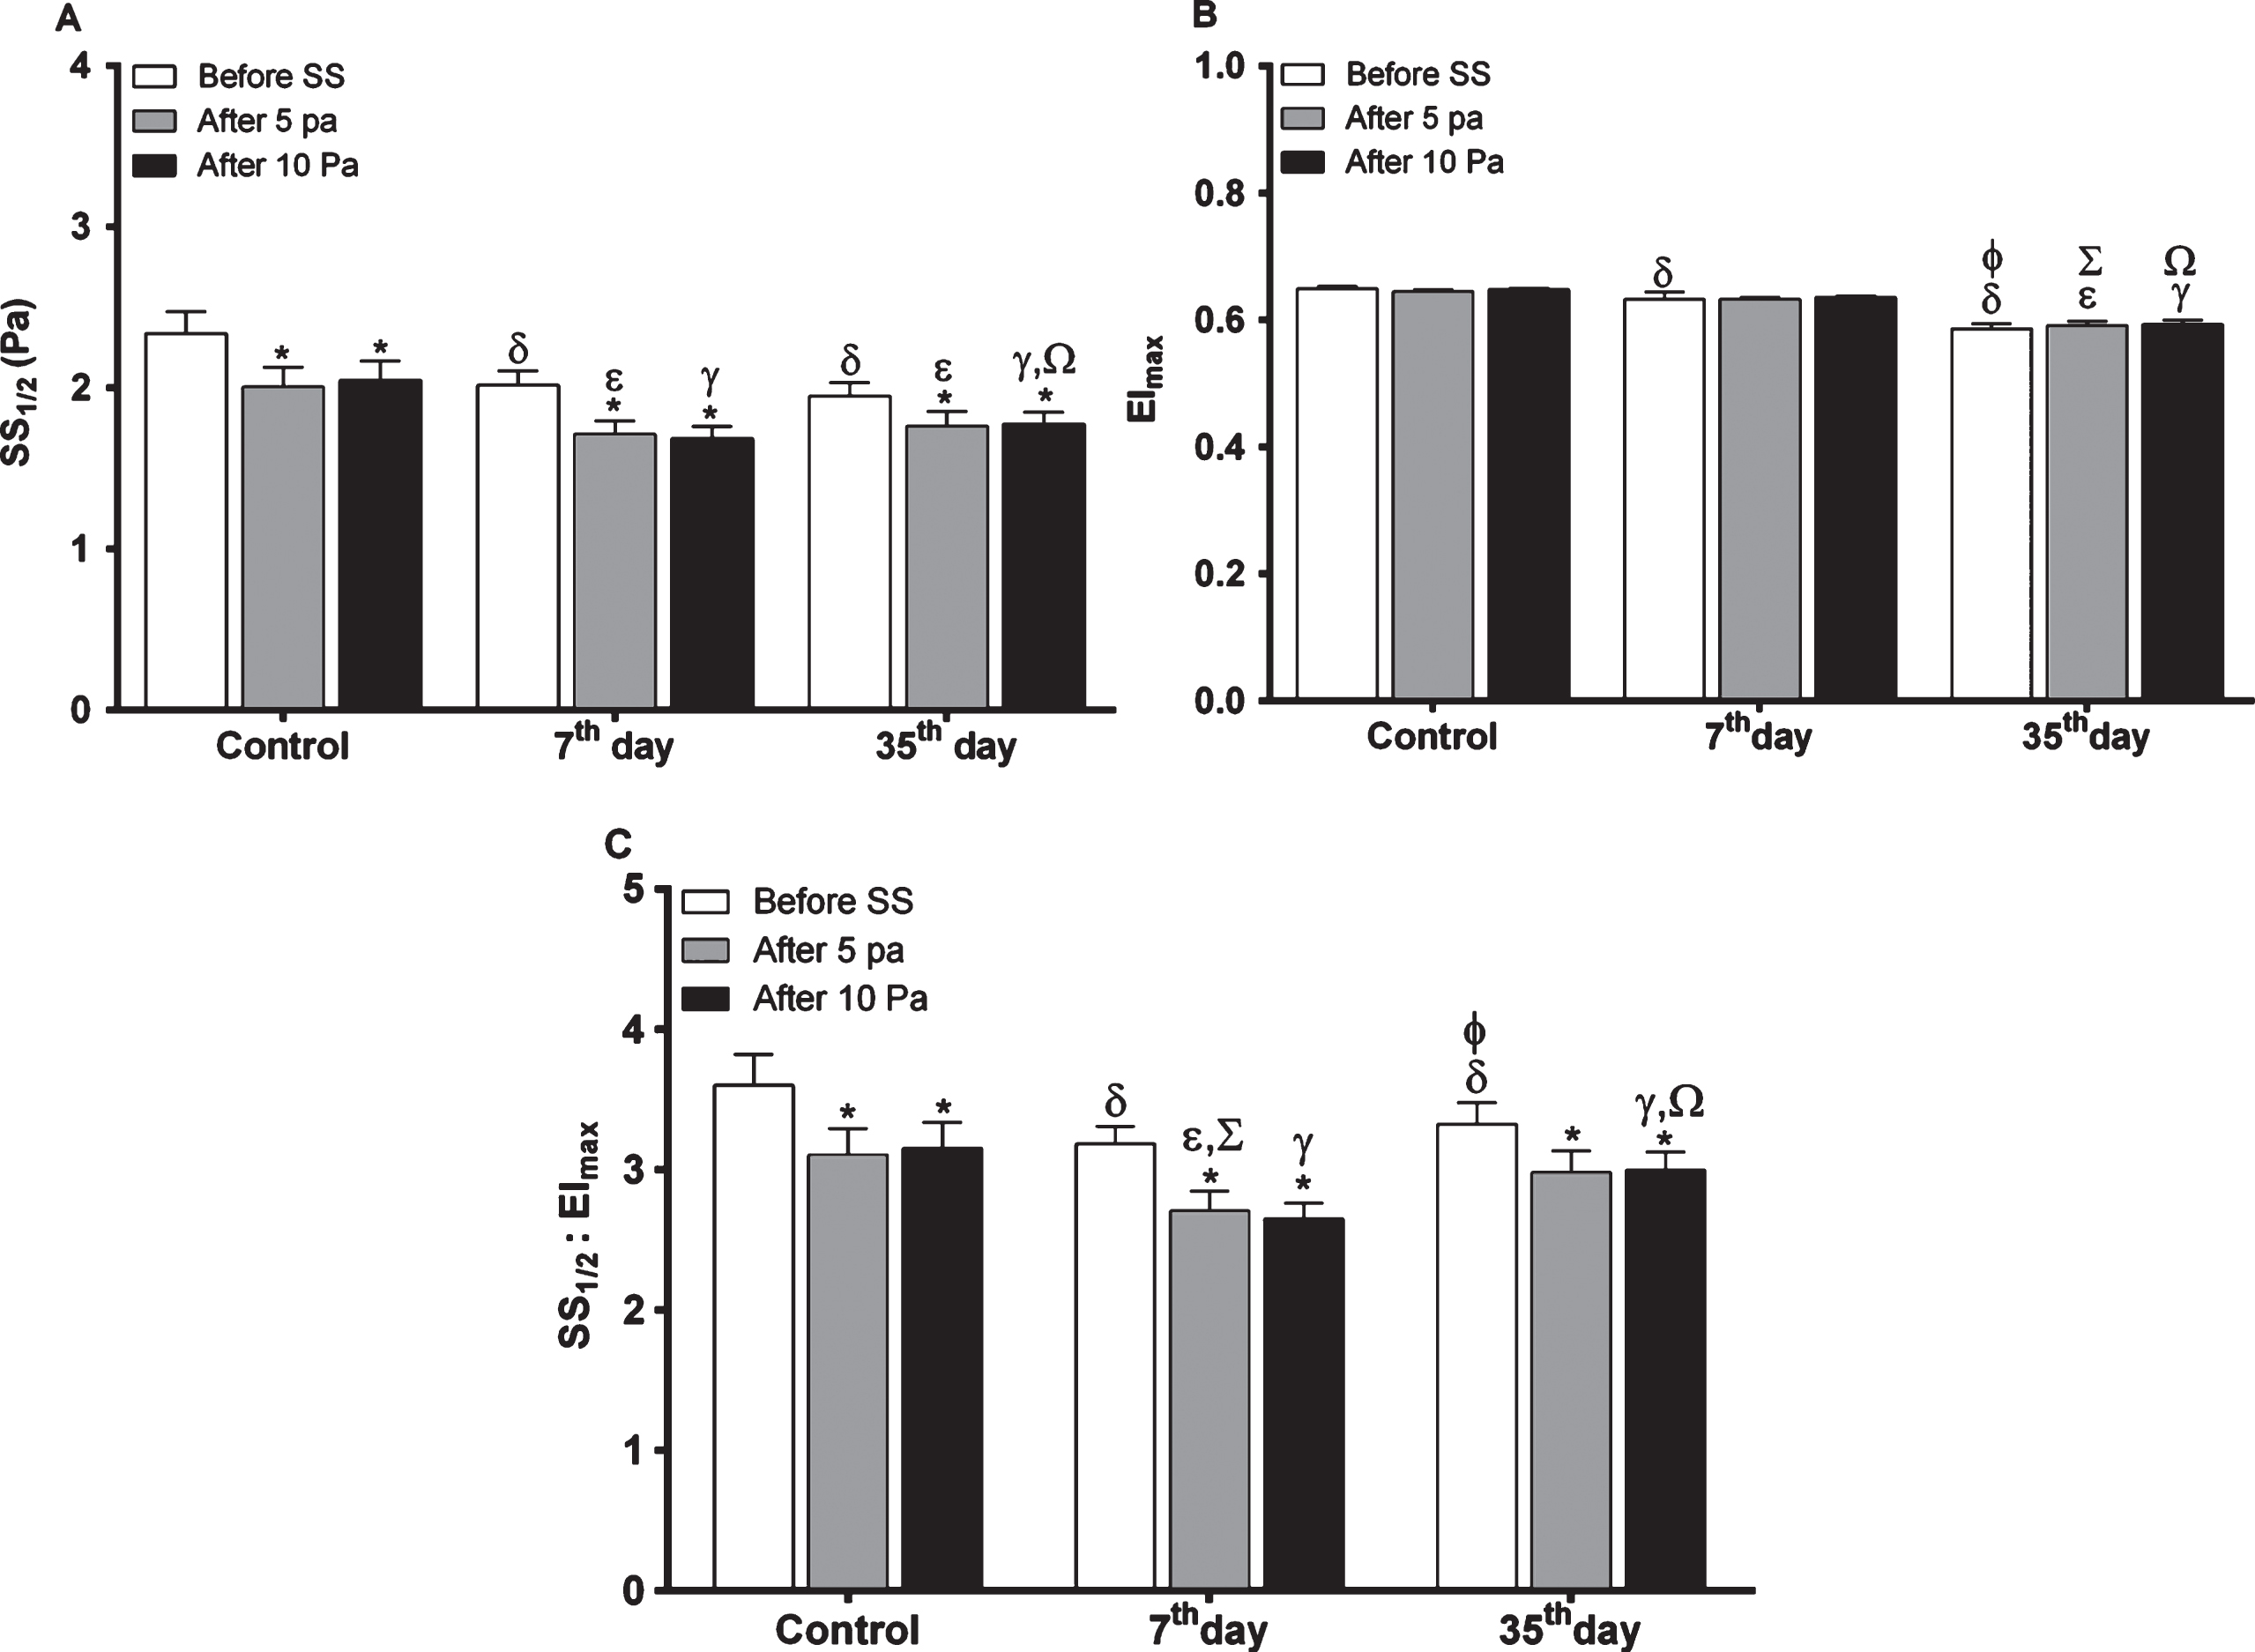
EImax and SS1/2 values before and after continuous SS were calculated using the data from deformability curves. SS1/2 values in all groups were decreased after applying SS. SS1/2 values of the control group were significantly higher than that of 7th and 35th day groups before and after SS (p≤0.0001, Fig. 1A). On the 35th day of storage, SS1/2 values were increased compared to 7th day group after applying 10 Pa SS, though it was not significant after 5 Pa. Before the application of any continuous stress, EImax values of the control group were significantly different when compared to the 7th and 35th day groups (p≤0.01 and p≤0.0001, respectively). EImax values before applying continuous SS showed a decreasing trend depending on the storage (Fig. 1B) and they were also significantly different between the 7th and 35th day groups (p≤0.0001). Similar results were obtained upon applying continuous 5 and 10 Pa SS. EImax values of the 35th day group were significantly decreased compared to the control and 7th day groups after the application of 5 and 10 Pa SS (p≤0.0001, Fig. 1B). Control group exhibited the highest EImax values before or after the application of SS. Maximal EI decreased as the storage time increased and this decreasing trend was more prominent in blood stored for 35 days. Similar results were obtained in the ratio of SS1/2 and EImax values, that they were reduced by applying 5 and 10 Pa shear stresses in all groups. Fresh RBCs as control group had the highest level of SS1/2/EImax. Blood stored for 35 days had significantly increased SS1/2/EImax values after continuous SS application compared to that of the samples stored for 7 days, and a significant elevation was also observed before the continuous SS application (Fig. 1C).
Fig.1
The levels of EImax, SS1/2 and SS1/2/EImax values in all studied samples (n = 11 in each group) before and after continuous SS. (A) SS1/2 levels in each group before and after continuous shear stress (SS). (B) EImax levels in each group before and after continuous shear stress (SS). (C) SS1/2/EImax levels in each group before and after continuous shear stress (SS). Significance between before and after SS in each group: *p≤0.05, significance of control group with 7th and 35th day groups before SS: δp≤0.05, significance of control group with 7th and 35th day groups after 5 Pa SS: ɛp≤0.05, significance of control group with 7th and 35th day groups after 10 Pa SS: γp≤0.05, significance between 7th and 35th day groups before SS: φp≤0.05, significance between 7th and 35th day groups after 5 Pa SS: Σp≤0.05, significance between 7th and 35th day groups after 10 Pa SS: Ωp≤ 0.05.
4.2Time course of the change in elongation indexes with applied shear stresses in stored blood
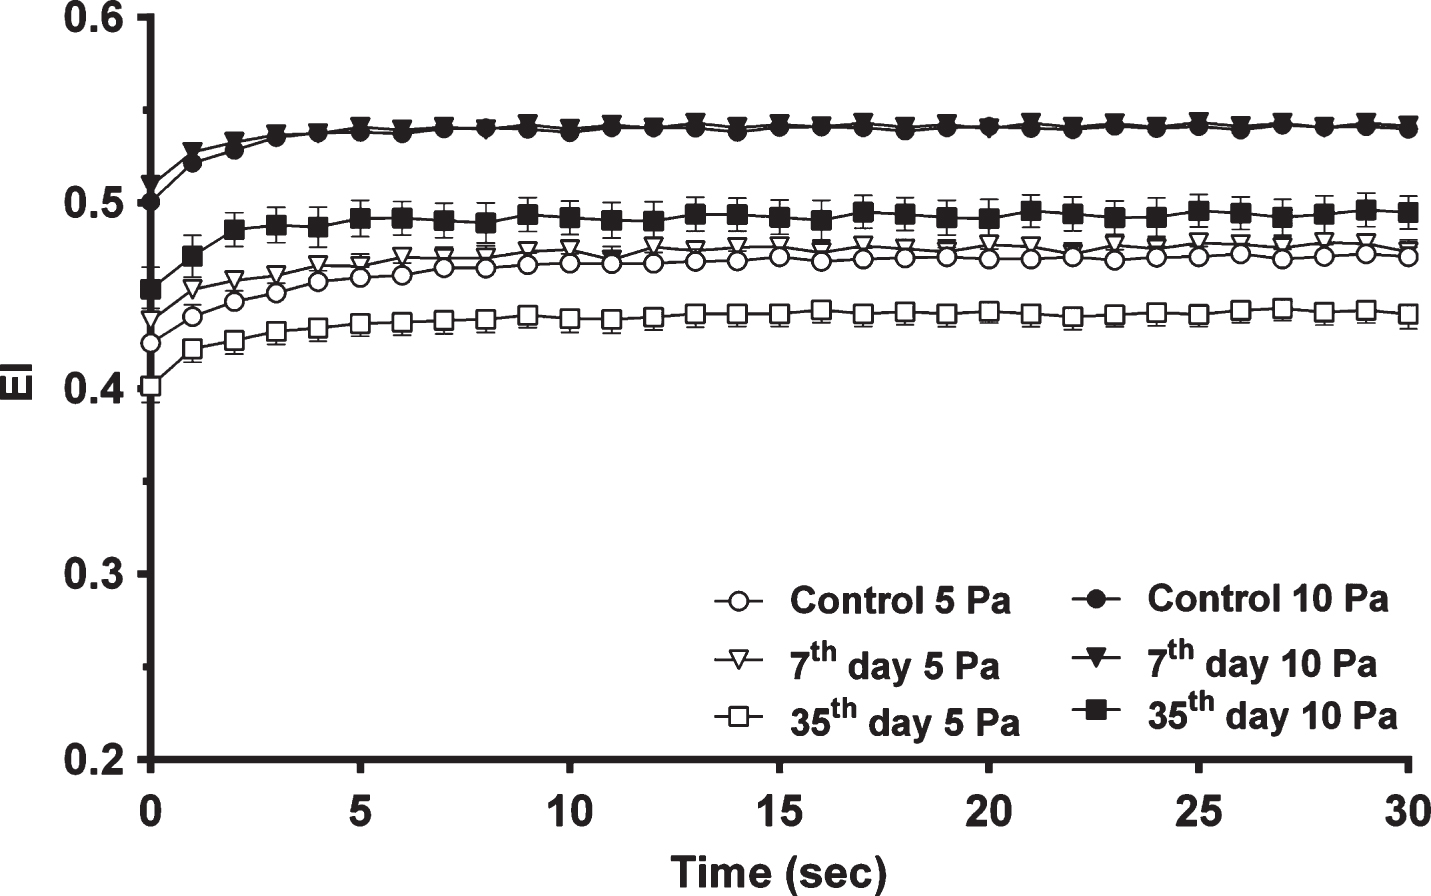
Continuous 5 and 10 Pa SS were applied for 300 seconds and the mean EI values of all samples changing with respect to time are shown in Fig. 2, focusing on the first 30 seconds. The mean EI values of the control and 7th day groups were on the same level, whereas the mean EI values of the 35th day group decreased compared to others. Elongation indexes increased exponentially in the first 1–4 seconds with applied SS and then reached a plateau phase. RBC EI values of fresh blood samples in the control group were increased by ∼11% to a plateau of 0.47±0.0006 with a time constant of 3.85±0.060 seconds with 5 Pa SS and increased by ∼8% to a plateau of 0.54±0.0003 with a time constant of 1.58±0.022 seconds with 10 Pa SS application (Fig. 2). On the 7th day of storage, EI values were increased by ∼9% to a plateau of 0.48±0.0005 with a time constant of 3.94±0.069 seconds with 5 Pa SS. It was increased by ∼6% to a plateau of 0.54±0.0003 with a time constant of 1.61±0.027 seconds with exposure to 10 Pa SS. On the 35th day of storage, EI values were increased by ∼10% to a plateau of 0.44±0.0007 with a time constant of 3.45±0.088 seconds with 5 Pa SS. It was increased by ∼9% to a plateau of 0.50±0.0009 with a time constant of 2.01±0.073 seconds upon 10 Pa SS. Thus, as the applied SS increased, EI of all samples increased, and reached more rapidly to the plateau phase (Fig. 2).
Fig.2
The change in EI with time in all studied samples (n = 11 in each group) at 5 and 10 Pa SS.
4.3Deformability of metabolically depleted blood before and after shear stress applications
RBC deformability of blood samples was measured on the 1st day of blood collection (control group) and after 48 hours of incubation (metabolic depletion group). RBC deformability increased in both control and metabolic depletion groups after applying continuous 5 and 10 Pa SS. In the control group, the significant increase in RBC deformability was observed between 0.3–9.09 Pa levels after applying continuous 5 Pa SS, whereas the significant increase after continuous 10 Pa SS was observed at all applied SS levels except 50 Pa. RBC deformability of the metabolically depleted blood significantly increased between SS levels of 0.3–5.15 Pa after exposure to 5 Pa SS (p < 0.05, Table 2). After applying 10 Pa SS, RBC deformability significantly increased between SS levels of 0.3–16.04 Pa in the metabolic depletion group (p < 0.05, Table 2). Metabolically depleted blood samples had higher EI values than the control samples before and after the application of continuous 5 and 10 Pa SS (p < 0.05, Table 2). RBC deformability in metabolic depletion group increased up to 16.04 Pa level compared to control group after exposure to continuous 5 and 10 Pa SS. The mechanic stress-induced improvement in deformability was statistically significant between the levels of 0.3 and 9.09 Pa upon application to 5 Pa SS (p < 0.05). Estimated change in RBC deformability was 2.9% at the SS level of 9.09 Pa. After applying 10 Pa SS, the improvement in deformability was statistically significant between the levels of 0.3 and 5.15 Pa (p < 0.05, Table 2). This significant increment in deformability was 5.1% at 5.15 Pa level.
Table 2
Deformability measurements (EI = Mean±SD) before and after continuous shear stress (SS) in the fresh blood (1st day) and metabolically depleted blood samples (after 48 hours) (n = 10 in each group)
| Shear Stress (Pa) | Control (Before SS) | After 5 Pa SS | After 10 Pa SS | |||
| EI | EI | EI | ||||
| 1st day | After 48 h | 1st day | After 48 h | 1st day | After 48 h | |
| 0.3 | 0.033±0.03 | 0.059±0.01δ | 0.070±0.03* | 0.085±0.02*,δ | 0.069±0.02χ | 0.08±0.02χ,δ |
| 0.53 | 0.033±0.02 | 0.114±0.02δ | 0.129±0.03* | 0.142±0.02*,δ | 0.125±0.03χ | 0.139±0.03χ,δ |
| 0.94 | 0.164±0.03 | 0.191±0.02δ | 0.199±0.03* | 0.216±0.03*,δ | 0.199±0.03χ | 0.215±0.03χ,δ |
| 1.65 | 0.252±0.03 | 0.294±0.02δ | 0.288±0.03* | 0.320±0.02*,δ | 0.288±0.02χ | 0.317±0.02χ,δ |
| 2.91 | 0.347±0.03 | 0.393±0.02δ | 0.376±0.03* | 0.411±0.02*,δ | 0.378±0.02χ | 0.410±0.02χ,δ |
| 5.15 | 0.431±0.02 | 0.468±0.01δ | 0.452±0.02* | 0.477±0.01*,δ | 0.456±0.02χ | 0.479±0.01χ,δ |
| 9.09 | 0.499±0.02 | 0.520±0.01δ | 0.511±0.02* | 0.525±0.01δ | 0.516±0.02χ | 0.528±0.01χ |
| 16.04 | 0.548±0.02 | 0.556±0.01 | 0.555±0.02 | 0.562±0.01 | 0.560±0.01χ | 0.563±0.01χ |
| 28.32 | 0.585±0.02 | 0.582±0.01 | 0.590±0.02 | 0.586±0.01 | 0.594±0.01χ | 0.587±0.01 |
| 50.0 | 0.612±0.01 | 0.599±0.02δ | 0.615±0.01 | 0.603±0.01 | 0.618±0.01 | 0.603±0.02δ |
*Significant difference between before and after the application of shear stress (SS) of 5 Pa (p < 0.05). χSignificant difference between before and after 10 Pa (p < 0.05). δSignificant difference between 1st day and after 48 h (p < 0.05).
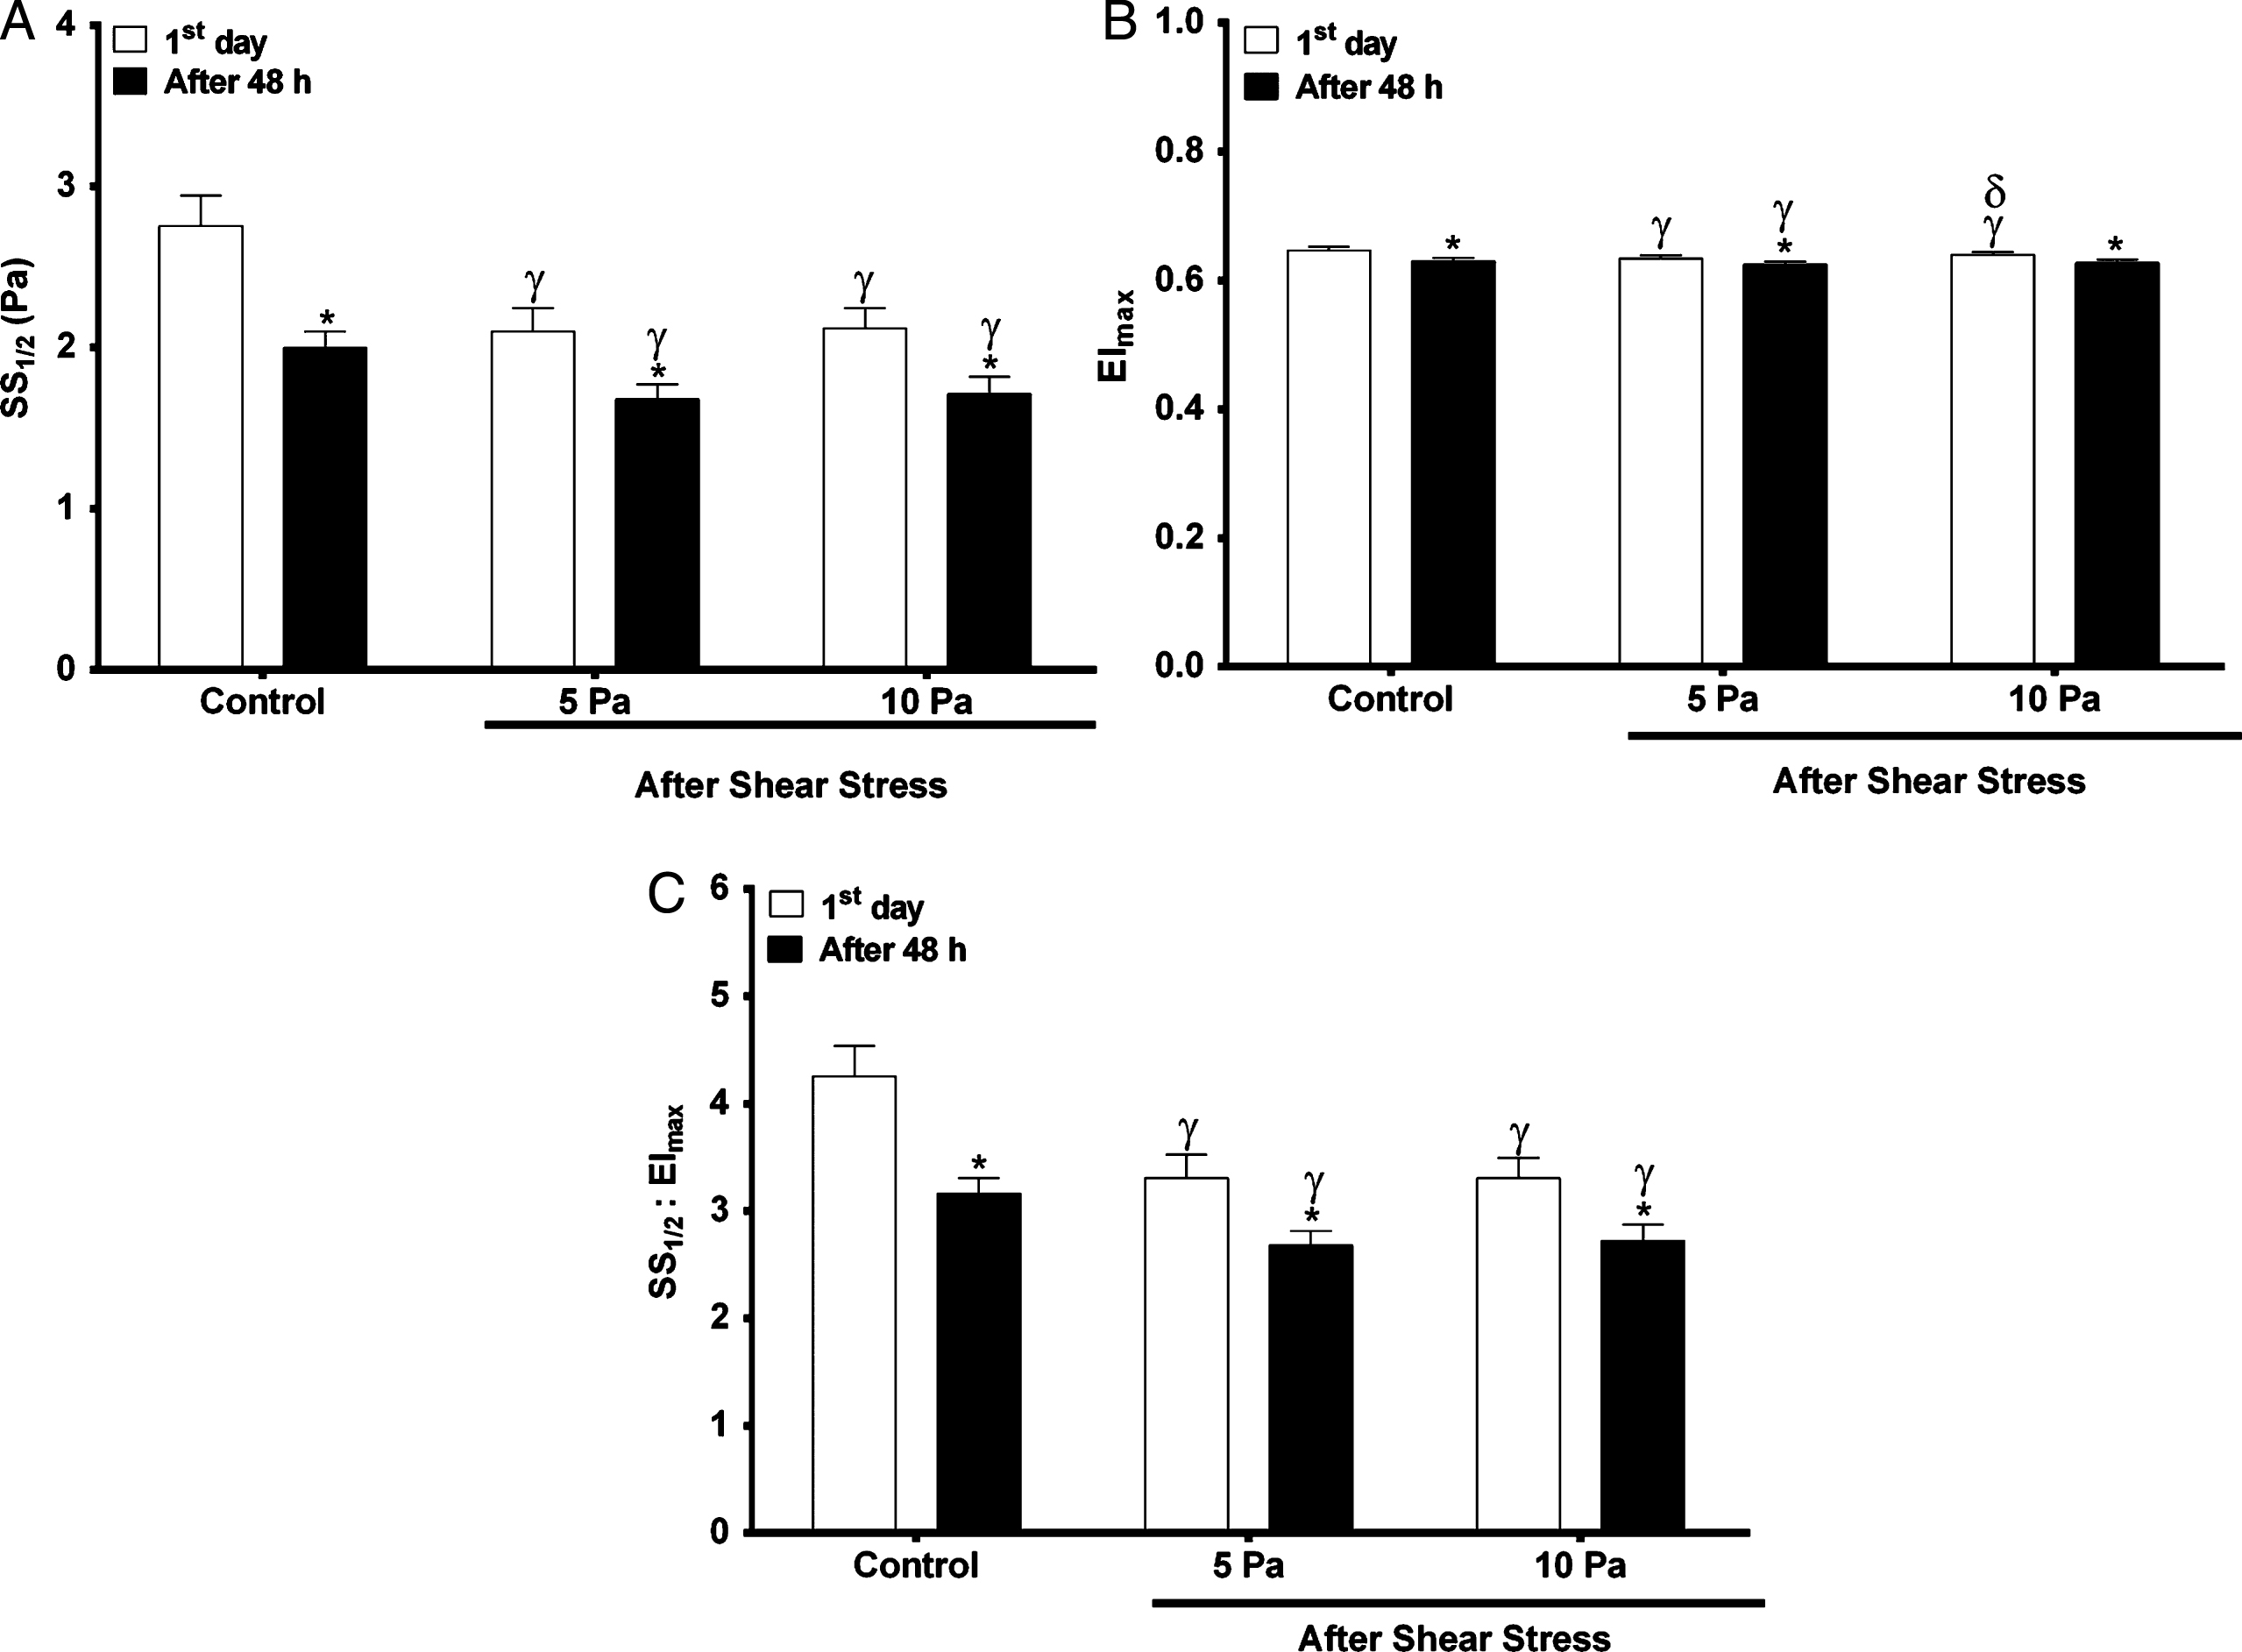
Figure 3 demonstrates SS1/2 and EImax values of blood samples in control and metabolic depletion groups, as both parameters were significantly reduced after 48 hours of incubation (Fig. 3A and 3B). This significant decrease in both parameters was also observed after continuous SS applications of 5 and 10 Pa, however, EImax values after applying 10 Pa SS did not significantly change in depleted group compared to the fresh blood samples (Fig. 3B). Accordingly, SS1/2/EImax values were also reduced after 48 hours of incubation followed by continuous 5 and 10 Pa SS (Fig. 3C).
Fig.3
The levels of SS1/2, EImax and SS1/2/EImax values before (control) and after continuous SS. Fresh blood samples (1st day, n = 10) are shown with white bars, metabolically depleted blood samples (after 48 hours, n = 10) are shown with black bars. (A) SS1/2 levels in each group before and after continuous SS. (B) EImax levels in each group before and after continuous SS. (C) SS1/2/EImax levels in each group before and after continuous SS. Significance between the 1st day and after 48 hours of incubation: *p≤0.05, significance of control with 5 and 10 Pa SS on the 1st day and after 48 hours of incubation:γ p≤0.05, significance between 5 and 10 Pa SS on the 1st day: δp≤0.05.
4.4Time course of the change in elongation indexes with applied shear stresses in metabolically depleted blood
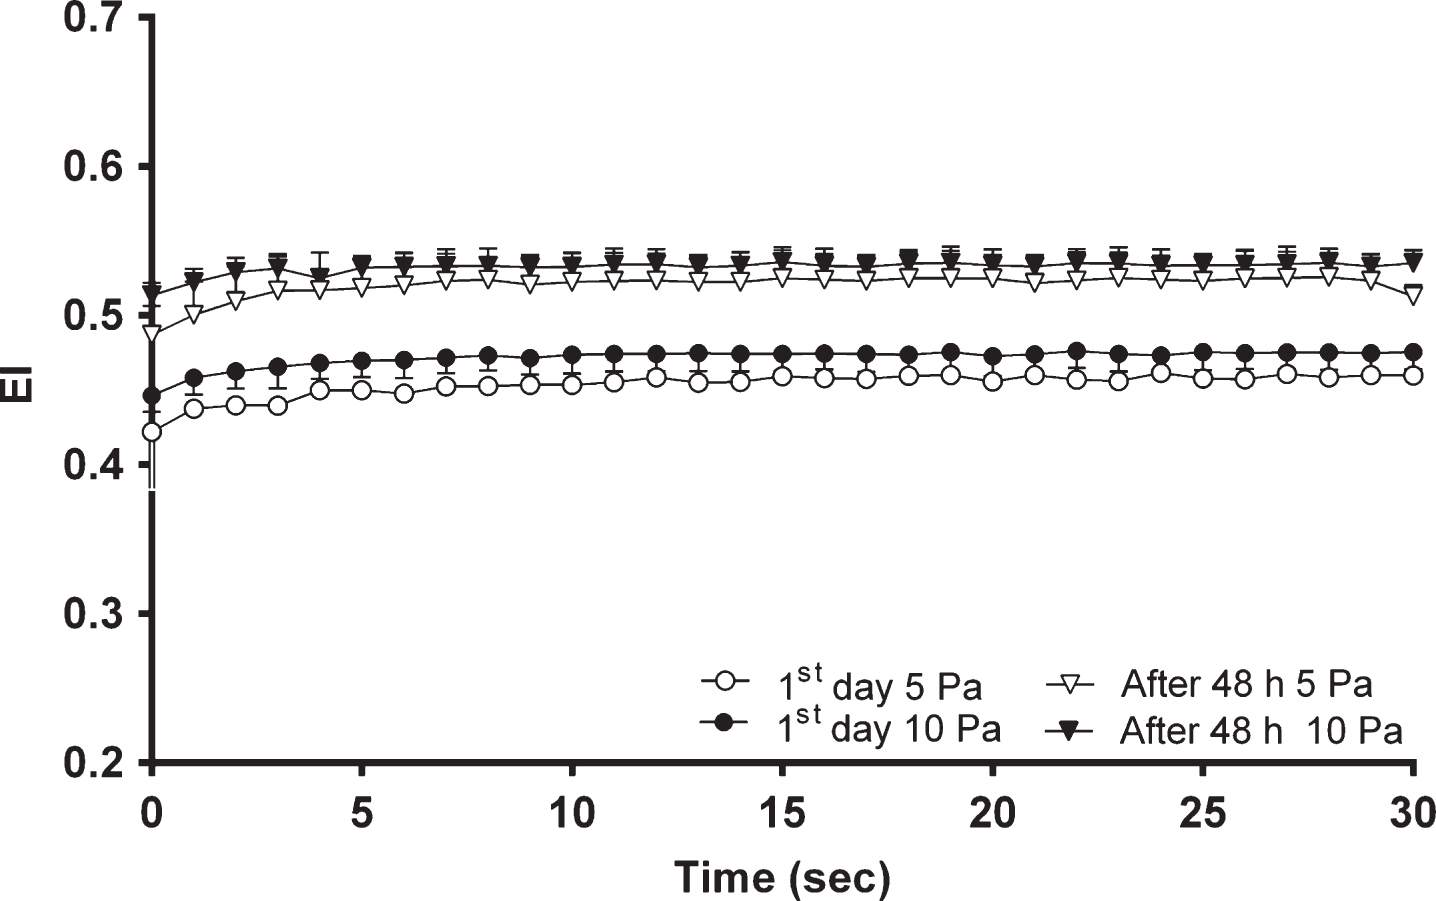
Figure 4 demonstrates the changes in EI for the first 30 seconds with continuous SS applications of 5 and 10 Pa in fresh and metabolically depleted blood. The mean EI values of blood depleted for 48 hours increased compared to the samples on the first day of blood collection. EI values of the control group elevated ∼9% to a plateau of 0.46±0.004 with a time constant of 4.22±0.3 seconds with 5 Pa SS and ∼6% to a plateau of 0.48±0.0008 with a time constant of 2.74±0.06 seconds upon application of 10 Pa SS. EI values of depleted blood increased ∼7% to a plateau of 0.52±0.0014 with a time constant of 2.14±0.07 seconds with 5 Pa SS and ∼4% to a plateau of 0.53±0.0006 with a time constant of 2.09±0.05 seconds upon exposure to a continuous 10 Pa SS (Fig. 4).
Fig.4
The change in EI with time on the 1st day and after 48 hours (n = 10 in each group) at 5 and 10 Pa SS.
5Discussion
Storage of blood causes irreversible changes in biochemical and biomechanical properties of red blood cells. RBCs become metabolically depleted as the energy levels decrease. The geometric characteristics of the cells are impaired and they become more rigid. Their ability to change shape in response to mechanical stresses is further diminished, though this unique ability of RBCs to deform is essential for maintaining a healthy microvasculature. In this study, the improvement in RBC deformability in relation to the level of applied SS was revealed in two different storage models; metabolic depletion for 48 hours and cold storage with CPDA-1 for 35 days. RBC deformability, as a response to the physiological levels of SS (5 and 10 Pa), was improved in depleted blood though it was impaired in blood samples stored for longer periods with CPDA-1.
Several studies have shown that RBC deformability is reduced by storage and the level of reduction in deformability is associated with the period of the storage [10, 13–15]. Present study investigated the changes in RBC deformability in response to continuous physiological SS, in stored blood, on the 7th and 35th days of storage with fresh blood samples. RBCs in stored blood were found to have less capacity to deform than the fresh cells. Moreover, RBC deformability of blood stored for longer periods (35 days) was reduced significantly more than the blood stored for 7 days. This finding confirms the notion that RBC deformability decreases during storage. Interestingly, RBC deformability of the blood stored for 7 days slightly increased compared to the fresh samples though it was not significant, and the significant change occurred on the 35th day of storage. These findings are similar to the observations in other studies [13–15, 22]. However, the level of reduction in deformability during storage varies among different studies. The two most plausible explanations for this discrepancy are the storage of RBCs in different storage solutions and different measurement techniques to determine the level of deformability. In literature, the cell flow properties analyzer (CFA) [17, 23], micropipette aspiration technique [14], micropore filtration technique [13], spatial light interference microscope [24], optical tweezers [25], microfluidic slit-flow ektacytometer [15] and laser-assisted optical rotational cell analyzer (LORRCA) [16, 26–28] were used to measure the alterations in RBC deformability during storage. Some of these studies demonstrated that upon storage, RBC deformability decreased by 1% while in some of them this goes up to 34%. In the present study using LORRCA, at high SS levels, deformability before continuous SS application was reduced by 1% upon 7 days of storage and 5% upon 35 days of storage. Interestingly, different reduction levels in deformability were also observed in studies using the same technique (laser ektacytometer, LORRCA). For instance, 2-3% reduction in deformability at high SS (30–50 Pa) was observed in some of the studies [16, 26, 27], while the reduction of deformability was recorded as 45% in another [28]. This could be due to the use of different storage solutions for preserving RBCs instead of the techniques used to measure the deformability. Additives in storage solutions such as adenine and mannitol are proposed to recover the storage lesions into a better extent[28, 29].
In physiological SS between 0.94–2.91 Pa levels, a significant increase in deformability was observed in blood stored for 7 days. At high levels of SS more than 5.15 Pa, a significant decrease in RBC deformability was recorded in the blood stored for 35 days. These findings are consistent with some other studies using the same technique [16, 27]. After applying continuous 5 Pa SS to fresh samples, the improvement in RBC deformability was observed up to 5.15 Pa level, which is consistent with the literature [18]. This phenomenon indicates that CPDA usage in this study has no negative effect on the mechanical properties of RBCs. On the other hand, SS1/2, EImax and SS1/2 /EImax values decreased by the duration of storage (Fig. 1). Often, a decrease in SS1/2 values represents an improvement in deformability but sometimes this situation may be related to a reduced EImax which reflects an impaired deformability [21].
In the present study, before applying continuous SS, there was an insignificant increase in deformability with storage at low levels of SS (0.3 Pa). Interestingly, after applying continuous SS, the improvement in deformability became significant at low levels of SS in both storage models. However a significant decrease in deformability was observed in the blood stored for 35 days at high SS levels greater than 2.91 Pa. This biphasic behavior of the stored blood at high and low levels of SS was shown in this study for the first time by applying continuous SS. Henkelman et al. explained this situation as a gradual increase in MCV during storage which might be responsible for the reduction in deformability at high SS because the cell volume becomes a limiting factor for the ability of RBCs to deform [16]. The surface area to volume ratio (S/V) of the cell and the viscosity of the cytoplasm are important determinants of RBC deformability in addition to the mechanical properties of the RBC membrane. It has been known for a long time that RBCs progressively lose their normal discoid shape during storage and become echinocytes [30]. Number of abnormally shaped RBCs were shown to gradually increase due to the storage period and be associated with reduced deformability indexes [13]. Additionally, Zehnder et al. showed that the viscosity of stored RBCs significantly increased at the end of the storage and this was related to a decrease in RBC deformability [31]. More importantly, deformability is determined by the viscoelasticity of RBC membrane which is defined by the interactions between phospholipid bilayer and cytoskeleton. During the period of storage, oxidative stress is observed in cytoskeletal proteins which may change the phosphorylation status of Band 3 and thereby affects the interaction between integral membrane and cytoskeleton proteins [32]. Alterations in signaling pathways in RBCs are possibly caused by the decreased phosphorylation which is a reasonable explanation for the reduction in deformability due to storage [6]. The relationship between the storage of RBCs and the reduction in deformability is observed in a hemodynamic study which demonstrates cell orientations within flow conditions. Accordingly, fresh cells are shown to be swinging and trembling in order to maintain an orientation within the flow, whereas stored cells are observed to be tumbling which is an end-over-end rotation like rigid bodies [33]. In addition, Simmonds et al. observed decreased deformability at high SS and increased deformability at low SS (<1 Pa) after applying continuous SS to RBCs. They assumed this finding indicates the occurrence of cell tumbling in shear flow and therefore mechanical damage [34]. Different mechanical behaviors of stored RBCs at high and low SS could be due to rigidity of the cell which is associated with impaired deformability.
This study also demonstrated that the metabolic depletion of blood for 48 hours at room temperature caused an increase in the measured deformability of the RBCs. Although a reduction in deformability was recorded at high levels of SS greater than 28.32 Pa, it was not statistically significant. On the other hand, a decreasing trend in SS1/2 and EImax values was observed in the depleted blood compared to fresh samples which suggests an improvement in deformability upon metabolic depletion. These findings are in agreement with one of the studies conducted by Uyuklu et al. as they stated that after 24 hours of incubation at room temperature, the SS1/2 values decreased which indicated an increase in the measured deformability [35]. On the other hand, Park et al. reported that a metabolic depletion for 24 hours at 37°C resulted in ATP reduction which is associated with a loss of biconcave shape of RBCs and echinocyte shape transformation [36]. Reinhart et al. demonstrated that plasma glucose levels became unmeasurably low after 24 hours of incubation and ATP content of RBCs reduced accordingly. They also concluded that the normal asymmetric distribution of phospholipids in the membrane is maintained by an ATP-dependent mechanism which is a likely explanation for the echinocyte shape of depleted RBCs [37]. In addition, Reinhart et al. earlier showed that the changes in cell geometry and shape lead to a decrease in the RBC deformability [38]. The main reason for the presence of contradictory results in the literature might be that older RBCs undergo hemolysis at higher SS exposures. It is known that metabolically younger cells have more capacity to deform and they also are able to produce more ATP [6, 39]. This occurrence may have resulted in a false increase in deformability values in this study since only the young and metabolically active RBCs were subjected to measurements. Accordingly, metabolic depletion was studied by Reinhart et al. with the use of density-separated RBCs since the top 10–20% of the RBC fraction contains young cells and the bottom 10–20% of the fraction contains primarily old RBCs [37]. Such separation techniques could provide accurate results in deformability measurements.
RBC response to continuous SS was more rapid as the applied SS was increased from 5 to 10 Pa. This observation is consistent with the findings of Meram et al. as they stated that the time constant is inversely proportional to the level of applied SS [18]. Additionally, RBC response of metabolically depleted group to continuous SS was more delayed than the RBC response of blood stored for 7 days, however it was faster than the response of blood stored for 35 days. This finding indicates that RBC response to continuous SS was more rapid upon CPDA addition in the first 7 days though this response became impaired after 35 days. Mechanical behaviors of RBCs might be impaired by the period of storage regardless of CPDA usage. On the other hand, CPDA could have improved mechanical responses of RBCs to a limited extent as there was a drastic decrease in the deformability of blood stored for 35 days. CPDA is widely used in blood storage for transfusion. However, the shelf life of stored blood should be considered with CPDA usage since RBC responses to mechanical stress were impaired after longer periods of storage.
6Conclusions
In conclusion; our study is the first to describe that RBC deformability as a response to continuous shear stress is improved in early storage conditions. However it is impaired due to longer storage time. This observation in the present study reveals the aberrant hemorheological changes of blood during storage. The alterations in shear-induced deformability response by virtue of storage lesions may be more important in critically ill patients when the restrictive transfusion thresholds are exceeded. In addition, we hope that our study influences new storage strategies for the conditions where thetransfusion thresholds are insufficient such as acute coronary syndrome and chronic transfusion-dependent anemia.
Acknowledgments
This study was supported by Turkish Scientific and Technical Council grant SBAG-214S186. There is no potential conflict of interest, real or perceived by the authors.
References
[1] | Baskurt O.K. and Meiselman H.J. , Blood rheology and hemodynamics, Semin Thromb Hemost 29: (5) ((2003) ), 435–450. |
[2] | Bosman G.J. , Cluitmans J.C. , Groenen Y.A. , Werre J.M. , Willekens F.L. and Novotny V.M. , Susceptibility to hyperosmotic stress-induced phosphatidylserine exposure increases during red blood cell storage, Transfusion 51: (5) ((2011) ), 1072–1078. |
[3] | Barshtein G. , Manny N. and Yedgar S. , Circulatory risk in the transfusion of red blood cells with impaired flow properties induced by storage, Transfus Med Rev 25: (1) ((2011) ), 24–35. |
[4] | Tinmouth A. , Fergusson D. , Yee I.C. , Hebert P.C. and A. Investigators and G. Canadian Critical Care Trials, Clinical consequences of red cell storage in the critically ill, Transfusion 46: (11) ((2006) ), 2014–2027. |
[5] | Blasi B. , D’Alessandro A. , Ramundo N. and Zolla L. , Red blood cell storage and cell morphology, Transfus Med 22: (2) ((2012) ), 90–96. |
[6] | Cluitmans J.C. , Hardeman M.R. , Dinkla S. , Brock R. and Bosman G.J. , Red blood cell deformability during storage: Towards functional proteomics and metabolomics in the Blood Bank, Blood Transfus 10: (Suppl 2) ((2012) ), s12–8. |
[7] | Hess J.R. , An update on solutions for red cell storage, Vox Sang 91: (1) ((2006) ), 13–19. |
[8] | Valeri C.R. , Valeri D.A. , Gray A. , Melaragno A. , Dennis R.C. and Emerson C.P. , Viability and function of red blood cell concentrates stored at 4 degrees C for 35 days in CPDA-1, CPDA-2, or CPDA-3, Transfusion 22: (3) ((1982) ), 210–216. |
[9] | D’Alessandro A. , Kriebardis A.G. , Rinalducci S. , Antonelou M.H. , Hansen K.C. , Papassideri I.S. , et al., An update on red blood cell storage lesions, as gleaned through biochemistry and omics technologies, Transfusion 55: (1) ((2015) ), 205–219. |
[10] | Card R.T. , Mohandas N. , Perkins H.A. and Shohet S.B. , Deformability of stored red blood cells, Relationship to degree of packing, Transfusion 22: (2) ((1982) ), 96–101. |
[11] | Hess J.R. , Red cell storage, J Proteomics 73: (3) ((2010) ), 368–373. |
[12] | Wagner G.M. , Chiu D.T. , Qju J.H. , Heath R.H. and Lubin B.H. , Spectrin oxidation correlates with membrane vesiculation in stored RBCs, Blood 69: (6) ((1987) ), 1777–1781. |
[13] | Berezina T.L. , Zaets S.B. , Morgan C. , Spillert C.R. , Kamiyama M. , Spolarics Z. , et al., Influence of storage on red blood cell rheological properties, J Surg Res 102: (1) ((2002) ), 6–12. |
[14] | d’Almeida M.S. , Jagger J. , Duggan M. , White M. , Ellis C. and Chin-Yee I.H. , A comparison of biochemical and functional alterations of rat and human erythrocytes stored in CPDA-1 for 29 days: Implications for animal models of transfusion, Transfus Med 10: (4) ((2000) ), 291–303. |
[15] | Frank S.M. , Abazyan B. , Ono M. , Hogue C.W. , Cohen D.B. , Berkowitz D.E. , et al., Decreased erythrocyte deformability after transfusion and the effects of erythrocyte storage duration, Anesth Analg 116: (5) ((2013) ), 975–981. |
[16] | Henkelman S. , Dijkstra-Tiekstra M.J. , de Wildt-Eggen J. , Graaff R. , Rakhorst G. and van Oeveren W. , Is red blood cell rheology preserved during routine blood bank storage? Transfusion 50: (4) ((2010) ), 941–948. |
[17] | Relevy H. , Koshkaryev A. , Manny N. , Yedgar S. and Barshtein G. , Blood banking-induced alteration of red blood cell flow properties, Transfusion 48: (1) ((2008) ), 136–146. |
[18] | Meram E. , Yilmaz B.D. , Bas C. , Atac N. , Yalcin O. , Meiselman H.J. , et al., Shear stress-induced improvement of red blood cell deformability, Biorheology 50: (3-4) ((2013) ), 165–176. |
[19] | Hardeman M.R. , Goedhart P.T. , Dobbe J.G.G. , Lettinga K.P. , Laser-assisted optical rotational cell analyzer (lorca): A new instrument for measurement of various structural hemorheological parameters, Clin Hemorheol 14: ((1994) ), 605–618. |
[20] | Baskurt O.K. , Hardeman M.R. , Uyuklu M. , Ulker P. , Cengiz M. , Nemeth N. , et al., Parameterization of red blood cell elongation index–shear stress curves obtained by ektacytometry, Scand J Clin Lab Invest 69: (7) ((2009) ), 777–788. |
[21] | Sonmez M. , Ince H.Y. , Yalcin O. , Ajdzanovic V. , Spasojevic I. , Meiselman H.J. , et al., The effect of alcohols on red blood cell mechanical properties and membrane fluidity depends on their molecular size, PLoS One 8: (9) ((2013) ), e76579. |
[22] | La Celle P.L. , Alteration of deformability of the erythrocyte membrane in stored blood, Transfusion 9: (5) ((1969) )238–245. |
[23] | Barshtein G. , Gural A. , Manny N. , Zelig O. , Yedgar S. and Arbell D. , Storage-induced damage to red blood cell mechanical properties can be only partially reversed by rejuvenation, Transfus Med Hemother 41: (3) ((2014) ), 197–204. |
[24] | Bhaduri B. , Kandel M. , Brugnara C. , Tangella K. and Popescu G. , Optical assay of erythrocyte function in banked blood, Sci Rep 4: ((2014) ), 6211. |
[25] | Huruta R.R. , Barjas-Castro M.L. , Saad S.T. , Costa F.F. , Fontes A. , Barbosa L.C. , et al., Mechanical properties of stored red blood cells using optical tweezers, Blood 92: (8) ((1998) ), 2975–2977. |
[26] | Bennett-Guerrero E. , Veldman T.H. , Doctor A. , Telen M.J. , Ortel T.L. , Reid T.S. , et al., Evolution of adverse changes in stored RBCs, Proc Natl Acad Sci U S A 104: (43) ((2007) ), 17063–17068. |
[27] | Karger R. , Lukow C. and Kretschmer V. Deformability of Red Blood Cells and Correlation with ATP Content during Storage as Leukocyte-Depleted Whole Blood, Transfus Med Hemother 39: (4) ((2012) ), 277–282. |
[28] | van Bommel J. , de Korte D. , Lind A. , Siegemund M. , Trouwborst A. , Verhoeven A.J. , et al., The effect of the transfusion of stored RBCs on intestinal microvascular oxygenation in the rat, Transfusion 41: (12) ((2001) ), 1515–1523. |
[29] | Hogman C.F. , Preparation and preservation of red cells, Vox Sang 74: (Suppl 2) ((1998) ), 177–187. |
[30] | Haradin A.R. , Weed R.I. and Reed C.F. , Changes in physical properties of stored erythrocytes relationship to survival in vivo, Transfusion 9: (5) ((1969) ), 229–237. |
[31] | Zehnder L. , Schulzki T. , Goede J.S. , Hayes J. and Reinhart W.H. , Erythrocyte storage in hypertonic (SAGM) or isotonic (PAGGSM) conservation medium: Influence on cell properties. Vox Sang 95: (4) ((2008) ), 280–287. |
[32] | Pantaleo A. , Ferru E. , Giribaldi G. , Mannu F. , Carta F. , Matte A. , et al., Oxidized and poorly glycosylated band 3 is selectively phosphorylated by Syk kinase to form large membrane clusters in normal and G6PD-deficient red blood cells, Biochem J 418: (2) ((2009) ), 359–367. |
[33] | Yalcin O. , Ortiz D. , Tsai A.G. , Johnson P.C. and Cabrales P. , Microhemodynamic aberrations created by transfusion of stored blood, Transfusion 54: (4) ((2014) ), 1015–1027. |
[34] | Simmonds M.J. , Atac N. , Baskurt O.K. , Meiselman H.J. and Yalcin O. , Erythrocyte deformability responses to intermittent and continuous subhemolytic shear stress, Biorheology 51: (2-3) ((2014) ), 171–185. |
[35] | Uyuklu M. , Cengiz M. , Ulker P. , Hever T. , Tripette J. , Connes P. , et al., Effects of storage duration and temperature of human blood on red cell deformability and aggregation. Clin Hemorheol Microcirc 41: (4) ((2009) ), 269–278. |
[36] | Park Y. , Best C.A. , Auth T. , Gov N.S. , Safran S.A. , Popescu G. , et al., Metabolic remodeling of the human red blood cell membrane, Proc Natl Acad Sci U S A 107: (4) ((2010) ), 1289–1294. |
[37] | Reinhart S.A. , Schulzki T. , Bonetti P.O. and Reinhart W.H. , Studies on metabolically depleted erythrocytes, Clin Hemorheol Microcirc 56: (2) ((2014) ), 161–173. |
[38] | Reinhart W.H. and Chien S. , Red cell rheology in stomatocyte-echinocyte transformation: Roles of cell geometry and cell shape, Blood 67: (4) ((1986) ), 1110–1118. |
[39] | Dumont L.J. , D’Alessandro A. , Szczepiorkowski Z.M. and Yoshida T. , CO2, -dependent metabolic modulation in red blood cells stored under anaerobic conditions, Transfusion 56: (2) ((2016) ), 392–403. |


