
Blood hyperviscosity in acute and recent COVID-19 infection
Abstract
BACKGROUND:
Elevated estimated blood viscosity (EBV), derived from hematocrit and globulins, is associated with thrombotic complications, organ failure, and higher mortality in COVID-19 patients. Although informative, EBV does not account for cellular interactions or fibrinogen.
OBJECTIVE:
Investigate whether patients with acute and recent COVID-19 have altered whole blood viscosity (WBV) when measured at both high and low shear rates using in vitro blood samples from patients.
METHODS:
Cross-sectional study of 58 patients: 15 in the intensive care unit with acute COVID-19, 32 convalescent (9 < 8weeks [W] from acute infection, 23 > 8 W), and 11 controls without COVID-19. WBV was measured at high (300 s–1) and low (5 s–1) shear rates (HSR, LSR) using a scanning capillary viscometer.
RESULTS
Acute and convalescent patients < 8 W had mean WBV at LSR (16.0 centipoise [cP] and 15.1 cP) and HSR (5.1 cP and 4.7 cP). Mean WBV of convalescent > 8 W and control patients were 12.3 cP and 13.0 cP at LSR, and 4.1 cP and 4.2 cP at HSR. Acute and < 8 W patients had significantly higher WBV at both HSR and LSR compared to patients > 8 W (all p≤0.01). No significant differences in WBV were observed between acute and < 8 W patients, or between patients > 8 W and controls.
CONCLUSIONS:
Hyperviscosity provides a possible explanation for thrombotic risk in acute and convalescent (< 8 W) patients. These findings have important implications for thromboprophylaxis.
1Introduction
Severe coronavirus disease 2019 (COVID-19) is characterized by immune dysfunction, unbridled production of proinflammatory cytokines, and disordered endothelial homeostasis [1]. Disturbed endothelial, thrombotic and fibrinolytic balance induced by the acute inflammatory phase of severe acute respiratory syndrome coronavirus 2 (SARS-CoV2) infection promotes arterial and venous thrombosis. Thrombotic complications contribute to organ dysfunction and to morbidity and mortality in COVID-19 patients [1–4]. Contrast enhanced ultrasonography in COVID-19 patients with imminent organ failure have demonstrated arterial narrowing and delayed capillary filling with areas of inflammatory hyperemia, indicating decreased regional perfusion [5, 6].
Excessive cytokine production induces hepatic synthesis of fibrinogen, the scaffold for clot formation. Acute phase mediated increases in fibrinogen promote erythrocyte aggregates, increased blood viscosity and hemostasis. Blood hyperviscosity itself induces endothelial injury and impedes blood flow further escalating thrombotic risk, as described by Virchow’s triad [1, 7–10].
Estimates of blood hyperviscosity, derived from hematocrit and globulin concentrations, have been associated with higher organ failure and mortality in patients hospitalized with acute COVID-19 [11–15]. However, estimated blood viscosity (EBV) neither accounts for acute phase changes in leukocytes and platelets and their intercellular interactions nor fibrinogen. This is the first study examining directly measured whole blood viscosity (WBV) in hospitalized COVID-19 patients during acute and convalescent phases of the disease.
2Methods
The aim of this study is to investigate whether patients with acute and recent COVID-19 have altered WBV profiles. We conducted a cross-sectional study from 58 patients at a large, metropolitan, tertiary care hospital, recruited between July 2020 and February 2022. We included 15 patients hospitalized in the intensive care unit (ICU) with acute COVID-19, 32 convalescent patients, and 11 controls from the outpatient setting without history of COVID-19. Of the 32 convalescent patients, 9 were < 8 weeks (W) from acute infection, and 23 were > 8 W. WBV was measured at high (300 s–1) and low (5 s–1) shear rates using a scanning capillary viscometer (Hemathix™ Blood Analyzer; RheoVector, LLC, King of Prussia, PA, USA). Baseline patient characteristics were evaluated by one-way analysis of variance (ANOVA) for continuous variables and exact Fisher’s test for categorical variables. Comparisons of WBV between groups were analyzed by t-test. For each comparison, the statistical power exceeded 80% when using a mean difference of 0.2 and significance level of either 0.01 or 0.05. ANOVA with post-hoc test was performed to clarify differences between particular groups. This study was approved by the institutional review board at the Icahn School of Medicine at Mount Sinai, New York, NY (IRB Study-20-00937, approved 7/13/2020).
3Results and discussion
The average age of all COVID-19 patients was 58 years (range 26–86 years; 23 female, 24 male) and that of controls was 63 years (range 44–83 years; 5 female, 6 male) (Table 1). The differences in race between groups were significant (p < 0.001). Body-mass index was statistically homogeneous across all groups. Among convalescent < 8 W patients, 22.2% (2/9) required hospital admission during their COVID-19 course compared to 30.4% (7/23) of convalescent > 8 W patients. There were no significant group differences in comorbidities that are risk factors for blood hyperviscosity and thrombosis, such as history of cancer and coronary artery disease. In the convalescent > 8 W group, one person had amyloidosis and one had Factor V Leiden thrombophilia.
Table 1
Characteristics of the patients at baseline
| Characteristic | Acute (n = 15) | Convalescent < 8 W (n = 9) | Convalescent > 8 W (n = 23) | Controls (n = 11) | p-value |
| Age—year* | 60.4±14.7 | 57.2±18.9 | 55.1±15.1 | 63.1±10.8 | 0.48 |
| Male sex—no. (%) | 10 (66.7) | 4 (44.4) | 10 (43.5) | 6 (54.6) | 0.52 |
| Race—no. (%) | *** | ||||
| Asian | 1 (6.7) | 0 (0) | 2 (8.7) | 1 (9.1) | |
| Black | 3 (20.0) | 0 (0) | 8 (34.8) | 2 (18.2) | |
| White | 9 (60.0) | 9 (100.0) | 13 (56.5) | 8 (72.7) | |
| Hispanic | 2(13.3) | 0(0) | 0(0) | 0(0) | |
| Body-mass index*† | 27.6±3.5 | 31.6±7.0 | 30.9±6.8 | 29.9±7.1 | 0.83 |
| Hospitalized—no. (%) | 15 (100.0) | 0 (0) | 0 (0) | 0 (0) | *** |
| Medical History—no. (%) | |||||
| Prior deep vein thrombosis | 4 (30.8) | 0 (0) | 3 (13.0) | 2 (18.2) | 0.29 |
| or pulmonary embolism | |||||
| Coronary artery disease | 3 (23.1) | 2 (22.2) | 8(34.8) | 6 (54.6) | 0.37 |
| Stroke | 2 (15.4) | 0 (0) | 4 (17.4) | 1 (9.1) | 0.72 |
| Peripheral vascular disease | 1 (7.7) | 0 (0) | 7 (30.4) | 2 (18.2) | 0.18 |
| Hypertension | 8 (57.1) | 3 (33.3) | 17 (73.9) | 7 (63.6) | 0.21 |
| Diabetes mellitus/Pre-diabetes mellitus | 5 (35.7) | 3 (33.3) | 10 (43.5) | 6 (54.6) | 0.76 |
| Chronic kidney disease | 1 (7.7) | 0 (0) | 4 (17.4) | 2 (18.2) | 0.60 |
| Chronic obstructive | 4 (30.8) | 2 (22.2) | 8 (34.8) | 4 (36.4) | 0.93 |
| pulmonary disease/asthma | |||||
| History of cancer | 2 (15.4) | 3 (33.3) | 3 (13.0) | 1 (9.1) | 0.53 |
| Smoking History | 0.68 | ||||
| Non-smoker | 8 (61.5) | 5 (55.6) | 11 (50.0) | 4 (36.4) | |
| Former smoker | 5 (38.5) | 4 (44.4) | 10 (45.5) | 5 (45.5) | |
| Current smoker | 0 (0) | 0 (0) | 1 (4.5) | 2 (18.1) |
* Plus–minus values are means±standard deviation. †The body-mass index is the weight in kilograms divided by the square of the height in meters. Note: Continuous variables (age and BMI) are analyzed by ANOVA and category variables are analyzed by Fisher’s exact test.
The mean WBV of acute patients was 5.1 centipoise (cP) at high shear rate (HSR) and 16.0 cP at low shear rate (LSR). For convalescent patients < 8 W, mean WBV was 4.7 cP and 15.1 cP at HSR and LSR respectively. Convalescent patients > 8 W had a mean WBV of 4.1 cP and 12.3 cP at HSR and LSR. The mean WBV of control patients was 4.2 cP at HSR and 13.0 cP at LSR (Fig. 1).
Fig. 1
WBV is significantly higher in patients with acute COVID-19 and in convalescent patients < 8 W than in controls and convalescent patients > 8 W. Data expressed as means±standard deviation. Statistical analysis done with ANOVA with Dunnett’s test: mean difference in whole blood viscosity (95% Confidence Intervals). cP, centipoise; ***, significant; W, weeks; WBV, whole blood viscosity.
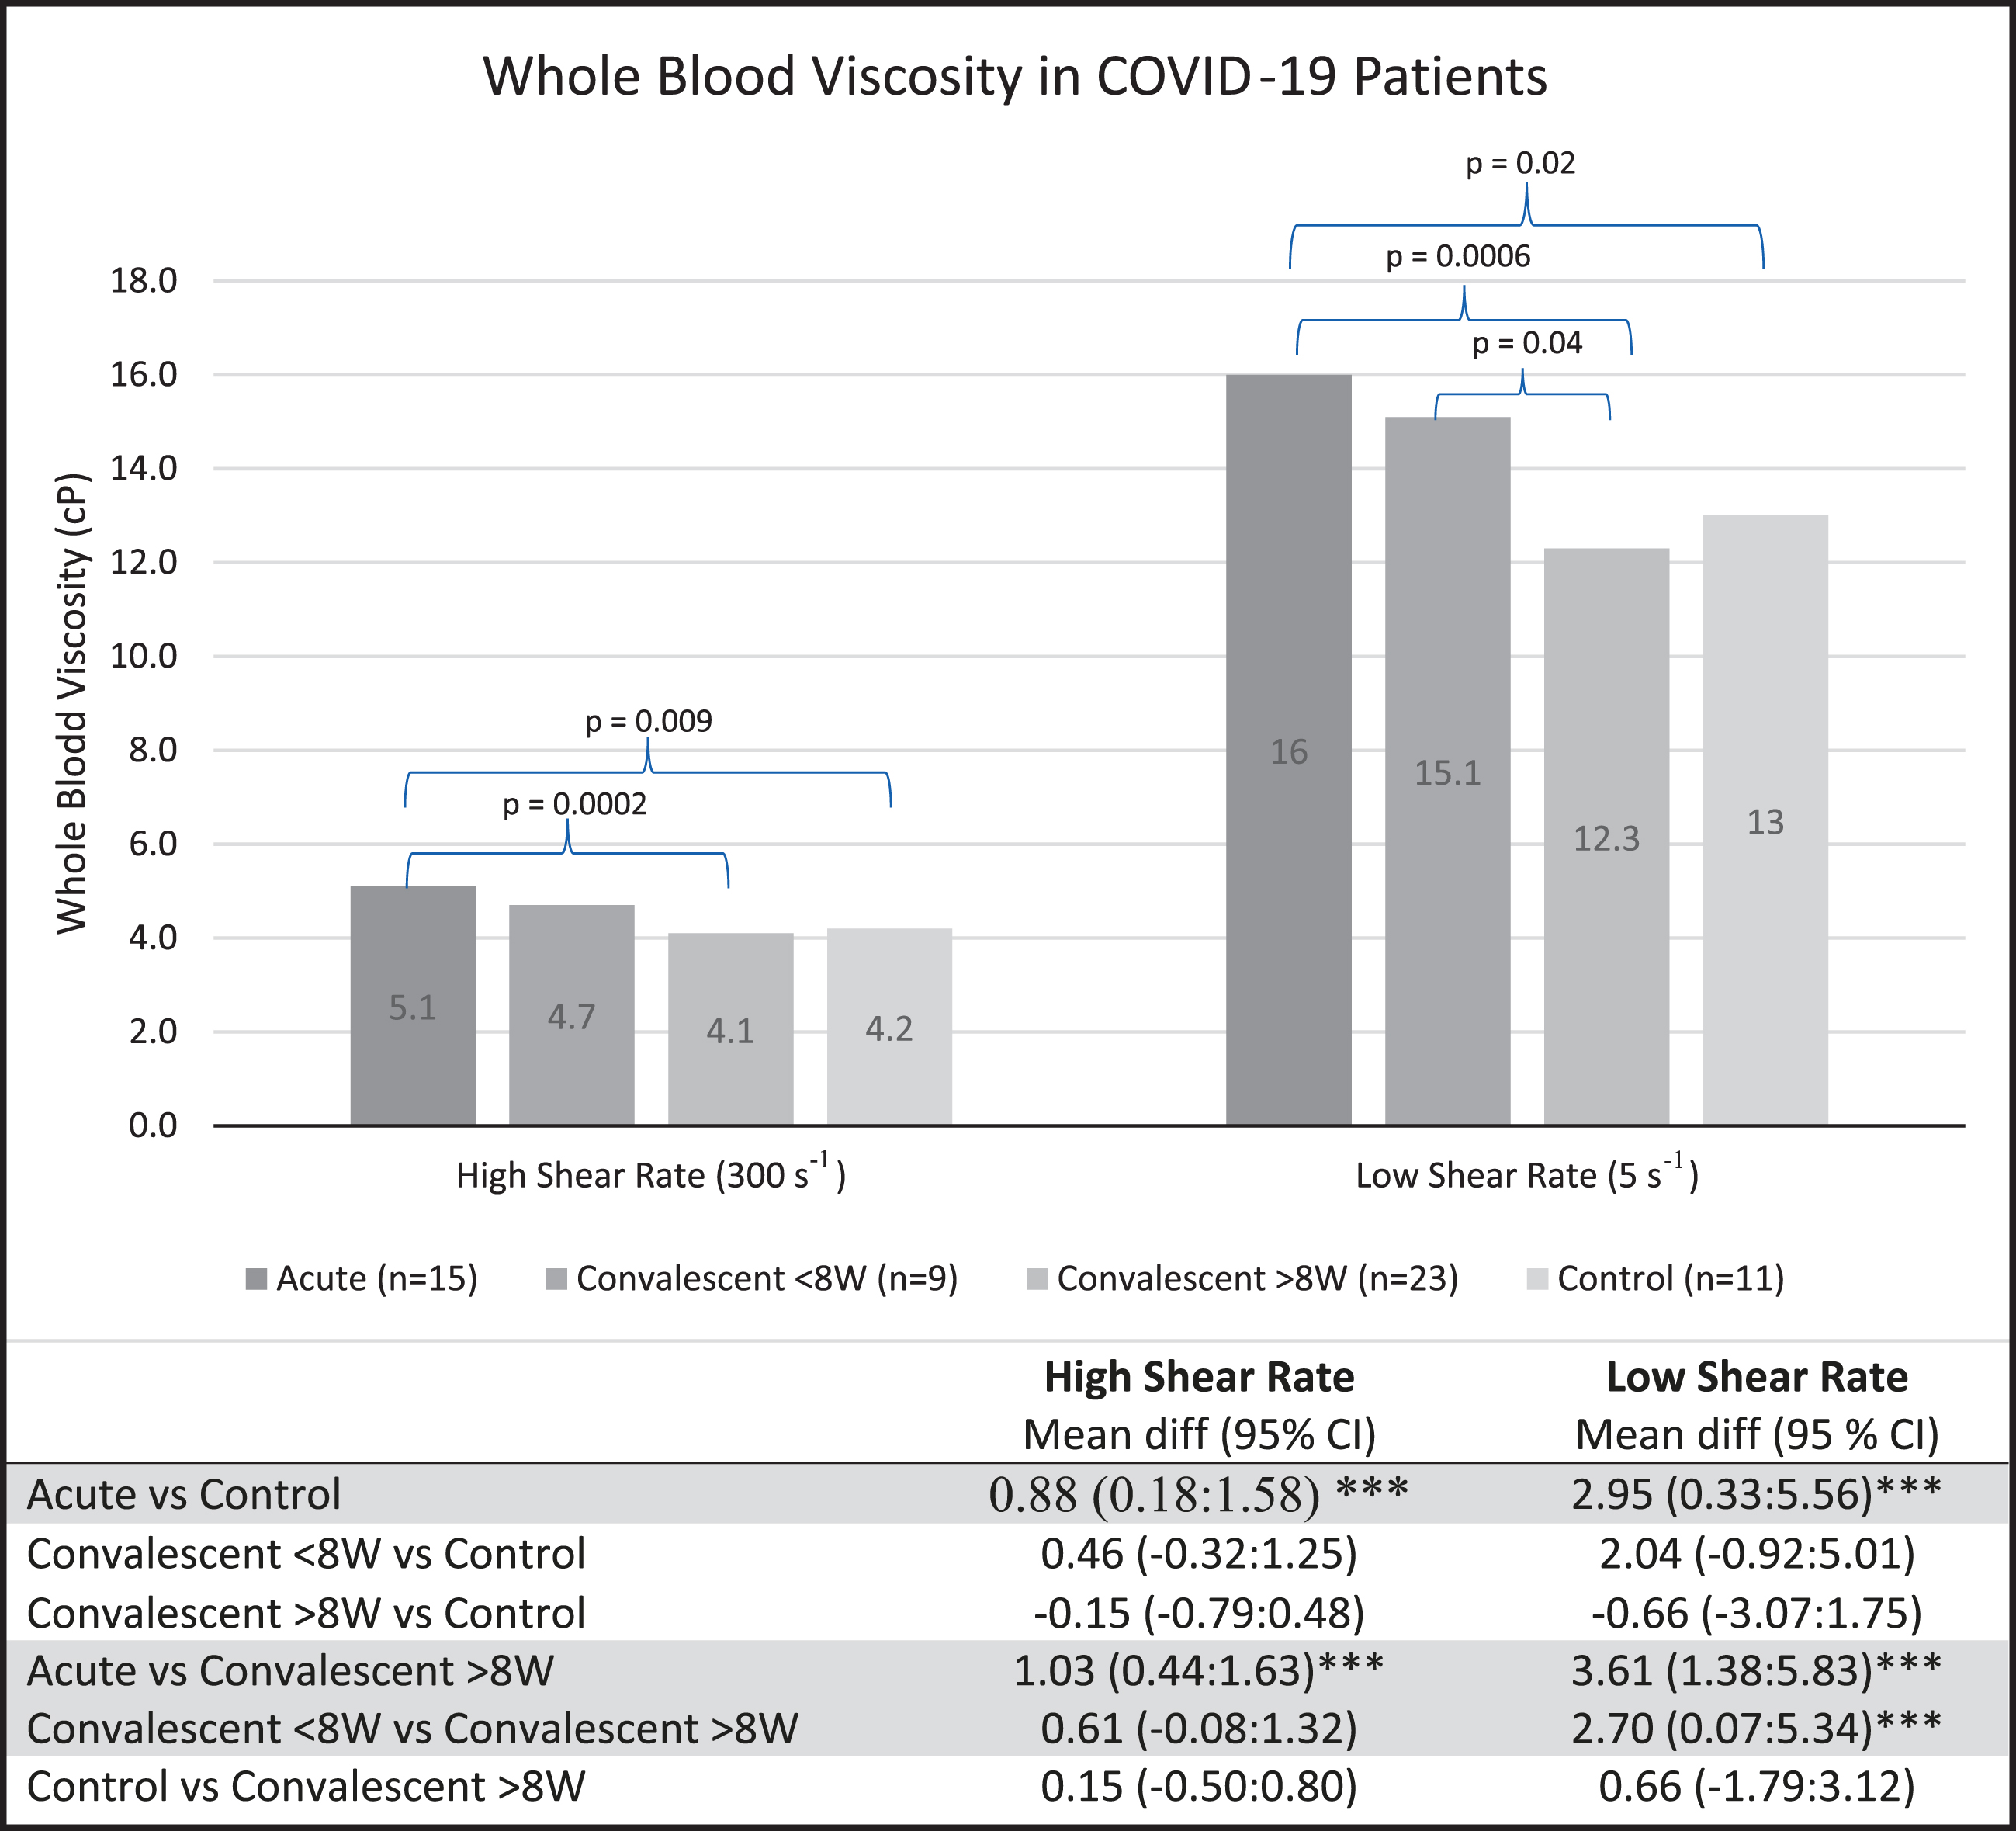
Acute patients had significantly higher WBV compared to both controls and convalescent patients > 8 W (both p≤0.01; Fig. 1). Compared to > 8 W patients, those < 8 W had significantly higher WBV at HSR and LSR (both p < 0.01). No significant differences in WBV were observed between acute and convalescent patients < 8 W, or between > 8 W patients and controls at HSR or LSR. Mean fibrinogen levels were 582.3 mg/dL in acute patients, 346.7 mg/dL in < 8 W, 397.1 mg/dL in > 8 W, and 382.9 mg/dL in controls.
Further ANOVA testing with post hoc Dunnett’s test demonstrated no significant difference in WBV when comparing convalescent patients > 8 W or patients < 8 W with controls. However, results were significant when comparing either of the convalescent groups with the acute group. When comparing acute patients and < 8 W patients to > 8 W patients, the elevated WBV in the former groups were significant at both shear rates.
In comparing EBV, calculated using the Walburn-Schneck model, and WBV for these patients, the mean difference between the two at HSR is –0.63 cP±0.76 and –3.64 cP±2.25 at LSR [16]. The Spearman correlation coefficient between EBV and WBV at HSR is 0.64 (p < 0.0001) and 0.72 (p < 0.0001) at LSR. Thus, there is a moderate to high positive correlation between EBV and WBV at HSR and LSR. EBV consistently underestimates WBV, particularly at LSR. This reinforces the need to measure WBV to fully understand the effect of COVID-19 on blood viscosity. Of note, the Walburn-Schneck study used the Wells-Brooksfield viscometer, which has low accuracy with WBV at LSR, thus limiting comparisons of EBV to direct measurements with the Hemathix Blood Analyzer.
Additional evidence supporting the contribution of blood hyperviscosity to thrombotic complications of COVID-19 derives from several sources [11–15]. An ex vivo study of whole blood from 37 acutely ill COVID patients demonstrated hyperactivated platelet-erythrocyte interactions with extensive fibrinogen deposits. Fibrinogen deposits from platelet-poor plasma were significantly more viscous than controls (p = 0.02) and more hypercoagulable by thromboelastography [11]. Another study used scanning electron microscopy, fluorescence microscopy, and mass spectrometry to demonstrate that the addition of the SARS-CoV-2 spike protein S1 subunit to platelet-poor plasma from health volunteers results in structural changes to fibrin, complement 3, and prothrombin, causing impairment of fibrinolysis [12]. In France, a preliminary study of 7 patients with COVID-19 found increased red blood cell (RBC) aggregation at low shear and decreased RBC deformability, though surprisingly no difference in blood viscosity (measured by cone/plate viscometer) was observed in comparison to controls [13]. In a series of 15 critically ill COVID-19 patients admitted to the Emory University Hospital ICU and treated with anticoagulation, fibrinogen levels and plasma viscosity exceeded the 95th percentile in all subjects. Among four patients with plasma viscosity > 3.5 cP, all had thrombotic complications despite anticoagulation. Plasma viscosity was highly correlated with Sequential Organ Failure Assessment scores (r = 0.841, p < 0.0001) [14]. Similarly, a retrospective observational study from Thailand of 41 children and adults with COVID-19 reported EBV 1.98 to 4.86-fold higher than controls [15]. These prior studies either determine plasma viscosity rather than WBV, which does not consider the critical role of cellular components of blood, or utilize formulas for EBV, which only account for hematocrit and protein concentrations. Our study avoids these limitations by directly measuring WBV in COVID-19 patients using a sensitive capillary viscometer at LSR and HSR.
The scanning capillary viscometer is more accurate in measuring low-shear blood viscosity than cone/plate rotational viscometers. This capillary viscometer was validated with comparisons with cone/plate viscometers at high-shear rate blood viscosity and with couette-type viscometers at low-shear rate blood viscosity [17]. The emphasis on WBV vs. plasma or serum viscosity provides a more physiological assessment of multiple blood components including plasma on blood flow. WBV is the only rheological parameter that aggregates the effect of multiple constituents to assess the overall ability of blood to perfuse organs or, in cases of hyperviscosity, tendency for organ congestion or hemostasis.
Most recently, a study of 172 hospitalized COVID-19 patients in Lyon, France also demonstrated increased blood viscosity measured by a Brookfield cone/plate viscometer, fibrinogen levels, RBC aggregation in these patients. More severely ill patients, requiring supplemental oxygen or with pulmonary lesions, had RBC hyper-aggregation and hyperviscosity. Increased RBC aggregation correlated positively with hospitalization duration and negatively with clot formation time [18]. Our study supports these results as those acutely ill patients in the ICU demonstrated increased viscosity when compared to convalescent patients and controls. While we did not directly measure parameters such as RBC aggregation, WBV is known to provide an accurate physiological assessment of such rheological factors. Additionally, the use of a scanning capillary viscometer here compared to the cone/plate viscometer used by Nader, et. Al supports the accuracy of the hyperviscosity findings and proposes a method for routine hospital measurement of WBV as opposed to the cone/plate viscometer.
Acute infectious and inflammatory diseases, like pneumonia, are associated with increased risk of venous thrombosis [19]. Acute phase reactants, such as fibrinogen, C-reactive protein, haptoglobin, and immunoglobulins, foster erythrocyte aggregation and increase blood viscosity [20]. This study of COVID-19 patients demonstrates persistent acute and subacute WBV elevations. We postulate that elevated WBV induces endothelial cell damage and promotes thrombosis in the microcirculation and venous system, particularly in areas of low shear with slow blood flow [7, 8].
One limitation of our study is that we did not have lipid levels. Increased levels of triglycerides, a component of acute phase reactions, have a minor contribution to blood viscosity [21]. We also did not directly measure plasma viscosity, erythrocyte aggregation, erythrocyte deformability, and the tanl treading motion. However, these factors are accounted for in the physiological aggregate of whole blood viscosity, marking its superiority to plasma viscosity measurements alone. Future studies however could include in vitro measurements of erythrocyte aggregation and deformability in order to assess the contribution of these rheological factors to hyperviscosity in COVID-19. Secondly, the significant difference in hospitalization rates between groups is expected as we selected patients in the ICU for the acute group and outpatients for controls. Acute illness in hospitalized patients can cause hyperviscosity. However, the observed hyperviscosity in unhospitalized convalescent patients indicates that COVID-19 itself contributes to WBV elevations. Thirdly, our small sample size poses another limitation. A larger study with a diverse population is needed to determine the impact of race, if any, on WBV in COVID-19 patients. When adjusted for race in our study, there was no significant difference in WBV at either HSR or LSR between groups. Additionally, the lack of significant differences in WBV in comparisons with the control group with ANOVA is likely due to small sample size. However, the differences between acute patients and both convalescent groups were significant, reinforcing a strong impact on WBV with COVID-19. These results would likely be more striking with a greater sample size and should be validated in a larger study. Additional research is also needed to identify the impact of individual SARS-CoV2 variants on WBV.
4Conclusion
Venous and arterial thrombosis leading to microcirculation and organ dysfunction are being increasingly observed as causes of morbidity in patients recovering from COVID-19 in the 4–6 weeks following hospital discharge. While less frequent than in-hospital events, there remains a residual risk of thrombosis after acute illness [22]. Previous studies demonstrated increased EBV in acutely ill COVID-19 patients. The persistent hyperviscosity 8 W after acute infection noted in our study provides an explanation for this residual risk. Where EBV was calculated using mathematical formulas in other studies, we measured WBV directly using a capillary viscometer, which is a more physiological aggregate of multiple blood components and their effect on blood flow. The capillary viscometer is also better suited for everyday hospital use than rotational viscometers.
Prior studies have demonstrated the utility of hemorheological and hemostatic parameters in prognostication for COVID-19 patients [23, 24]. The correlation between hyperviscosity and thrombotic events in COVID-19 patients, and the ease-of-use of the scanning capillary viscometer support the utility of WBV as another potential indicator of outcomes. These results have important therapeutic implications for acute and post-discharge thromboprophylaxis. A randomized control trial examining the role of therapeutic plasma exchange in reducing viscosity and its impact on outcomes in patients with COVID-19 is currently underway (NCT04441996).
Funding
This work was supported by a generous gift from Andres Mata.
Disclosures
Authors AS, QC, PM, HK, PM, HP, SNG, DJC reports no conflict of interest. RSR received research funding through his employer from Amgen, Arrowhead, National Institutes of Health, Novartis and Regeneron; consulting fees and honoraria from Amgen, Amyrt, C5, CVS Caremark, Lilly, Kowa, Novartis and Regeneron, royalties from Wolters Kluwer (UpToDate), and stock holdings in MediMergent, LLC. A. Shaik, Q. Chen, R. S. Rosenson contributed to study design, data analysis, manuscript writing and revision, and final approval. P. Mar, H-S. Kim, P. Mejia, H. Pacheco, S. N. Goonewardena, D. J. Cho contributed to data analysis, manuscript revision, and final approval.
References
[1] | Pinney SP , Giustino G , Halperin JL , et al. Coronavirus Historical Perspective, Disease Mechanisms, and Clinical Outcomes: JACC Focus Seminar. J Am Coll Cardiol. (2010) ;76: (17):1999–2010. doi: 10.1016/j.jacc.2020.08.058 |
[2] | Jung F , Krüger-Genge A , Franke RP , Hufert F , Küpper JH . COVID-19 and the endothelium. Clin Hemorheol Microcirc. (2020) ;75: (1):7–11. doi: 10.3233/CH-209007 |
[3] | Varga Z , Flammer AJ , Steiger P , et al. Endothelial cell infection and endotheliitis in COVID-19. Lancet. (2020) ;395: (10234):1417–1418. doi: 10.1016/S0140-6736(20)30937-5 |
[4] | Fransvea P , Costa G , Pepe G , et al. Acute intestinal ischemia in patients with COVID- single-centre experience and literature review. Eur Rev Med Pharmacol Sci. (2022) ;26: (4):1414–1429. doi: 10.26355/eurrev_202202_28135 |
[5] | Jung EM , Stroszczynski C , Jung F . Contrast enhanced ultrasonography (CEUS) to detect abdominal microcirculatory disorders in severe cases of COVID-19 infection: First experience. Clin Hemorheol Microcirc. (2020) ;74: (4):353–361. doi: 10.3233/CH-209003 |
[6] | Jung EM , Stroszczynski C , Jung F . Contrast enhanced ultrasound (CEUS) to assess pleural pulmonal changes in severe COVID-19 infection: First results. Clin Hemorheol Microcirc. (2020) ;75: (1):19–26. doi: 10.3233/CH-209005 |
[7] | Ahmed S , Zimba O , Gasparyan AY . Thrombosis in Coronavirus disease (COVID-19) through the prism of Virchow’s triad. Clin Rheumatol. (2020) ;39: (9):2529–2543. doi: 10.1007/s10067-020-05275-1 |
[8] | Byrnes JR , Wolberg AS . Red blood cells in thrombosis. Blood. (2017) ;130: (16):1795–1799. doi: 10.1182/blood-2017-03-745349 |
[9] | Stuart J , Lewis SM . Monitoring the acute phase response. BMJ. (1988) ;297: (6657):1143–1144. doi: 10.1136/bmj.297.6657.1143 |
[10] | Grobler C , Maphumulo SC , Grobbelaar LM , et al. Covid-19: The Rollercoaster of Fibrin(Ogen), D-Dimer, Von Willebrand Factor, P-Selectin and Their Interactions with Endothelial Cells, Platelets and Erythrocytes. Int J Mol Sci.Published Jul 21. (2020) ;21: (14):5168. Published 2020 Jul 21. doi:10.3390/ijms21145168 |
[11] | Venter C , Bezuidenhout JA , Laubscher GJ , et al. Erythrocyte, Platelet, Serum Ferritin, and P-Selectin Pathophysiology Implicated in Severe Hypercoagulation and Vascular Complications in COVID-19. Int J Mol Sci. (2020) ;21: (21):8234. 2020 Nov 3. doi:10.3390/ijms21218234 |
[12] | Grobbelaar LM , Venter C , Vlok M , et al. SARS-CoV-2 spike protein S1 induces fibrin(ogen) resistant to fibrinolysis: implications for microclot formation in COVID-19. Biosci Rep. (2021) ;41: (8):BSR20210611. doi: 10.1042/BSR20210611 |
[13] | Renoux C , Fort R , Nader E , et al. Impact of COVID-19 on red blood cell rheology. Br J Haematol. (2021) ;192: (4):e108–e111. doi: 10.1111/bjh.17306 |
[14] | Maier CL , Truong AD , Auld SC , Polly DM , Tanksley CL , Duncan A . COVID-19-associated hyperviscosity: a link between inflammation and thrombophilia? Lancet. (2020) ;395: (10239):1758–1759. doi: 10.1016/S0140-6736(20)31209-5 |
[15] | Joob B , Wiwanitkit V . Blood viscosity of COVID-19 patient: a preliminary report. Am J Blood Res. (2021) ;11: (1):93–95. Published 2021 Feb 15. |
[16] | Walburn FJ , Schneck DJ . A constitutive equation for whole human blood. Biorheology. (1976) ;13: (3):201–210. doi: 10.3233/bir-1976-13307 |
[17] | Alexy T , Wenby RB , Pais E , Goldstein LJ , Hogenauer W , Meiselman HJ . An automated tube-type blood viscometer: validation studies. Biorheology. (2005) ;42: (3):237–247. |
[18] | Nader E , Nougier C , Boisson C , et al. Increased blood viscosity and red blood cell aggregation in patients with COVID-19. Am J Hematol. (2022) ;97: (3):283–292. doi: 10.1002/ajh.26440 |
[19] | Tichelaar YI , Kluin-Nelemans HJ , Meijer K . Infections and inflammatory diseases as risk factors for venous thrombosis. A systematic review. Thromb Haemost. (2012) ;107: (5):827–837. doi: 10.1160/TH11-09-0611 |
[20] | Sloop GD , De Mast Q , Pop G , Weidman JJ , St Cyr JA . The Role of Blood Viscosity in Infectious Diseases. Cureus. (2020) ;12: (2):e7090. Published 2020 Feb 24. doi: 10.7759/cureus.7090 |
[21] | Rosenson RS , Lowe GD . Effects of lipids and lipoproteins on thrombosis and rheology. Atherosclerosis. (1998) ;140: (2):271–280. doi: 10.1016/s0021-9150(98)00144-0 |
[22] | Zuin M , Rigatelli G , Zuliani G , Roncon L . The risk of thrombosis after acute-COVID-19 infection. QJM. (2021) ;114: (9):619–620. doi: 10.1093/qjmed/hcab054 |
[23] | Xing Y , Yang W , Jin Y , Wang C , Guan X . D-dimer daily continuous tendency predicts the short-term prognosis for COVID-19 independently: A retrospective study from Northeast China. Clin Hemorheol Microcirc. (2021) ;79: (2):269–277. doi: 10.3233/CH-201071 |
[24] | Nugroho J , Wardhana A , Mulia EP , et al. Elevated fibrinogen and fibrin degradation product are associated with poor outcome in COVID-19 patients: A meta-analysis. Clin Hemorheol Microcirc. (2021) ;77: (2):221–231. doi: 10.3233/CH-200978 |


