
How we should respond to the Coronavirus SARS-CoV-2 outbreak: A German perspective
Abstract
BACKGROUND:
In the early phase of the COVID-19 pandemic Germany missed to set up efficient containment measures. Consequently, the number of cases increased exponentially until a lockdown was implemented to suppress the spread of SARS-CoV-2. Fortunately, Germany has a high capability for coronavirus lab testing and more than 30,000 ICU beds. These capabilities and the lockdown turned out to be an advantage to combat the pandemic and to prevent a health-system overload.
AIM:
The aim was to predict the plateau day of SARS-CoV-2 infections or deaths.
RESULTS:
The effect on the viral spread of the German measures taken and the impact on the peak of new infection cases is shown. By normalizing daily case numbers, the plateau day of the current outbreak in Germany could be calculated to be reached at April 12, 2020 (day 103 of 2020).
CONCLUSION:
Normalized case number curves are helpful to predict the time point at which no further new infections will occur if the epidemic situation remains stable. Upon reaching the plateau day during a lockdown phase, a residual time-period of about 2-3 weeks can be utilized to prepare a safe unlocking period. As can be learned from Asian countries such as South Korea and Taiwan there must be strict rules to keep the risk of infection low. Those include social distancing, face mask wearing in combination with digital contact tracing and serosurveillance studies. Following those rules, a safe dance around the infection curve allows to keep the population at a reduced infection rate.
1Outbreak chronology and counter measures with a focus on Germany
In December 2019, a novel coronavirus emerged in the metropolis of Wuhan, China, causing a severe lung disease. On December 31, China informed the WHO of a total of 27 patients with pneumonia, and already on January 7, 2020, Chinese scientists succeeded in identifying the infectious agent. The new coronavirus SARS-CoV-2 is highly related to the well-known bat-borne SARS-CoV which emerged in February 2003 [1, 2] and to the Middle East respiratory syndrome coronavirus (MERS-CoV) detected in 2015 [3]. The 2003 global SARS outbreak spread to more than two dozen countries in North America, South America, Europe, and Asia before it was contained. More than 8,000 cases with a mortality of 10–50% depending on age occurred globally [4, 5]. On January 11, 2020, China reported the first death from the new disease COVID-19. China reacted with severe counter measures including quarantine and complete highly controlled lockdown of the affected areas. In the following week first cases outside of China were reported from Thailand and Japan which were imported from Wuhan and first evidence of human to human transmission was reported. On January 21, the first imported case appeared in the USA and on January 24, SARS-CoV-2 emerged globally in many other countries including Europe where first cases were reported from France [6–8]. On January 26, China reported 2000 confirmed cases and 56 COVID-19 deaths and measures to contain the spread were strengthened. Already on January 23, the Chinese government ordered the complete lockdown of social and economic life in Wuhan city, later followed by nationwide closure of schools and universities. On January 27, the infection was detected in Germany for the first time. An employee of the Bavarian company Webasto was infected by a Chinese visitor to the company who later tested positive for SARS-CoV-2 after her return home to China and was apparently almost symptom-free in Germany.
On January 30, the WHO declared the status of health emergency because of COVID-19. However, the federal authority for infectious diseases in Germany, Robert Koch Institute (RKI), still defined the risk for Germany as being low and did not recommend to close borders and stop incoming flights to Germany. The experts believed that all emerging SARS-CoV-2 cases were under control and contact persons quarantined.
However, from that time point on the outbreak within Germany increased rapidly because dozens of SARS-CoV-2 infected people returned from Ski vacation in Tyrol and from Italy. Failure to impose an early ban on entry into the country from the risk areas in Austria, Italy and China was a serious mistake, particularly when the strategy to combat the outbreak is based on eradication. Besides that, in Germany the federal structures of the public health service hampered a straight-forward approach to fight the pandemic.
Despite the fact that there was strong evidence of rapid person-to-person transmission [9] even before classical clinical symptoms of a respiratory disease were present [10] carnival meetings were held in different regions such as in the district of Heinsberg and other cities in the West and Southwest of Germany pouring oil into the fire of the outbreak. As a result, on March 10, over 300 people in the Heinsberg district tested positive for SARS-CoV-2.
On March 17, the RKI classified the risk situation for Germany as moderate to high. Until this point, there were already more than 9,000 confirmed SARS-CoV-2 cases and 26 COVID-19-related deaths in Germany. The German public learned about the strategy of herd immunity meaning that at least 60% of the population will be infected to create a protective barrier. At this stage, there was no reliable information on COVID-19 mortality. The WHO calculated the case fatality rate to be 3-4 %, with the true infection fatality rate to be much lower (WHO Situation Report 46 as of March 6, 2020). Assuming an infection fatality rate of 0.5 % for SARS-CoV-2, herd immunity of the German population would generate about 250,000 deaths – by COVID-19 only. In addition, there would have been further deaths due to massive overload of the German health system.
On March 18, German Chancellor Angela Merkel for the first time addressed the population directly in a speech on the coronavirus outbreak. She described the situation as follows: “It is serious. Take it seriously, too!” Since World War II, there has been no challenge to the country where national solidarity was so important as right now, she said.
On March 22, following a consultation with the federal state’s Prime Ministers, the German Chancellor tightened up the measures and announced a total of nine rules of conduct for Germany to be valid from midnight on Monday, March 23. The central point was “to reduce public life as far as it is justifiable”. This included limiting contacts to persons other than those living in the same household to the bare minimum, keeping a minimum distance of at least 1.5 m in public, only two persons not living in the same household are allowed to meet, people are still allowed to go to work, to the doctor, to shop, to do outdoor sports alone, but parties in groups or meetings in parks were not allowed any longer. Service and catering establishments as well as restaurants were closed. These guidelines were initially valid for two weeks. Universities, schools, and kindergartens were already closed on March 16.
2Results
2.1Efficiency of the lockdown in Germany
Until the first day of lockdown in Germany on March 23 (day 83; day zero: 01/01/2020), about 29,000 people were already tested positive for the virus. Until April 12 (day 103), 127,459 cases and 2996 deaths due to COVID-19 were identified in Germany.
Figure 1 shows that until March 20 (day 80), the daily cases of new confirmed infections increased with doubling times between 1–5 days, showing a strong exponential rise of positive tests for SARS-CoV-2 infections in Germany. However, it is unlikely that the obvious decline of the curve after day 80 already reflects official counter measures of the German government. There is a delay of at least 10 days between an infection event and the registration of a positive test due to the virus incubation time of at least 5 days, the test time and the time until the positive result is reported to the authorities. Cumulative cases reported until March 20 reflect infection events until March 10, i.e. at a time point when the German public was not officially warned about the COVID-19 risks. However, it is possible that the number of positive tests at day 80 was still limited by the overall capacity of PCR-based SARS-CoV-2 detection.
Fig.1
New cases and doubling time during SARS-CoV-2 outbreak in Germany until day 105 beginning at the 1st of January.
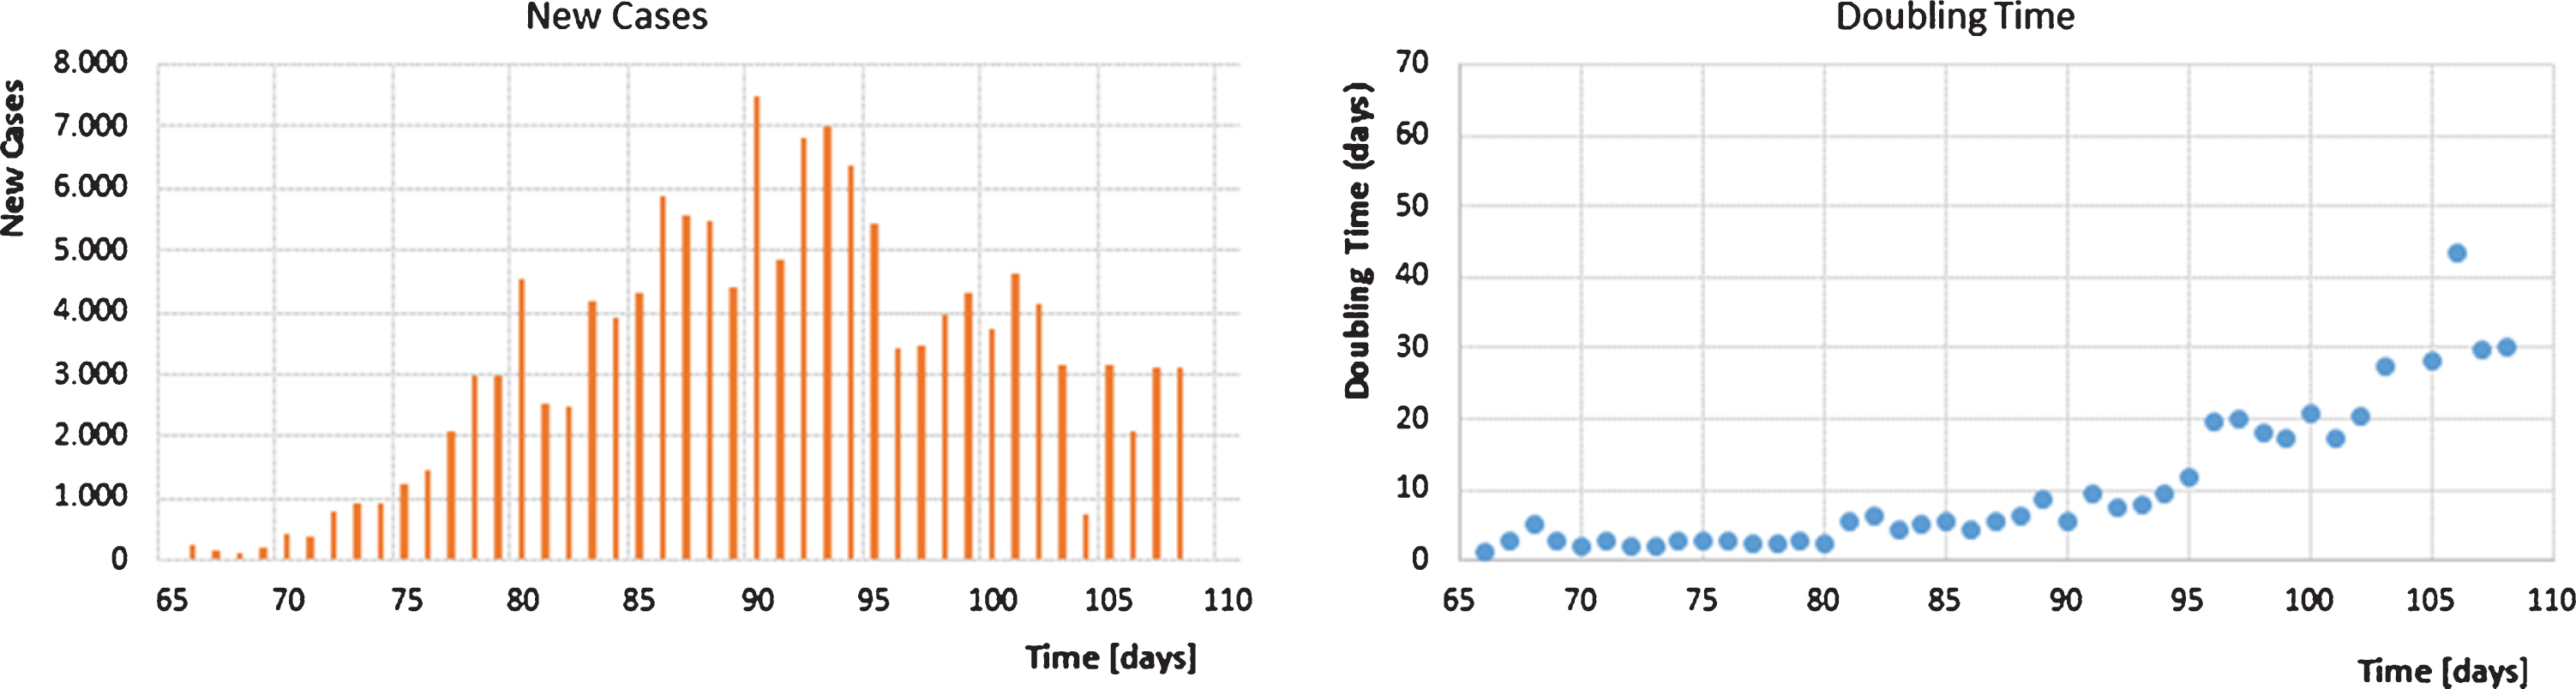
One week after the initial lockdown, on March 30 (day 90), the highest number of new cases per day was reported (Fig. 1). Thereafter, the number of new daily cases started to decline continuously.
Doubling times show a flat course over the first 90 days. Then they started to increase strongly by about day 100 (April 9, 2020). At this time point, the test capacity was almost doubled in Germany. Thus, the declining number of new cases of persons with COVID-19-like symptoms should not have been affected any longer by the PCR testing capacity. This result should thus reflect the counter measures of the German government, especially the lockdown since March 23, and the substantial discussions of experts and politicians in public media of Germany. Doubling times were then steadily increasing, reaching 30 days or more since day 106.
Figure 2 demonstrates the cumulative case numbers (CCN) of infections and deaths of the three European countries Germany, France and Italy, and the three East-Asian countries Taiwan, South Korea and Japan to document the different strategies followed during the COVID-19 crisis. It is obvious that in the East-Asian countries measurements were taken right at the beginning of the SARS-CoV-2 pandemic to contain the virus spread. Taiwan and South Korea used their knowledge from the first SARS pandemic in 2003 and the 2015 outbreak of MERS-CoV. In South Korea, where a religious community initiated a fatal infection cluster in the city of Daegu, schools were closed soon, infected persons were efficiently tracked with smartphone apps and rigorous testing for SARS-CoV-2 infections were performed [3, 11]. Taiwan used a combination of big data analytics, community protection and rigorous testing to combat the crisis. As being closely located to the mainland of China, Taiwan was at high risk for outbreak of COVID-19, but the country was able to implement fast and efficient counter measures [12, 13]. By the end of February 2020, the government of Japan recommended closing of schools, entry ban of people from coronavirus risk regions and a stop of sports and cultural events. These early reactions and the fact that the Japanese are used to wearing face masks during seasonal influenza [14] seemed to help combat the SARS-CoV-2 outbreak until end of March 2020. After a period of stagnation, cases in Japan were reported to increase again as people were reducing their social distancing in public. However, the total number of confirmed cases is still much lower than reported for European countries. Common elements of these Asian states were the immediate action of governments to implement certain social distancing strategies and the wearing of face masks in public to reduce the number of new cases, which has proven to be effective to prevent transmission from infected individuals [15].
Fig.2
Cumulative case numbers of infections (coloured dots) and deaths (red triangles) in East Asian and European States.
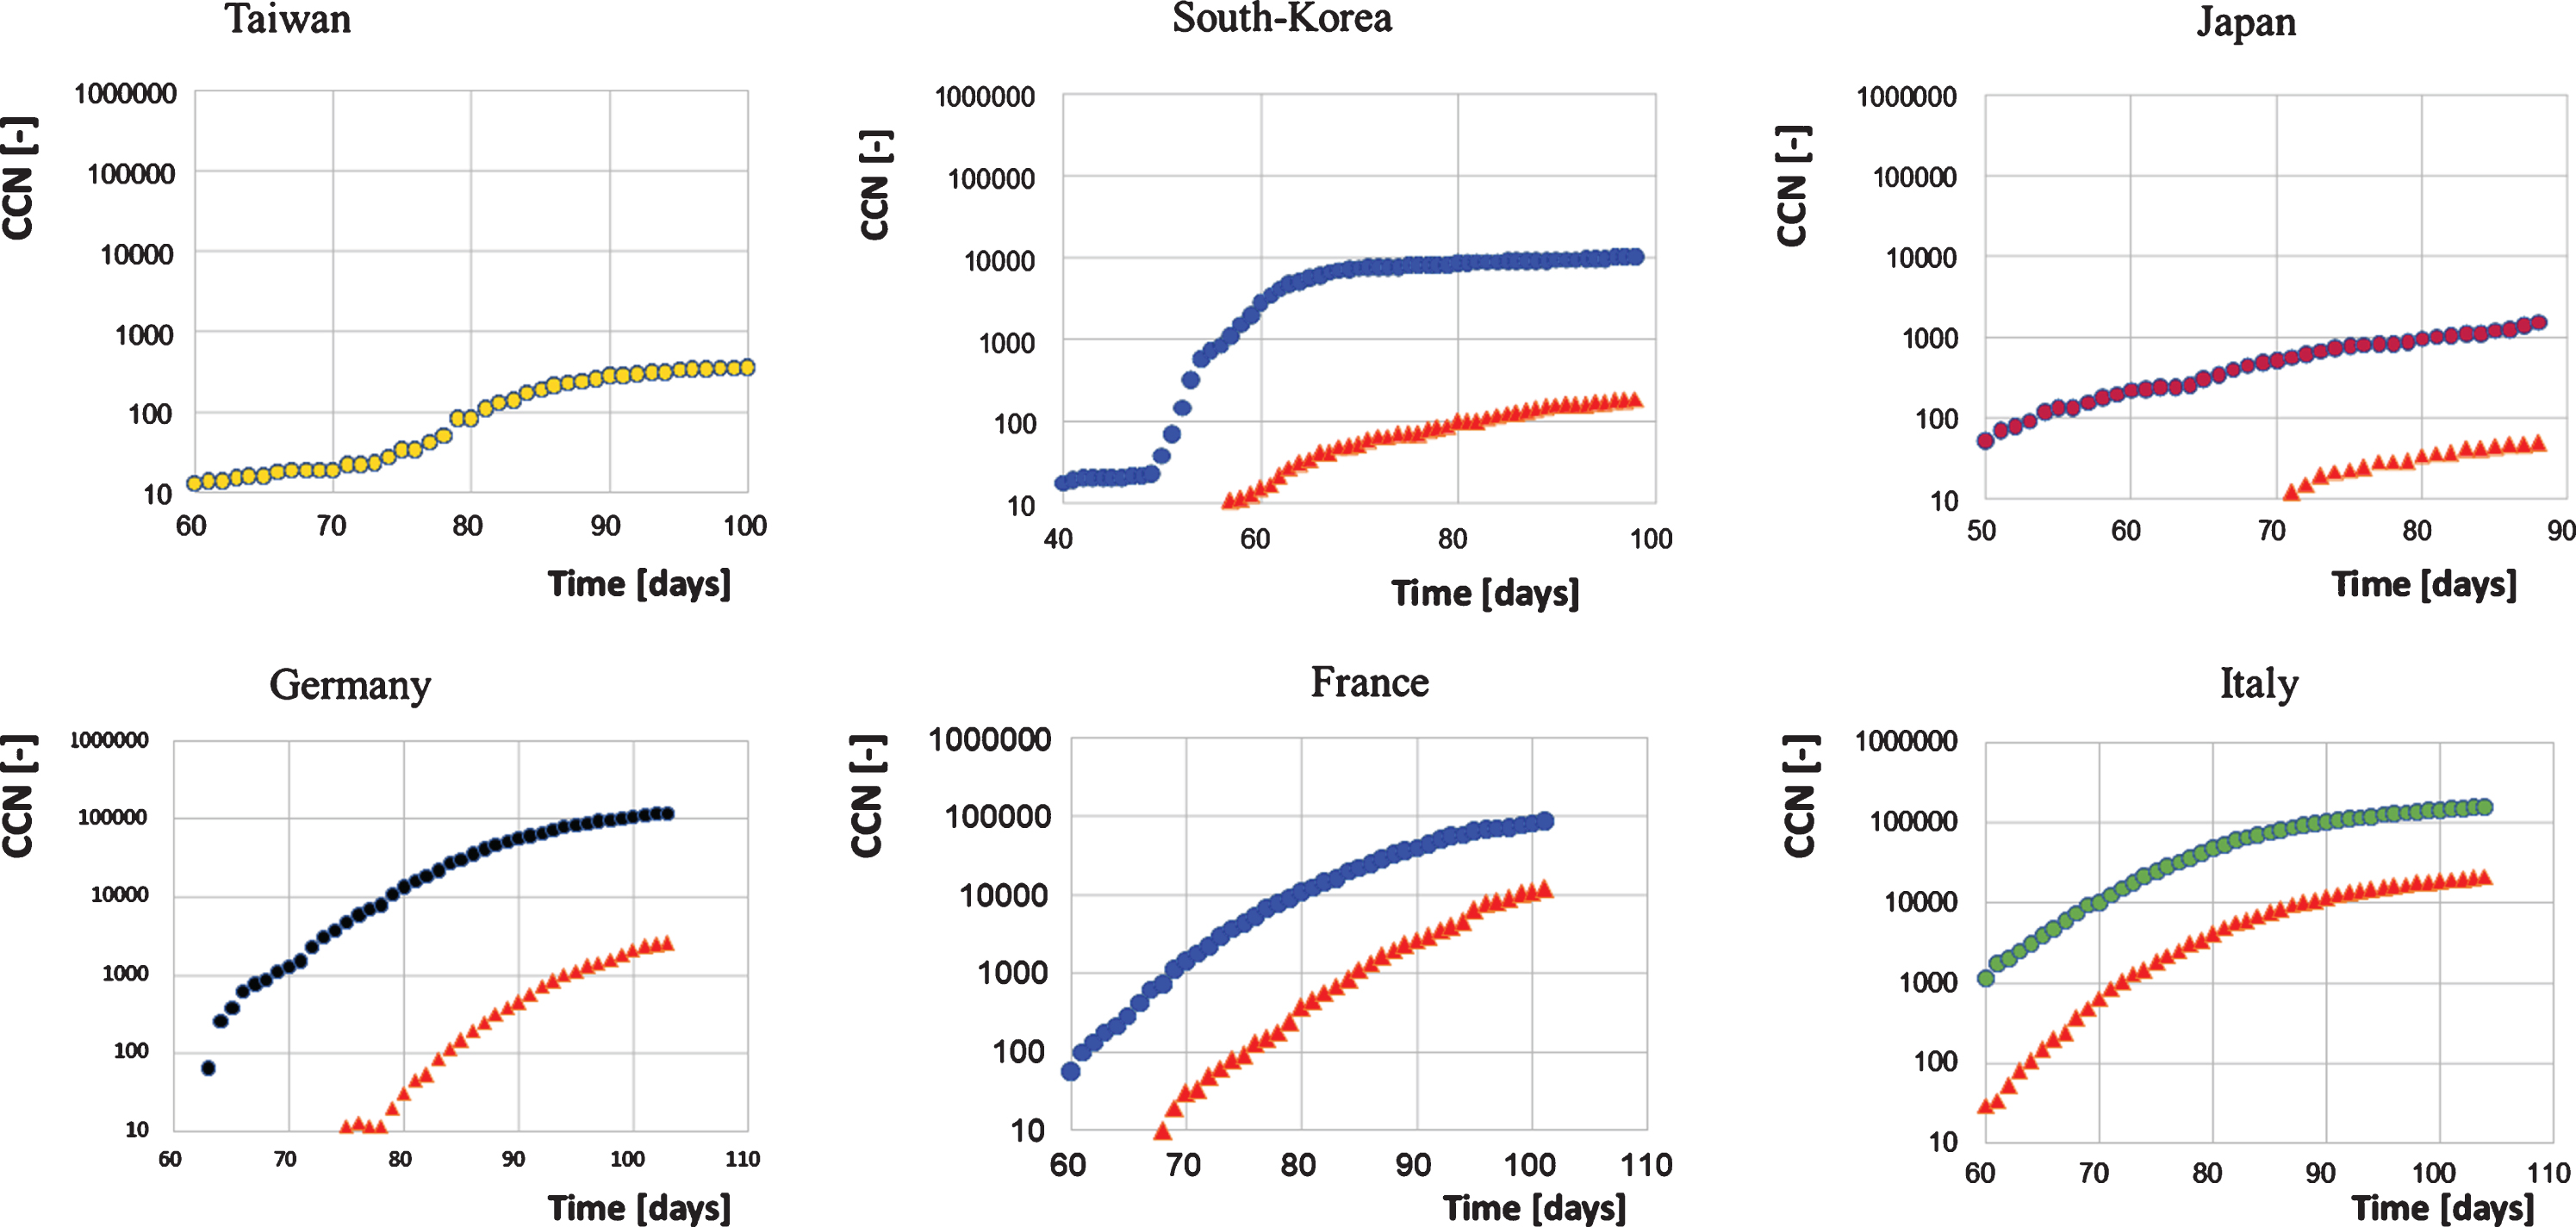
By contrast, the three European states had some delay in their national responses to the SARS-CoV-2 pandemic. At the starting points of the outbreak during the end of January 2020, there were neither discussions on travel entry bans nor recommendations on social distancing, and wearing of face masks in the public was also not recommended. This led to a longer phase of exponential growth of SARS-CoV-2 infections and deaths in Germany, France and Italy and caused cumulative case numbers to grow significantly higher in comparison to the East-Asian countries (Fig. 2).
The data were obtained from the following sources: Taiwan, South-Korea: and Japan: www.ecdc.europa.eu/en/publications-data/download-todays-data-geographic-distribution-covid-19-cases-worldwide; Germany: https://www.rki.de/DE/Content/InfAZ/N/Neuartiges_Coronavirus/ Fallzahlen.html; France: who.sprinklr.com/region/euro/country/fr, Italy: github.com/pcm-dpc/COVID-19).
The data obtained from the above listed sources is put in to a context described herein with. Our policy regarding the information format is prioritizing Open Source and Free Software. We therefore make all data retrieved and analyzed hereby available at corona.milliways.online.
2.2Calculation of the plateau day to predict the behaviour over time of corona infections
Due to the imperative of social distancing and the lockdown decreed in European countries, the increase in case numbers flattened out considerably. Figure 2 shows that for Germany the lockdown could allow to keep the cumulative number of cases below 150-200 thousand. This clearly would prevent the collapse of the health system in Germany.
This is best seen in logarithmic representation. The scope of this work is primarily to provide a forecast for the time when theoretically there will be no more growth of confirmed cases. At that time point the growth of values (e.g. corona cases confirmed) is zero - resulting also in zero slope of the curves in Fig. 2. However, it is not possible to read from this cumulative diagram the exact point in time when no more cases should occur, as the slope at the peak is getting flatter. To overcome this problem, one can plot normalised growth rates (corona cases at day n – corona cases at day n-1) / corona cases at day n) against a linear timeline. This normalization keeps each rate of change in the range between 0% and 100%.
By plotting these normalized change rates against the standardized day counts, an approximate linear behaviour can be observed. The approximation lines meet the x-axis at the day when no further infections or deaths will occur – provided that no systematic changes in the underlying social epidemic behaviour occur in the following days. We call this day the “plateau day”. This type of analysis enables health-policy makers to adjust in time to the point at which both new cases and deaths will end.
Figure 3 shows that Germany, France and Italy reached their calculated plateau days, i.e. the days when no further confirmed SARS-CoV-2 cases should be found, at day 103, 107 and 101, respectively. The respective plateau day of deaths is 7–14 days later for Germany and France, but only 3 days for Italy.
It can be seen from the curves for Germany and Italy, that there were still new cases detected at the time point of the plateau day, when the approximation line meets the x-axis. Of course, the infection events that led to those newly confirmed cases occurred at least 10 days before and could reflect variations in Western-oriented societies tending to behave individually rather than collectively.
Fig.3
Linear regression of normalised case numbers of infections (coloured dots) and deaths (red triangles) versus time in East Asian (Taiwan: R2 = 0.467; South-Korea: R2 = 0.199; Japan: R2 = 0.008) and European States (Germany R2 = 0.556; France: R2 = 0.073; Italy: R2 = 0.836).
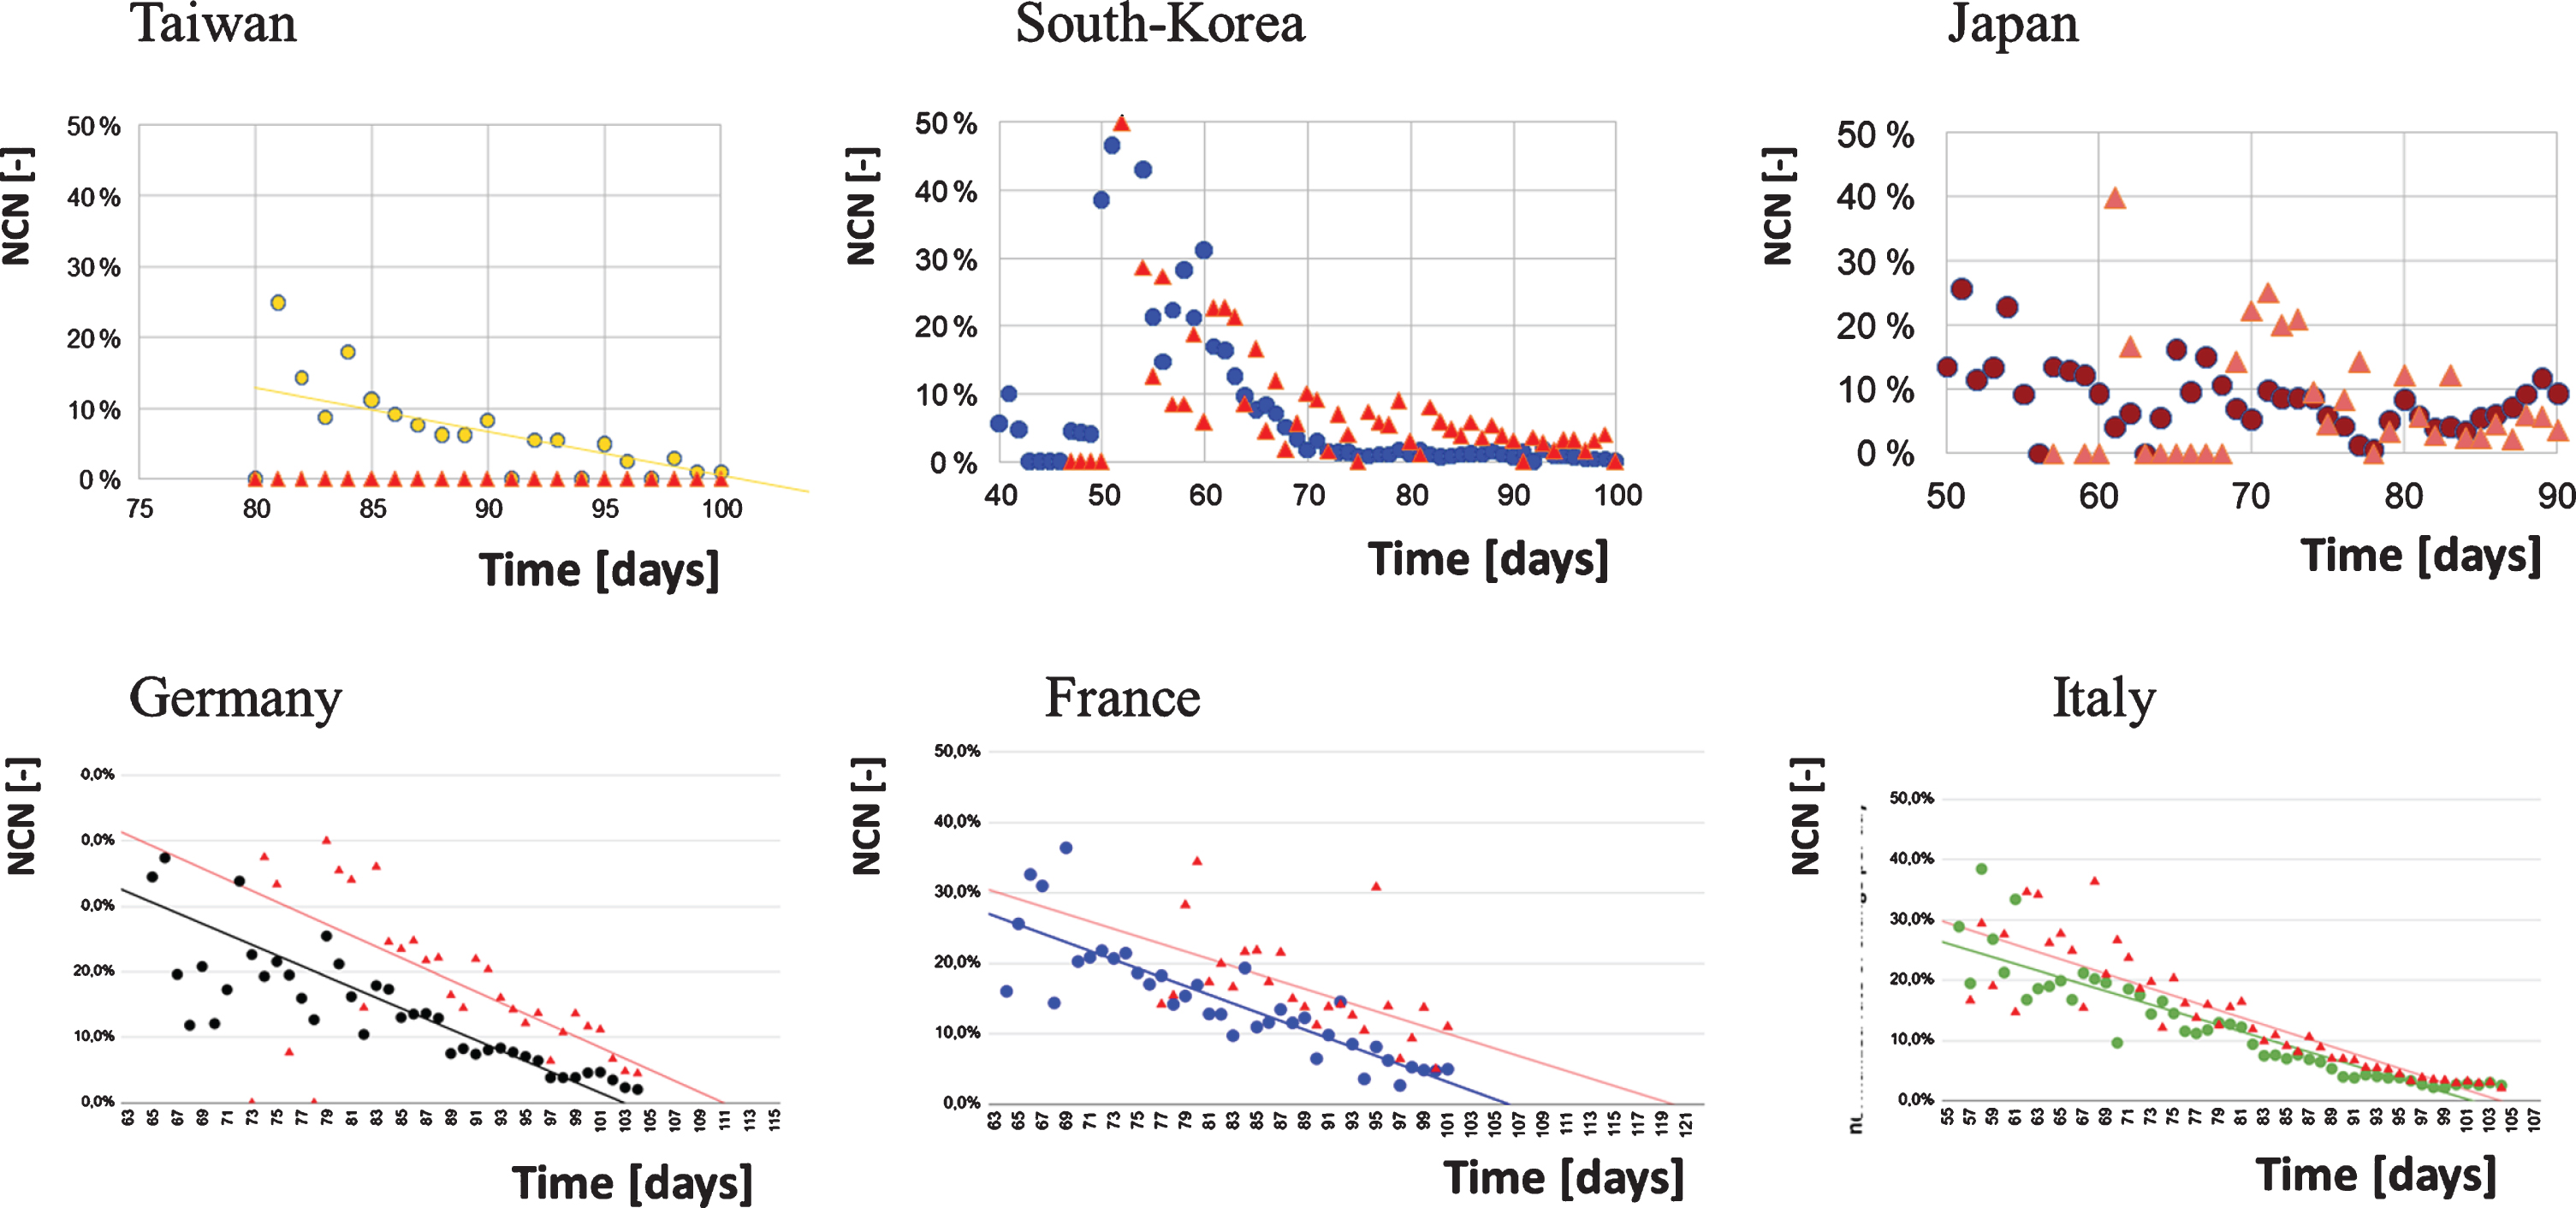
In contrast, South Korea has achieved the fastest descent with only very few further cases detected at the expected plateau date. The same course is to be expected from Taiwan. This points out that efficient measures along with a high compliance of a population can lead very quickly to success. In the case of Japan, it is different. This country always showed low numbers (see day rate), but there was also a moderate rate of testing (less than 10,000 tests per day). Using the actions described above, Japan fought their way down to zero on day 82, but then popular events such as the Cherry Blossom Festival occurred, and people started to behave more careless. Subsequently, more action such as regional or general lockdown, social distancing etc. is required for Japan to keep SARS-CoV-2 infections low.
The coefficient of determination (R2) assesses the quality of fit of the chosen linear model and thus its ability to predict an outcome.
Since the zero line is reached for Taiwan and also South Korea and hardly any new cases occur, a prediction of the linear correlation is no longer possible. Regarding Japan, the fluctuations are too large for successful model fitting (only 8% of the fluctuations are due to time). Thus, there are strong other factors that must explain the 92% fluctuation in the “normalized rate of change per day”.
However, the data show that outcome prediction by a simple linear model is possible for Italy, France and Germany. A forecast can thus be made when no more cases will occur if social behaviour does not change.
Table 1 shows times of plateau of corona infections (f(0) in Table 1) and of deaths calculated according to Fig. 3. In addition, the time delay between plateau of infections and deaths is shown. For those countries, Table 1 provides the relevant data in relation to the cumulated cases, population sizes and median age.
Table 1
SARS-CoV-2 statistics on representative Western and East Asian Countries
| f(0) | Estimated plateau day | Cases confirmed at estimated plateau day | Population 2020 by source | Cases confirmed per capita | Medium age | |
| Taiwan (TW) | 99,7 | 2020-04-08 | 337 | 23.816.775 | 0,0014% | 42 |
| South Korea (SK) | 70 | 2020-03-10 | 7506 | 51.269.185 | 0,0146% | 44 |
| Japan (JP) | 126.476.461 | 48 | ||||
| Germany (DE) | 102,9 | 2020-04-11 | 117.658 | 83.783.942 | 0,1404% | 46 |
| France (FR) | 106,1 | 2020-04-15 | 103.573 | 65.273.511 | 0,1587% | 42 |
| Italy (IT) | 101,5 | 2020-04-10 | 146.665 | 60.461.826 | 0,2426% | 47 |
2.3Consequences for Germany without decreed lockdown
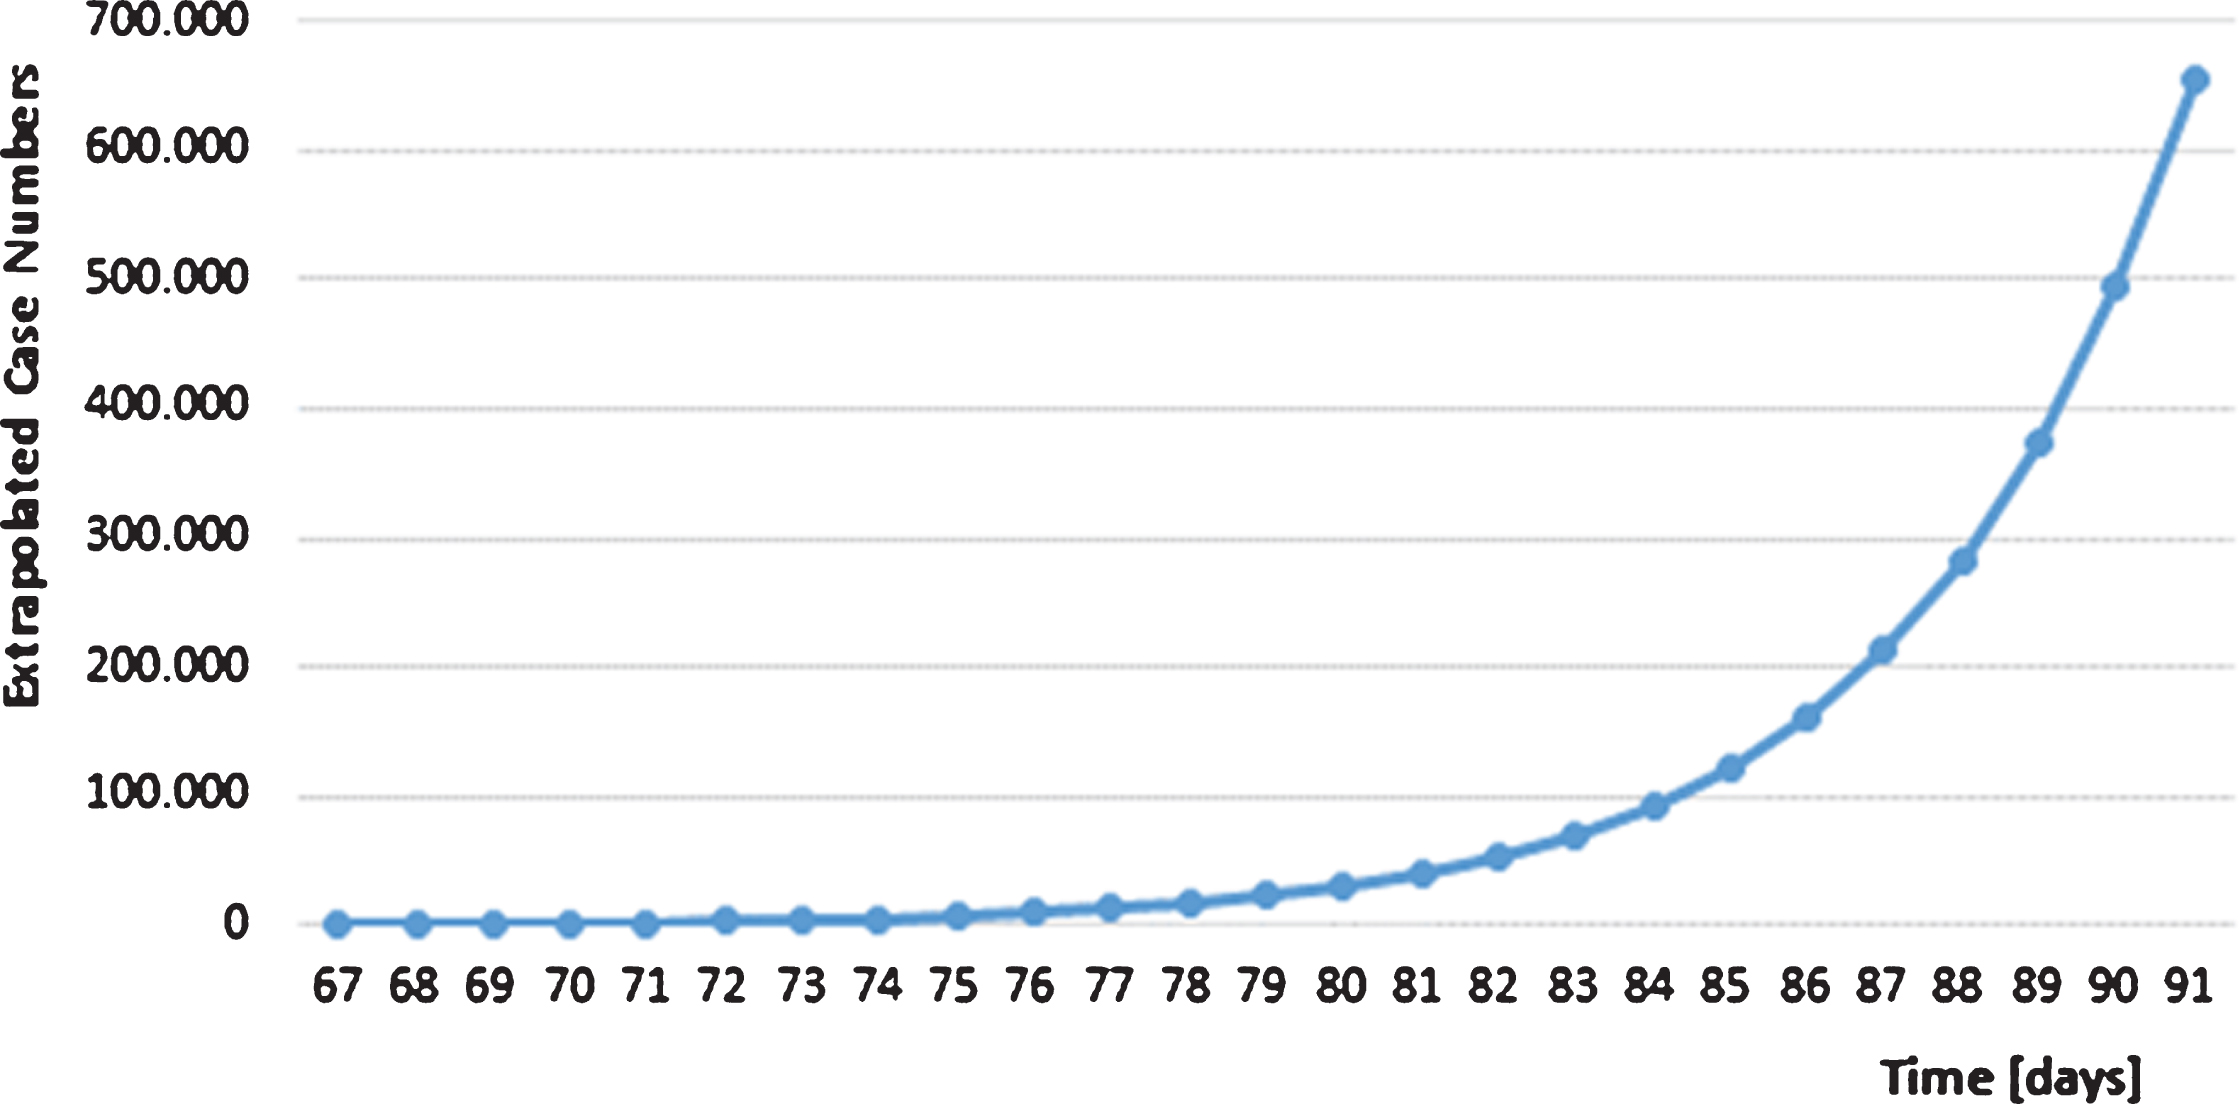
Since March 23 (day 83) a strict lockdown was started in Germany. Public life was shut down almost completely, schools, kindergartens and universities were closed. Many service providers such as hairdressers and all restaurants were closed in Germany. Because of the lockdown, as many people as possible worked from home. In contrast, not retarding the exponential virus spread in Germany characterized by short doubling times in the first weeks of March would have resulted in more than 600,000 SARS-Cov-2 cases by the end of the month (Fig. 4). That clearly would have knocked out the German health system due to the limited capacity of 30,000 ICU beds, because about 5% of infected persons need intensive medical care according to RKI information. Thus mentioning the dramatic COVID-19 risks on March 18 by the German Chancellor Angela Merkel was one of the last chances to address the attention of the German population in order to slow down the SARS-CoV-2 spread preventing the breakdown of the German health care system.
Fig.4
Extrapolated case numbers without countermeasures in Germany. The extrapolation starts on day 67 with 797 confirmed cases and a median doubling time of 2.92 days.
2.4How to successfully combat SARS-CoV-2 after lockdown: The Asian strategy versus herd immunity
At the beginning of the SARS-CoV-2 outbreak, the strategy of herd immunity was pursued in Germany, the UK and in Sweden. The aim was simply to order measures that would flatten the curve in order to limit the number of people infected simultaneously to a level acceptable to the health care system. This strategy is also called mitigation. However, as mentioned above, this mitigation strategy would have caused at least 250 thousand deaths in Germany assuming 60% of the population to become infected based on a fatality rate of only 0.5%, This is not comparable to the death toll to be paid yearly for seasonal influenza, but rather to an armed conflict. A comparison with seasonal influenza outbreak is not possible, since the population is immune naïve to SARS-CoV-2 and the mortality is at least 5 to 10 times higher compared to seasonal influenza. And even the influenza viruses have a high potential to cause severe outbreaks of public concern as documented in the 1918, seasonal influenza outbreaks after 1918 have never brought the German health care system to a collapse.
The analysis of available clinical data on COVID-19 clearly revealed that symptoms and diagnostic tests could not be explained by impaired pulmonary ventilation alone. What is special about this disease is that it is a kind of microcirculatory disorder, which is obviously associated with generalized endothelial dysfunction [16]. This highly thrombotic syndrome leads to thrombosis and embolism. In many organs such as lung, liver, kidney, brain and myocardium, vascular occlusions occur in branch arteries as well as in branch veins, which can have a hereditary effect on local microcirculation and thus on organ function [16–19]. In contrast to influenza – which is often erroneously used for comparison – there is a considerable difference in clinical significance here, particularly in irreversible vascular damage and residual organic impairments.
The alternative strategy to mitigation is called suppression. Germany as well as many other countries initiated this suppression phase with the decision to lock down. This is a decision that has probably saved hundreds of thousands of lives in Germany and other states. In the long run, however, the lockdown would entail serious economic and social costs. The lockdown can therefore only be temporary. In order to have a vision of a situation afterwards, it is helpful to compare the development of SARS-CoV-2 infections in Germany with that in Asian countries. Immediately the main difference of the development can be seen in March. The Asian countries South Korea, Japan and Taiwan had moderate increases in case numbers, far below the critical values for their respective health care systems.
While in Europe the epidemic was contained much too late, Taiwan shows how successful early measures can be. Following the SARS experience of 2003, a National Health Command Centre (NHCC) was established with the Central Epidemic Command Centre (CECC) as the central coordinating body. The CECC has rapidly produced and implemented a list of at least 124 action items including border control from the air and sea, case identification (using new data and technology), quarantine of suspicious cases, proactive case finding, resource allocation (assessing and managing capacity), reassurance and education of the public while fighting misinformation, negotiation with other countries and regions, formulation of policies toward schools and childcare, and relief to businesses [12]. These measures were so effective that only 6 patients died from a total of 397 confirmed infections in a population of more than 23 million people.
In the case of South Korea there was almost no increase any longer at this time. In contrast, Germany, Italy and France recorded very steep increases from March 5 to 21, with increases being exponential over a period of several weeks. As described above, the curves flattened out with calculated plateau days until mid of April 2020 (Fig. 3 and Table 1). Another comparison is interesting: Germany and France on the one hand and Japan on the other hand had roughly the same numbers of confirmed cases at the beginning of March. Until the end of March (day 91), Japan, however, has managed to stabilize these at under 5,000 confirmed cases, while Germany had almost 71,000 and France almost 52,000 confirmed SARS-Cov-2 infections. The charts show that the Asian countries have so far coped well with the crisis. However, in the case of Japan, it is noticeable that the trend curve has been rising more strongly again since the end of March.
3Discussion and outlook
The situation in countries like Italy, France and Spain (not shown) was more than worrying by the end of March 2020. Germany, with its very efficient health care system and a high number of ICU beds, has managed to achieve the lockdown just in time and prevented an overload of the health care system.
What was the reason for these different developments in Europe and Asia:
1) Until the turnaround, Europe mainly pursued the strategy of mitigation, with the aim of gradually achieving herd immunity. This led to an exponential increase in case numbers over weeks, thousands of deaths, and a supercritical strain on health care systems in several countries.
2) The Asian strategy was different to that: There was a very rapid lockdown to contain the infection and then the countries implemented follow-up measures with the aim of suppressing the virus spread. Examples are the complete lockdown in China, and a moderate lockdown in Japan (e.g. schools closed, restaurants open). In China, the number of cases was stabilized at under 100,000 confirmed cases (not shown) - at 1.4 billion people, and in Japan at under 5,000 infected people - at 126 million. Consequently, the number of SARS-CoV-2 infected persons compared to the total population was low. However, the Asian strategy is also based on the aim to avoid any exponential increase of SARS-CoV-2 cases at any time. The combination of strong suppression with controlled release was elegantly described as “hammer and dance” strategy [16].
Virus replication is stopped when the Basic Reproduction Number (R-value) of the virus drops below 1. In the exponential course of infection, the average of R is 2-3, i.e. each infected person infects at least 2-3 people. From the epidemiological side, R must be below 1 to stop the outbreak. However, this contrasts with the civil liberties of citizens. Thus it is a “dance” around the curve, since a sensible and democratically legitimate balance must be constantly struck between the medically and epidemiologically necessary suppression measures and the civil liberties of citizens. In Japan we recently saw an increase of cases after almost stopping the spread. This might be due to a more carefree behaviour of the people or a simple result of increased virus testing. Since the Asian countries are ahead of the European countries Europe should learn from Asia how to manage such an outbreak. Given the lack of antiviral therapy or vaccine, the following measures should be implemented during the “dance” phase:
1. Large scale PCR-testing to identify and quarantine infected patients and contacts.
2. Quantifying SARS-CoV-2 transmission using epidemic control with digital real-time contact tracing.
3. Serosurveillance of the population to figure out the people who have passed infection and acquired immunity.
4. Maintaining social distancing and hygiene rules
5. Prohibit all major events and maintaining travel restrictions across national and international borders.
6. Wearing of surgical masks or even self-made face masks is mandatory since they prevent transmission of human coronaviruses and influenza viruses from symptomatic individuals.
7. Introduction of body temperature scans as an additional measure for personal protection during everyday activities.
8. Protect all health- and elderly care workers with PPE including N95 /FFP3 masks.
9. Travel entry ban for persons from COVID-19 risk regions or, alternatively, quarantining those persons upon entry.
10. Re-implementation of regional lockdowns in case of endemic outbreak of SARS-CoV-2.
For any lockdown, it is helpful to predict the time point at which no further new infections will occur by using normalized case number curves. Upon reaching the plateau day, a residual time-period of about 2-3 weeks must be fixed for safe release. Depicting normalized curves as seen in Fig. 3 also indicates compliance of the population on the governmental recommendations.
Following those rules, a safe dance around the infection curve is possible to keep the population at a reduced infection rate in order to get the economy back to work and revitalise social and cultural life.
If there is a pandemic with a new pathogen of unknown lethality and mutation rate, a hammer and dance suppression strategy should always be preferred over the strategy of herd immunity to dramatically reduce the evolutionary potential for pathogens.
In the above-mentioned article from Tomas Pueyo a list of measures of varying effectiveness and cost is given. The decision-makers in each country must determine which weapon arsenal or, to put it less martial, which dancing shoes are best suited to permanently limit the spread of the virus.
References
[1] | Lu R , Zhao X , Li J , et al. Genomic characterisation and epidemiology of 2019 novel coronavirus: implications for virus origins and receptor binding. Lancet. (2020) ;395: :565–74. |
[2] | Tang X , Wu C , X. L, et al. On the origin and continuing evolution of SARS-CoV-2. National Science Review. (2020) . |
[3] | Choi S , Han C , Lee J , et al. Innovative screening tests for COVID-19 in South Korea. Clin Exp Emerg Med. (2020) . |
[4] | Graham RL , Donaldson EF , Baric RS . A decade after SARS: strategies for controlling emerging coronaviruses. Nat Rev Microbiol. (2013) ;11: :836–48. |
[5] | WHO. Summary of probable SARS cases with onset of illness from 1 November 2002 to 31 July 2003 2003. |
[6] | Kinross P , Suetens C , Gomes Dias J , et al. Rapidly increasing cumulative incidence of coronavirus disease (COVID-19) in the European Union/European Economic Area and the United Kingdom, 1 January to 15 March 2020. Euro Surveill. (2020) ;25. |
[7] | Bernard Stoecklin S , Rolland P , Silue Y , et al. First cases of coronavirus disease 2019 (COVID-19) in France: surveillance, investigations and control measures, January 2020. Euro Surveill. (2020) ;25. |
[8] | Johnson HC , Gossner CM , Colzani E , et al. Potential scenarios for the progression of a COVID-19 epidemic in the European Union and the European Economic Area, March 2020. Euro Surveill. (2020) ;25. |
[9] | Tolksdorf K , Buda S , Schuler E , et al. Influenza-associated pneumonia as reference to assess seriousness of coronavirus disease (COVID-19). Euro Surveill. (2020) ;25. |
[10] | Rothe C , Schunk M , Sothmann P , et al. Transmission of 2019-nCoV Infection from an Asymptomatic Contact in Germany. N Engl J Med. (2020) ;382: :970–1. |
[11] | Covid-19 National Emergency Response Center E, Case Management Team KCfDC, Prevention. Contact Transmission of COVID-19 in South Korea: Novel Investigation Techniques for Tracing Contacts. Osong Public Health Res Perspect. (2020) ;11: :60–3. |
[12] | Wang CJ , Ng CY , Brook RH . Response to COVID-19 in Taiwan: Big Data Analytics, New Technology, and Proactive Testing. JAMA. (2020) . |
[13] | Yang CJ , Chen TC , Chen YH . The preventive strategies of community hospital in the battle of fighting pandemic COVID-19 in Taiwan. J Microbiol Immunol Infect. (2020) . |
[14] | Wada K , Oka-Ezoe K , Smith DR . Wearing face masks in public during the influenza season may reflect other positive hygiene practices in Japan. BMC Public Health. (2012) ;12: :1065. |
[15] | Leung NHl , Chu DK , Shiu EYC , et al. Respiratory virus shedding in exhaled breath and efficacy of face masks. Nat Med. (2020) . |
[16] | Varga Z , Flammer AJ , Steiger P , Haberecker M , Andermatt R , Zinkernagel AS , Mehra MR , Schuepbach RA , Ruschitzka F , Moch H . Endothelial cell infection and endotheliitis in COVID-19. The Lancet. (2020) . DOI: 10.1016/S0140-6736(20)30937-5. |
[17] | Jung EM , Stroszczinski C , Jung F . Contrast enhanced ultrasonography (CEUS) to detect abdominal microcirculatory disorders in severe cases of COVID-19 infection: First experience. Clin Hemorheol Microcirc. (2020) ;74: (4):353–61. DOI: 10.3233/CH-209003. |
[18] | Oxley TJ , Mocco J , Shahram Majidi S , Kellner CP , Shoirah H , Singh IP , De Leacy RA , Shigematsu T , Ladner TR , Yaeger KA , Skliut M , Weinberger J , Dangayach NS , Bederson JB , Tuhrim S , M.D , FifiJT. Large-Vessel Stroke as a Presenting Feature of Covid-19 in the Young. New Engl J Med. (2020) . DOI: 10.1056/NEJMc2009787. |
[19] | Zhang Y , Cao W , XIAO M , Li YJ , Yang Y , Zhao J , Zhou X , Jiang W , Zhao YQ , Zhang SY , Li TS . [Clinical and coagulation characteristics of 7 patients with critical COVID-Pneumonia and Acro-Ischemia]. Zhonghua Xue Ye Xue Za Zhi. (2020) ;41: (0):E006. |
[20] | Pueyo T . Coronavirus: The Hammer and the Dance. https://medium.com/@tomaspueyo/coronavirus-the-hammer-and-the-dance-be9337092b56 (2020) . |


