
Interstitial lung opacities in patients with severe COVID-19 pneumonia by bedside high-resolution ultrasound in association to CO2 retention
Abstract
BACKGROUND:
Coronavirus disease 2019 (COVID-19) can cause acute respiratory distress syndrome (ARDS).
OBJECTIVE:
This single centre cross-section study aimed to grade the severity of pneumonia by bed-side lung ultrasound (LUS).
METHODS:
A scoring system discriminates 5 levels of lung opacities: A-lines (0 points),≥3 B-line (1 point), coalescent B-lines (2 points), marked pleural disruptions (3 points), consolidations (4 points). LUS (convex 1–5 MHz probe) was performed at 6 defined regions for each hemithorax either in supine or prone position. A lung aeration score (LAS, maximum 4 points) was allocated for each patient by calculating the arithmetic mean of the examined lung areas. Score levels were correlated with ventilation parameters and laboratory markers.
RESULTS:
LAS of 20 patients with ARDS reached from 2.58 to 3.83 and was highest in the lateral right lobe (Mean 3.67). Ferritin levels (Mean 1885μg/l; r = 0.467; p = 0.051) showed moderate correlation in spearman roh calculation. PaCO2 level (Mean 46.75 mmHg; r = 0.632; p = 0.005) correlated significantly with LAS, while duration of ventilation, Horovitz index, CRP, LDH and IL-6 did not.
CONCUSIONS:
The proposed LAS describes severity of lung opacities in COVID-19 patients and correlates with CO2 retention in patients with ARDS.
1Introduction
Coronavirus disease 2019 (COVID-19) was described first in China in December 2019 and led to a global pandemic now affecting most countries of the world. Mortality is driven by a severe pneumonia which occurs in about 25 % of patients infected with the corona virus [1–3]. Mortality rate differs by countries and infection rate is still raising in some countries. COVID-19 pneumonia shows characteristic signs in computed tomography (CT) scan with pleura-near parenchymal infiltrations, described as ground-glass opacities and patchy shadowing, with most prominent findings in patients after one to three weeks after onset of disease [4]. CT scan turned out to be the gold standard for detection of COVID-19 pneumonia in the initial phase of the pandemic [5]. The peripheral localisation of the parenchymal involvement of COVID-19 pneumonia makes these abnormities accessible to lung ultrasound (LUS). However, data on specificity of LUS in COVID-19 is lacking, since the differentiation of bacterial consolidations and COVID-19 inflammatory pulmonary changes may be difficult to detect for LUS and central pulmonary changes can only be detected by CT. In addition, for central pulmonary changes high resolution CT is superior, while for the detection of peripheral embolism CEUS could be helpful [4–7]. On the one hand, diagnosis by bed-side point-of-care LUS minimizes the need of patient transport and therefore might have less risk of contamination than CT scan. On the other hand, LUS needs time to perform and special protection and cleaning procedures are necessary for the ultrasound machines. Findings in LUS describe different grades, ranging from normal A-lines, to more than 3 single B-lines, confluent B-lines, pleural disruptions and consolidations with air bronchograms [8].
Aim of this pilot study was to implement a scoring system that quantifies lung alterations in ventilated patients with ARDS caused by COVID-19 pneumonia and to correlate the grade of the score with ventilation parameters and laboratory variables.
2Material and methods
LUS is a very competent diagnostic tool for the detection and characterization of pulmonal changes, especially in patients with acute respiratory distress syndrome (ARDS) [9].
Bed-side high resolution LUS was performed in 20 patients with COVID-19 pneumonia, who were ventilated at intensive care units of the University hospital of Regensburg from 03/2020 to 06/2020. Diagnosis of COVID-19 was verified by positive polymerase chain reaction of SARS-CoV-19 (EZ-1 Advanced XL extraction (Qiagen)) and CT scan with COVID-19-typical findings. All patients included in this study were older than 18 years and required ventilation due to severe respiratory failure caused by SARS-CoV-19.
2.1Technical procedure
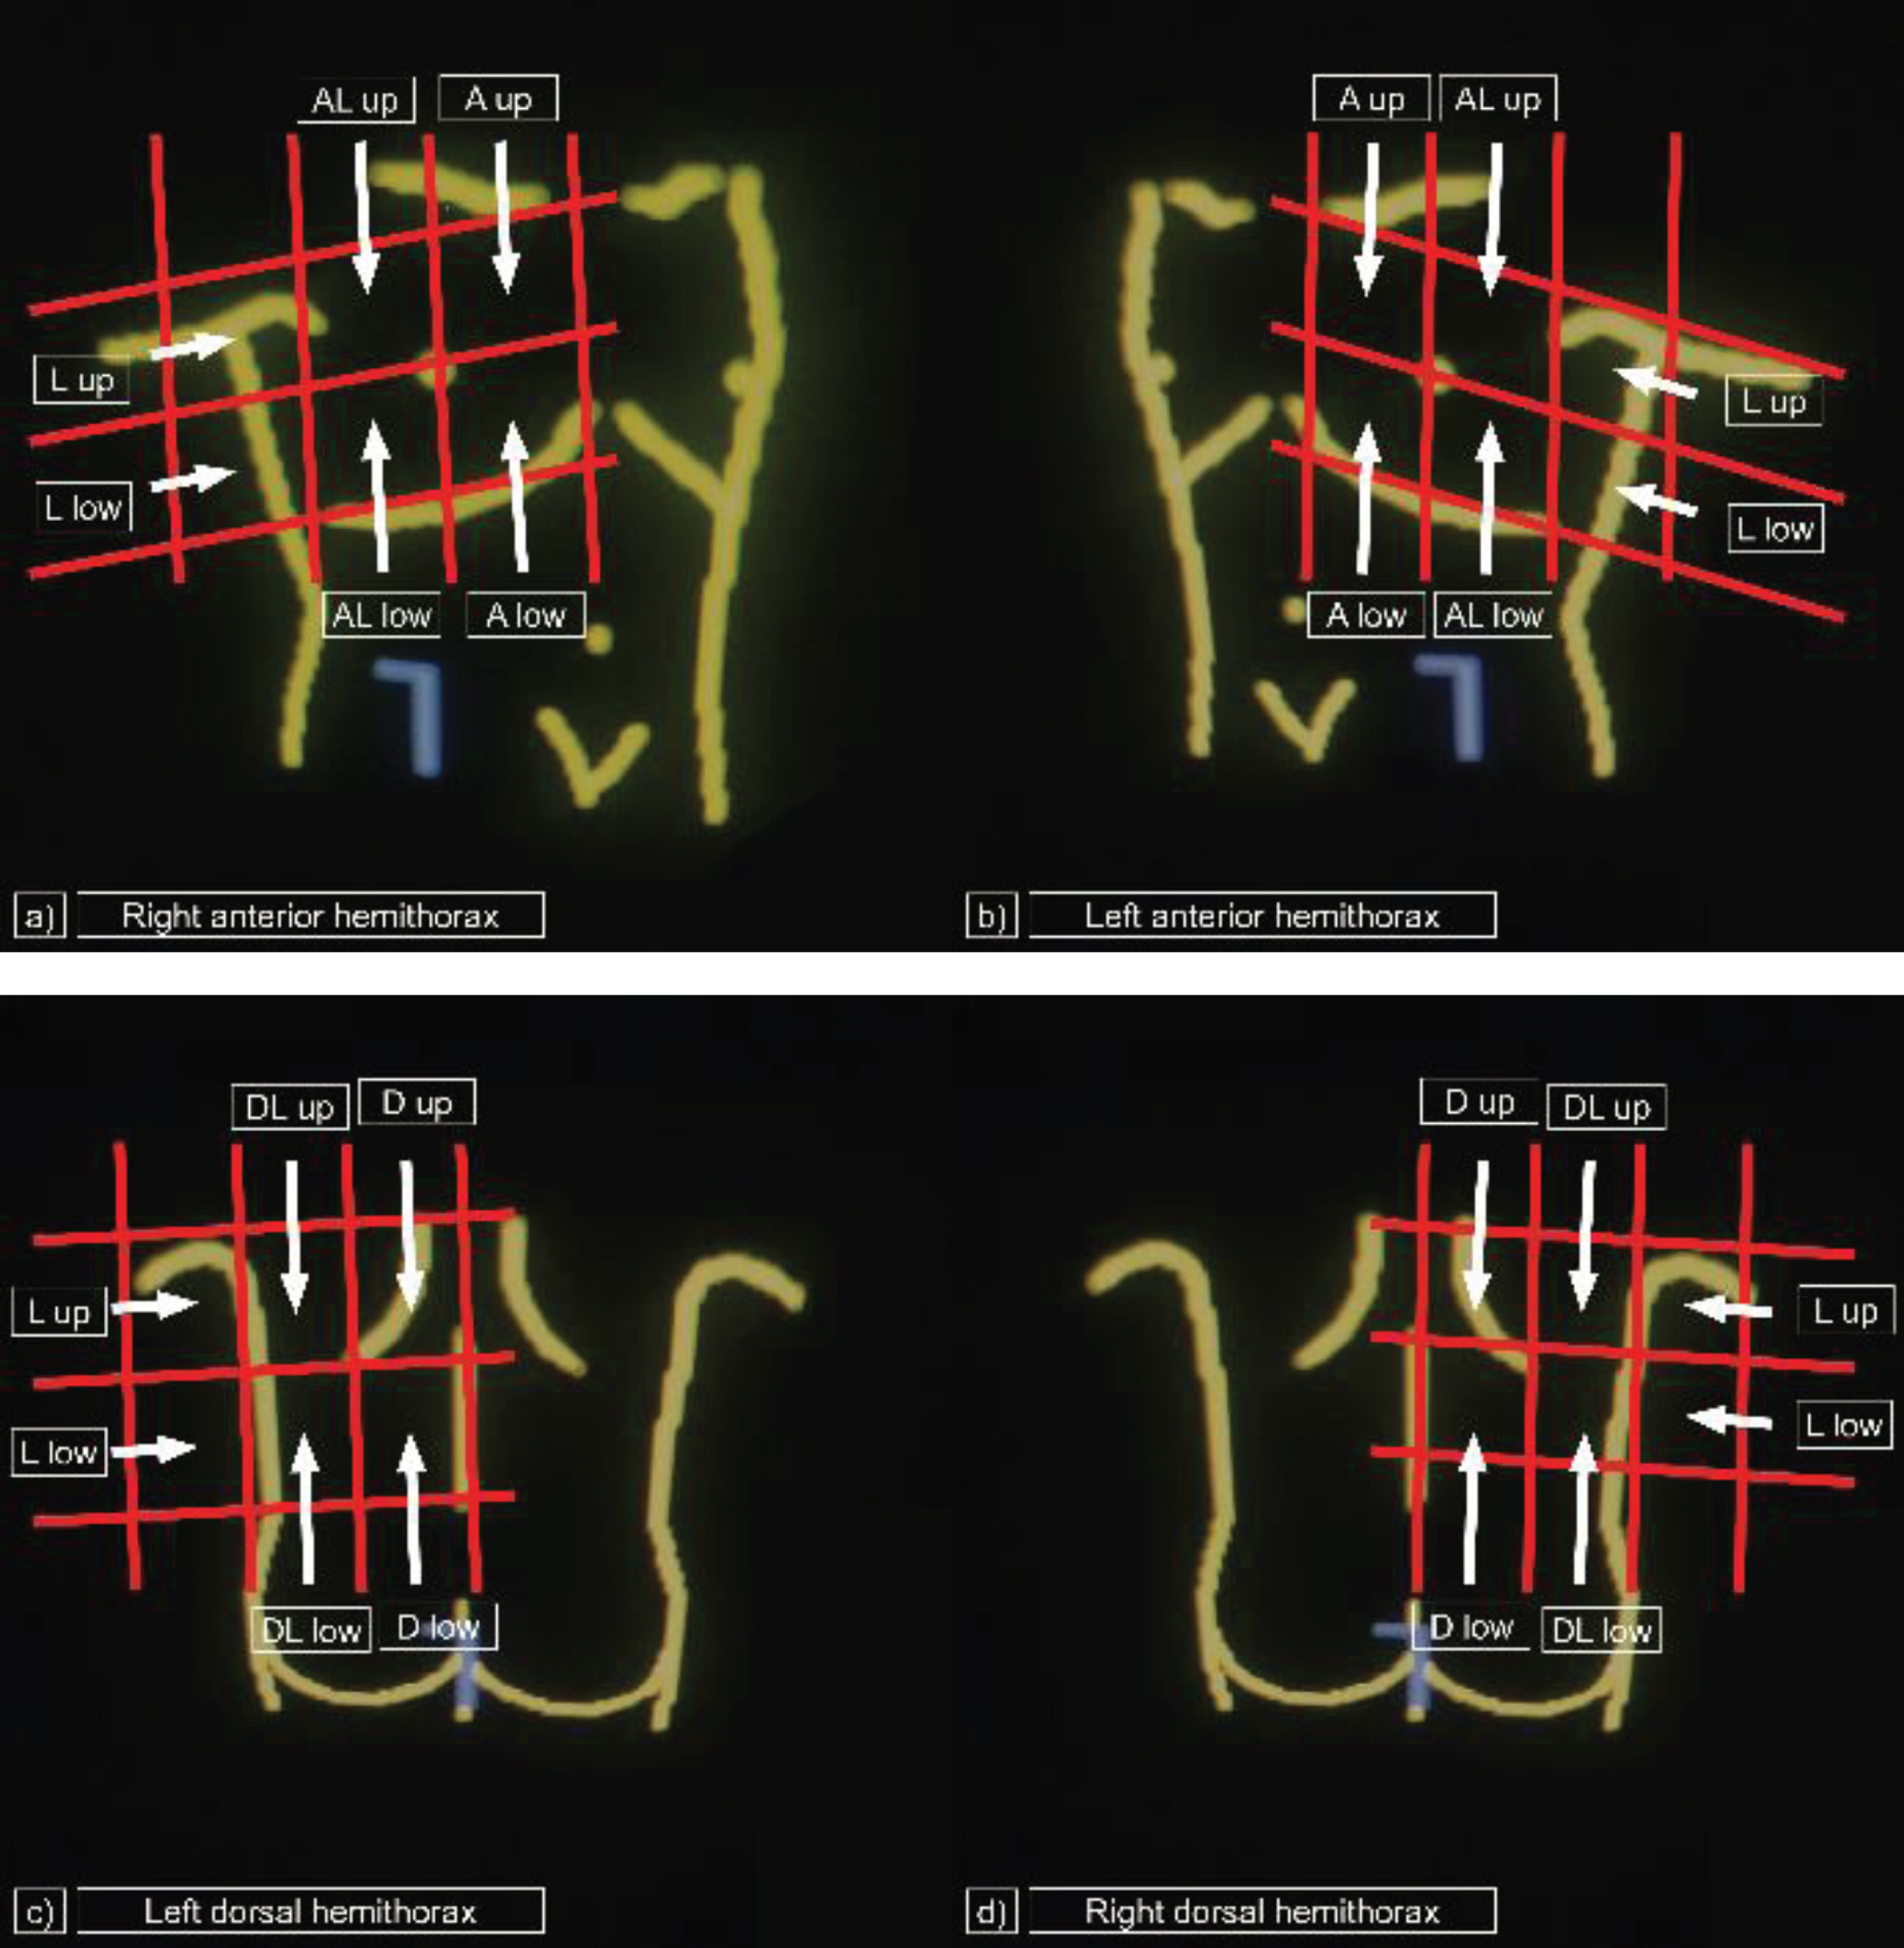
Bed-side LUS at the intensive care unit was performed by an experienced physician of the interdisciplinary ultrasound centre of the university hospital of Regensburg. A hygienic concept, describing how to handle the mobile ultrasound device was defined and approved by the hospitals hygienic staff. Fundamental B-mode LUS was performed using a LOGIQ S8 device from General Electrics® (convex 1–5 MHz array probe) at a bed side setting on intensive care units. The images were saved as DICOM (digital imaging and communications in the medicine) files and were imported to the local picture archiving and communication system (PACS, Siemens) for further evaluation. Pictograms were retrospectively analysed on a workstation by one radiologist and one gastroenterologist and grade of alteration was defined in consensus. Twelve-area-examination of the thorax was done, as fare as accessible, by dividing the two lobes of the lung in 6 areas each, including the anterior parasternal upper area (A up), the anterior parasternal lower area (A low), the para-axillary upper area (anterior lateral/AL up), the para-axillary lower area (AL low) as well as the lateral upper area (L up) and the lateral lower area (L low) in patients at supine position. In patients at prone position, lateral areas were defined as above. The following dorsal areas were examined for the right and left lobe each: the dorsal posterior paravertebral upper area (D up), the dorsal posterior paravertebral lower area (D low), the dorsal para-axillary upper area (dorsal lateral/DL up) and the dorsal para-axillary lower area (DL low) (Fig. 1).
Fig. 1
Areas examined by lung ultrasound. Twelve-area-examination with a convex 1-5 MHz array probe by bed side point-of-care lung ultrasound. a) Right anterior hemithorax: A up = anterior parasternal upper area, A low = anterior parasternal lower area, AL up = anterior lateral/para-axillary upper area, AL low = AL up = anterior lateral/para-axillary upper area, L up = lateral upper area, L low = lateral lower area. b) Left anterior hemithorax: A up = anterior parasternal upper area, A low = anterior parasternal lower area, AL up = anterior lateral/para-axillary upper area, AL up = anterior lateral/para-axillary upper area, L up = lateral upper area, L low = lateral lower area. c) Left dorsal hemithorax: D up = dorsal posterior paravertebral upper area, D low = dorsal posterior paravertebral lower area, DL up = dorsal lateral/dorsal para-axillary upper area, DL low = dorsal lateral/dorsal para-axillary lower area, L up = lateral upper area, L low = lateral lower area. d) Right dorsal hemithorax: D up = dorsal posterior paravertebral upper area, D low = dorsal posterior paravertebral lower area, DL up = dorsal lateral/dorsal para-axillary upper area, DL low = dorsal lateral/dorsal para-axillary lower area, L up = lateral upper area, L low = lateral lower area.
2.2Lung aeriation score
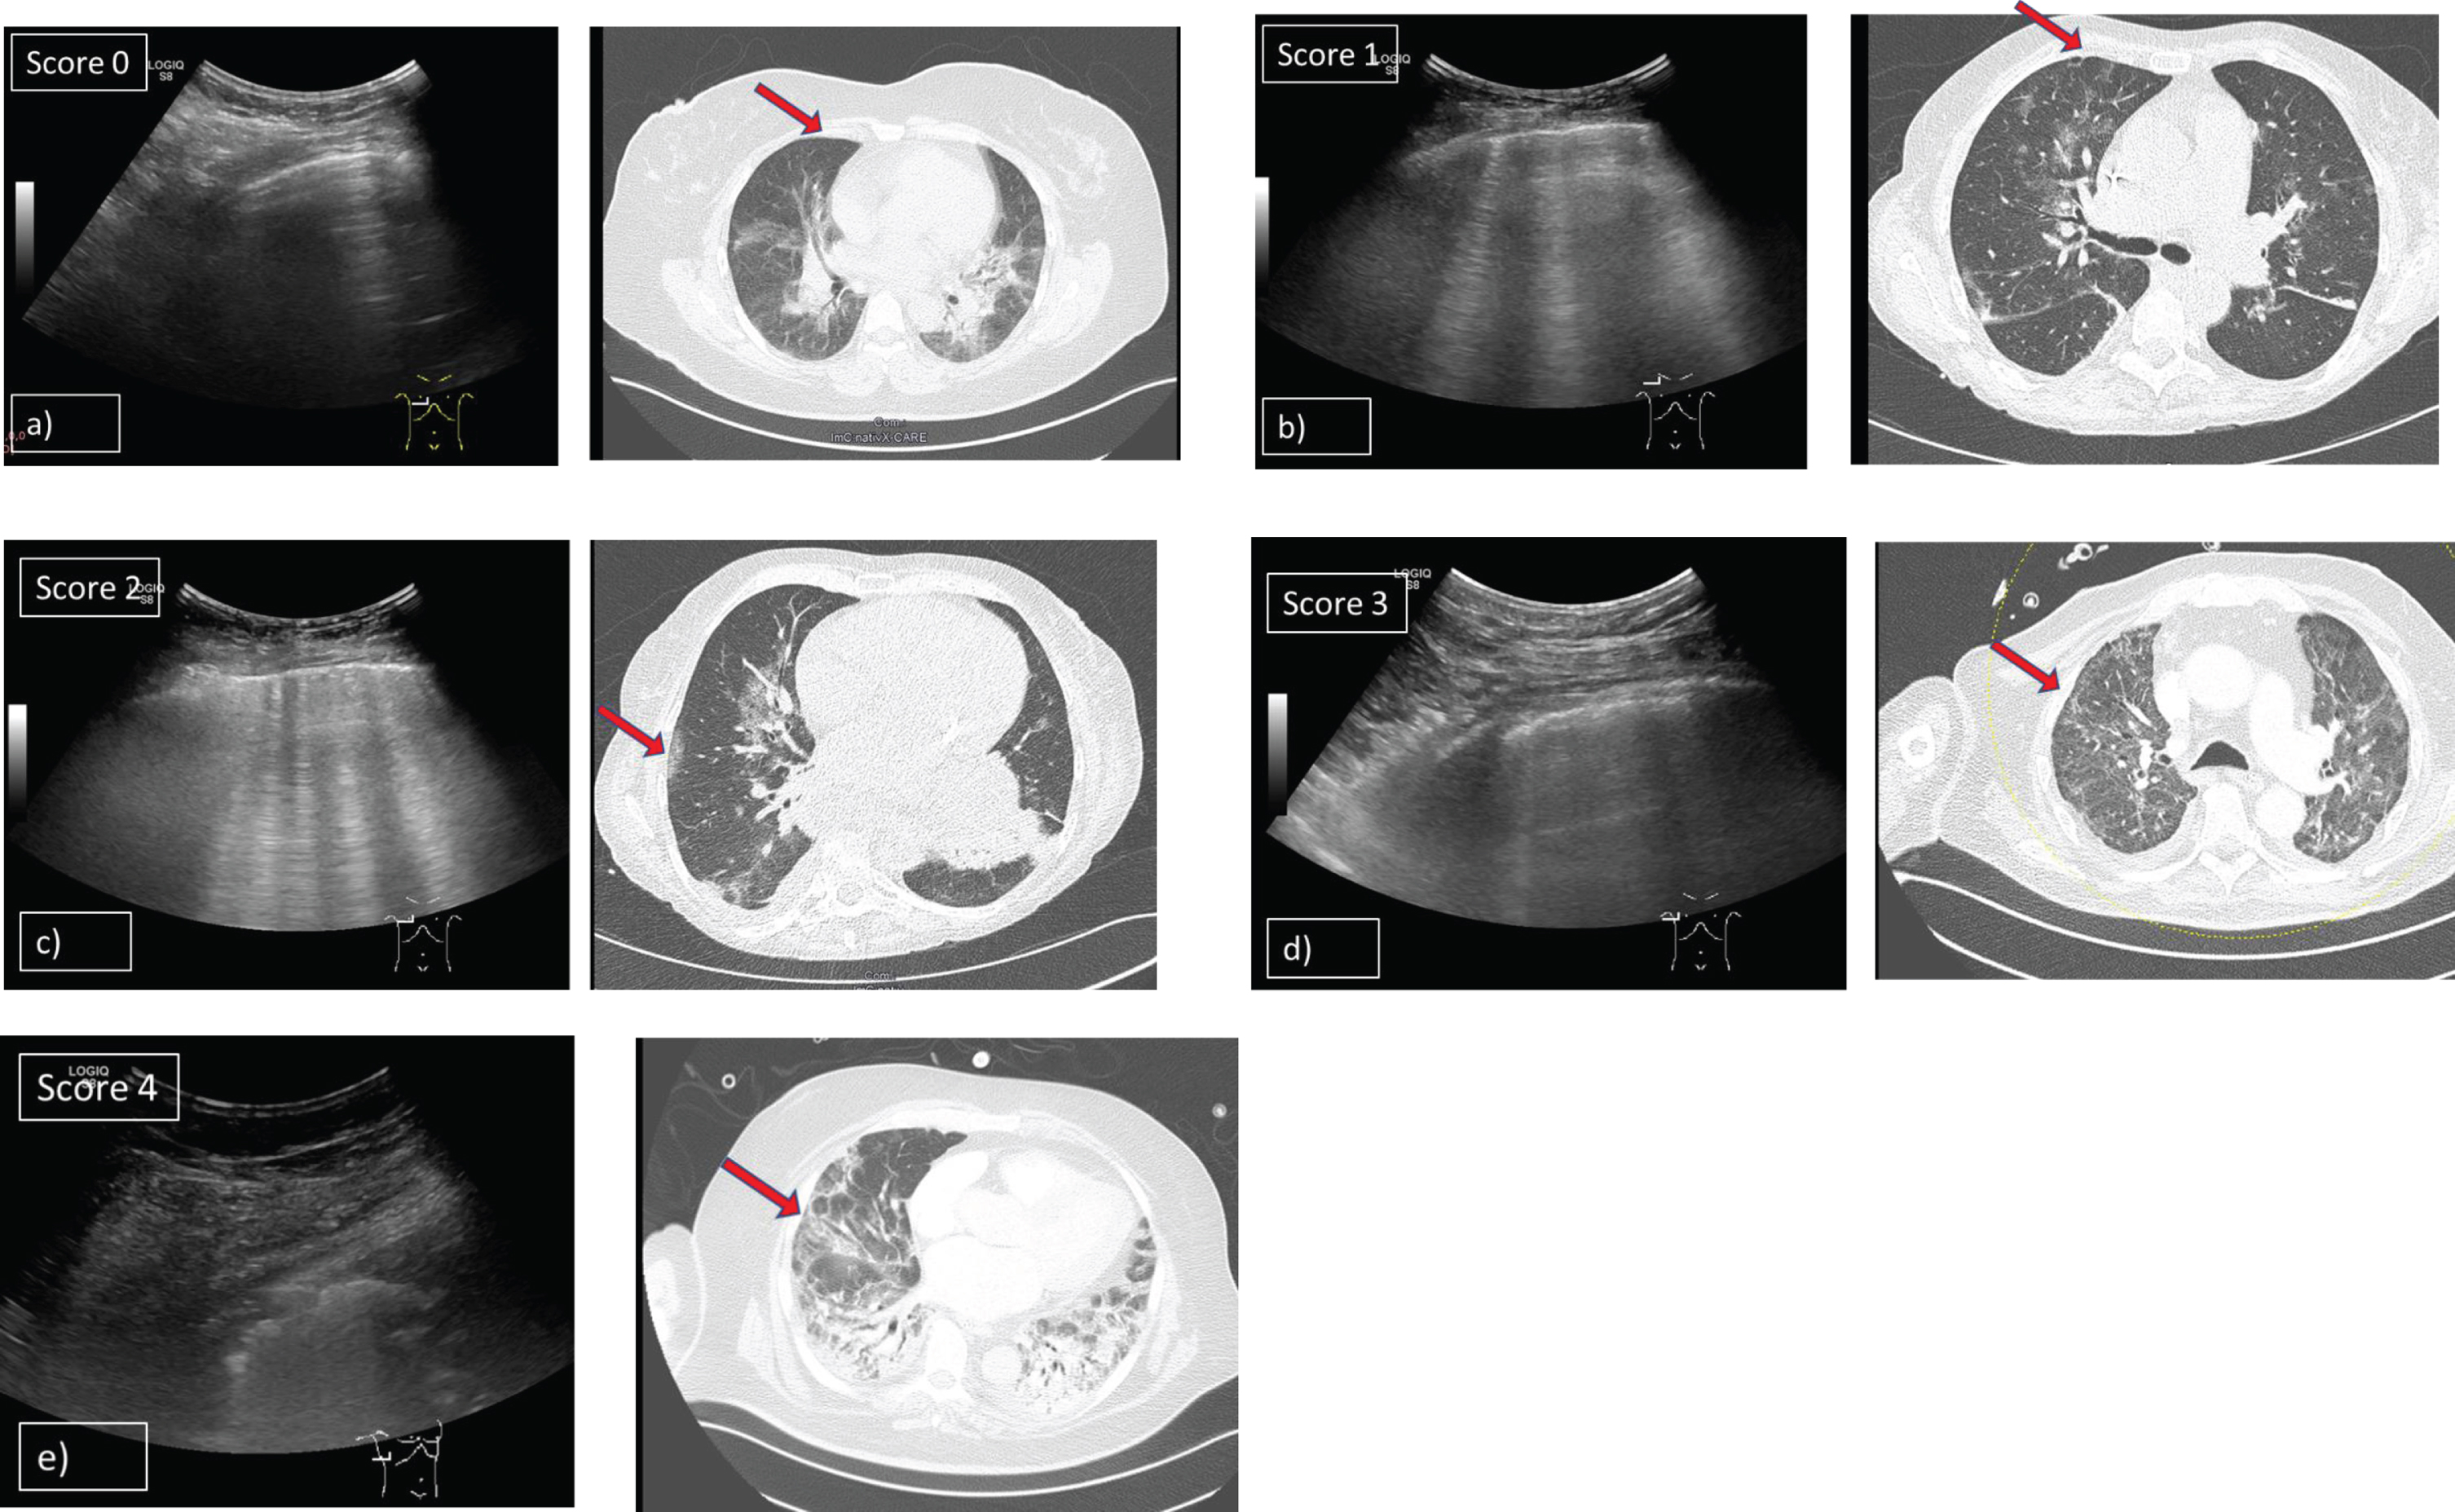
LUS findings described by Huang et al. [10] and Peng et al. [11] discriminated different findings, describing focal, multifocal and confluent B-lines, pleural line irregularity, and consolidations. We graded typical findings of COVID-19 in five levels: 0 points were given if A-lines were present, 1 point if there were more than 2 (≥3) single B-lines, 2 points if there were waterfall B-lines or coalescent B-lines, 3 points if there were marked pleural disruptions and 4 points if consolidations with air bronchogram sign were apparent (Fig. 2). Assessment of a lung aeration score (LAS) was done by calculating the arithmetic mean of the grades defined of all examined areas of the lung (maximum 12 areas). When LUS was performed we retrospectively graded each examined area of a patient's lung and gave 0 to 4 points for each area as shown in Fig. 2. The sum of all points was divided through the number of examined areas. This calculation resulted in an arithmetic mean which was defined as the patient’s LAS.
Fig. 2
Grading system of lung opacities used for the lung aeration score in patients with ARDS and COVID-19 pneumonia. Shows findings of LUS in patients with COVID-19 pneumonia and corresponding HRCT scans. 5 levels of typical opacities of the lung could be observed and were graded in a scoring system from minimum 0 points to maximum 4 points. a) Score 0: A-lines detected by ultrasound B-mode using a 1–5 MHz convex probe and corresponding HRCT scan (CT was done 3 days before LUS). b) Score 1: More than 2 (≥3) single B-lines detected by ultrasound B-mode using a 1–5 MHz convex probe and corresponding HRCT scan (CT was done 3 days before LUS). c) Score 2: Multiple, coalescent B-lines detected by ultrasound B-mode using a 1–5 MHz convex probe and corresponding HRCT scan (CT was done 4 days before LUS). d) Score 3: Marked pleural disruptions detected by ultrasound B-mode using a 1–5 MHz convex probe and corresponding HRCT scan (CT was done at the same day as LUS). e) Score 4: Severe consolidations with air bronchogram sign detected by ultrasound B-mode using a 1–5 MHz convex probe and corresponding HRCT scan (CT was done at the same day as LUS).
2.3Clinical parameters
Demographics, ventilatory parameters, parameters of blood gas analysis and laboratory markers were obtained from the local electronic database (SAP® and MetaVision®). Time interval between LUS and ventilatory parameters and chemistries were at maximum 6 hours, 12 hours respectively. The following parameters defining ventilation were obtained by results of blood gas analysis: PaCO2 (mmHg), PaO2 (mmHg), FiO2 (%), Horovitz index (PaO2/FiO2) and oxygen saturation SO2 (%). Positive end-expiratory pressure (PEEP) was given by automatic transfer by the ventilation device to the digital patient file (MetaVision®). C-reactive protein (CRP, mg/l) Lactate dehydrogenase (LDH, U/l), interleukin 6 (IL-6, pg/ml) and ferritin (μg/l) levels were obtained by the digital documentation system SAP®).
2.4Statistics
Statistical analyses were performed using Excel (Microsoft®, US) and SPSS (SPSS Statistics 25, IBM®, USA). Spearman rho test was calculated, comparing the value of the assessed lung aeration score with ventilation parameters and laboratory findings. A correlation coefficient r≥0,3 was considered as a moderate correlation and r≥0,5 as a strong correlation. T-Test was done to compare different groups. A p value < 0,05 was considered as significant. The study was conducted according to the declaration of Helsinki and was approved by the local ethical commission board in cooperation with the ethical board of the University of Tübingen (Number: 432/2020BO). The manuscript was written in accordance with the guidelines of Clinical Hemorheology and Microcirculation (Ethical guidelines for publication in Clinical Hemorheology and Microcirculation: Update 2016, Clin Hemorheol Microcirc. 2016;63(1):1-2).
3Results
Median body mass index (BMI) was 28.6±5.58 kg/m2, median time from first diagnosis of COVID-19 to LUS assessment was 15±14.9 days. In seven patients, LUS was performed in prone position, in 13 LUS was done in supine position. Patients were ventilated by pressure control. Five patients were treated with veno-venous extracorporeal membrane oxygenation (vvECMO) and seven patients required dialysis when LUS was performed. Patients characteristics are summarized in Table 1.
Table 1
Characteristics of patients with COVID-19 pneumonia who had lung ultrasound
| Factor | N = 20 | % |
| Male | 15 | 83.3 |
| Female | 5 | 16.7 |
| Mean age (years)* | 59,5 (36–68)* | |
| BMI | 28.7 kg/m2 (19.2–41.5)* | |
| Time from first diagnosis of COVID-19 to examination (days) | 15.5 (1–52)* | |
| Supine position | 13 | 72.2 |
| Prone position | 7 | 38.8 |
| Parameters of intensive care | ||
| Pressure control ventilation | 20 | 100 |
| Diagnosis of ARDS | 20 | 100 |
| ECMO at timepoint of examination | 5 | 25 |
| Dialysis at timepoint of examination | 7 | 35 |
*Median (range).
Results of the LAS are shown in Table 2. A maximum of 12 defined areas were examined (Fig. 1) and a grade ranging from 0 to 4 was classified as described at the section patients and methods (Fig. 2).
Table 2
Lung aeration score in patients with COVID-19 pneumonia
| a) | Supine position/segment | Lung aeration score Mean | |||||||||||
| Anterior left lobe | Anterior right lobe | Lateral left lobe | Lateral right lobe | ||||||||||
| Patient | A1 | A | AL2 | AL | A | A | AL | AL | L3 | L | L | L | |
| up | low | up | low | up | low | up | low | up | low | up | low | ||
| P001 | 1 | 3 | 2 | 2 | 1 | 2 | 4 | 4 | 4 | 2 | 4 | 4 | 2.75 |
| P004 | 3 | 3 | 2 | 3 | 3 | 0 | 3 | 2 | 2 | 3 | 4 | 3 | 2.58 |
| P005 | 2 | 3 | 4 | 3 | 3 | 4 | 4 | 2 | 4 | 4 | 4 | 4 | 3.42 |
| P006 | 4 | 4 | 4 | 2 | 4 | 4 | 3 | 4 | 4 | 4 | 4 | 2 | 3.58 |
| P007 | 3 | 3 | 4 | 2 | 3 | 1 | 3 | 2.38* | |||||
| P008 | 2 | 3 | 3 | 3 | 2 | 4 | 4 | 4 | 4 | 3.22 | |||
| P011 | 3 | 3 | 2 | 3 | 2 | 3 | 4 | 2 | 3 | 4 | 4 | 3.00 | |
| P013 | 4 | 3 | 4 | 3 | 4 | 3 | 4 | 3.57 | |||||
| P014 | 4 | 4 | 4 | 2 | 3 | 1 | 3 | 4 | 4 | 2.90 | |||
| P015 | 4 | 4 | 3 | 4 | 4 | 4 | 4 | 3 | 3.75 | ||||
| P016 | 4 | 3 | 4 | 4 | 3.75* | ||||||||
| P017 | 3 | 4 | 4 | 4 | 4 | 3 | 2 | 4 | 3.5 | ||||
| P018 | 4 | 4 | 4 | 4 | 4 | 4 | 3 | 2 | 4 | 4 | 3.82 | ||
| Mean per area | 3.08 | 3.45 | 3.13 | 3.14 | 3.08 | 3.08 | 3.09 | 3.17 | 3.29 | 3.33 | 3.67 | 3.56 | 3.42 |
| b) | Prone position/segment | ||||||||||||
| Dorsal left lobe | Dorsal right lobe | Lateral left lobe | Lateral right lobe | Mean | |||||||||
| Patient | D4 | D | DL5 | DL | D | D | DL | DL | L | L | L | L | |
| up | low | up | low | up | low | up | low | up | low | up | low | ||
| P002 | 4 | 2 | 2 | 3 | 2 | 2 | 4 | 3 | 4 | 4 | 4 | 3.09 | |
| P003 | 4 | 3 | 1 | 2 | 4 | 3 | 2 | 2 | 2 | 4 | 2.7 | ||
| P009 | 3 | 4 | 4 | 4 | 4 | 4 | 3 | 4 | 4 | 4 | 4 | 4 | 3.83 |
| P010 | 4 | 2 | 4 | 4 | 4 | 2 | 3 | 2 | 4 | 3 | 3.2 | ||
| P012 | 4 | 4 | 2 | 4 | 3 | 2 | 3 | 3 | 4 | 4 | 3.3 | ||
| P019 | 3 | 2 | 2 | 3 | 1 | 4 | 3 | 3 | 2 | 4 | 2 | 4 | 2.75 |
| P020 | 4 | 0 | 1 | 3 | 3 | 3 | 4 | 3 | 4 | 4 | 4 | 1 | 2.83 |
| Mean per area | 3.71 | 2.43 | 2.29 | 3.29 | 3.00 | 2.86 | 3.14 | 2.86 | 3.20 | 4.00 | 3.50 | 3.20 | 3.09 |
1: A = anterior area, 2: AL = anterior lateral area, 3: L = lateral area, 4: D = dorsal area, 5: DL = dorsal lateral area. Lung opacities were graded from 0 to 4. Lung aeration score was assessed by building the arithmetic mean of all examined areas. Results are shown for patients in supine position [a)] and patients in prone position [b)]. The mean of the grading for each examined area (mean per area) is given for patients examined in supine position and patients examined in prone position.
LAS was determined by calculating the arithmetic mean of all grades defined for each patient. In 13 out of 20 patients, LUS was performed in supine position, in 7 patients while being settled in prone position. Notably, in 55% of patients at least one out of twelve areas of the lung, which have been intended to be examined, could not be examined. This was mostly true for the left lateral segment when patients were placed in lateral-decubitus position. Two patients placed in supine position had multiple band-aids, which were necessary due to pressure ulcers after being placed in prone position. In these two patients (Pat 007 and Pat 0016) only one area of the anterior left segment could be examined. For this reason, these two patients were excluded from statistical analysis. Median LAS was 3.21 (Range 2.58 –3.83); in patients in supine position median LAS was 3.42 (2.58 –3.82), median LAS of patients in prone position was 3.09 (2.58 –3.83). Comparing the grading of the examined lung segments by arithmetic means showed highest levels in lateral lung segments. T-Test, comparing patients in supine and in prone position showed no significant difference (p = 0.43).
To analyse the correlation of clinical and laboratory parameters with the levels of LAS Pearson correlation was performed. LAS of each patient and ventilation parameters as well as laboratory findings, which were included in this comparison are shown in Table 3.
Table 3
Lung aeration score and clinical parameters of COVID-19 patients
| Patient | Lung aeriation score | Time of ventilation (days per patient) | ECMO | pCO2 (mmHg) | PaO2 (mmHG) | FiO2 (%) | Horovitz index | PEEP | SO2 (mmHg) | CRP (mg/l) | LDH (U/l) | IL-6 (pg/ml) | Ferritin (μg/l) |
| P001 | 2.75 | 20 | no | 38 | 76 | 45 | 170 | 10 | 96 | 126 | 232 | 665 | 733 |
| P002 | 3.09 | 23 | no | 12 | 117 | 23 | 509 | 9 | 95 | 433 | 766 | 271 | 1986 |
| P003 | 2.70 | 19 | no | 40 | 84 | 50 | 169 | 12 | 97 | 210 | 323 | 389 | 887 |
| P004 | 2.58 | 12 | no | 30 | 65,9 | 98 | 150 | 8 | 89 | 151 | 396 | 179 | 686 |
| P005 | 3.42 | 39 | yes | 53 | 86 | 55 | 123 | 12 | 97 | 102 | 339 | 385 | 726 |
| P006 | 3.58 | 74 | no | 61 | 84 | 60 | 139 | 10 | 94 | 180 | 502 | 1822 | 615 |
| P008 | 3.22 | 33 | no | 46 | 96 | 30 | 299 | 5 | 98 | 27 | 263 | 24 | 2745 |
| P009 | 3.83 | 24 | no | 68, | 77 | 61 | 126 | 17 | 95 | 290 | 180 | 190 | 1245 |
| P010 | 3.20 | 32 | yes | 40 | 64 | 35 | 184 | 13 | 93 | 202 | 656 | 278 | 2316 |
| P011 | 3.00 | 25 | yes | 45 | 116 | 35 | 331 | 13 | 98 | 51 | 794 | 71 | 1918 |
| P012 | 3.30 | 17 | no | 74 | 102 | 50 | 204 | 16 | 98 | 211 | 489 | 85 | 5666 |
| P013 | 3.57 | 22 | no | 52 | 78 | 41 | 196 | 13 | 96 | 48 | 399 | 25 | 2367 |
| P014 | 2.90 | 12 | no | 58 | 89 | 45 | 199 | 15 | 97 | 275 | 875 | 231 | 1593 |
| P015 | 3.75 | 25 | no | 60 | 99 | 45 | 220 | 14 | 96 | 220 | 283 | 82 | 2560 |
| P017 | 3.50 | 46 | yes | 45 | 88 | 35 | 253 | 10 | 98 | 201 | 444 | 2533 | 8621 |
| P018 | 3.82 | 38 | no | 45 | 125 | 55 | 260 | 8 | 98 | 39 | 684 | 33 | 41174 |
| P019 | 2.75 | 24 | yes | 35 | 104 | 40 | 299 | 14 | 98 | 283 | 325 | 347 | 1282 |
| P020 | 2.83 | 16 | no | 48 | 77 | 60 | 129 | 14 | 91 | 129 | 354 | 129 | 799 |
| Median1 | 3.21 | 23.5 | yes = 5 | 46.8 | 88.7 | 45 | 197.5 | 12.7 | 96.5 | 180.5 | 375 | 210.5 | 1885 |
| (Interquartile Range) | (2.58–3.82) | (10–74) | (12–74) | (64–125) | (23–98) | (123–509) | (5–17) | (87–98) | (27–433) | (180–875) | (24–2533) | (615–41174) |
1: Median and range of each parameter is described and number of patients treated with extracorporeal membrane oxygenation (ECMO).
We choose CRP, LDH, IL-6 and ferritin for laboratory findings, because these parameters are associated with bad prognosis of COVID-19 pneumonia [12, 13]. Median time of ventilation was 23.5 days. This study was performed as cross section study. Some patients were transferred to the university hospital of Regensburg to optimize ventilation or for ECMO treatment. These patients were already ventilated for a longer period of time in cooperating hospitals before. This implicates a wide range of days of ventilation at the timepoint when LUS was performed (1 –52 day). 8 Patients were examined in the first 10 days of ventilation (mean 4 days) and 10 patients after more than 10 days (mean 20.5 days). 5 patients were treated at ECMO when LUS was done. LAS was higher in the group of patients with ventilation time of more than 10 days (median LAS 2.9 vs 3.4; p = 0.016). Patients with or without need of ECMO-treatment had no difference in LAS (p = 0.49). Spearman roh correlation revealed moderate correlation of LAS with paO2 levels (r = 0.336; p = 0.173) and ferritin levels (r = 0.467; p = 0.051), however showing no significance. PaCO2 level was the only parameter showing a strong significant correlation to the LAS (r = 0.632; p = 0.005) in our cohort. Ventilation-time, Horovitz index, PEEP, SO2 and values of CRP, LDH and IL-6 showed no correlation with LAS (Table 4). Patients with a Horovitz index of < 150 mmHg did not show any difference in LAS compared to > 150 mmHg (T-Test, p = 0,495).
Table 4
Spearman rho correlation of lung aeriation score with parameters of ventilation and laboratory findings
| Factor | n | Mean (range) | r-value | p-value |
| Ventilation | ||||
| Ventilation (days) | 18 | 23.5 (10 –74) | 0.122 | 0.629 |
| paO2 (mmHg) | 18 | 88.7 (64.4 –125) | *0.336 | 0.173 |
| paCO2 (mmHg) | 18 | 46.75 (12 –74.3) | **0.632 | 0.005 |
| Horovitz index (paO2/FiO2) | 18 | 197.5 (123 –509) | 0.106 | 0.674 |
| Laboratory findings | ||||
| CRP (mg/l) | 18 | 180 (27.2 –433) | –0.135 | 0.594 |
| LDH (U/l) | 18 | 375 (180 –875) | 0.016 | 0.951 |
| IL-6 (pg/ml) | 18 | 210.5 (23–2533) | –0.299 | 0.36 |
| Ferritin (μg/l) | 18 | 1885 (615 –41174) | *0.467 | 0.051 |
*Moderate correlation. **Strong correlation.
4Discussion
Clinical outcome of patients with SARS-CoV-2 is often determined by pulmonary disease. Severe ARDS is reported in up to 15 to 31 % of patients with pneumonia [14, 15]. However, also beyond the massive aggression of the lung with severe pulmonary failure, as well as kidney and liver injuries, heart, brain, bowel and spleen damages with lymph nodes necrosis and even cutaneous manifestations have been observed [16]. Ultrasound diagnostic is a cost effective and world-wide accessible device to assess pneumonia [17, 18]. Especially in the COVID-19 pandemic it is proposed as a bed-side tool to minimize need for patient transport and therefore reduce exposure of medical staff and nosocomial transmission [19]. Typical findings have been described during the onset of the pandemic and include ≥3 single B-lines, confluent / coalescent B-Lines and consolidations [20].
In regards of the technique used to assess lung opacities by LAS, Soldati et al. anticipated a “standardization of the use of lung ultrasound for patients with COVID-19” in March 2020 and proposed to examine three areas on the back two lateral areas and two ventral areas [21]. The authors conceded that the posterior areas might be difficult to evaluate in supine position. However, as proposed by the German association for intensive care medicine (DGIIN), LUS is especially recommended in severely ill patients with ARDS [19]. In ventilated patients with ARDS it emerged in real life setting, that it is often only possible to assess either the ventral and lateral or the dorsal and lateral areas of the lung by point-of care bed side LUS, depending if the patient is placed in supine position or prone position. Therefore, we decided to examine either 4 ventral and 4 dorsal areas plus 2 lateral areas at each side of the thorax.
Before COVID-19 pandemic, the assessment of lung aeration by ultrasound has been used in patients with ARDS and a scoring system to quantify the grade of lung involvement in ARDS has been set up for these patients. Lung-collapse regions could be assessed by LUS in ARDS and influenced by alteration of PEEP and position of the patient [22, 23]. A scoring system was applied by Soummer et al. and Algieri et al., which graded the severity of lung disease into four ultrasound findings describing normal A-lines, non-coalescent (single) B-lines, coalescent B-lines and consolidations [24, 25]. Six predefined areas of the lung were assessed by the grading system and a cumulative score showed significant correlation to the CT scan and to the response to prone position [26]. In COVID-19 patients severely broken pleural lines is an additionally specific finding as described by Soldati et al. and Denault et al. [21, 27]. Soldati et al proposed 3 grades of severity in lung ultrasound in COVID-19 patients. A-lines giving 0 points, indented pleural lines giving 1 point, severely broken pleural lines with consolidations giving 2 points and a white lung with or without greater consolidations giving 3 points. However, this scoring system did include 30 COVID-19 patients of which an unknown quantity of cases was non-ventilated patients and the clinical condition of the patients was not correlated. However, our aim was to quantify lung aeration in severely ill patients in the style of prescribed lung aeration scores in patients with ARDS. For this reason, we decided to choose a scoring system according to the one proposed by Algieri et al. and to complement this system by the COVID-19 specific finding of broken pleural lines. In aspect of these findings we rated our scoring system, which describes an increase of lung opacities and assesses COVID-19 specific peripheral alterations of the lung. Our grading by the proposed LAS, confirms a CT scan analysis from Shi et al. [28], showing, that lower, lateral subpleural areas are more severely affected by COVID-19 pneumonia. In our findings the highest level of 4 points was reached in the lateral left lobe in patients which were settled in prone position. In supine position lateral areas had highest LAS, these are the best accessible dorsal-near points in patients settled in this position. These findings underline the accuracy of the proposed LAS.
ARDS in COVID-19 pneumonia isn’t fully understand yet, however there have been described some differences compared to patients with non-COVID associated ARDS [29]. Berlin criteria defined ARDS onset as maximum 7 days after a respiratory insult [30]. However, the onset of ARDS occurs 8 to 12 days after the initial diagnosis of a COVID-19-associated pneumonia [1, 31, 32]. This specific feature of COVID-19 related ARDS is consistent with findings of LAS in our cohort, which was significantly higher in patients who have been ventilated for more than 10 days.
CO2 retention is associated with bad prognosis in patients with severe COVID-19 pneumonia and need of ventilation or extracorporeal membrane oxygenation [33]. A possible explanation would be, that in COVID-19 associated ARDS alveolar endothelial cells are more affected than endothelial cells, causing a higher shunting of CO2 rich blood [34]. Furthermore, alveolar capillary microthrombi could decrease CO2 diffusion and increase dead air volume [35]. Interestingly in our study oxygenation index showed no correlation with LAS and patients with a Horovitz index of <150 mmHg did neither show any difference in LAS. Notably, CO2 measured in blood gas analysis at the day when LUS was performed, was the only ventilation associated parameter which showed significant correlation with the level of the proposed LAS. These findings might be associated with the distinct pathogenesis of ARDS in patients with COVID-19 pneumonia.
Biochemical parameters associated with poor outcome in COVID-19 pneumonia [9, 10] did not show any significant correlation with the LAS. However, ferritin levels tended to correlate with LAS. This observation suggests that the onset of inflammatory processes in COVID-19 pneumonia is not necessarily associated with the grade of lung opacities.
Several limitations of the study should be noted. The number of patients included in this single-centre cross-section study is limited. Ultrasound diagnostic was performed at different stages and phases of patients with severe COVID-19 pneumonia. The bedside LUS examination for COVID-19 pneumonia needs time to perform, experienced examiners and high-resolution probes, especially to detect the early peripheral pulmonary changes. LUS is very useful for the follow up in severe cases. Cineloops were only taken, if the examiner found frames not precise. Therefore, a prospective multicentre study with a follow-up examination of the lung by ultrasound is needed, to verify the precision of the proposed LAS and the correlation to clinical parameters and laboratory markers.
5Conclusion
A lung aeration score, defining 4 grades of lung alterations in specified areas of the lung by bed side-ultrasound could be a useful tool to monitor lung disease and function in patients with severe COVID-19 pneumonia. The proposed score shows significant correlation with CO2 retention in patients with severe ARDS. However, these findings were collected in a cross-section analysis and accuracy of the score must be confirmed in a longitudinal prospective study.
References
[1] | Wang DW , Hu C , Hu B , et al. Clinical characteristics of 138 hospitalized patients with 2019 novel coronavirus-infected pneumonia in Wuhan, China. JAMA. (2020) ;323: (11):1061–9. |
[2] | Yang X , Yu Y , Xu J , et al. Clinical course and outcomes of critically ill patients with SARS-CoV-2 pneumonia in Wuhan, China: A single centered, retrospective, observational study. Lancet Respir Med. (2020) ;8: (5):475–81. |
[3] | Küpper JH , Jung F , Krieger V , Hufert F . A comparison of *COVID*-*19* mortality rates between European and Asian States. Clin Hemorheol Microcirc. (2020) ;75: (1):3–5. |
[4] | Shi H , Han X , Jiang N , Cao Y , Alwalid O , Gu J , et al. Radiological findings from 81 patients with COVID-19 pneumonia in Wuhan, China: a descriptive study. Lancet Infect Dis. (2020) ;20: (4):425–34. |
[5] | Schaible J , Meiler S , Poschenrieder F , Scharf G , Maintz D , Pregler B , Stroszczynski C , Hamer OW . Radiology of COVID-19 Pneumonia - Pictorial Essay and Structured Reporting. Rofo. (2020) ;192: (6)::513–7. doi: 10.1055/a-1164-7001. Epub 2020 May 27 |
[6] | Jung EM , Stroszczynski C , Jung F . Contrast enhanced ultrasound (CEUS) to assess pleural pulmonal changes in severe Covid-19 infection: First results. Clin. Hemorheol. Microcirc. (2020) ;75: (1):19–26. doi: 10.3233/CH-209005 |
[7] | Jung EM , Stroszczynski C , Jung F . Contrast enhanced ultrasonography (CEUS) to detect abdominal microcirculatory disorders in severe cases of COVID-19 infection: First experience. Clin Hemorheol Microcirc. (2020) ;74: (4):353–61. doi: 10.3233/CH-209003 |
[8] | Sultan RL , Sehgal MC . A review of early experience in lung ultrasound (LUS) in the diagnosis and management of COVID-19. Ultrasound Med Biol. (2020) ;25: :S0301–5629(20)30221–0. doi: 10.1016/j.ultrasmedbio.2020.05.012 |
[9] | Bello G , Balnco P . Lung Ultrasonography for Assessing Lung Aeration in Acute Respiratory Distress Syndrome. J Ultrasound Med. (2019) ;0278–4297. doi: 10.1002/jum.14671 |
[10] | Huang Y , Wang S , Liu Y , Zhang Y , Zheng C , Zheng Y , et al. A Preliminary Study on the Ultrasonic Manifestations of Peri pulmonary Lesions of Non-Critical Novel Coronavirus Pneumonia (COVID-19). SSRN Electron J. (2020) . doi:https://dx.doi.org/10.2139/ssrn.3544750 |
[11] | Peng QY , Wang XT , Zhang LN . Findings of lung ultrasonography of novel corona virus pneumonia during the 2019–2020 epidemic. Intensive Care Med. (2020) ;46: (5):849–50. |
[12] | Velavan TP , Meyer GC . Mild Versus Severe COVID- Laboratory Markers. Int J Infect Dis. (2020) ;95: , 304–7. |
[13] | Henry MB , Santos de Oliveira MH , Benoit S , Plebani M , Lippi G . Hematologic, biochemical and immune biomarker abnormalities associated with severe illness and mortality in coronavirus disease 2019 (COVID-19): a meta-analysis. Clin Chem Lab Med. (2020) ;58: (7):1021–8. |
[14] | Huang C , Wang Y , Li X , et al. Clinical features of patients with 2019 novel coronavirus in Wuhan, China. Lancet. (2020) ;395: (10223):497–506. |
[15] | Rodriguez-Morales AJ , Cardona-Ospina JA , Gutiérrez-Ocampoa E , Villamizar-Peña R , Holguin-Riveraa Y , Escalera-Antezana JP , et al. Clinical, laboratory and imaging features of COVID- A Systematic Review and Meta-Analysis. Travel Med Infect Dis. (2020) ;34: :101623. doi: 10.1016/j.tmaid.2020.101623 |
[16] | Martini R . The compelling arguments for the need of microvascular investigation in *COVID*-*19* critical patients. Clin Hemorheol Microcirc. (2020) ;75: (1):27–34. |
[17] | Mayo PH , Copetti R , Feller-Kopman D , Mathis G , Maury E , Mongodi S , Mojoli F , Volpicelli G , Zanobetti M . Thoracic ultrasonography, A narrative review. Intensive care medicine. (2019) ;45: , 1200–11. |
[18] | Volpicelli G , Elbarbary M , Blaivas M , Lichtenstein DA , Mathis G , Kirkpatrick AW , Melniker L , et al. International evidence-based recommendations for point-of-care lung ultrasound. Intensive Care Med. (2019) ;45: (9):1200–11. |
[19] | Kluge S , Janssens U , Welte T , Wber-Carstens S , Marcx G , Karaglannidis C . Empfehlungen zur intensivmedizinischen Therapie von Patienten mit COVID. Dtsch Arztebl. (2020) ;117: (12):A–582 / B–503. |
[20] | Xing C , Li Q , Du H2 Kang W , Lian J , Yuan L . Lung ultrasound findings in patients with COVID-19 pneumonia. Critical Care. (2020) ;24: :174. doi: 10.1186/s13054-020-02876-9 |
[21] | Soldati G , Smargiassi A , Inchingolo R , Buonsenso D , Perrone T , Briganti DF , et al. Proposal for International Standardization of the Use of Lung Ultrasound for Patients With COVID-19. J Ultrasound Med. (2020) ;39: (7):1413–9. |
[22] | Stefanidis K , Dimopoulos S , Tripodaki ES , et al. Lung sonography and recruitment in patients with early acute respiratory distress syndrome: a pilotstudy. CriticalCare. (2011) ;15: :R185. doi: 10.1186/cc10338 |
[23] | Rode B , Vucic' M , Siranovic M , et al. Positive end-expiratory pressure lung recruitment: comparison between lower inflection point and ultrasound assessment. Wien Klin Wochenschr. (2012) ;124: , 842–7. |
[24] | Soummer A , Perbet S , Brisson H , et al. Ultrasound assessment of lung aeration loss during a successful weaning trial predicts postextubation distress. Crit CareMed. (2012) ;40: , 2064–72. |
[25] | Algieri I , Mongodi S , Chiumello D , et al. CT scan and ultrasound comparative assessment of PEEP-induced lung aeration changes in ARDS. Crit Care. (2014) ;18: (suppl 1):P285. doi: 10.1186/cc13475 |
[26] | Prat G , Guinard S , Bizien N , et al. Can lung ultrasonography predict prone positioning response in acute respiratory distress syndrome patients? J Crit Care . (2016) ;32: , 36–41. |
[27] | Denault AY , Delisle S , Canty D , Royse A , Royse C , Serra XC et al. A proposed lung ultrasound and phenotypic algorithm for the care of COVID-19 patients with acute respiratory failure. Can J Anesth/J Can Anesth. (2020) ;21: , 1–12. |
[28] | Shi H , Han X , Jiang N , Cao Y , Alwalid O , Gu J . Radiological findings from 81 patients with COVID-19 pneumonia in Wuhan, China: a descriptive study. Lancet Infect Dis. (2020) ;20: (4):425–34. |
[29] | Xu L , Ma X . Acute respiratory failure in COVID- is it “typical” ARDS? Critical Care. (2020) ;24: :198. doi: 10.1186/s13054-020-02911-9 |
[30] | Ranieri VM , Rubenfeld GD and the Definition Task Force ARDS. Acute respiratory distress syndrome: the Berlin definition. JAMA. (2012) ;307: , 2526–33. |
[31] | Guan WJ , Ni ZY , Hu Y , et al. Clinical characteristics of coronavirus disease 2019 in China. N Engl J Med. (2020) ;382: (18):1708–20. |
[32] | Zhou F , Yu T , Du R , et al. Clinical course and risk factors for mortality of adult inpatients with COVID-19 in Wuhan, China: a retrospective cohort study. Lancet. (2020) ;395: (10299):1054–62. |
[33] | Yang X , Cai S , Luo Y , Zhu F , Hu M , Zhao Y , et al. Extracorporeal Membrane Oxygenation for Coronavirus Disease 2019-Induced Acute Respiratory Distress Syndrome: A Multicenter Descriptive Study. Crit Care Med. (2020) . doi: 10.1097/CCM.0000000000004447 |
[34] | Jung F , Kruger-Genge A , Franke RP , Hufert F , Kupper J-H . COVID-19 and the endothelium. Clin Hemorheol Microcirc.7-11. (2020) ;75: (1):353–61. doi: 10.3233/CH-209007 |
[35] | Ackermann M , Verleden SE , Kuehnel M , Haverich A , Welte T , Laenger F , et al. Pulmonary Vascular Endothelialitis, Thrombosis, and Angiogenesis in Covid-19. N Engl J med. (2020) ; doi: 10.1056/NEJMoa2015432 |


