
μCT based assessment of mechanical deformation of designed PTMC scaffolds
Abstract
BACKGROUND: Advances in rapid-prototyping and 3D printing technologies have enhanced the possibilities in preparing designed architectures for tissue engineering applications. A major advantage in custom designing is the ability to create structures with desired mechanical properties. While the behaviour of a designed scaffold can be simulated using bulk material properties, it is important to verify the behaviour of a printed scaffold at the microstructure level.
OBJECTIVE: In this study we present an effective method in validating the mechanical behaviour of designed scaffolds using a μCT with an in-situ mechanical deformation device.
METHODS: The scaffolds were prepared from biodegradable poly(trimethylene carbonate) (PTMC) by stereolithography and images obtained using a high-resolution μCT with 12.25μm isometric voxels. The data was processed (filtering, segmentation) and analysed (surface generation, registration) to extract relevant deformation features.
RESULTS: The computed local deformation fields, calculated at sub-pore resolutions, displayed expected linear behaviour within the scaffold along the compressions axis. On planes perpendicular to this axis, the deformations varied by 150– 200μm.
CONCLUSIONS: μCT based imaging with in-situ deformation provides a vital tool in validating the design parameters of printed scaffolds. Deformation fields obtained from micro-tomographic image volumes can serve to corroborate the simulated ideal design with the realized product.
1Introduction
Advances in 3D printing technology have made their applications in biomedical sciences a cost effective option in designing customized solutions. Among the different techniques of 3D printing technology, stereolithography is currently recognized to be one of the most common and accurate rapid prototyping techniques [12]. This remarkable advantage in terms of resolution and precision provides considerable benefit in the development of defined tissue engineering scaffolds. A major advantage in such custom designing is the ability to create structures with desired mechanical properties.
Of interest are scaffolds with gyroid pore architectures designed by trigonometric equation with modulation of the pore size [13] and prepared by stereolithography technique using a resin based on poly(trimethylene carbonate) (PTMC). PTMC is known as a flexible and amorphous material which can degrade enzymatically by surface erosion. Its excellent properties make it possible to maintain mechanical properties of PTMC over degradation time, as the average molar mass remains constant [18]. In addition, the remarkable potential of PTMC-based scaffolds prepared by stereolithography in cell adhesion and proliferation was recently demonstrated [3, 16].
When designing scaffolds with customized mechanical properties, the characteristics of the bulk material are taken into consideration. However if the scaffolds have microstructures, any deviation from the bulk properties due to the heat extrusion process can potentially have significant effect on the micro-structural properties. Thus it becomes prudent to verify the mechanical behaviour of the scaffold under mechanical loads with respect to the simulated design. Any such verification process would involve gathering the structural geometry of a printed scaffold product, such as through tomographic imaging techniques [9, 15]. The novel method of characterising deformation for printed constructs is gaining ground and being increasingly used on products of various materials [1, 11]. Such methods have not been applied on mathematically designed PTMC constructs to date and this study was designed to address this issue.
In this study, PTMC scaffolds with 3 different designs produced by stereolithography were imaged in a μCT device with in-situ mechanical deformation. The scaffolds were designed such that the overall porosity was similar among the scaffolds. Employing image based analysis methods with image registration using triangular surface meshes, the deformation in the microstructure of the scaffolds was calculated and analysed.
2Material and methods
2.1Scaffolds – design and preparation
The scaffolds were designed in and modelled in Rhinoceros 3D (Robert McNeel & Assoc., USA) and K3dSurf (freeware; http://k3dsurf.sourceforge.net). From a trigonometric function (Equation 1), the software is able to generate CAD-file that describes a gyroid surface architecture.
(1)
The different scaffolds investigated in this work were designed to have a fixed porosity around 72% , but different pore sizes and surface area. The features of the investigated scaffolds are described in Table 1. By modulating the value of the constant C in the Equation 1, the pore characteristics such as the volume fraction and the pore size can be modulated. For this work the value of the constant (Table 1) was determined to result in a porosity as close to the target (72%) as possible. The boundary conditions indicate the periodic repetition of the gyroid channel numbers that are present in the scaffolds. In this case, the scaffolds had a cubic shape as the number of gyroid channels was the same in the x, y and z axes.
The PTMC macromer synthesis was performed as described in Blanquer et al. [3]. Briefly, the ring opening polymerization was achieved by reaction mixture of trimethylene carbonate monomer (0.98 mol, 100 g; Foryou Medical, China), with stannous octanoate (0.05 wt% ; Sigma-Aldrich, Germany) as a catalyst and 1,1,1-Tris(hydroxymethyl)propane (TMP) (0.0196 mol, 2.62 g; Sigma-Aldrich, Germany) as an initiator, under stirring for 3 days at 130°C in argon atmosphere. Proton nuclear magnetic resonance (1H-NMR, 300 MHz) was used to determine the conversion rate and the number averaged molecular weight (Mn) of the macromer. The second step of the resin preparation consisted of end-functionalization of the macromer by reactive methacrylate groups. The reaction was performed in dichloromethane (100 mL) solution by addition of methacrylic anhydride (94%) in excess (0.176 mol; 26 mL; Sigma-Aldrich, Germany) at room temperature under argon atmosphere for 5 days. The functionalization ratio was determined as well by 1H-NMR. The resin formulation was prepared by dissolution of the macromer in 30% of propylene carbonate solvent in presence of photo-initiator Lucirin TPO-L (5 wt% ; BASF, Germany) and Orasol Orange dye (0.15 wt% ; Ciba Specialty Chemicals, Switzerland) in order to control the blue light penetration (400–550 nm). Once the resin synthesized, the scaffolds were built using stereolithograph apparatus (Perfactory MiniMultilens, EnvisionTEC Inc., USA) at a pixel resolution of 16×16μm2 and a layer thickness of 25μm. The irradiation time for solidifying each layer was fixed at 40 s for a light intensity of 20 mW/cm2. The scaffolds were purified by acetone extraction twice and dried stepwise in ethanol. Reagents and solvents were of analytical grade and used as received.
2.2Compression device and imaging
A mechanical compression device was fabricated to be used in conjunction with an Xradia high-resolution μCT device (Xradia XCT400, Zeiss, Germany) (Fig. 1). The scaffold sample was placed within a polycarbonate tube, between opposing pistons. The compression of a sample was performed by mechanically moving the top piston with the stationary bottom piston acting as a sample stage. The top piston assembly (80 gms) was screwed-in until it was resting on the sample and the position was fixed, thus providing an initial static loading force in the range of 0.8±0.1 N. In keeping with the scope of the study, the applied forces were not monitored. Subsequent to sample loading the pre and post compression tomographic image volumes were obtained. The imaging parameters (Table 2) were set similarly for all 3 samples. As the samples were of a single phase material with a low attenuation, filters were not required. The reconstruction was performed by the native Xradia reconstruction software.
2.3Analysis
The reconstructed image volumes obtained from the μCT device were imported into Avizo image processing software (VSG/FEI, Mérignac Cedex, France). The software is able to directly load the native file format (txm) from the Xradia device. Thus all global coordinate positions with respect to the sample within the instrument were transferred forward in the analysis procedures. Subsequent to non-local means filtering [4] to improve the signal to noise ratio, the image volumes were segmented using simple thresholding procedures. As the samples were of a homogenous material exhibiting high contrast with respect to the background, these simple image processing tasks were sufficient for extracting the region of interest. Morphological methods were used to smooth and fill any speckles in the segmented region; the closed surface of the labelled volume was subsequently extracted in Avizo and simplified, smoothed and cleaned [7] (Fig. 2). The triangular surface meshes of the corresponding pre and post compression samples were registered using iterative closest point (ICP) algorithm with affine transformation [2]. The deformation of the scaffold under unidirectional compression loads was analysed by tracking the surface points of the pre-compression surface nodes when registered to the post-load scaffold surface. This method is a simplified variation of the volumetric strain mapping methods available [14]. The samples in this study exhibited geometric structures and were subjected to simple uni-axial deformation. Thus the global registration employed was sufficient for the study purposes to extract deformation values of the sample. The registration algorithm was iterated until it reached the lowest possible root mean square (RMS) error value with affine transformations. Subsequent to registration, the vertex positional differences were defined as the deformation at corresponding vertices. As the compression was applied axially (-Z direction of the global axes), the deformation on axial planes was calculated by averaging the deformation of all vertices lying on the plane. This value succinctly presented the distribution of deformation given in its corresponding 3D visualization. In order to visualize any deviation from an expected linear behaviour, the z-component of the deformation vector was subtracted from a linear deformation model. The model assumes linear deformation along the z-axis starting with the maximum observed z-component deformation on the top surface and 0 on the bottom resting surface. The remaining x and y-components were combined to visualize any variation within the plane of deformation along a given z-axis location. These ‘residual’ component visualizations show any peculiarities or unexpected patterns of deformation within the scaffold. All image processing and analysis tasks were performed on a WindowsfontfamilyTimes char′251 7 based desktop with an Intel® Xeon® 2.4Ghz CPU, NVIDIA Quadro 4000 graphics card and 54GB of installed RAM.
3Results
The maximum deformations applied to the 3 scaffold designs, measured from the images, were: 838±12μm (Scaffold 1), 657±12μm (Scaffold 2) and 636±12μm (Scaffold 3). The segmentation procedure gave good results when viewed visually, in part due to the high contrast and high resolution of the reconstructed images. The surface mesh representation was limited to ∼400 k faces, which was deemed adequate to represent the sample features and return acceptable execution times for the various image analysis tasks (Fig. 3). The registration process was iterated for each of the samples between 20–30 times. The RMS errors for each of the samples were in the range of 25–35 μm (∼2–3 pixels in image data), indicating an acceptable registration given the scope of this study (Fig. 3a). The direction of deformation and the corresponding magnitudes at each node when plotted over the sample surface mesh showed consistent patterns with no clearly observable anomalies. An example of this visualization is presented in Fig. 4 for scaffold B. For each of the 3 scaffold designs tested, the residual z-component deformations were present (<100 μm) that consistently indicated an axis of deformation that is not perfectly aligned with the z-axis. To aid in grasping an intuitive understanding of the results, deformation magnitudes at mesh nodes were plotted against their axial dimension (z axis; direction of applied deformation) (Fig. 5). Thus, all nodes located on the same axial plane are indexed on the horizontal axis of the plots, starting from 0 (sample bottom, resting on stage) to (∼5000 μm (sample top). The resulting scatter plot was averaged with respect to position along the horizontal axis. The distribution of vertex deformations around the average value (Fig. 5a–c – blue line) showed an increased spread with increasing magnitudes of applied deformation. However, for each scaffold design, the spread around the average value on the axial planes remains largely stable along its axial length.
4Discussion
This study demonstrated a novel in-situ imaging and image based deformation analysis procedure for analysing the structural response of PTMC scaffolds under compression. The results indicate that the different scaffold designs exhibit a linear distribution in deformation throughout the inner structure. For scaffold A which was subjected to the largest deformation, the structures at the bottom contact face showed a greater spread in the deformation values (Fig. 5a). This was expected, as with increasing deformations, the individual unattached micro-struts at the boundary deform notably. These structures at the boundary may not be complete due to their location in the design, leading to variation in deformation response. Additionally from the residual z-component and xy-component images (Fig. 4b and c), it is evident that the compressing head was applied at a slightly inclined angle. This would result in the applied deformation not being strictly perpendicular to the top surface of the sample. Hence the spread around the mean in the deformation plots in this study (Fig. 5) can be explained by two factors – the expected variation in deformation within the xy-plane due to sample incompressibility and the effect of a deformation applied at a small angle to the z-axis instead of being exactly along it. The undulations observed in graphs for scaffolds B and C (Fig. 5b and c) are also likely due to the incomplete printed structures at the sample boundary. Thus, these outliers and variations can be reasonably explained by the difference in the interconnectivity of the scaffold structure internally and on the boundaries.
When studying the performance of scaffold designs within their prospective biological environment, the size and distribution of pores have a direct bearing on the proliferation of the embedded cells [3]. In a mechano-biological environment, loads may be transmitted through the material matrix to the embedded cells within the scaffold. Thus it would be reasonable to assume that the structural response of the scaffolds to the loads may also have an influence on cell proliferation [5, 17]. With various materials available for 3D printing and the numerous designs implemented, structural verification of prototypes can be used to optimize the criteria for a selected scaffold design for a particular application [6]. This optimization may be critical in some cases where the design has to be a trade-off between structural support for tissue regeneration and stimulus for cell differentiation or proliferation. The methodology described in this study serves in displaying the value in imaging and image analysis based verification of structural response of scaffolds. The analysis includes registration of the 3D image sets – of non-deformed data to the deformed data. The registration of data was performed to track the deformation of only the surface of the sample which was segmented from the images and the represented as triangular surface meshes. In combination with high resolution image data ((∼25 μm) and relatively large sample sizes (up to 10×10×10 mm, at this resolution), it is possible to image deformations at sub-pore resolutions. The application of digital volume correlation method over image based data is widely studied. Various modifications of this algorithm assist in working with or observing the feature set of interest with higher resulting accuracy [14].
However, this initial study also brings to fore issues that will need to be addressed for accurate characterisation of such printed structures. In this study the deformation device was a simple fabrication where movement of the piston was performed by a manual screw setup. This results in loads effecting varied deformation magnitudes in our experiment (0.8±0.1 N), hindering direct comparison of scaffold design based on deformations. This was mitigated in the analysis by calculating these deformations accurately from the high resolution images. In terms of the analysis procedure, the most important factor in accurately extracting features is the registration task. Thus for validation studies, high performance registration methods are called for, which result in residual errors at least lower than the resolution of the imaging (∼25 μm in this study) [8, 10]. In the future, an improved fabrication of the deformation device with force monitoring will be used in a systematic study for scaffold characterisation. Importantly, features reflecting functional performance of scaffolds such as porosity and the corresponding flow characteristics within the structure will need to be studied. However, in its current form, the deformation instrument and the image based analysis provide valuable insight into the mechanical characteristics of the scaffolds.
In conclusion, μCT based imaging with in-situ deformation and subsequent extraction of mechanically relevant features provides a vital tool in validating the design parameters and corroborating the simulated ideal design with the realized product.
Acknowledgments
The authors wish to express their gratitude to Timo Leinonen and Jussi Rantanen at TAKK (Metal Technology, Tampere Adult Education Centre, Finland) for their help in the fabrication of the compression device. This work was partly supported by the Human Spare Parts project funded by TEKES (Finnish funding agency for innovation).
References
1 | Amirkhani S, Bagheri R, Yazdi AZ(2012) Manipulating failure mechanism of rapid prototyped scaffolds by changing nodal connectivity and geometry of the poresJournal of Biomechanics45: 16,1528662875 |
2 | Besl PJ, McKay ND(1992) A method for registration of 3-D shapesIEEE Trans Pattern Analysis and Machine Intelligence14: 2239256 |
3 | Blanquer SBG, Haimi SP, Poot AA, Grijpma DW(2013) Effect of pore characteristics on mechanical properties and annulus fibrosus cell seeding and proliferation in designed PTMC tissue engineering scaffoldsMacromol Symp334: 7581 |
4 | Buades A, Coll B, Morel JM(2005) A non local algorithm for image denoisingProc Int Conf Computer Vision and Pattern Recognition (CVPR)2: 6065 |
5 | Dado D, Levenberg S(2009) Cell–scaffold mechanical interplay within engineered tissueSeminars in Cell & Developmental Biology20: 6656664 |
6 | Giannitelli SM, Accoto D, Trombetta M, Rainer A(2014) Current trends in the design of scaffolds for computer-aided tissue engineeringActa Biomaterialia10: 2580594 |
7 | Hege HC, Seebass M, Stalling D, Zockler MA generalized marching cubes algorithm based on non-binary classifications. 1997. ZIB Preprint SC-97-05 |
8 | Jandejsek I, Jirousek O, Vavrik D(2011) Precise strain measurement in complex materials using Digital Volumetric. Correlation and time lapse micro-CT dataProcedia Engineering10: 17301735 |
9 | Kerckhofs G, Schrooten J, Elicegui L, van Bael S, Moesen M, Lomov SV, Wevers MMechanical characterization of porous structures by the combined use of micro-CT and in-situ loading. 17th World Conference on Nondestructive Testing. Shanghai, China, 2008 |
10 | Liu L, Morgan EF(2007) Accuracy and precision of digital volume correlation in quantifying displacements and starins in trabecular boneJournal of Biomechanics40: 35163520 |
11 | Madi K, Tozzi G, Zhang QH, Tong J, Cossey A, Au A, Hollis D, Hild F(2013) Computation of full-field displacements in a scaffold implant using digital volume correlation and finite element analysisMedical Engineering & Physics35: 912981312 |
12 | Melchels FP, Feijen J, Grijpma DW(2010) A review on stereolithography and its applications in biomedical engineeringBiomaterials31: 2461216130 |
13 | Melchels FPW, Bertoldi K, Gabbrielli R, Velders AH, Feijen J, Grijpma DW(2010) Mathematically defined tissue engineering scaffold architectures prepared by stereolithographyBiomaterials31: 2769096916 |
14 | Roberts BC, Perilli E, Reynolds KJ(2014) Application of the digital volume correlation technique for the measurement of displacement and strain fields in bone: A literature reviewJournal of Biomechanics47: 5923934 |
15 | Salvo L, Suéry M, Marmottant A, Limodin N, Bernard D(2010) 3D imaging in material science: Application of X-ray tomographyComptes Rendus Physique11: 9–10641649 |
16 | Schuller-Ravoo S, Feijen J, Grijpma DW(2011) Preparation of flexible and elastic poly(trimethylene carbonate) structures by stereolithographyMacromolecular Bioscience11: 1216621671 |
17 | Stella JA, D’Amore A, Wagner WR, Sacks MS(2010) On the biomechanical function of scaffolds for engineering load-bearing soft tissuesActa Biomaterialia6: 723652381 |
18 | Zhang Z, Kuijer R, Bulstra SK, Grijpma DW, Feijen J(2006) The in vivo and in vitro degradation behavior of poly(trimethylene carbonate)Biomaterials27: 91741 |
Figures and Tables
Fig.1
Mechanical deformation device and the sample setup within it. Drawing in the left pane shows the CAD assembly of the various components. The photographs show the fabricated device where – centre pane: location of a sample within the device, right pane: The assembled device ready to be placed in the μCT.
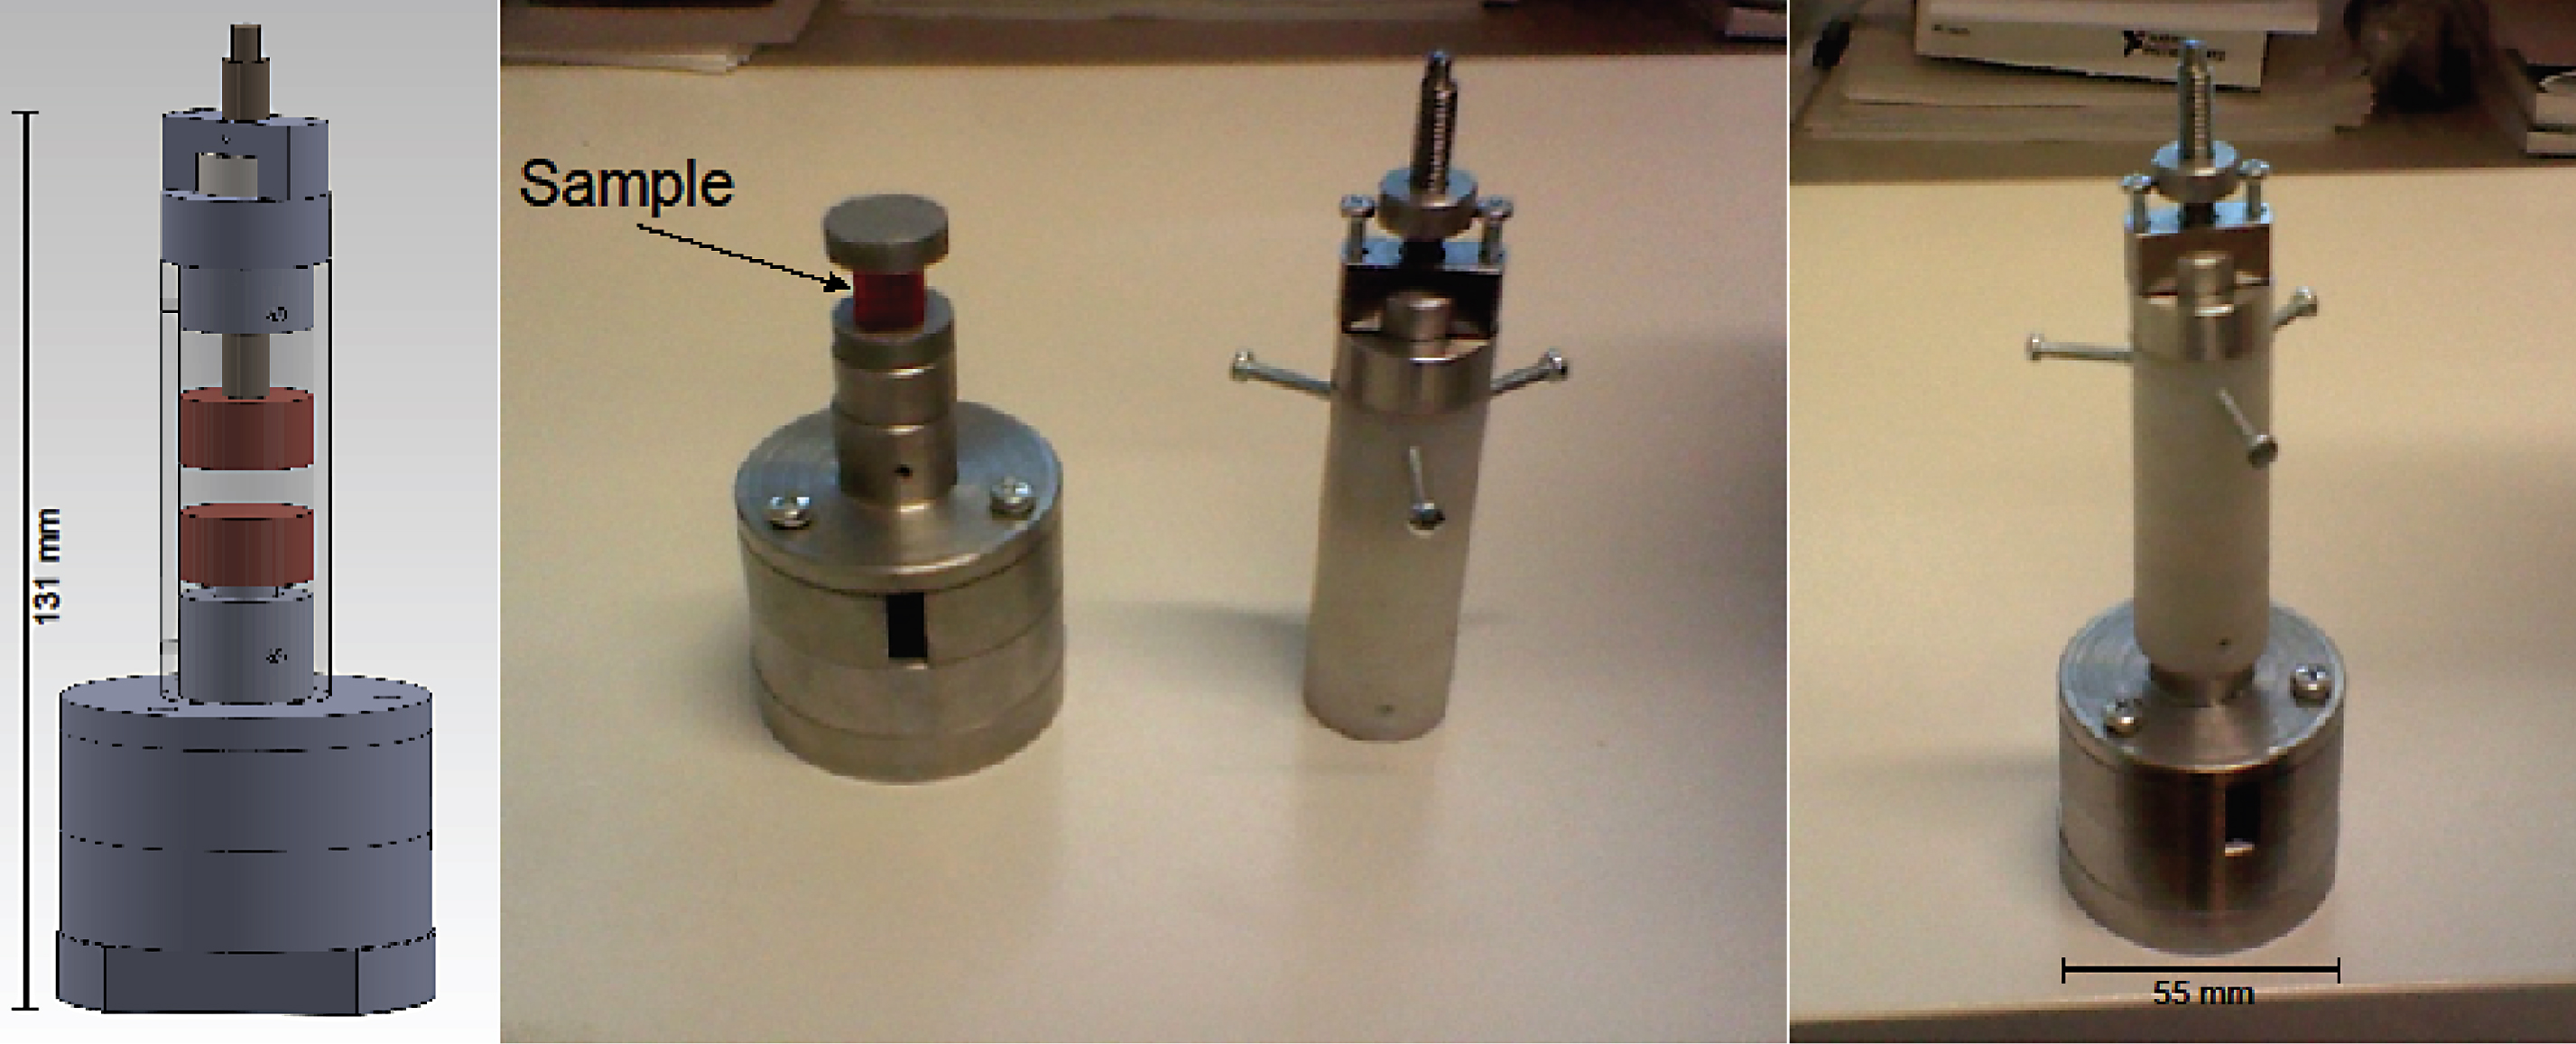
Fig.2
3D renderings of the segmented image volumes of the three (non-deformed) scaffold designs a) Scaffold A – pore size 440μm, b) Scaffold B – pore size 540μm and c) Scaffold C–pore size 700μm. The colours attributed to each render is only for visualization purposes to indicate the 3 different designs.
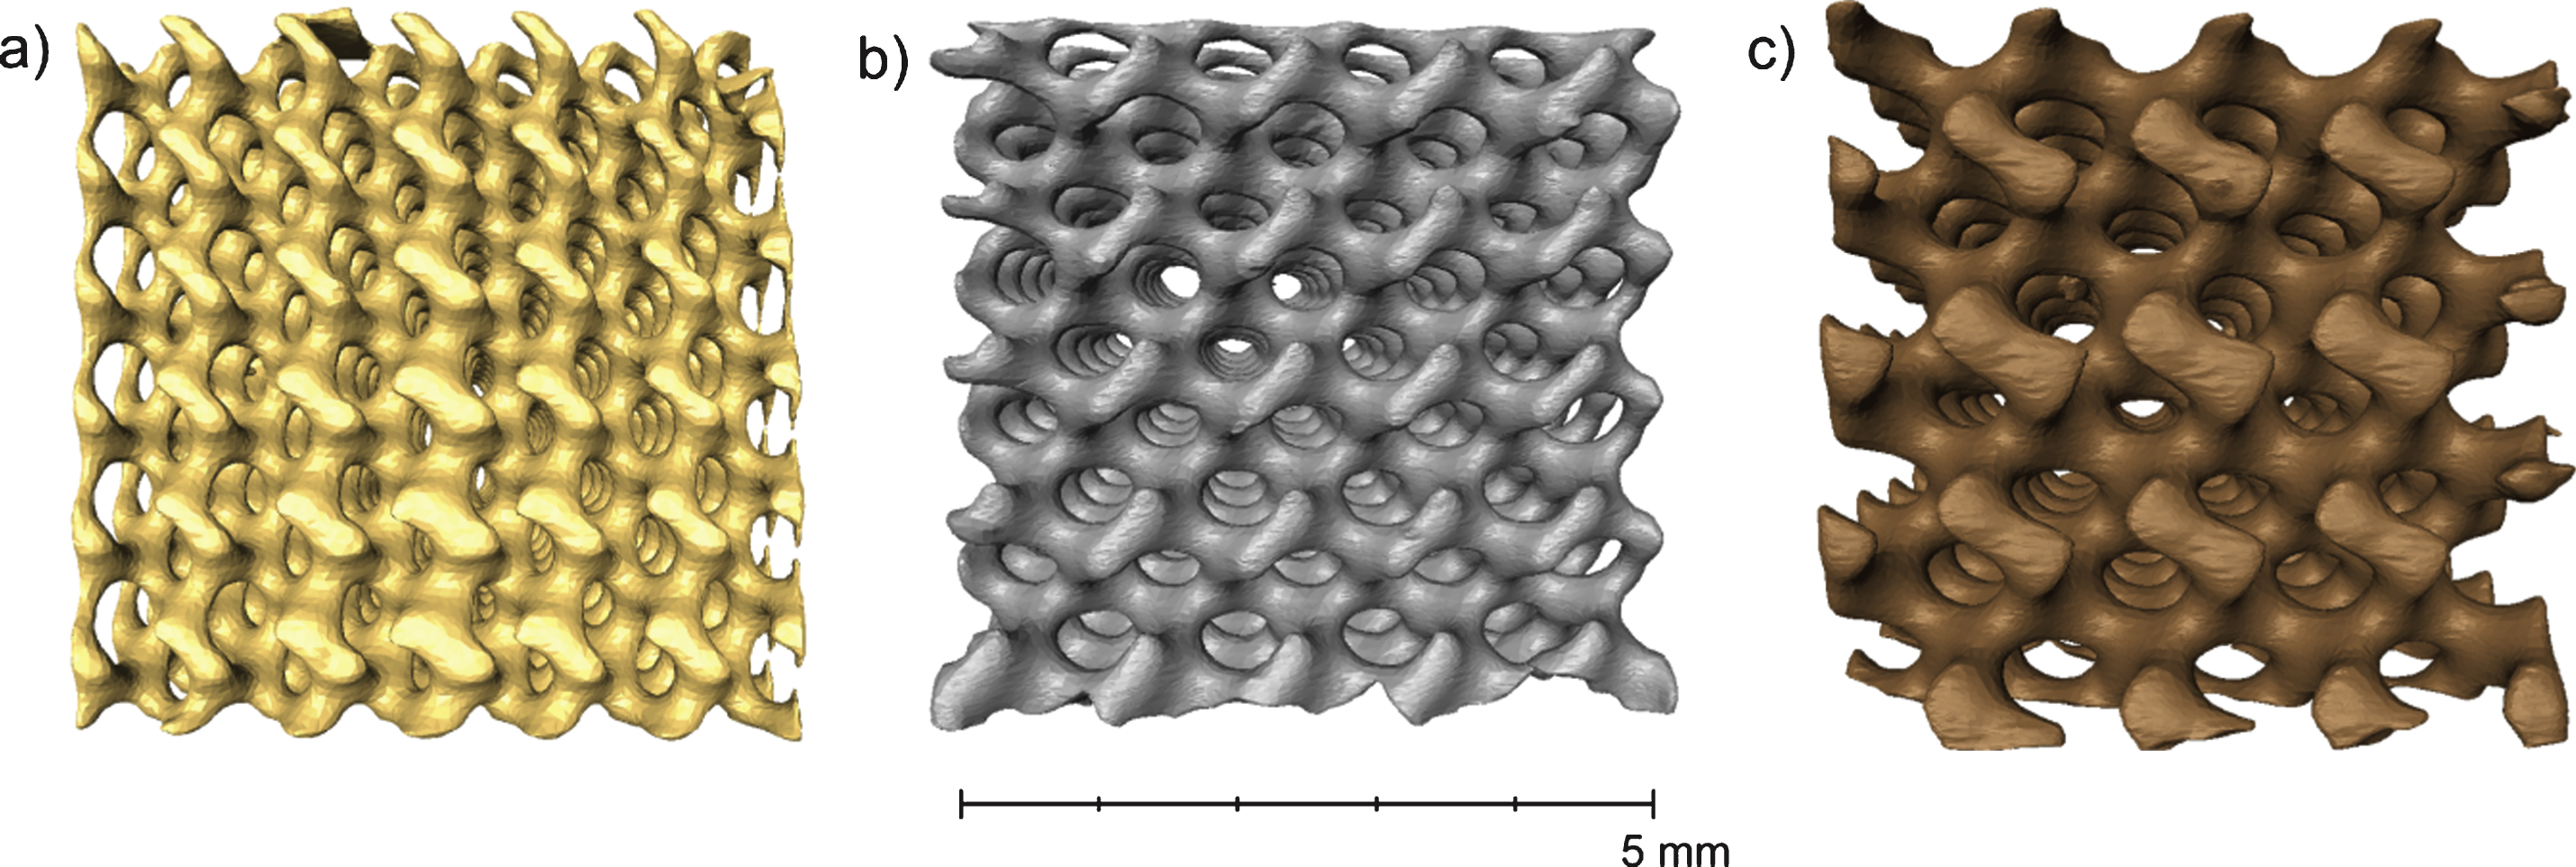
Fig.3
a) The scaffold B surface rendering based on μCT image data and triangulated surface elements, before and after deformation. b) The calculated deformation vectors plotted in a 3D space coloured according to the vector magnitude (deformation magnitude).
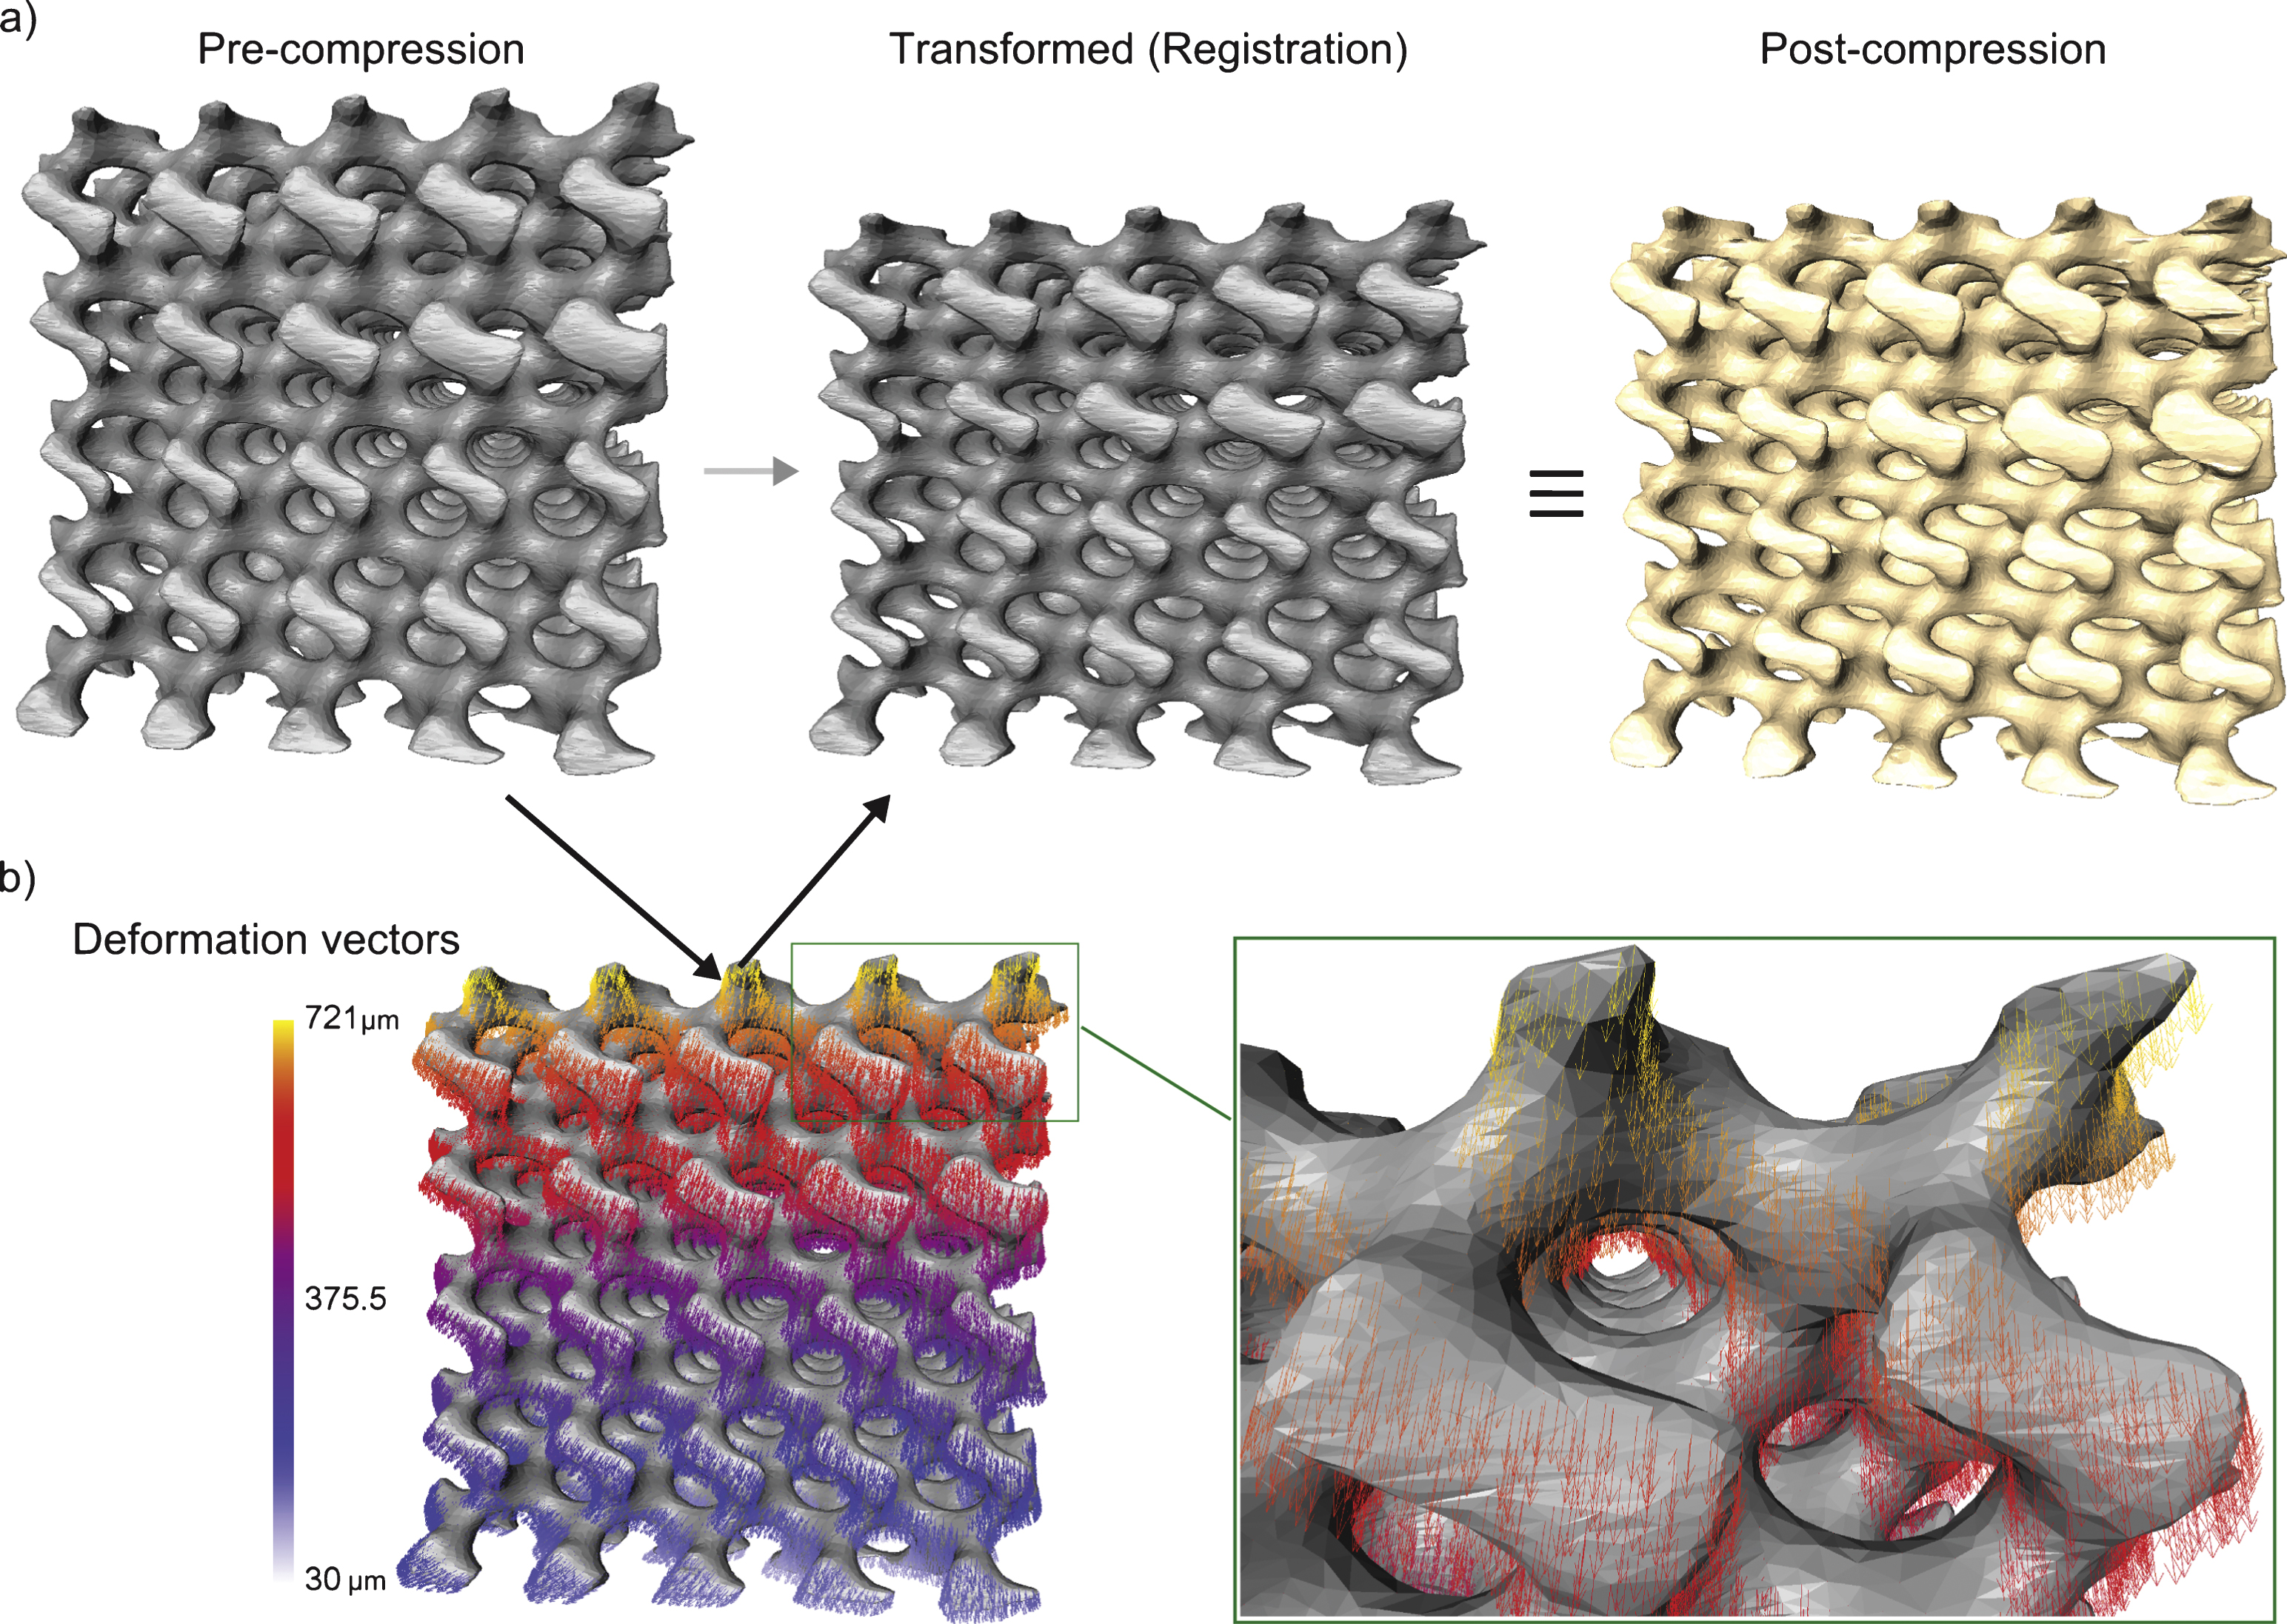
Fig.4
a) Deformation over the surface of scaffold B (left) and the plot of only deformation vectors in 3D with colour indicating magnitude. Deformation is applied along the z-axis (green arrow). b) The residual deformations in the x-y plane and c) The deviation from expected linear deformation behaviour in the z component of the vectors (direction of the residual vectors shown with white arrows).
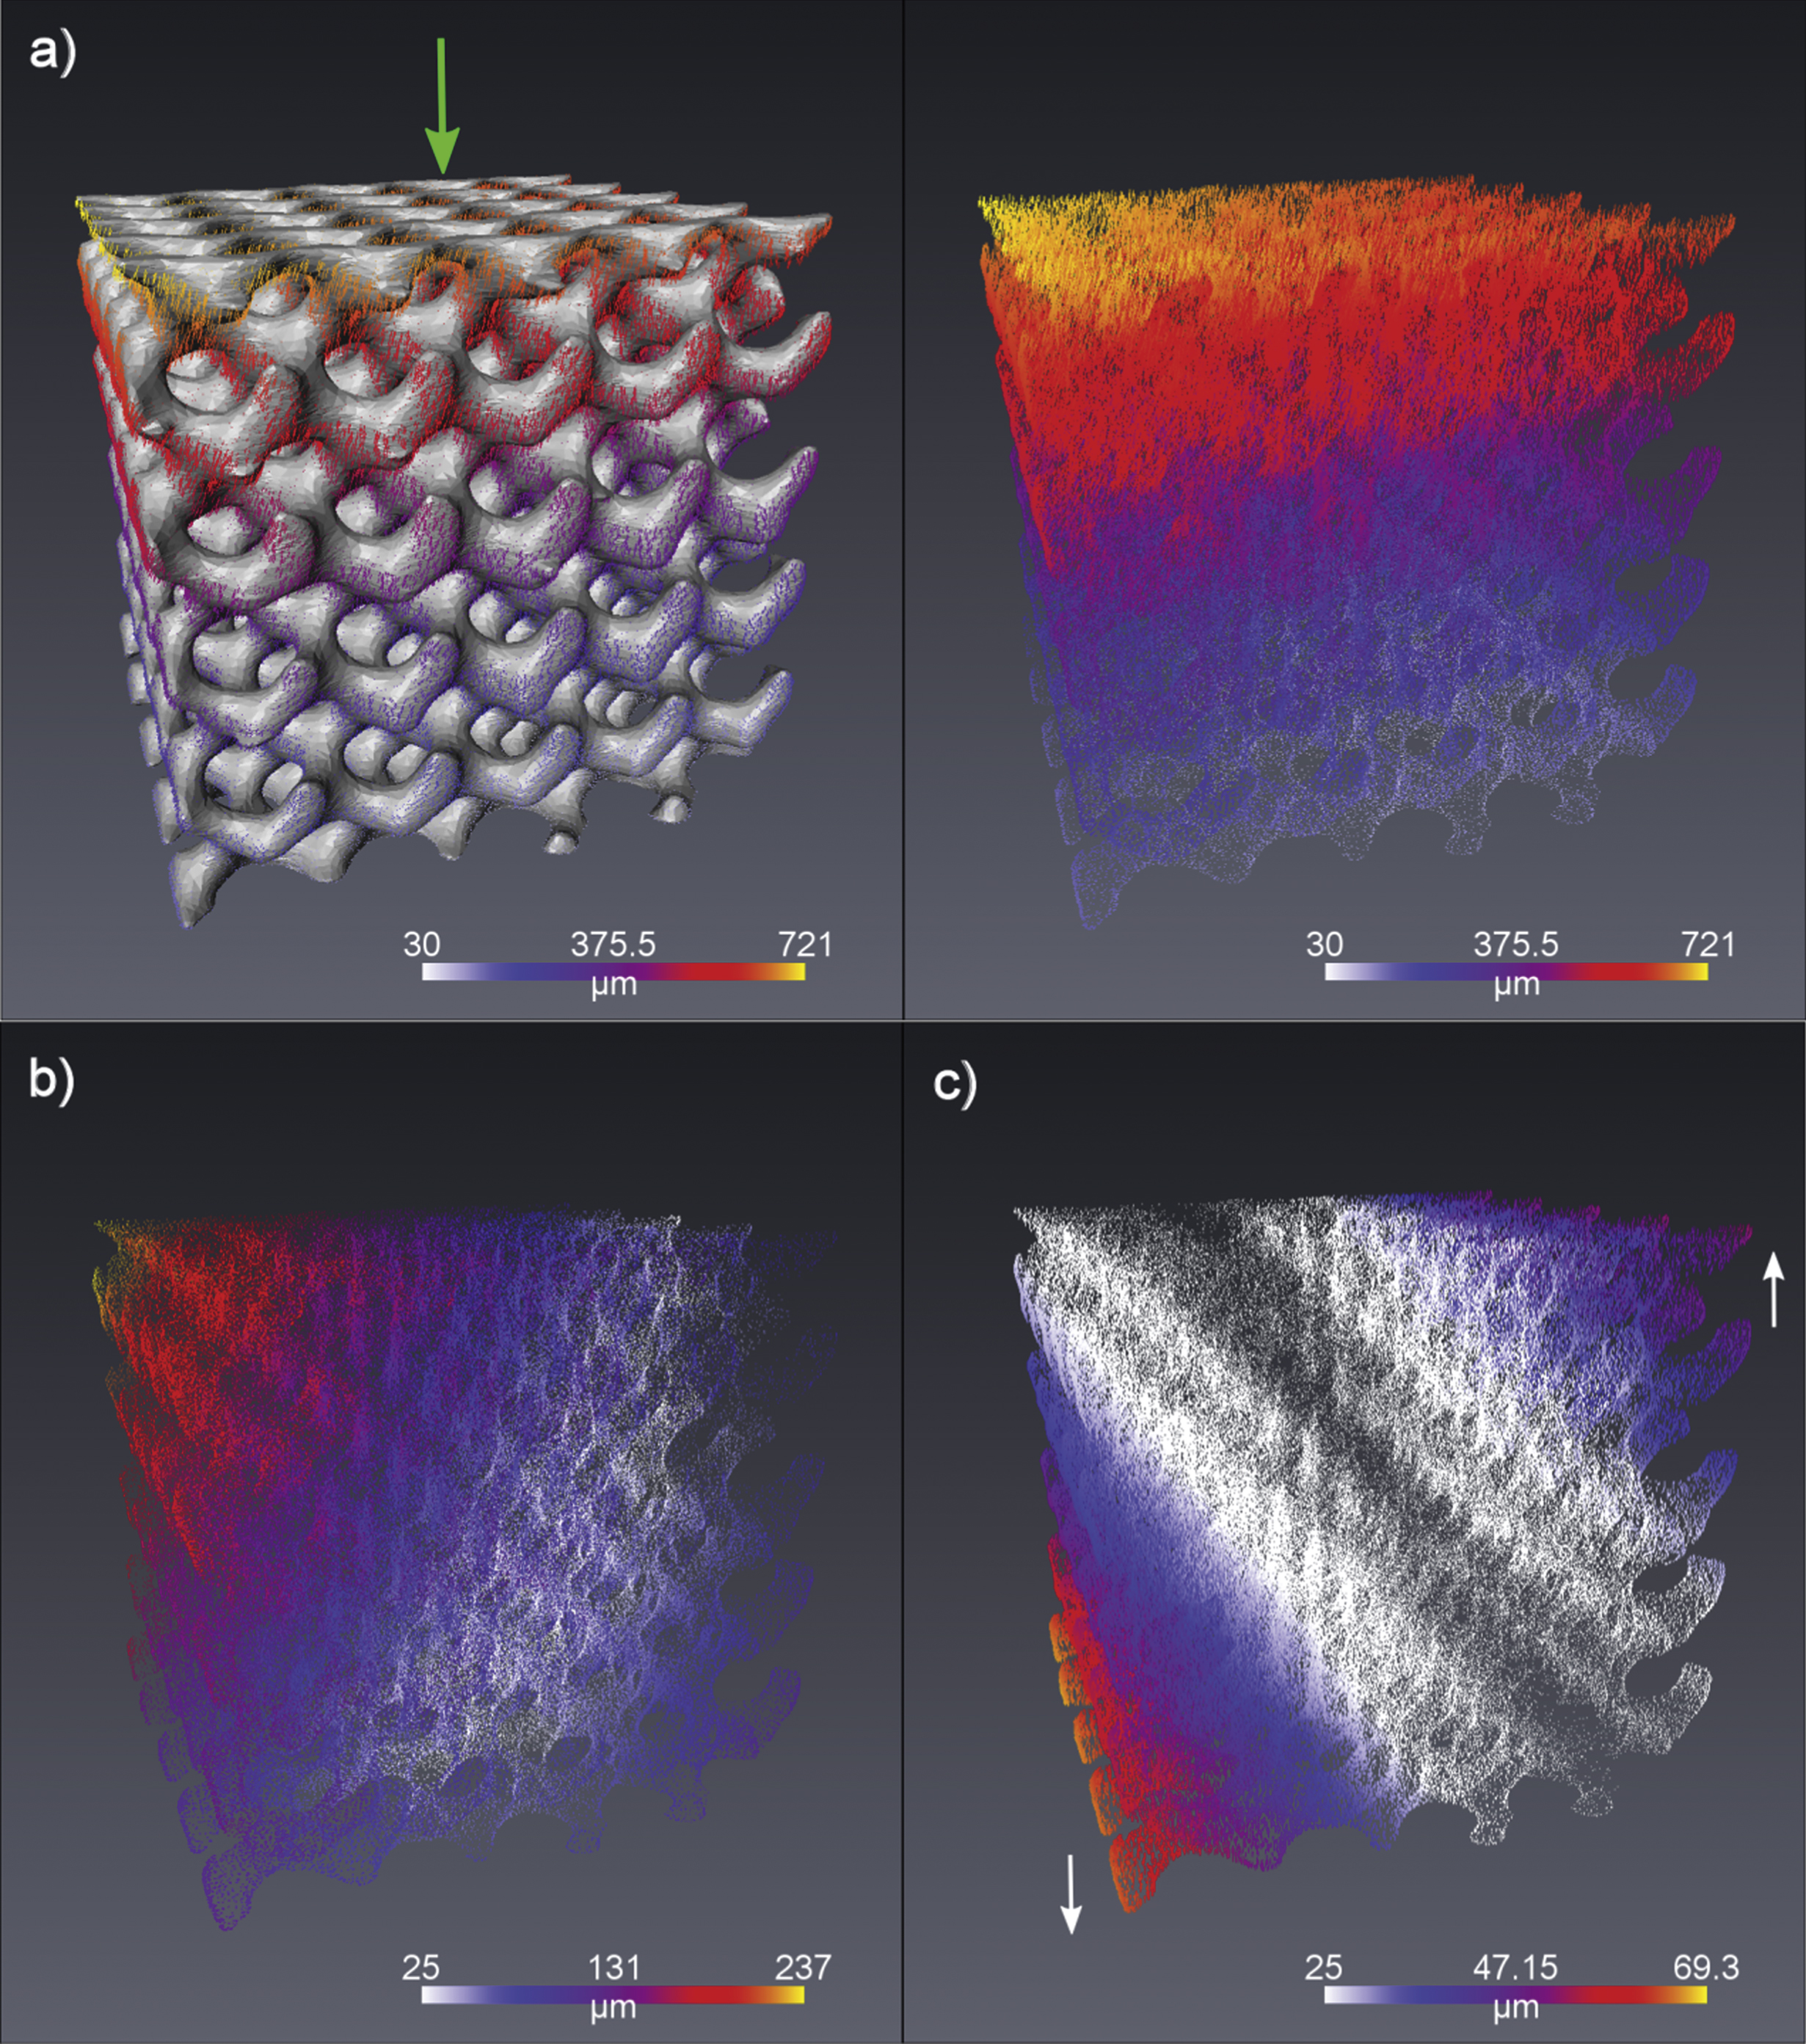
Fig.5
The displacement magnitudes of the surface nodes of the scaffolds along the vertical (compression axis) - a) Scaffold A, b) Scaffold B and c) Scaffold C. The horizontal axis of the plot is the distance (from the resting surface) of the axial plane (along the deformation axis). The plotted blue line is the average of all surface nodes lying on the axial plane. (d) A comparison of the vertical component (z-component) of the deformation vector for the 3 samples.
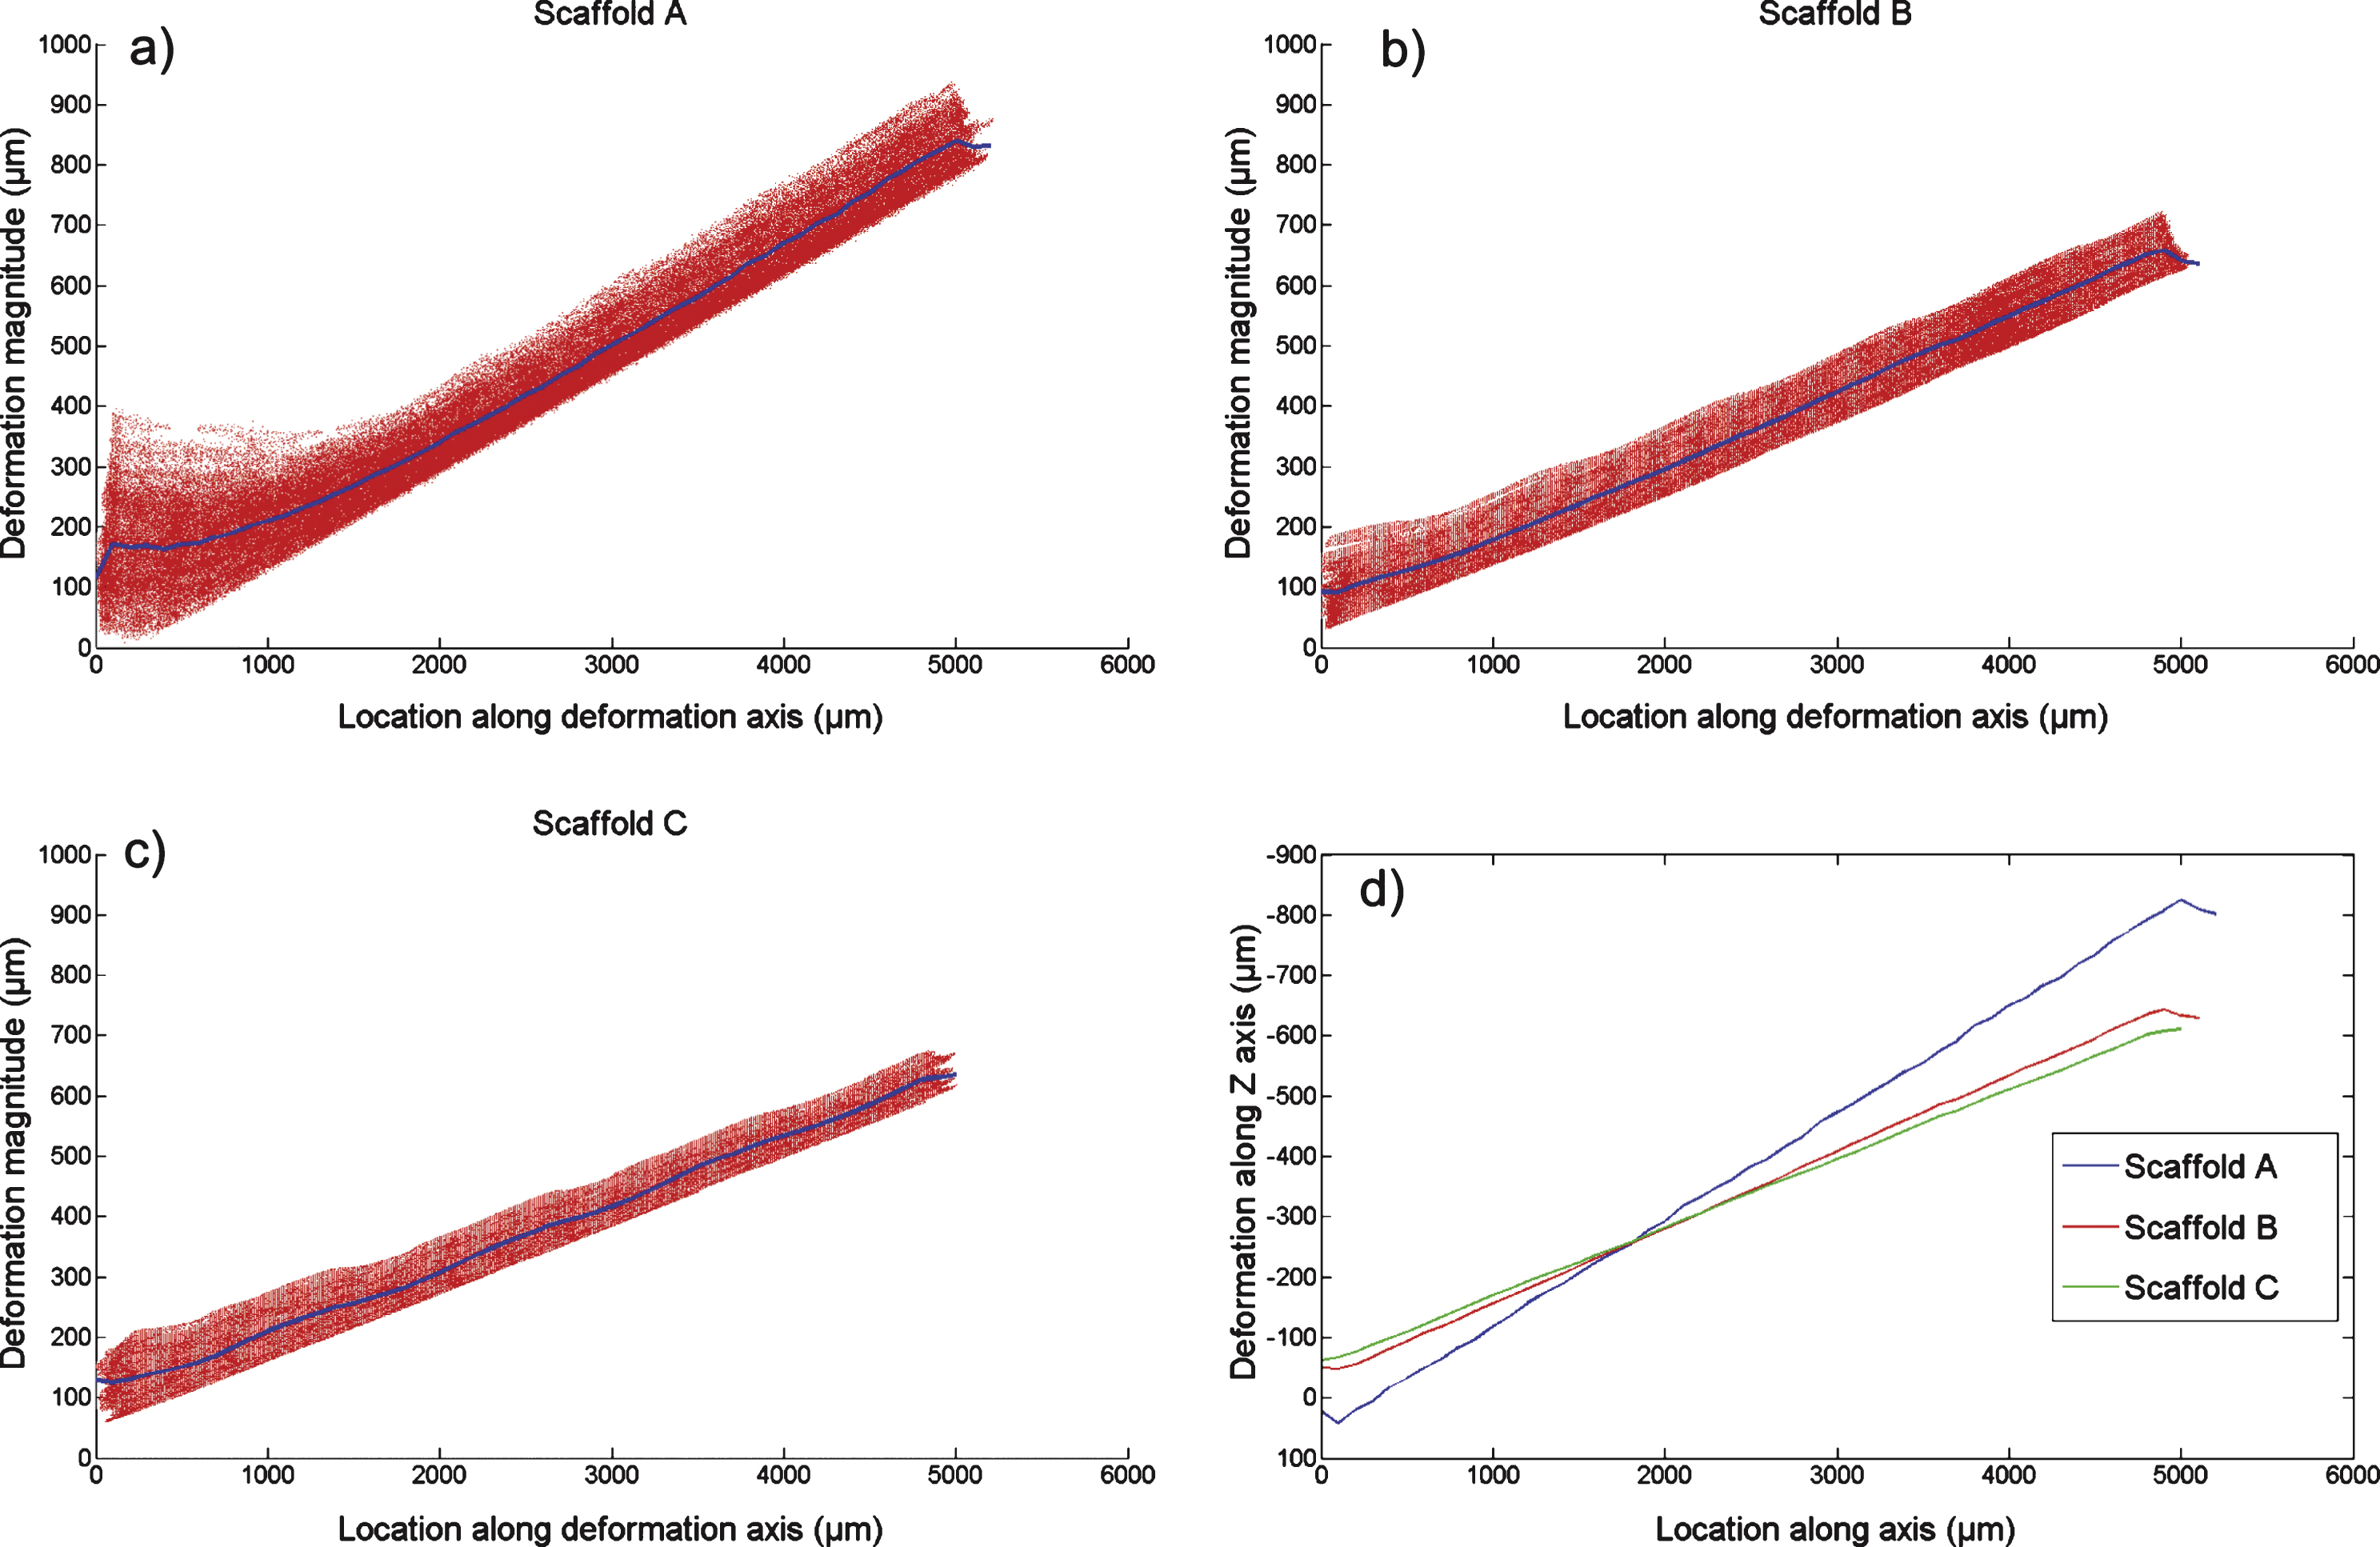
Table 1
The parameters and features for each of the 3 scaffold designs – A, B and C
| Porosity (%) | Pore size (μm) | Surface area (m −1) | Constant (C) | Boundary conditions x, y, z | |
| A | 71 | 440 | 0.159 | −0.6 | [−6π; 6π] |
| B | 72 | 540 | 0.175 | −0.65 | [−5π; 5π] |
| C | 73 | 700 | 0.214 | −0.65 | [−4π; 4π] |
Table 2
Imaging parameters used for all samples (Scaffolds A, B and C)
| Voltage (kV) | 45 | Source distance (mm) | 55 |
| Power (W) | 10 | Detector distance (mm) | 250 |
| Time/projection (s) | 4 | Pixel size (μm) | 12.24 |
| Camera binning | 2 | Field of view (mm) | 12.25 |


