
A novel approach of platelet function test for prediction of attenuated response to clopidogrel
Abstract
BACKGROUND:
Elevated mean platelet volume (MPV) and immature platelet fraction (IPF) are predictive for vascular risk. Both can be associated with residual platelet reactivity. We aimed to explore associations among platelet characteristics and responder status in stroke patients on clopidogrel.
METHODS:
Blood samples from 46 patients and 15 healthy subjects were analyzed for platelet count, MPV, IPF, large cell ratio (LCR) and high-fluorsecent immature platelet fraction (H-IPF). As a novelty, not only whole blood, but upper and lower half blood samples after 1-hour gravity sedimentation were analyzed. Platelet aggregometry was used for the whole blood and separated samples to explore area under the curve (AUC) in patients and controls.
RESULTS:
The AUC of the whole blood showed significant differences compared to the upper and lower samples separated after 1-hour sedimentation in patients and controls (p < 0.001 and p = 0.005 respectively). Remarkably, AUC measured in the upper samples in 59% of patients on clopidogrel were exceeding the therapeutic range suggesting that ascending platelets exert aggregation in the presence of ADP. This observation was associated with increased MPV and LCR in the upper samples (both p = 0.04). Patients on clopidogrel were characterized as responders and non-responders and the percentage of H-IPF was significantly higher among non-responders compared to controls in the upper samples (p = 0.04).
CONCLUSIONS:
The modified platelet function test may help to stratify patients with high residual platelet reactivity.
1Introduction
Platelets play a pivotal role in the development of atherothrombotic events [1]. Platelet populations are heterogeneous in terms of age, size, reactivity, and susceptibility to anti-platelet therapy [2]. Immature platelets are presumed to be pro-thrombotic and hyperactive compared to mature platelets [3]. A high platelet turnover rate can produce a higher proportion of immature platelet fraction (IPF) leading to a residual platelet reactivity (RPR) in coronary artery disease (CAD) and stroke patients despite of antiplatelet drugs. An increased IPF was recently found to be associated with an attenuated response to clopidogrel [4].
By the analogy of erythrocyte sedimentation rate (ESR), leukocyte antisedimentation rate (LAR) was developed and used as a simple clinical laboratory test [5]. Indeed, LAR reflects the flotation of leukocytes in response to gravity, which is proportional to the number of activated leukocytes in the Westergren tube. Its clinical utility in early recognition of infection was proven in several conditions, such as in sepsis, major surgery and post-stroke infection [6–8]. The rheological behavior of other blood cell components such as platelets would also be of great clinical interest, therefore the modified version of LAR, called platelet antisedimentation rate (PAR) was developed in our department. In this context, we examined the motion of platelets during one hour gravity sedimentation similarly to ESR or LAR.
The aim of the present study was to explore the motion of platelets in the Westergren tube during 1-hour gravity sedimentation in patients suffering from past ischemic stroke, who had been on antiplatelet therapy and in normal controls. Besides, we also compared platelet function test in the whole blood and the separated upper and lower fraction of samples following 1-hour gravity sedimentation between healthy volunteers and patients.
2Material and methods
2.1Subjects
The study protocoll was approved by the University of Pécs Clinical Centre Regional and Institutional Research Ethics Comittee (Ref. number: 6735, Clinical Trial No: NTC03679858). Written informed consent was obtained from each patient and healthy volunteers.
A total of 46 patients (age: 66±8, male: 31) on antiplatelet therapy (75 mg clopidogrel once daily) due to secondary stroke prevention and 15 healthy subjects (age: 39±13, male: 6) not taking any medications were prospectively recruited into this study. The selected patients were on regular medical check up at the Outpatient Clinic of the Department of Neurology. Fasting venous blood samples were taken via a 21G peripheral venous canula from each patient and healthy subject. Patients were instructed to take their daily clopidogrel at least 2 hours prior to blood sampling. Exclusion criteria were acut infection and acute vascular events, such as acute ischemic stroke, transient ischemic attack, acute myocardial infarction, acute coronary syndrome, thrombocytopenia (platelet count <150G/l), congenital platelet abnormalities, congenital disorder of haemostatis (eg. haemophilia), anaemia and patients on medical therapy influencing blood coagulation (eg. oral anticoagulants, novel oral anticoagulants, non-steroid antiinflammatory drugs). The comorbidities, medications and smoking status were also recorded. Besides, the baseline ESR, C-reactive protein (CRP), and whole blood count were measured.
2.2Blood sampling
Venopuncture was performed from the cubital vein after short time strangulation of the arm with 21G BD vacutainer needle. The total blood count and the platelet antisedimentation rate (PAR, see below) were measured of 2×3 ml blood samples taken into two vacutainers with EDTA (REF: 368856, 5.4md EDTA). Also, blood for platelet aggregometry was taken into 2×3 ml hirudin containing tube for Multiplate® Analyzer (Roche Diagnostics, Mannheim, Germany).
2.3Platelet antisedimentation rate (PAR)
Modified whole blood gravity sedimentation technique was developed for studying platelet sedimentation properties. After one hour gravity sedimentation the upper and lower half fraction of each venous blood column were separately removed from the EDTA sedimentation tube and transferred to another EDTA tube for further analysis. An automatic cell counter system (Sysmex XN 9000, Sysmex Co, Japan, 2017) was applied to count the upward floating (ascending) and sinking (non-ascending) platelets in the separated samples. The platelet anti-sedimentation rate (PAR) indicates the proportion of platelets crossing the midline of a blood column in an upward direction during one hour gravity sedimentation expressed in percentage and calculated with the following equation:
2.4Impedance platelet aggregometry
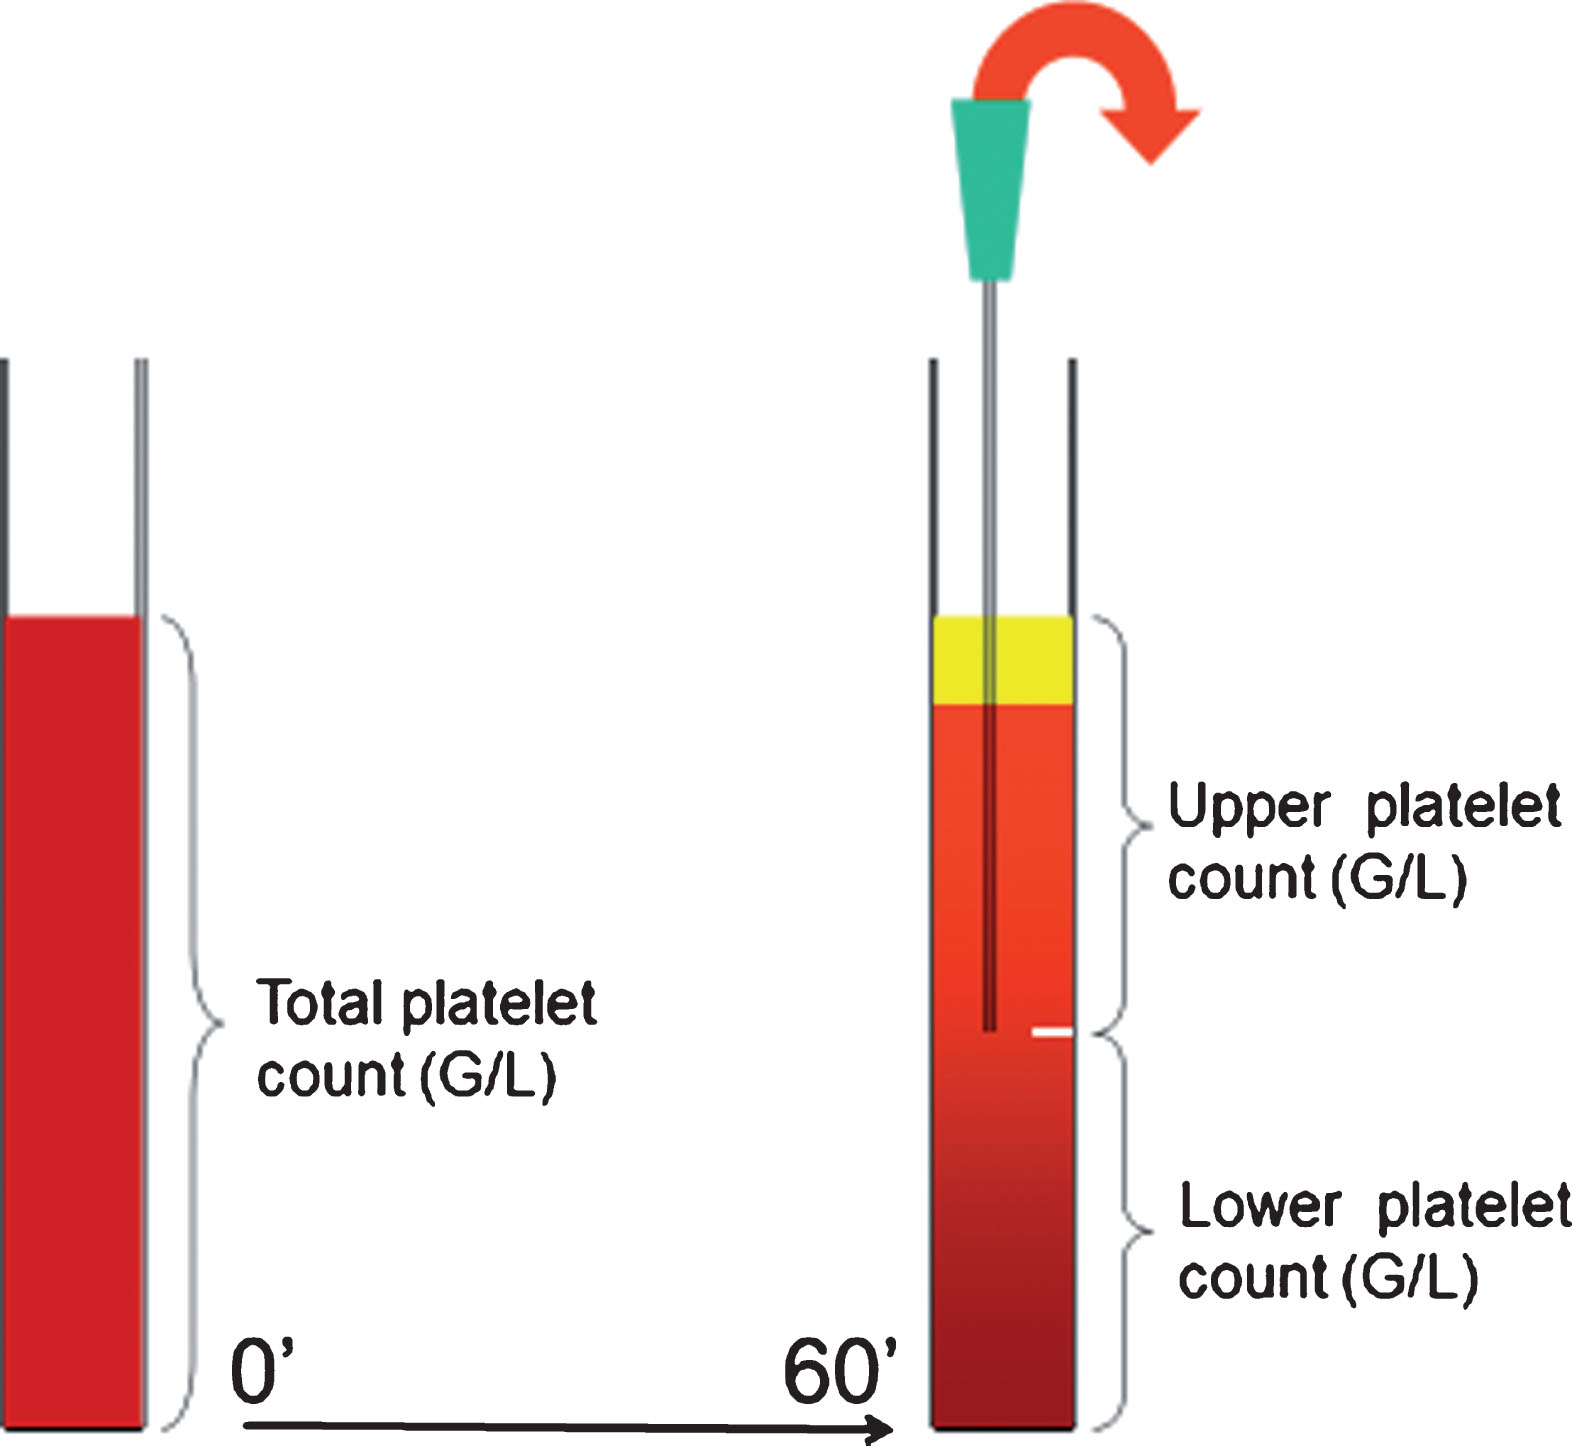
Platelet function test from the whole blood was perfomed from a hirudin containing tube with a Multiplate® Analyzer (Roche Diagnostics, Mannheim, Germany). Another hirudin containing tube was used for sedimentation, similarly to whole blood sedimentation in the EDTA-tube. After one hour gravity sedimentation, the blood coloumn was devided into upper and lower samples (Fig. 1). Platelet aggregometry was universally performed 60 minutes after blood sampling using adenosine diphosphate (ADP; 6.5 μM) as agonist. Aggregometry was simultaneously performed from the whole blood, as well as form the upper and the lower blood samples. Aggregation level was expressed as the area under the curve (AUC) (9, 10). AUC was calculated by a Multiplate® Analyzer using the product of aggregation unit (AU) x time (minutes) [12]. After ADP stimulation, the normal aggregation range was expected as AUC: 53–122 according to the manufacturer [9, 10]. Based on the whole blood AUC, patients on clopidogrel were categorized as responders with AUC <53 and non-responders with AUC ≥53.
Fig.1
Schematic drawing of platelet antisedimentation measurement.
2.5Total blood cell count and IPF measurements
The total blood cell count was measured on Sysmex XN 9000 integrated automated hematology analyzer (Sysmex Co, Japan, 2017) at the Department of Laboratory Medicine. The platelet number by fluorescent measurement (PLT-F) and the immature platelet fraction (IPF) were measured using the fluorescent platelet channel of the analyzer. In this channel, platelets are specifically stained intracellularly with fluorescent dye and measured on the principle of flow cytometry, analyzing the forward scattered light (FSC), side scattered light (SSC) and side fluorescent light (SFL). The platelets are counted and additionally, the plots in the area with high fluorescence intensities are separated as the immature platelet fraction. The mean platelet volume (MPV), platelet large cell ratio (P-LCR), high fluorescent immature platelet fraction (H-IPF) and absolute PLT-F count were recorded.
2.6Statistical analysis
Data were evaluated using SPSS software package (Version 19.0, SPSS Inc, Chicago, USA). Categorical data were summarized by means of absolute and relative frequencies (counts and percentages). Quantitative data were presented as median and 25th–75th percentiles, as well as mean±SD. The Kolmogorov-Smirnov test was applied to check for normality. Chi-square test for categorical data and Student-t test for continuous data were used for analysis of demographic and clinical factors. Non-parametric Mann-Whitney U test was used for not normally distributed parameters. Correlation analysis was performed calculating Spearman’s correlation coefficient (r). A p-value <0.05 was considered statistically significant.
3Results
A total of 46 patients (age: 66±8, male: 31) on antiplatelet therapy (75 mg clopidogrel daily) due to secondary stroke prevention and 15 healthy subjects (age: 40±13, male: 6) were prospectively examined. Demography of patients and healthy controls and baseline laboratory data are summarized in (Table 1). The ESR was significantly higher in the patient group compared to healthy individuals (p < 0.001). Neither in total platelet count, nor in MPV were observed significant differences, however the control group was significantly younger (p < 0.001) (Table 1).
Table 1
Demography and baseline laboratory data
| Control group (n = 15) | Clopidogrel group (n = 46) | p-value | |
| Age | 40±13 | 66±8 | <0.001 |
| Gender (M/F) | 6/9 | 31/15 | 0.06 |
| BMI | 25±3 | 27±4 | 0.119 |
| Smoking (%) | 2 (13) | 9 (19) | 0.586 |
| CRP (mg/l) | NA | 1.75 (0.7–3.5) | NA |
| ESR (mm/hour) | 2 (1–4) | 10 (6–18) | <0.001 |
| Hematocrit (%) | 42.8±0.9 | 43.6±0.7 | 0.416 |
| Leukocyte (G/l) | 6.3±1.2 | 8.3±1.7 | 0.251 |
| PLT (G/l) | 282±75 | 239±65 | 0.098 |
| MPV (fl) | 10.2±1.6 | 10.7±0.9 | 0.528 |
M, male; F, female; BMI, body mass index; CRP, C-reactive protein; ESR, erythrocyte sedimentation rate; PLT, platelet; MPV, mean platelet volume. Data are presented as absolute value (percentage), mean±SD or median (25th–75th percentiles), independent sample test and Mann-Whitney U test were used.
3.1Platelet aggregometry
The AUC of the whole blood, measured by Multiplate aggregometry, showed significant differences compared to the upper and the lower samples AUCs after 1 hour gravity sedimentation (whole blood vs upper: 41.5, 29.0–54.0 vs 57.5, 33.0–79,0; whole blood vs lower: 41.5, 29.0–54.0 vs 18.0, 14.0–23.0, p < 0.001 respectively) (Fig. 2). Remarkably, AUC measured in the upper samples in 59% of patients on clopidogrel (n = 27) were exceeding the effective therapeutic range (AUC: 0–53), therefore suggesting that ascending platelets exert aggregation in the presence of ADP. The coincidence of AUC > 53 measured in the upper samples (n = 11) and the non-responder status (n = 12) was significant (p = 0.001).
Fig.2
Platelet function test in healthy subjects and patients taking clopidogrel. Comparison of aggregation expressed as area under the curve (AUC) measured in the whole blood and upper/lower fractions separated after 1 hour gravity sedimentation by Multiplate aggregometry in healthy vs. post-stroke patients taking 75 mg clopidogrel. The two horizontal dotted lines indicate the normal range of AUC as a response to ADP stimulation. Healthy intragroup differences: AUC vs. AUC in upper vs. AUC in lower fraction, p = 0.005 respectively. Clopidogrel intragroup differences: AUC vs. AUC in upper vs. AUC in lower fraction, p < 0.001 respectively. Data are shown as median and 25th–75th percentiles (# indicate intergroup differences p < 0.001 respectively).
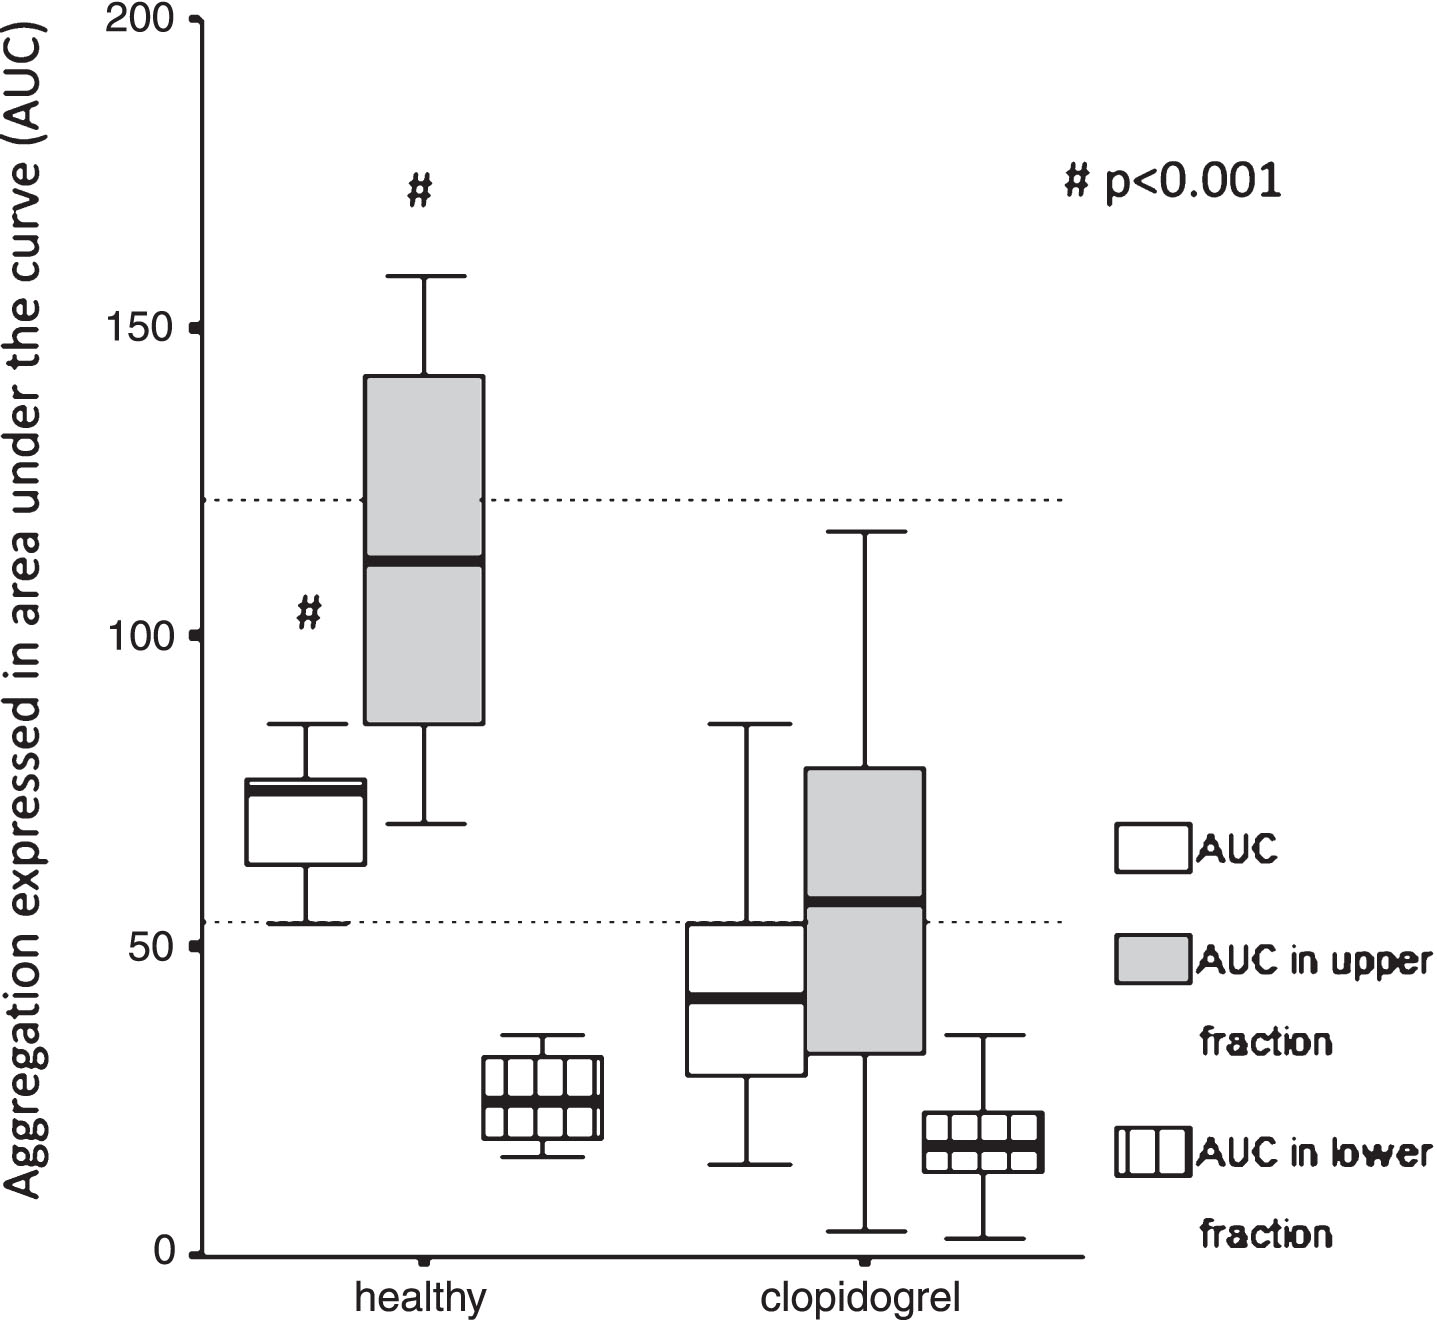
Similarly, the AUC of the whole blood showed significant differences compared to both AUCs measured by Multiplate aggregometryin the upper and lower samples separated after 1 hour gravity sedimentation (whole blood: 73.5, 59.5–78.5 vs upper: 112.5, 73.0–137; whole blood: 73.5, 59.5–78.5 vs lower: 23.0, 16.0–35.0, p = 0.005 respectively) (Fig. 2).
Not surprisingly, the whole blood AUC and the AUC measured in the upper samples were significantly higher in normal controls without any medication influencing platelet function compared to patients on clopidogrel therapy (p < 0.001 respectively) (Table 2). Remarkably, AUC measured in the upper samples in 40% of healthy controls (n = 6) were exceeding the top of the normal range (AUC: 53–122) suggesting that ascending platelets show ex vivo hyperaggregability in the presence of ADP (Fig. 2). Although, AUC measured in the lower samples showed no significant difference (healthy vs patients: 23.0, 16.0–35.0 vs 18.0, 14.0–23.0), these values were in the effective antiplatelet therapeutic range (AUC: 0–53) even in the healthy group suggesting that sedimentated platelets can not be activated by ADP ex vivo (Fig. 2).
Table 2
Platelet and aggregability data of post-stroke patients and healthy controls
| Control group (n = 15) | Clopidogrel group (n = 46) | p-value | |
| PLT count upper (G/L) | 316 (218–478) | 345 (301–428) | 0.68 |
| PLT count lower (G/L) | 88 (51–124) | 71 (54–86) | 0.43 |
| PAR (%) | 58.5 (45.0–67.5) | 67.7 (61.7–72.9) | 0.15 |
| MPV (fl) upper | 10.7 (10.0–10.8) | 10.8 (10.2–11.6) | 0.30 |
| MPV (fl) lower | 10.0 (9.8–10.6) | 10.5 (9.8–11.2) | 0.47 |
| PLCR upper (%) | 28.9 (24.5–30.6) | 33.0 (26.8–38.9) | 0.14 |
| PLCR lower (%) | 25.5 (22.7–28.7) | 30.5 (24.2–36.2) | 0.14 |
| AUC | 73.5 (59.5–78.5) | 41.5 (29.0–54.0) | <0.001 |
| AUC upper | 112.5 (73.0–137) | 57.5 (33.0–79.0) | 0.003 |
| AUC lower | 23.0 (16.0–35.0) | 18.0 (14.0–23.0) | 0.26 |
PLT count upper, platelet count in the upper sample; PLT count lower, platelet count in the lower sample; PAR, platelet antisedimentation rate; AUC, area under the curve; MPV, mean platelet volume; PLCR, platelet large cell ratio. Data are presented as mean±SD as well as median (25th–75th percentiles), Mann-Whitney U test was used.
Table 3
Platelet and aggregability data of healthy controls and post-stroke patients grouped on their responder status
| Control group (n = 15) | Responder (n = 34) | Non-responder (n = 12) | p-value | |
| PLT count upper (G/L) | 316 (218–478) | 343 (284–408) | 372 (302–478) | 0.39 |
| PLT count lower (G/L) | 88 (51–124) | 73 (53–86) | 65 (54–90) | 0.95 |
| PAR (%) | 58.5 (45.0–67.5) | 67.1 (57.6–71.0) | 71.8 (62.6–74.3) | 0.16 |
| MPV (fl) upper | 10.7 (10.0–10.8) | 10.05 (9.7–10.8) | 10.32 (10.1–10.8) | 0.83 |
| MPV (fl) lower | 10.0 (9.8–10.6) | 10.45 (9.75–11.22) | 10.40 (9.8–11.1) | 0.95 |
| PLCR upper (%) | 28.9 (24.5–30.6) | 32.65 (25.02–37.92) | 36.95 (27.4–38.9) | 0.37 |
| PLCR lower (%) | 25.5 (22.7–28.7) | 30.2 (23.5–37.7) | 32.25 (26.5–36.8) | 0.51 |
| H-IPF upper (%) | 0.9 (0.8–1.35) | 1.2 (0.8–1.4) | 1.7 (1.15–2.0) | 0.04* |
| H-IPF lower (%) | 0.8 (0.8–1.0) | 0.7 (0.6–1.2) | 0.9 (0.7–1.5) | 0.54 |
| AUC | 73.5 (59.5–78.5) | 36.5 (27.0–42.2) | 66.0 (59–74.5) | <0.001 |
| AUC upper | 112.5 (73.0–137) | 49 (23.0–63.0) | 93 (65.5–107.5) | <0.001 |
| AUC lower | 23.0 (16.0–35.0) | 17 (13.0–21.0) | 21.5 (17.0–30.5) | 0.03 |
3.2Characteristics of platelet separation
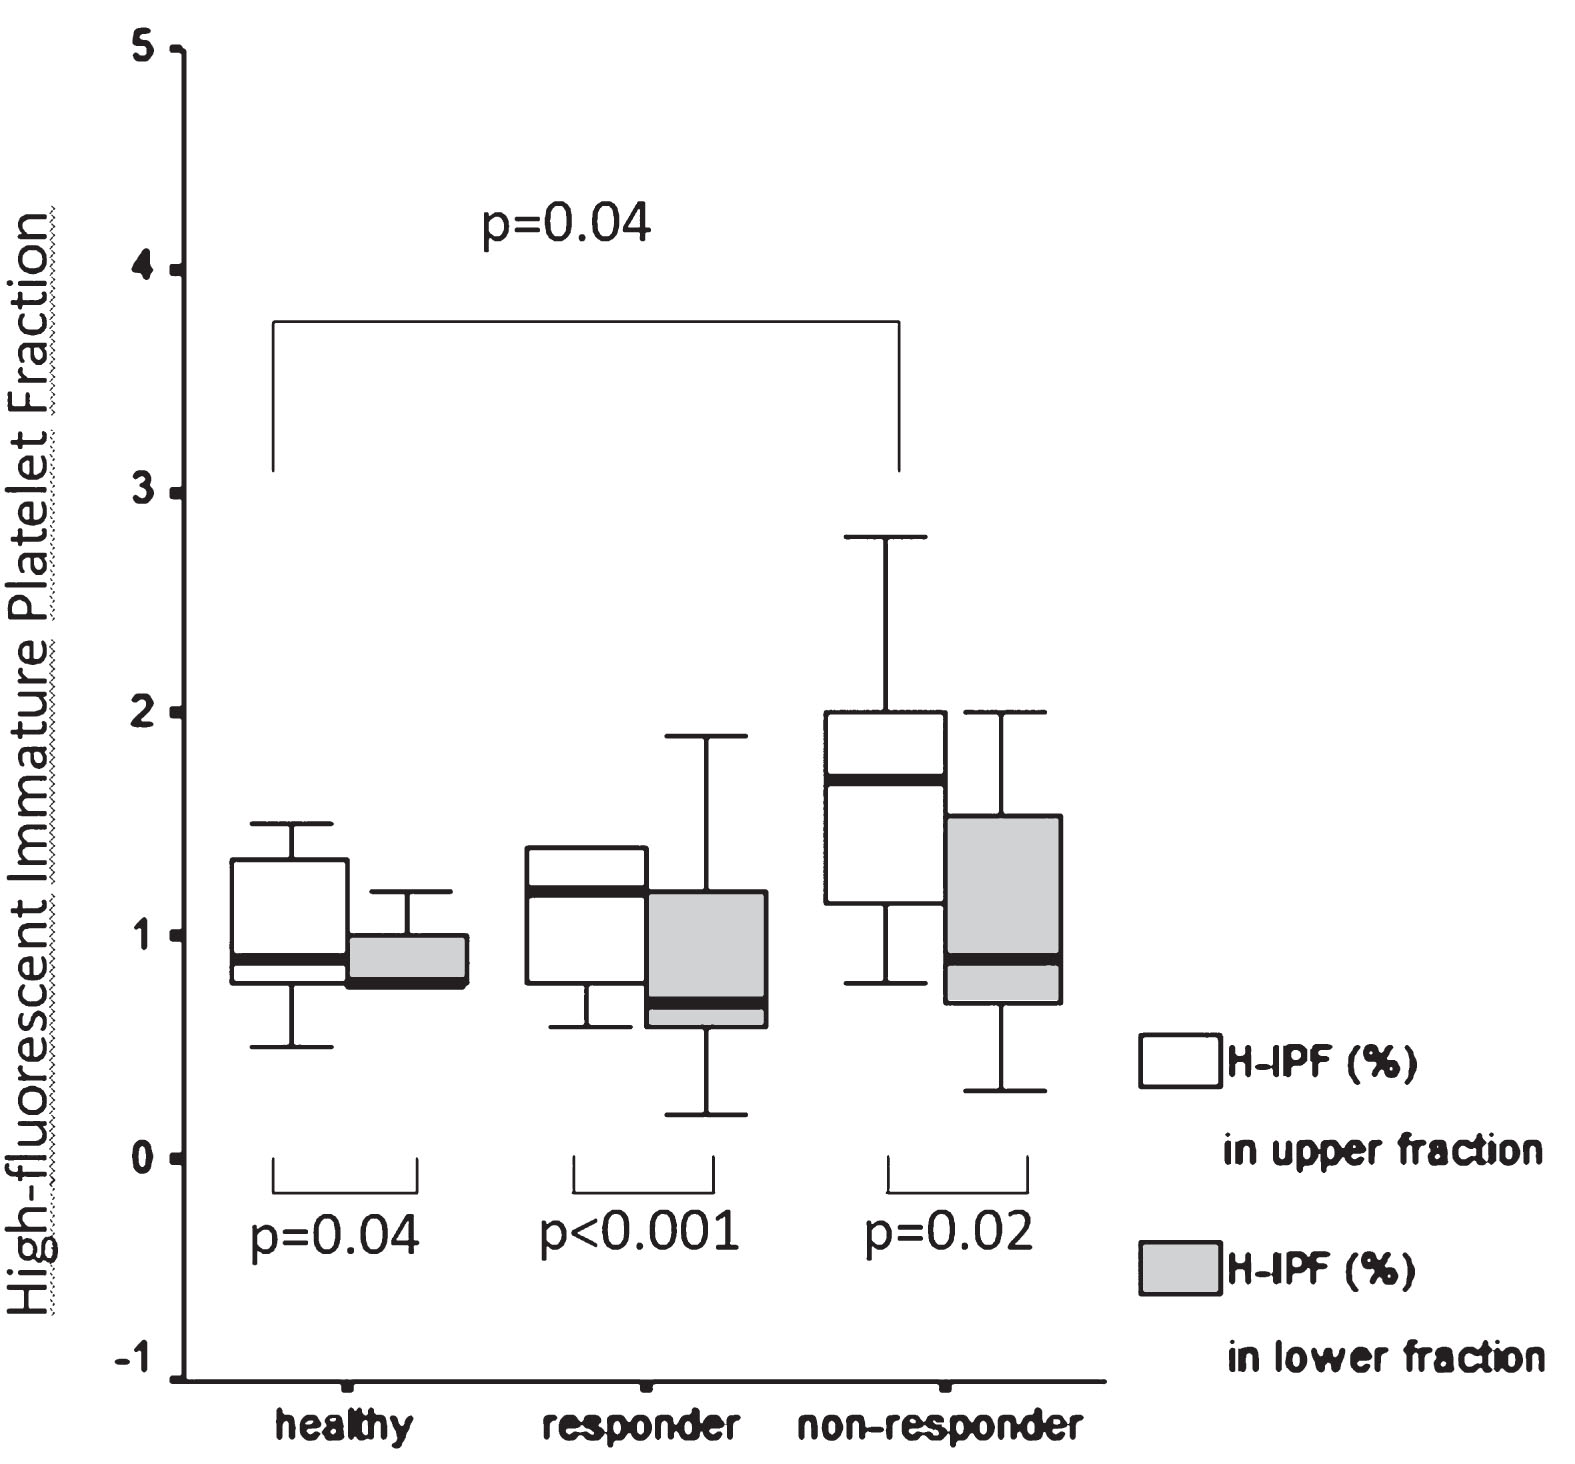
Mean platelet volume (MPV) was determined and compared in the whole blood and the upper and lower samples in each group. MPV showed no significant differences neither in patients vs healthy intergroup comparison nor in intragroup comparisons (whole blood vs upper, whole blood vs lower, upper vs lower samples). However, MPV in the upper fraction correlated positively with AUC measured in the upper samples of patients on clopidogrel (r = 0.311, p = 0.04) (Fig. 3A). Similarly, platelet large cell ratio (PLCR) measured in the upper fraction correlated positively with AUC measured in the upper samples of patients on clopidogrel (r = 0.373, p = 0.04) (Fig. 3B). We also compared the percentage of high fluorescent immature platelet fraction (H-IPF) measured in the upper and lower samples separated after 1 hour gravity sedimentation respectively in healthy subjects vs subgrouped patients on clopidogrel selected as responders (n = 34) vs non-responders (n = 12) by Multiplate aggregometry. The percentage of H-IPF was significantly higher in the non-responder patient subgroup compared to healthy subjects in the upper samples (1.7, 1.15–2.0 vs 0.9, 0.8–1.35, p = 0.04). While the difference between non-responders and responders was not significant, the trend was similar (Fig. 4). The upper vs. lower sample comparison of H-IPF (%) was also done in each group and it showed sigificantly higher H-IPF (%) in the upper samples in all groups (healthy: 0.9, 0.8–1.35 vs 0.8, 0.8–1.0, p = 0.04; responders: 1.2, 0.8–1.4 vs 0.7, 0.6–1.2, p < 0.001; non-responders: 1.7, 1.15–2.0 –0.9, 0.7–1.55, p = 0.02) (Fig. 4).
Fig.3
A: Correlation between mean platelet volume (MPV) and aggregation expressed as area under the curve (AUC) measured in the upper samples. Positive correlation in the upper samples between mean platelet volume (MPV) and area under the curve (AUC) determined by Multiplate aggregometry in patients on antiplatelet therapy. Spearman correlation. B: Correlation between platelet large cell ratio (PLCR) and aggregation expressed as area under the curve (AUC) measured in the upper samples. Positive correlation in the upper samples between platelet large cell ratio (PLCR) and area under the curve (AUC) determined by Multiplate aggregometry in patients on antiplatelet therapy. Spearman correlation.
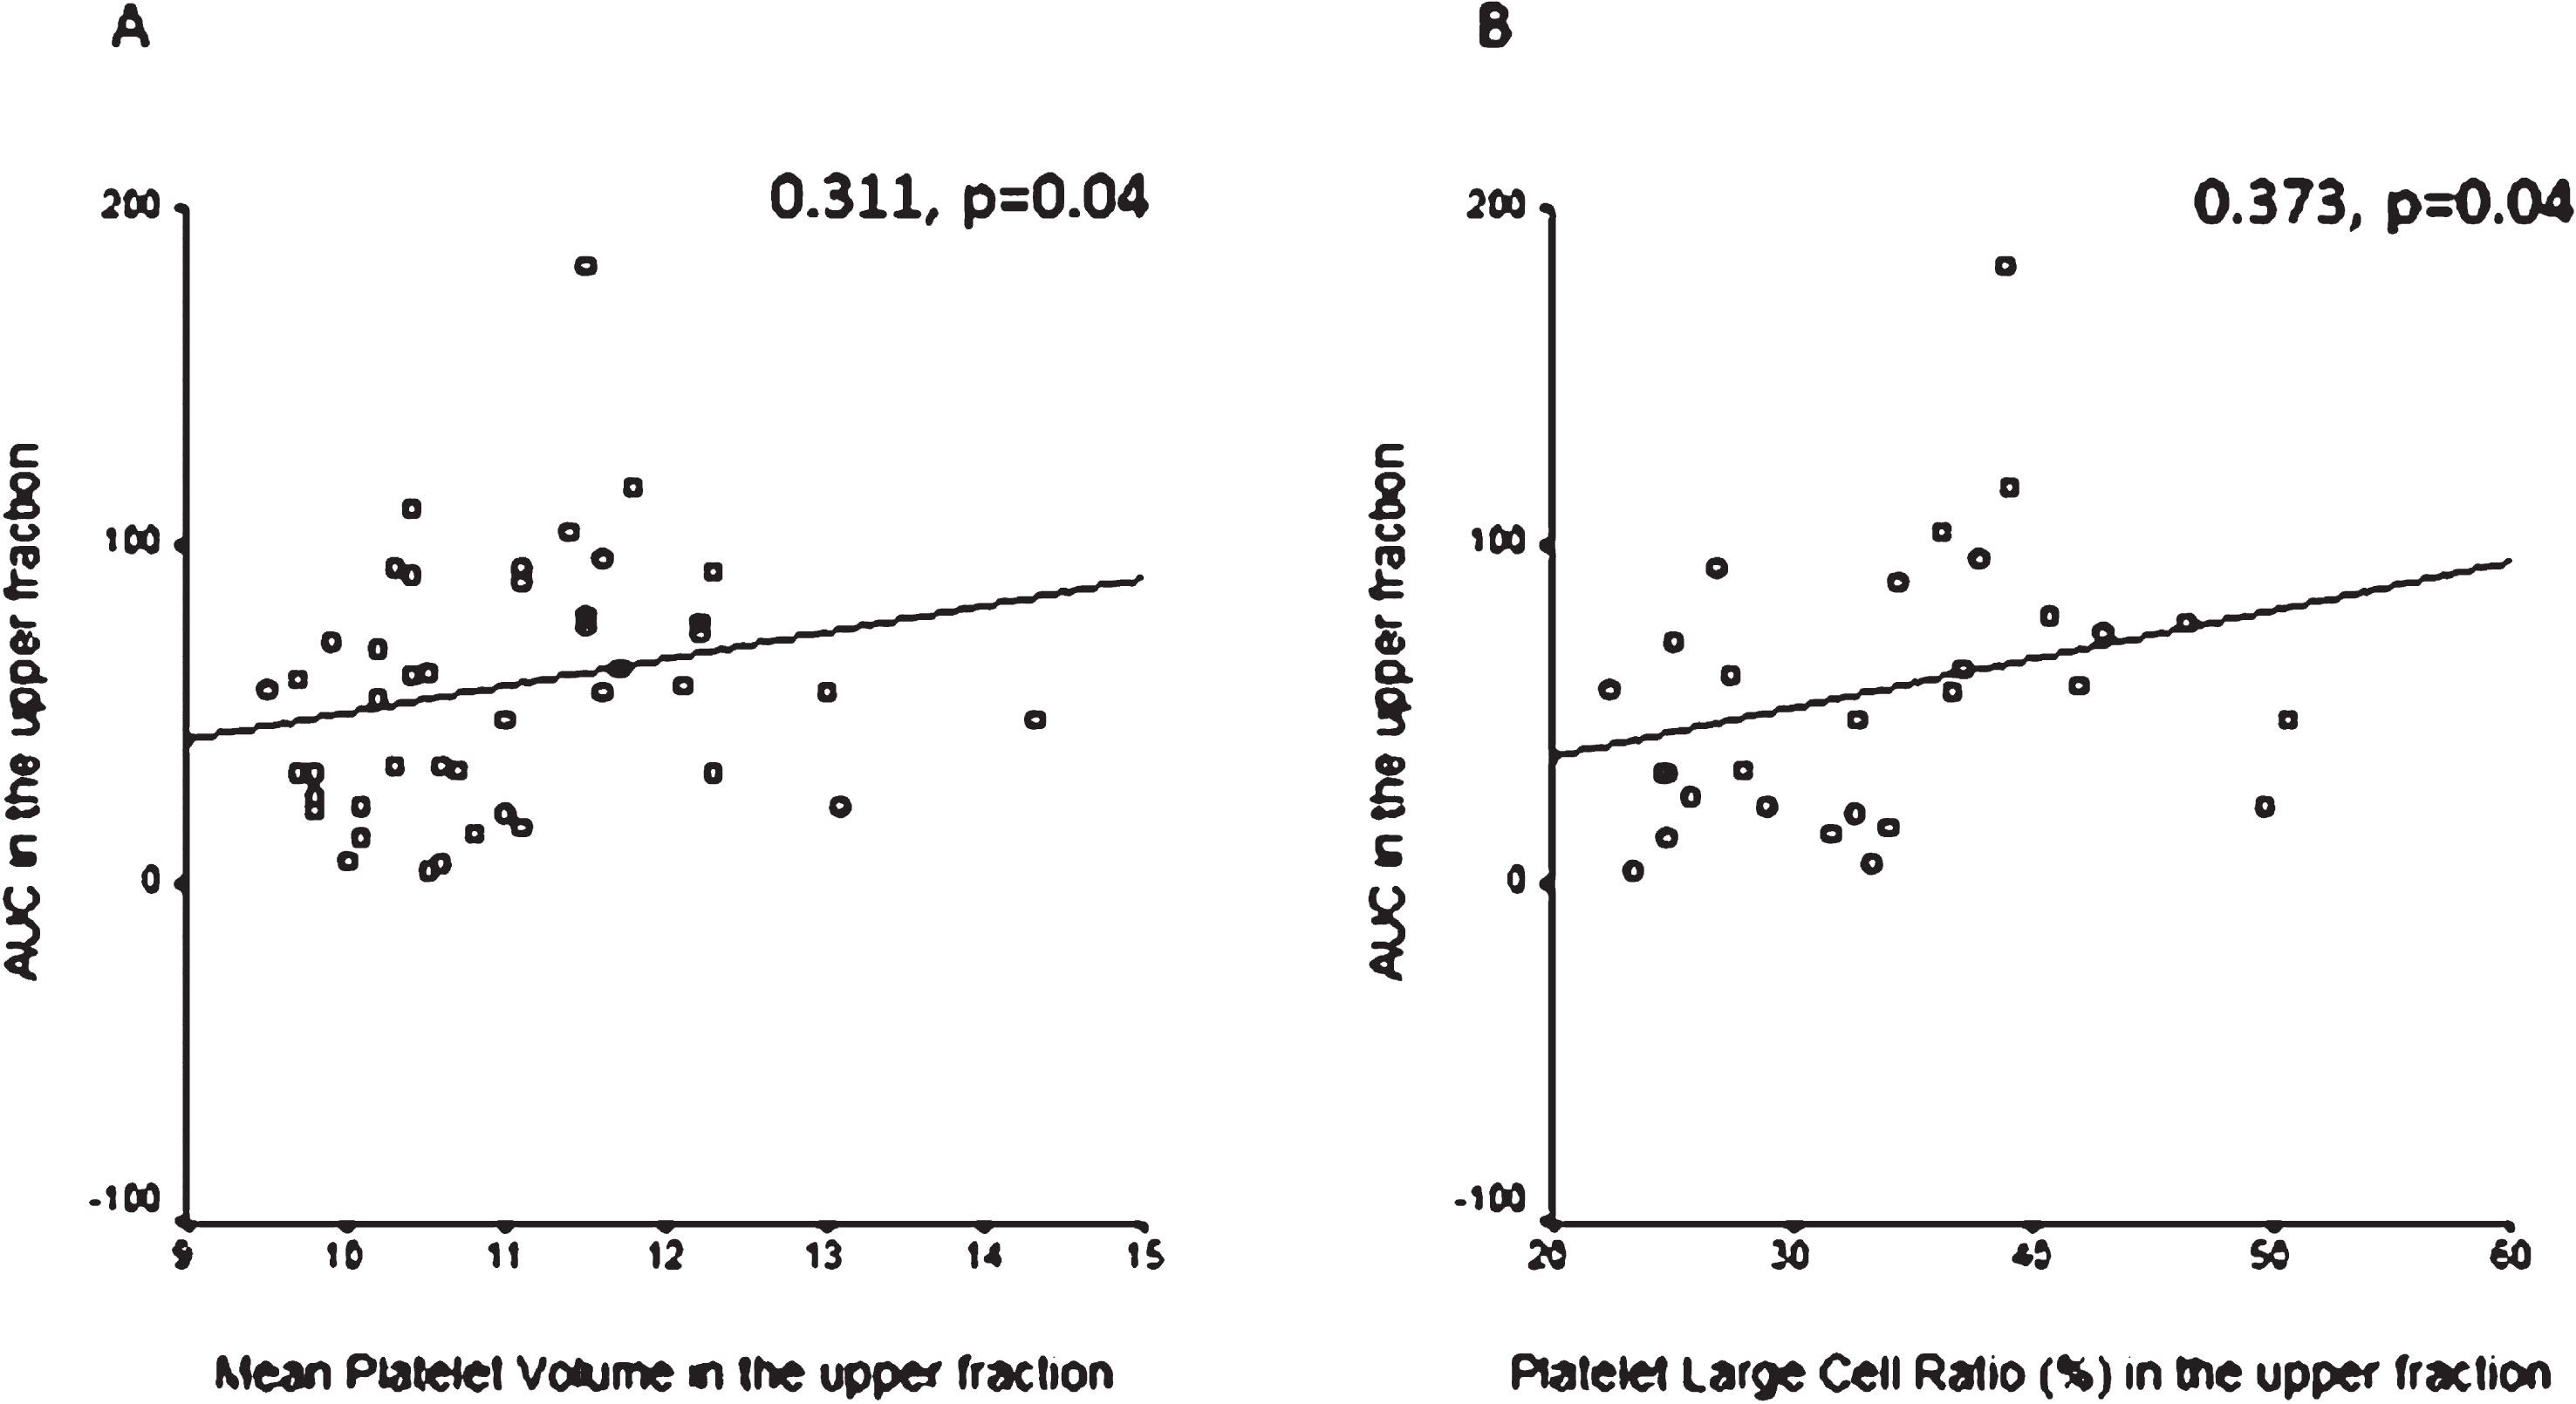
Fig.4
High fluorescent immature platelet fraction measured in the upper and lower samples in healthy subjects compared to responder and non-responder patients. Comparison of high fluorescent immature platelet fraction (%) measured in the upper and lower fraction separated after 1 hour gravity sedimentation respectively in healthy subjects vs patients selected as clopidogrel responders and non-responders respectively by Multiplate aggregometry. Data are presented as median and 25th–75th percentiles, Mann-Whitney U test.
3.3Platelet antisedimentation rate
PAR showed no significant difference between the normal control and the patient groups, although a higher PAR was observed as a trend in patients (Table 2). Similarly, PAR showed a tendency to be higher in no-responders compared to responders (71.9, 63.6–74.3 vs. 67.2, 60.3 –71.0, p = 0.20), which was statistically insignificant. PAR was correlated positively with total platelet MPV in patients (r = 0.300, p = 0.04) and in responders (0.364, p = 0.04), but this correlation disappeared in non-responders.
3.4ESR and C-reactive protein
In patients on clopidogrel the ESR correlated positively with the total platelet count and the platelet count in the upper sample (r = 0.381, p = 0.009 and 0.390, p = 0.008 respectively). These correlations remained in the responder and non-responder subgroups as well. The serum concentration of CRP also correlated positively with the platelet count in the upper sample and the ESR (r = 0.482, p = 0.001 and 0.298, p = 0.04 respectively) in patients on antiplatelet therapy. Although the positive correlation between the CRP and the platelet count in the upper sample remained in the responder group, these correlations disappeared in the non-responder subgroup. Furthermore, the serum concentration of CRP also showed a significant positive correlation with the upper sample H-IPF (%) (0.860, p = 0.006) in the non-responder subgroup.
3.5Independent prediction of non-responder status
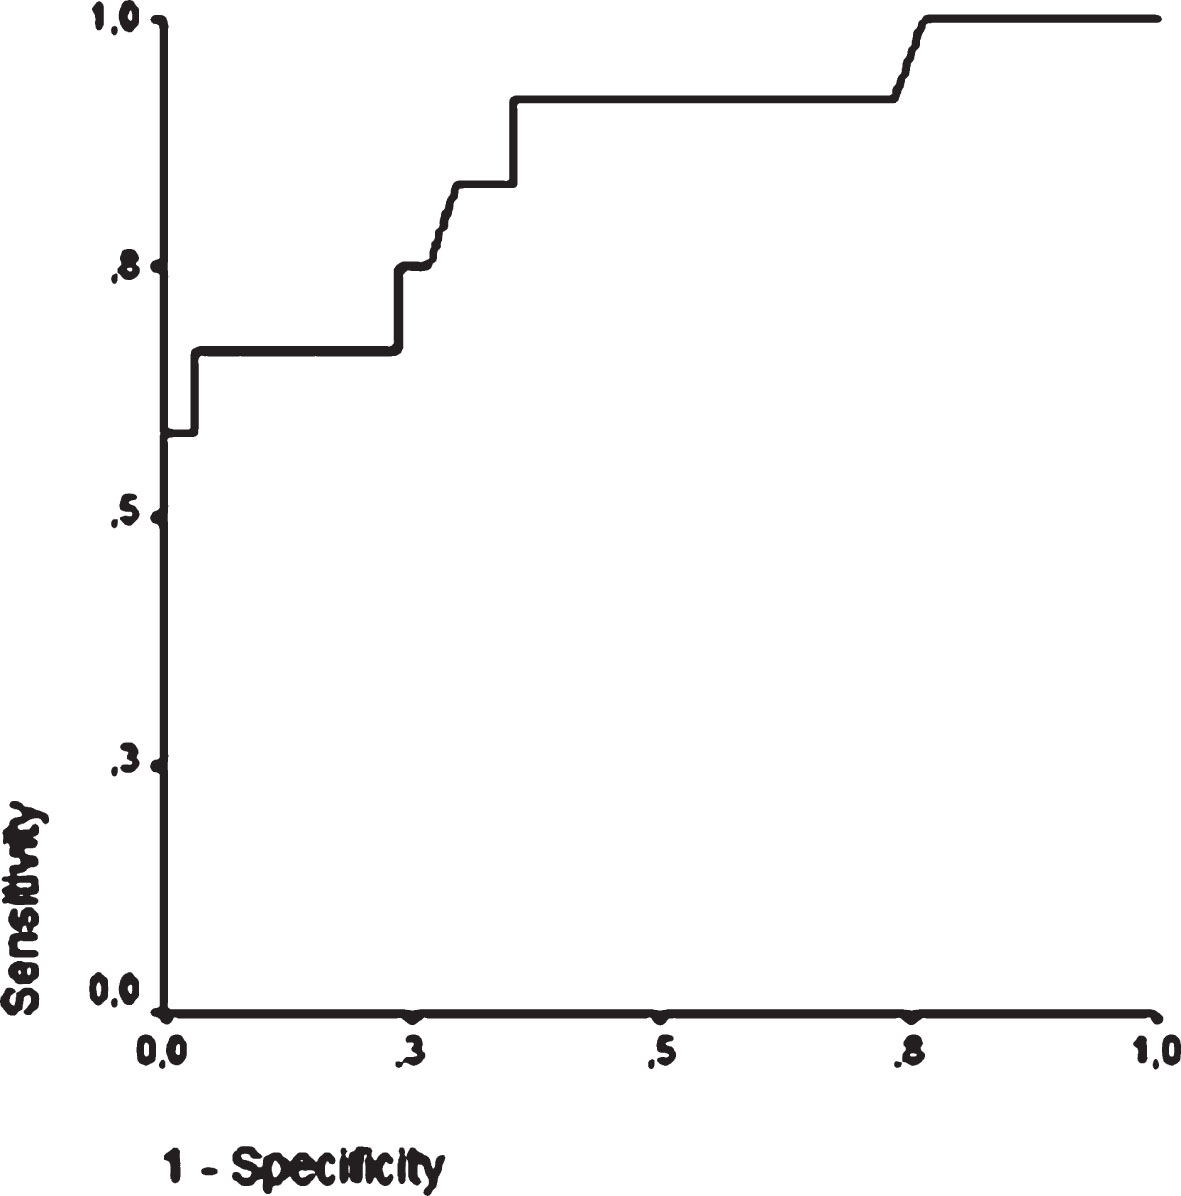
Based on binary logistic regression, including age, PAR, H-IPF, LCR, MPV, AUC in the upper sample, ESR and CRP as confounders, only AUC measured in the upper samples was found to be an independent predictor of high residual platelet reactivity (OR: 1.06, 95% CI: 1.007–1.120, p = 0.027). ROC analysis showed that AUC in the upper sample≥62 indicated the non-responder status with a sensitivity of 84% and specificity of 71% (Area: 0.863, 95% CI: 0.728–0.998, p < 0.001) (Fig. 5).
Fig.5
Receiver operating characteristic curve of AUC measured in the upper sample to confirm the non-responder status in post-stroke patients on clopidogrel. ROC analysis showes that AUC in the upper sample ≥62 indicates the non-responder status with a sensitivity of 84% and specificity of 71% (Area: 0.863, 95% CI: 0.728–0.998, p < 0.001).
4Discussion
By the analogy of leukocyte antisedimentation rate (LAR), as a novelty we described the movement of platelets in patients on clopidogrel therapy and normal controls during one hour gravity sedimentation. PAR, reflecting the percentage of platelets crossing the midline of the blood coloumn upwards during one hour gravity sedimentation, was the highest in non-responders compared to responders and normal controls respectively, but the differences were not statistically significant. This observation needs to be validated using a bigger sample size.
Next we explored factors influencing PAR value. The positive correlation between PAR and MPV suggests the role of size and, likely, the age of platelets as separating factors during gravity sedimentation. In addition, the positive correlation between the serum concentration of CRP and the platelet count in the upper sample indicates the role of inflammatory processes as a determinator of the ascending motion of platelets. Not only experimental but also growing clinical evidence support an association between CRP and activation of platelets [11]. In the non-responder subgroup, the serum concentration of CRP also showed a significant positive correlation with the percentage of H-IPF in the upper sample suggesting that more intense vascular or systemic inflammatory response may be associated to increased production of immature platelets [12–14]. This is in accordance with our observation that the highest H-IPF percentage was observed in the upper samples of non-responders [3, 4]. Moreover, following the separation of the upper sample after 1-hour gravity sedimentation, the Multiplate aggregometry revealed platelet hyperractivity in 59% of patients on clopidogrel. Concluding these findings, we assume that chronic inflammatory state in association with increased number of immature and overactivated platelets might be responsible for ex vivo attenuated responseveness of platelets. Historically, other platelet separation methods also showed differences in platelet aggregation suggesting that large platelets may be functionally more important than smaller platelets [15]. The high incidence of AUC >53 in the upper samples among non-responders may help to stratify patients with high residual platelet reactivity.
The ex vivo hyperaggregability in the presence of ADP based on AUC measured in the upper samples in 40% of healthy controls and the overall lack of aggregability in the lower samples suggest significant differences in certain characteristics of normal platelets. Notably, ascending (probably younger) platelets show hyperreactivity, while sinking (probably older) platelets can not be activated by ADP ex vivo. However, the exact mechanism, driving the platelets opposite direction during 1-hour gravity sedimentation, is not clear. Further studies should be addressed to explore whether platelets per se or non-platelet sources are responsible for this phenomenon. Therefore, as a future perspective, the role of thrombo-inflammatory molecules related to platelet-leukocyte interaction and microparticles should be extensively studied [16, 17].
Importantly, the mechanism of ’on treatment’ residual platelet reactivity can be very complex as platelets are not only regulators of inflammation contributing to vascular damage in acute or chronic inflammation such as atherosclerosis, but also play an important role in the resolution of inflammation, vascular protection and repair [18]. Ultimately, the aim of this study was to stratify patients with residual platelet reactivity despite clopidogrel therapy by using a combination of PAR and Multiplate aggregometry, which was modified by a prior platelet separation method. This approach might be used to select patients with an increased risk for vascular complications, thus an individually tailored antiplatelet therapy (including appropriate dosage) can be initiated to achieve a more effective prevention.
Conflict of interest
None declared.
Acknowledgements
The authors thank for valuable comments of Professor Miklós Tekeres. This clinical study was supported by EFOP-3.6.3-VEKOP-16-2017-00009 at the University of Pecs.
References
[1] | Olie RH , van der Meijden PEJ , Ten Cate H . The coagulation system in atherothrombosis: Implications for new therapeutic strategies. Res Pract Thromb Haemost. (2018) ;2: (2):188–98. |
[2] | Machlus KR , Italiano JE Jr. . The incredible journey: From megakaryocyte development to platelet formation. J Cell Biol. (2013) ;201: (6):785–96. |
[3] | Bernlochner I , Goedel A , Plischke C , Schüpke S , Haller B , Schulz C , et al. Impact of immature platelets on platelet response to ticagrelor and prasugrel in patients with acute coronary syndrome. Eur Heart J. (2015) ;36: (45):3202–10. |
[4] | Ibrahim H , Nadipalli S , DeLao T , Guthikonda S , Kleiman NS . Immature platelet fraction (IPF) determined with an automated method predicts clopidogrel hyporesponsiveness. J Thromb Thrombolysis. (2012) ;33: (2):137–42. |
[5] | Bogar L , Tarsoly P , Jakso P . Characteristics of light and heavy polymorphonuclear leukocytes. Clin Hemorheol Microcirc. (2002) ;27: (2):149–53. |
[6] | Bogar L , Molnar Z , Kenyeres P , Tarsoly P . Sedimentation characteristics of leucocytes can predict bacteraemia in critical care patients. J Clin Pathol. (2006) ;59: (5):523–5. |
[7] | Bogar L , Tarsoly P . Leukocyte sedimentation and inflammatory complications after thoraco-abdominal operations [abstract]. Biorheol. (1999) ;36: :91–2. |
[8] | Molnar T , Peterfalvi A , Szereday L , Pusch G , L Szapary L , Komoly S , et al. Deficient leukocyte antisedimentation is related to post-stroke infections and outcome. J Clin Pathol. (2008) ;61: (11):1209–13. |
[9] | Bonello L , Tantry US , Marcucci R, Blindt R, Angiolillo DJ, Becker R, et al. Consensus and future directions on the definition of high on-treatment platelet reactivity to adenosine diphosphate. J Am Coll Cardiol. (2010) ;56: (12):919–33. |
[10] | Kim J , Cho CH , Jung BK , Nam J , Seo HS , Shin S , Lim CS . Comparative evaluation of Plateletworks, Multiplate analyzer and Platelet function analyzer-200 in cardiology patients. Clin Hemorheol Microcirc. (2018) ;70: (3):257–65. |
[11] | Miyamoto R , Oda T , Hashimoto S , Kurokawa T , Kohno K , Akashi Y , et al. Platelet×CRP Multiplier Value as an Indicator of Poor Prognosis in Patients With Resectable Pancreatic Cancer. Pancreas. (2017) ;46: (1):35–41. |
[12] | Thomas MR , Storey RF . The role of platelets in inflammation. Thromb Haemost. (2015) ;114: (3):449–58. |
[13] | Garraud O , Hamzeh-Cognasse H , Pozzetto B , Cavaillon JM , Cognasse F. Bench-to-bedside review: Platelets and active immune functions-new clues for immunopathology? Crit Care. (2013) ;17: (4):236. |
[14] | Liverani E , Kilpatrick LE , Tsygankov AY, Kunapuli SP. The Role of P2Y12 Receptor and Activated Platelets During Inflammation. Curr Drug Targets. (2014) ;15: (7):720–8. |
[15] | Thompson CB , Eaton KA , Princiotta SM , Rushin CA , Valeri CR . Size dependent platelet subpopulations: Relationship of platelet volume to ultrastructure, enzymatic activity, and function. Br J Haematol. (1982) ;50: (3):509–19. |
[16] | Becatti M , Fiorillo C , Gori AM , Marcucci R , Paniccia R , Giusti B , et al. Platelet and leukocyte ROS production and lipoperoxidation are associated with high platelet reactivity in Non-ST elevation myocardial infarction (NSTEMI) patients on dual antiplatelet treatment. Atherosclerosis. (2013) ;231: (2):392–400. |
[17] | Agbani EO , Poole AW . Procoagulant platelets: Generation, function, and therapeutic targeting in thrombosis. Blood. (2017) ;130: (20):2171–9. |
[18] | Reinhart WH . Platelets in vascular disease. Clin Hemorheol Microcirc. (2013) ;53: (1-2):71–9. |


