
The effects of stenting on hemorheological parameters: An in vitro investigation under various blood flow conditions
Abstract
Despite their wide clinical usage, stent functionality may be compromised by complications at the site of implantation, including early/late stent thrombosis and occlusion. Although several studies have described the effect of fluid-structure interaction on local haemodynamics, there is yet limited information on the effect of the stent presence on specific hemorheological parameters. The current work investigates the red blood cell (RBC) mechanical behavior and physiological changes as a result of flow through stented vessels. Blood samples from healthy volunteers were prepared as RBC suspensions in plasma and in phosphate buffer saline at 45% haematocrit. Self-expanding nitinol stents were inserted in clear perfluoroalkoxy alkane tubing which was connected to a syringe, and integrated in a syringe pump. The samples were tested at flow rates of 17.5, 35 and 70 ml/min, and control tests were performed in non-stented vessels. For each flow rate, the sample viscosity, RBC aggregation and deformability, and RBC lysis were estimated. The results indicate that the presence of a stent in a vessel has an influence on the hemorheological characteristics of blood. The viscosity of all samples increases slightly with the increase of the flow rate and exposure. RBC aggregation and elongation index (EI) decrease as the flow rate and exposure increases. RBC lysis for the extreme cases is evident. The results indicate that the stresses developed in the stent area for the extreme conditions could be sufficiently high to influence the integrity of the RBC membrane.
1Introduction
Cardiovascular stent implantation has been used as the primary solution in restoring arterial stenosis in the past decades. Various designs have been developed and are commercially available for clinical use [1]. Stent structural integrity and biocompatibility are known issues and considerable research is ongoing to improve the efficiency of stents in that aspect. A major concern in the utilisation of stents is restenosis, which occurs following stent placement. Restenosis is a complex process which involves fibroproliferative responses of the vascular wall, platelet activation, inflammatory responses, vascular smooth muscle cell proliferation, and accumulation of extracellular matrix, resulting in loss of lumen area [2]. Another limitation of cardiovascular stents is the influence they have on additional blood physiology characteristics due to the alterations they cause in the local flow conditions. Stent struts protruding in a vessel cause various fluid dynamics phenomena to appear, including flow stagnation regions, low and high local shear and stress regions, high shear stress gradients, etc. [3]. The majority of the in vivo studies in the literature have been conducted in animals, in which various stent designs are used to assess the implantation outcome [2]. In the Rogers and Edelman study for example, stent design parameters such as holding diameter, mass, surface area, and stent surface material constants were altered for implantations in the rabbit iliac artery, and indeed an influence on vascular injury, thrombosis and neointimal hyperplasia was observed [4]. A considerable number of other animal and clinical studies [5–7] have shown the influence of design characteristics in vascular injury, neointimal proliferation and hyperplasia, thrombogenicity, restenosis and other implantation-induced non-physiological effects. Similarly, late thrombosis effects, are observed when bioresorbable scaffolds are utilised for the treatment of coronary artery disease [8].
In vitro studies focus more on assessing stent haemocompatibility, examining haemolytic and thrombotic effects and other issues relevant to the requirements of the ISO10993-4 for Biological examination of medical devices – Selection of tests for interaction with blood [9]. Grim et al. examined the haemolytic effects for the implantation of various industrial stent designs in vitro (∼8 mm expanded diameter, at 1170 ml/min) and found that haemolysis was present from early exposure times [1]. Kealy et al examined thrombotic effects, by assessing the platelet deposition on implanted nitinol stents, under flow conditions simulating arterial stenosis; they documented platelet adhesion and thrombus formation on certain stent designs [10]. Similar studies are described in van Oeveren [11] and in Jung et al [12], with both concluding that indeed the material and the design of the stent affect physiological aspects of blood leading to undesirable effects.
Computational studies allow flexibility in assessing various design parameters and their impact on haemodynamics, and are mainly performed under the assumption that blood is a continuous, Newtonian or non-Newtonian fluid [3, 13]. An important haemodynamic parameter, related to negative physiology impacts (such as neointimal proliferation, restenosis, etc.), is the wall shear stress (WSS). A significant number of computational studies have examined the characteristics of this parameter. The WSS magnitude, location, stent and vessels surface exposure to low and high WSS, and WSS gradients (WSSG), have been examined using Newtonian and non-Newtonian blood viscosity models [3]; it has been illustrated that maximal WSS appear at the central part of the stent pattern, and that the minimal values are concentrated on the proximal stent wire surface. Berry et al [14] examined the effect of wire spacing on stagnation zones and concluded that this design parameter indeed affected the local flow. In another computational study, designs from various manufacturers where tested for wall shear stresses and mean stress exposure time illustrating that different designs affect the local flow conditions differently [15]. Other computational studies have shown that recirculation zones, which promote thrombosis, can be avoided with appropriate stent design and that the presence of stents cause the appearance of both high and low wall shear stress regions [16].
The above mentioned studies have undoubtedly provided extremely valuable information for the clinical practice, however, the examination of the effects of altered haemodynamics on blood rheology is rare in the literature. Complications due to stenting, such as haemodynamic depression in the carotid stenting case, are well known in the literature, however, the role of blood rheology is also unclear on this issue [17]. Additionally, questions regarding RBC physiological effects due to the stent presence, such as how the RBC membrane is affected, to which degree, and to what extent in the RBC population, have not been answered. RBC deformability is an important rheological factor and the mechanical stretching that RBCs experience by the developed shear forces in the stent region could be significant, according to various computational studies [3]. This could lead to altered RBC physiological and rheological properties, increased rigidity, or even lysis [18]. The impact of the shear stress (SS) magnitude, duration and exposure pattern (e.g. cyclic exposure to SS), on the deformability of the RBC has been investigated in detail in a number of studies [19–22] and has been shown that the long- and short-term changes in RBC deformability depend on such conditions. Importantly, the stent presence in a vessel causes the aforementioned haemodynamic conditions (i.e. alteration of SS magnitude, duration and exposure pattern) to take effect. Another important observation made by Simmonds and his coworkers was that the effect of SS magnitude/duration/exposure pattern is biphasic: that is, bellow certain levels an improvement in the deformability is apparent before negative effects on RBC deformability are seen [19, 21].
In vivo studies on the effect of stenting on rheological parameters report that immediately after stenting whole blood and plasma viscosity was decreased, followed by a significant increase in these parameters a few days after, and a noticeable decrease after a month of the implantation [23, 24]. A similar behavior was observed in other studies for the red blood cell aggregation and the fibrinogen concentration [25]. The researchers in the above studies concluded that this rheological behavior could lead to early stent occlusion. The contribution of affected RBC membrane mechanics on the altered hemorheology observed, could not be made clear, and in addition other factors such medication received after stenting (clopidogrel and aspirin) introduce difficulties in the interpretation of results. Earlier studies on the effect of the endovascular intervention on whole blood or plasma viscosities, report similar observations [26].
The scarce information in the literature regarding how fundamental aspects of blood rheology, such as RBC membrane mechanics, are affected by the stent presence, points to the need for investigating how RBC deformability, aggregation and blood viscosity are altered for blood at different flow conditions in a stented vessel. The results are analyzed in comparison to the non-stented vessel.
2Methods
2.1Blood sample preparation
The study protocol was approved by the Cyprus National Bioethics Committee (ref: EEBK/EΠ/2016/18). Samples were collected from a healthy population (9 men, 25–46 years) into vacuum tubes (BD) containing 1.8 mg/ml EDTA, using a 21G needle. After collection, one portion of the blood donation from each participant was centrifuged at ∼1350 g, for 10 minutes, in order to remove the buffy coat and to adjust the haematocrit (45% by adding/subtracting plasma). This portion of the sample was kept as the normally aggregating blood sample (AB). Another portion of the blood donation was used in order to produce non-aggregating blood samples (NAB): RBC suspensions in phosphate buffer saline (PBS) were prepared after double washing. All samples were oxygenated by rolling in the 50 ml syringes, for approximately 1/2 minute prior to extracting the air from the syringe. Hemorheology tests were performed immediately after collection and treatment, and within 4 hours, except for a small number of tests for which the samples were kept at 4° C until testing.
2.2Tube stenting and flow configuration
Self-expanding nitinol stents (1.0×3.3 mm, closed-cell design with diamond-shaped pattern, Fig. 1a) were inserted in clear perfluoroalkoxy alkane (PFA) tubing of internal diameter 0.75 mm (Fig. 1b). The insertion was performed under a microscope using fine forceps and no over-expansion was observed. The tubing was connected to a syringe (50 ml) through a 20G needle, and placed on a syringe pump (KDS 200) (Fig. 1c). The stented region was located at an appropriate length from the end of the curvature to ensure fully developed flow. The internal diameters of the 50 ml syringe tip (2 mm), the 20G needle tip (0.603 mm) and the PFA tubing (0.75 mm) were larger than the (minimum) deployed stent diameter (0.570 mm) - all internal diameters were larger than the internal diameter (0.514 mm) of the 21 G needle used in the blood sampling.
Fig.1
(a) The nitinol stent used in the study, (b) the inserted stent in the PFA tubing, and (c) a diagrammatic representation of the flow configuration (not drawn to scale).
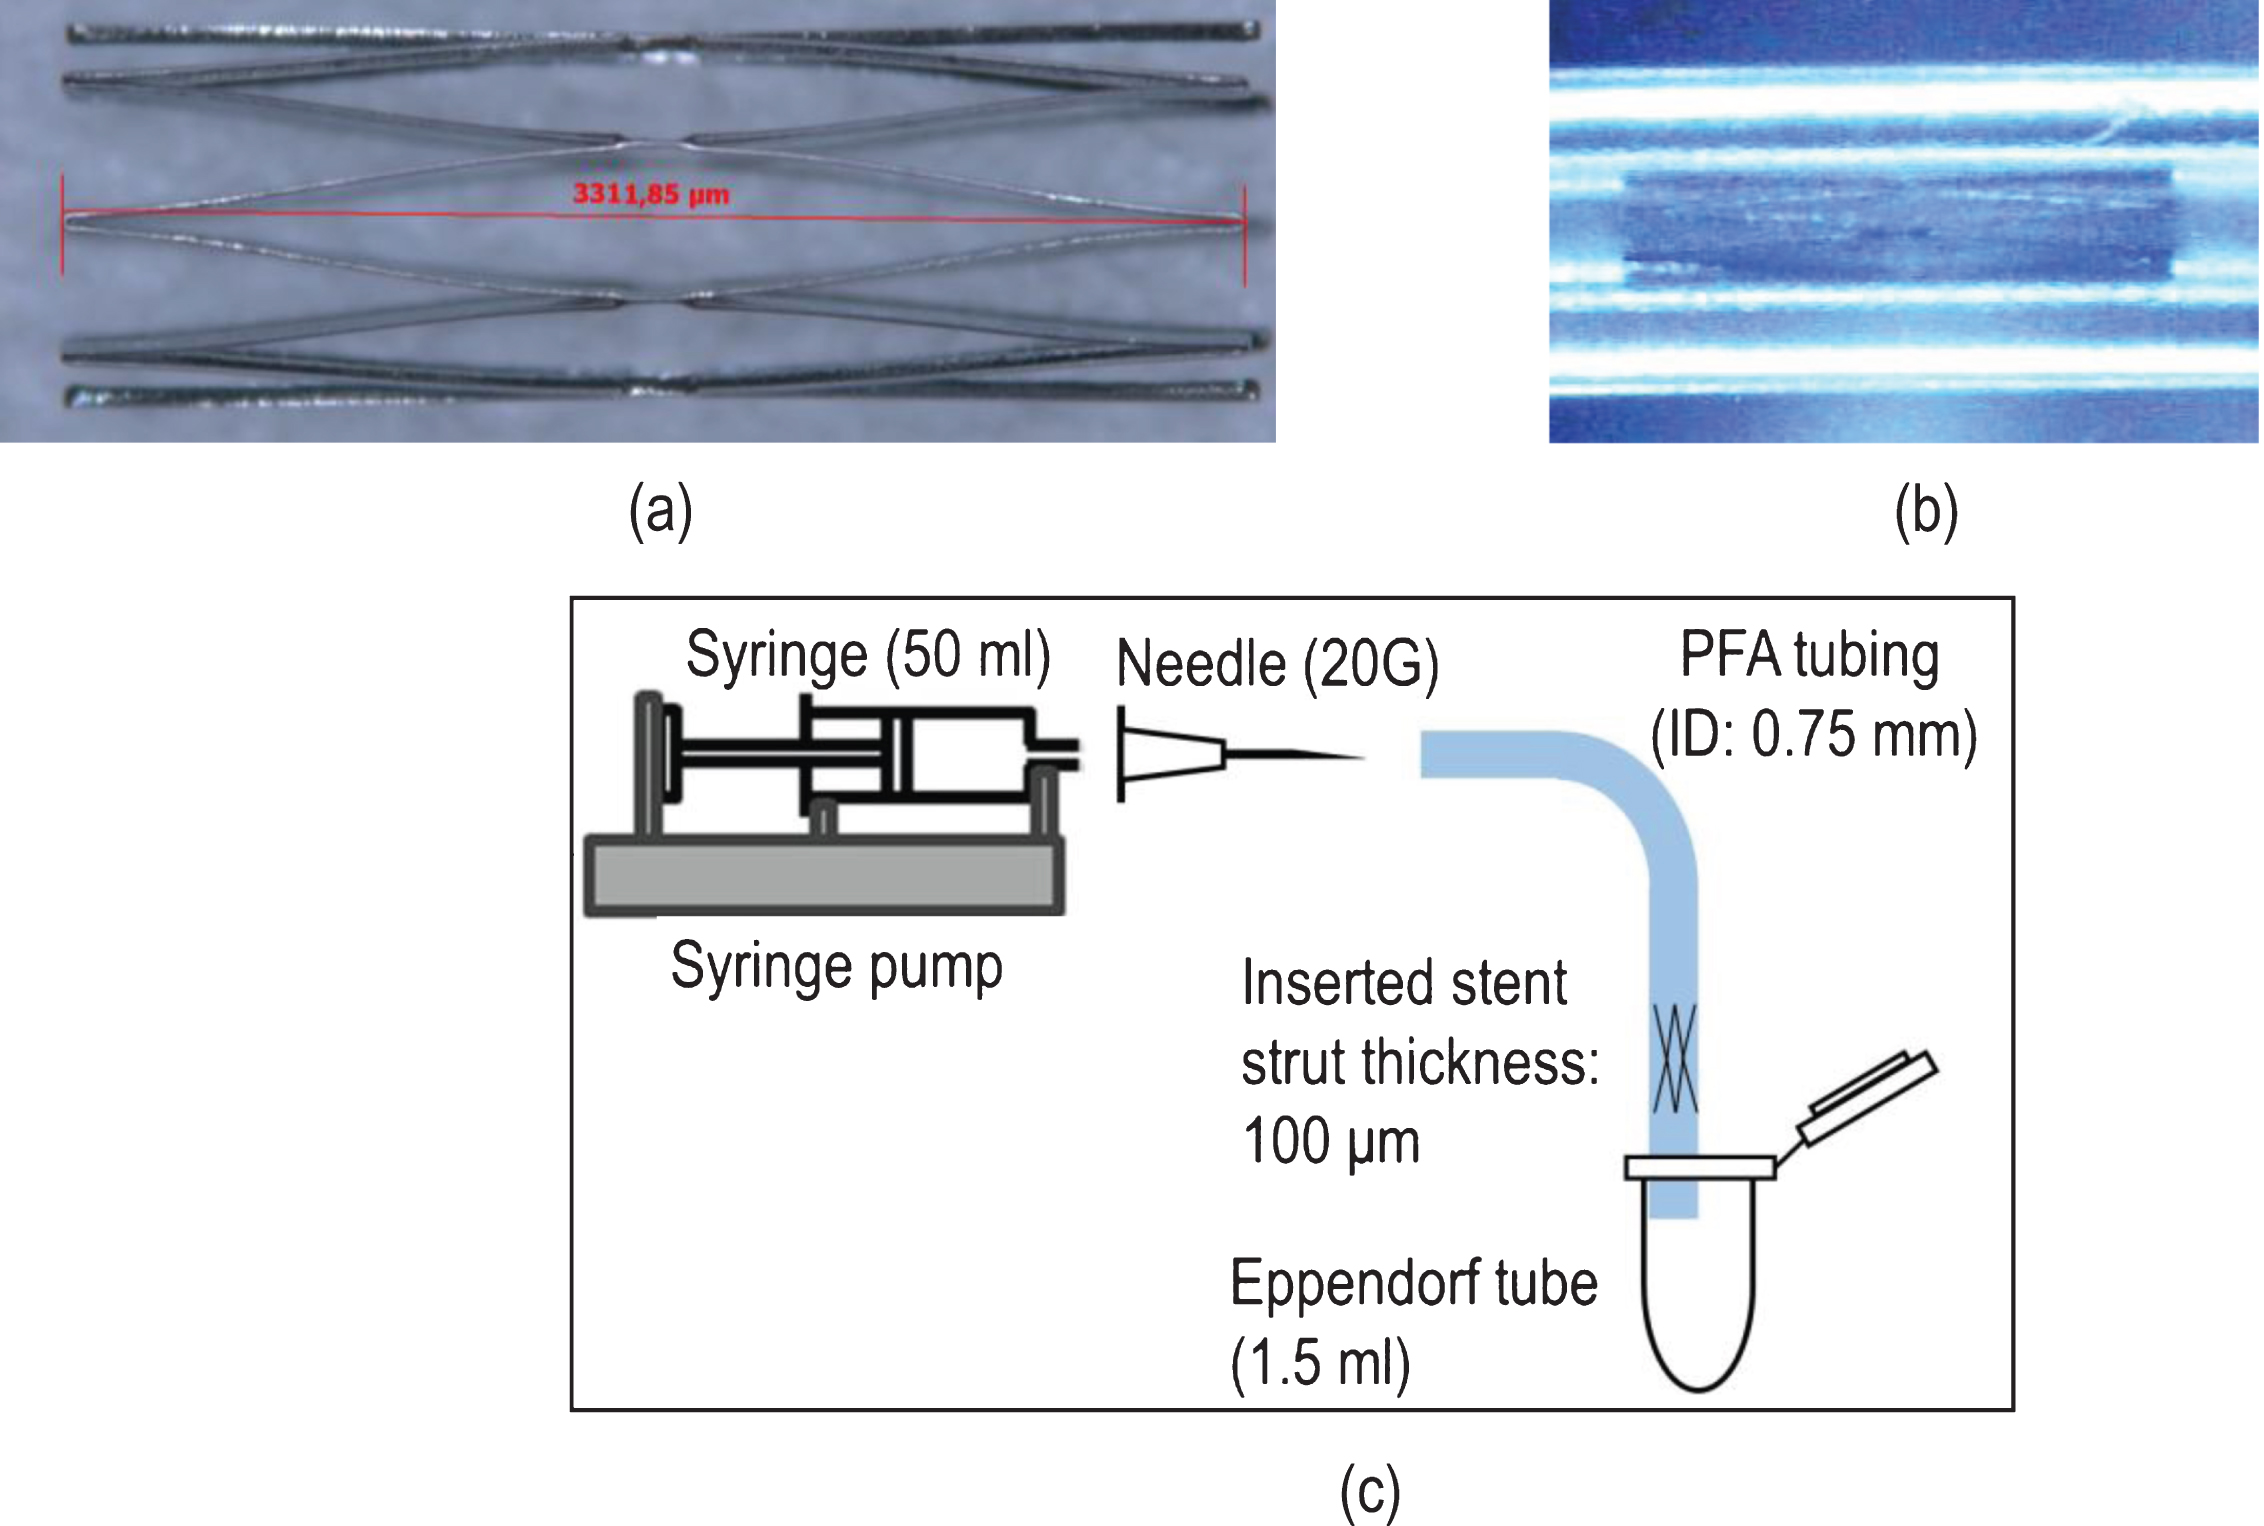
The stability of the stent insertion was initially assessed, and confirmed, by subjecting the stented tube to a very high flow rate (50% higher than the maximum flow rate applied during testing). After each testing, the stented tube was thoroughly cleaned by infusing/withdrawing distilled water multiple times, followed by air infusion at very high flow rates in order to dry the tube and stent. The stent was inspected again visually for cleanness and integrity. The perfused samples were collected at the exit of the tube in 1.5 ml Eppendorf tubes (Fig. 1c): the end of the PFA tube was in contact to the Eppendorf tube wall, so that the blood sample slide gently in the container, avoiding splashing of the drops. An identical tube-needle set up, without stent, was also used for comparison as the control cases. All tests were performed at identical flow conditions in both tube set ups, in order to clarify the effects of stenting, on the various hemorheological parameters studied.
2.3Flow conditions
The aggregating and non-aggregating blood samples (referred to as AB and NAB respectively) were infused in both set ups (stented and non-stented tubes) at three flow rates (Q = 17.5, 35 and 70 ml/min) to reflect a range of physiological flow conditions. A triple exposure of the samples to Q = 70 ml/min was set as an extreme flow condition, for the stented case only; this was achieved by infusing/withdrawing/infusing the same volume of the sample. The aforementioned flow cases will be referred to as Q17.5, Q35, Q70 and 3XQ70 respectively, for convenience. Hemorheological tests were also performed in samples that did not undergo any infusion in the tube set-ups, and served as the baseline cases (referred to as BL cases). BL samples were placed in the Eppendorf tubes prior to transportation in the syringe/tube set up.
2.4Hemorheological, RBC physiology parameters assessed, and tests performed
In this study the following hemorheological and RBC physiology parameters, which affect mostly the mechanical and flow properties of blood, were assessed:
• Blood (AB and NAB) and plasma viscosity
• RBC aggregation
• RBC deformability
• RBC membrane integrity (lysis assays, scanning electron microscopy images (SEM), optical microscopy images, and visual inspection).
2.4.1Blood and plasma viscosity tests
A Brookfield DV2T instrument was used for the viscosity measurements, using a cone-plate geometry. Samples were transported immediately after infusion in the stented (or non-stented) tubes using the Eppendorf tubes and gently loaded with a micropipette (0.6 ml volume) in the plate of the viscometer. Viscosity tests were initiated after approximately 1 minute from perfusion in the tubes. AB and NAB sample viscosities were measured (for shear rates between 251.2 and 1.4 s–1 in this order). Starting the test at the higher shear rate ensured RBC aggregate dispersion for all AB samples, and therefore identical initial conditions. The maximum shear stress that cells were exposed at the highest shear rate was approximately 1.5 Pa for 30 seconds. The duration of a complete viscosity test was 8.5 minutes (17 points of measurement for 30 seconds each), and the viscosity measurement was performed at the end of the shearing period at each point. All measurements were performed at room temperature (25±0.5° C). Viscosity data were considered for transducer torque values above the 5% of its torque range. Plasma viscosity was also measured for all samples prior to perfusion in the tube set-ups.
2.4.2RBC aggregation
RBC aggregation was assessed with a Rheoscan A200 instrument [27]. The instrument is equipped with a laser-photodiode system which allows the RBC aggregation kinetics to be resolved, based on the light transmission/time relationship. The sample is placed on a disposable microchip though a micropipette (10 μl), it was sheared for 10 seconds by using a magnetic stirrer arrangement, followed by the recording of the intensity of the transmitted light for 120 seconds. Aggregation tests were initiated 1–2 minutes approximately after perfusion in the tubes. All measurements were performed at room temperature (25±0.5° C). An aggregation index (AI) was used, defined as the ratio between the area under the light intensity/time curve, and the sum of the areas below and above the curve in the first 10 seconds [27].
2.4.3RBC deformability
The RBC deformability measurement methodology was developed based on previous works in the literature (see for example [28]) using an optical shearing system (CSS450, LINKAM) and a high viscosity medium (η= 100 mPas). The optical shearing system has been described in detail in other studies [29]. In brief, it consists of two parallel glass plates of 15 mm radius, with the observation point at a radius (r) of 7.5 mm, and an adjustable shearing gap of h = 40 μm (Fig. 2). The bottom plate was rotated with a controllable angular velocity ω, and therefore the desirable shear rate could be set:
Fig.2
(a) A schematic representation of the plate-plate shearing system used for the deformability measurements. RBCs are observed through the microscope-camera set-up and the elongation index is calculated from minor (S) and major (L) axis (EI = (L – S)/(L + S)), (b) A comparison of the resulted elongation index as estimated in the present study, with data presented in [31].
![(a) A schematic representation of the plate-plate shearing system used for the deformability measurements. RBCs are observed through the microscope-camera set-up and the elongation index is calculated from minor (S) and major (L) axis (EI = (L – S)/(L + S)), (b) A comparison of the resulted elongation index as estimated in the present study, with data presented in [31].](https://content.iospress.com:443/media/ch/2019/72-4/ch-72-4-ch180540/ch-72-ch180540-g002.jpg)
Red blood cells were suspended in 1 ml of the isotonic dextran solution at a concentration of approximately 1% by volume and mixed gently for maximum 3 minutes at room temperature, until homogeneity was achieved. No aggregation was observed between the RBCs, and no sedimentation of the cells was apparent, as a result of the increased density of the isotonic dextran solution (∼1.055 gr/ml). A BX51 OLYMPUS microscope (100× oil immersed objective) and a fast CMOS camera (IDT X, Tallahassee, USA), were used for image capturing. The shear stresses produced in the plate-plate system ranged from 0.14 to 30 Pa and the RBCs were exposed to the specific shear stresses for 10 seconds. The total number of RBCs used for the calculation of the elongation index (EI) was approximately 100. The EI was calculated using the typical formulation EI = (L – S)/(L + S), where L and S are the major and minor axis lengths of the apparent RBC respectively [18]. The lengths of L and S were measured with image analysis in Matlab software. Figure 2b shows a comparison of the EI estimated for a representable sample (AB, Q0) against data presented in the work of Singh and Stoltz [31].
2.4.4RBC membrane integrity
The integrity of the RBC membrane was assessed indirectly by measuring the concentration of the serum free haemoglobin (SFH) using a commercially available colorimetric assay kit (Cayman Chemical, Ann Arbor, MI) through a 96-well plate reader (Thermo Scientific Multiskan™ FC). The assay was performed in accordance with the manufacturer’s instructions and sample Hgb concentrations were calculated from a standard curve constructed with known concentration standards provided in the kit using the plate reader’s software.
In addition, the condition of the RBC membrane was evaluated through scanning electron microscopy (SEM - FEI Quanta 200, Oregon, USA), and conventional optical microscopy (OLYMPUS BX51, 100× objective). For electron microscopy, RBCs were pre-fixed in 2% glutaraldehyde for 30 minutes and specimens were gold-sputtered (5-6 nm thick films) to prevent beam charging effects (SC7640 Sputter coater, Quorum Technologies, Kent, UK). SEM images at various magnifications were processed through the MountainsMap software (Digital Surf, Besançon, France) and were used to correlate morphological features with the extent of membrane damage and mechanical haemolysis.
The samples were also visually inspected for lysis within the Eppendorf tubes, after sedimentation of the RBCs. Images of the tubes were taken and a mean image intensity ratio of the supernatant part (plasma or PBS), to the sediment part (RBCs) of the sample was calculated
2.4.5Sources of uncertainty
The uncertainty in the viscosity measurements was approximately 3-4%, according to the torque calibration of the instrument. Validation tests using standard viscosity fluids showed a similar discrepancy for the valid range of the transducer torque range. The Rheoscan A200 RBC aggregometer shows an acceptable intra-assay variation of less than 5%, and an acceptable sensitivity to aggregation differences [27].
One of the main sources of uncertainty in the deformability measurements is the variation of the shear stress due to the slight shear thinning of the suspending medium (∼4% in the whole shear rate range). Another reason of uncertainty is the stress variation in the observational area (observation width of ∼150 μm, with a 100× objective), due to the increase of the radius in the plate-plate system; this variation in the shear rate was calculated to be <2%. Regarding the first source, the percentage difference in the measured viscosity of the fluid medium is significantly supressed at the highest shear rate range (>10 s–1) to a calculated 1.5% difference. The shear rates used in the plate-plate system to produce stresses from 1 to 26 Pa, were ranging from 10–268.2 s–1. Therefore, it could be reasonable to expect a similar uncertainty (∼1.5%) due to the first reason. A combined uncertainty of ∼3.5% maximum in the shear stress values due to the two reasons mentioned above is deemed reasonable.
A third source of uncertainty in the deformability measurements concerns the image analysis procedure to calculate the EI index. The measurements in the present work were performed by both an operator and by image processing. The operator results were used to assess the validity of the image processing and indeed, the EI/shear stress curves produced using both methods were found to be in an excellent agreement for shear stresses up to approximately 14 Pa, with relatively small discrepancies above that value. For this work the EI measurements were performed by an operator to ensure smallest error due image quality issues which affected the processing at high shear stresses. The uncertainty in the operator’s measurement is also influenced by image quality, and was estimated by inspection to be in the order of 2%. Therefore, a combined (standard) uncertainty level of approximately 4% could be assumed to exist in the results for deformability.
Sample handling (PBS washing and resuspension, transportation between tubes and syringes, oxygenation, mixing for aggregate dispersion, etc.) could affect the RBC mechanical properties (through osmotic effects) and introduce uncertainty in the quantities measured. For this reason a strict protocol on sample handling and experimental procedures was put in place and followed as closely as possible. It is expected that any influence of sample handling will be systematic, affecting all samples similarly.
2.4.6Statistical analysis
The calculated quantities (viscosity, aggregation index AI, deformability index EI, and serum free haemoglobin SFH) are typically expressed as averaged values. The normality of the data distributions was assessed with the one-sample Anderson-Darling test, using Matlab (Mathworks) software. For normal distributions, the mean values (MV) and standard deviation (STD) are presented as MV±STD. The pooled standard deviation (STDp) is provided for some quantities and it calculated as
3Results
3.1RBC deformability
In this work the average deformability of the red blood cells, for each examined sample, was reflected through the mean value of the elongation index EI, calculated at two distinct shear stresses (i.e. at 3.7 and 10 Pa):
Figure 3a and 3b present the mean value of
Fig.3
(a) Percentage differences
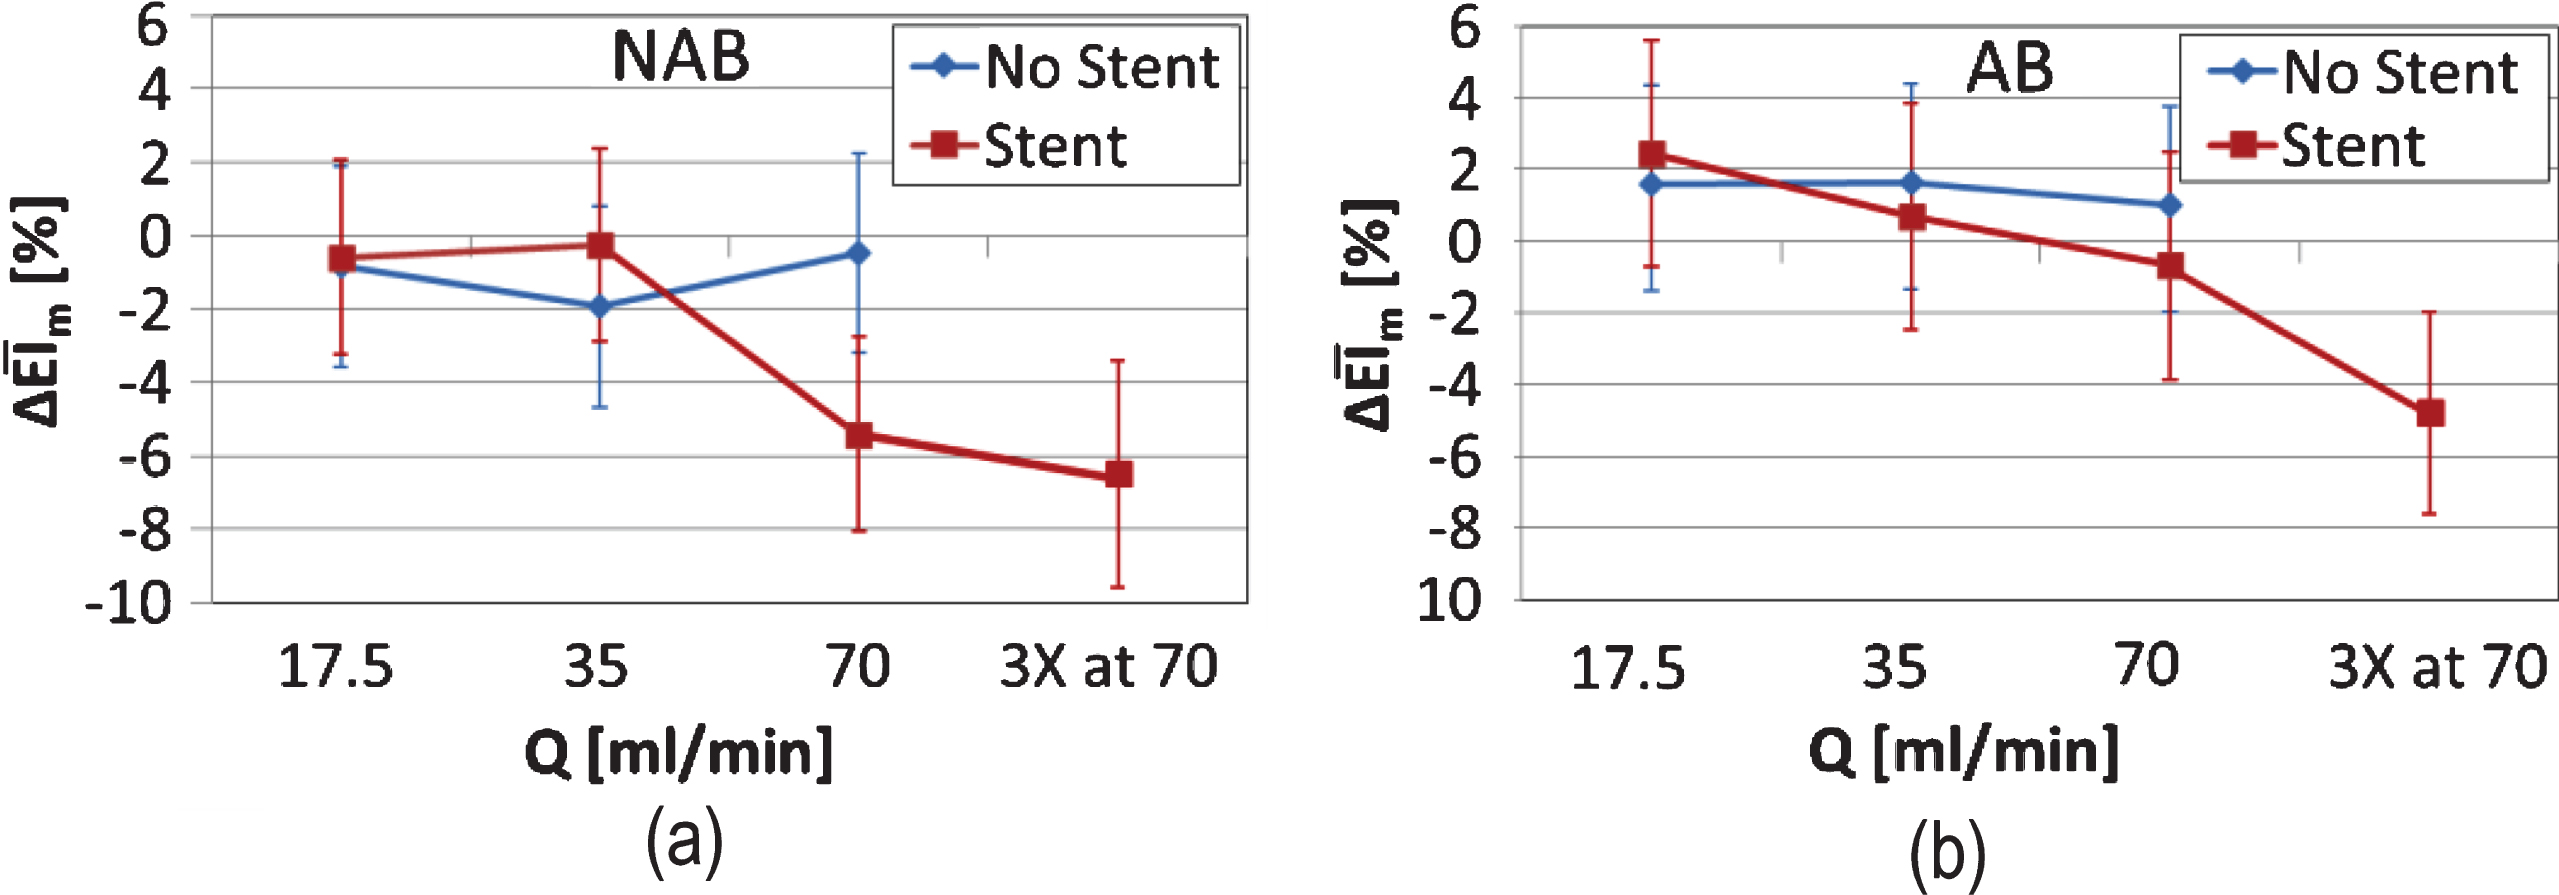
A similar behaviour is observed in the EI for the aggregating blood sample in (Fig. 3b): the passing of the AB sample through the non-stented configuration results at a small, positive and systematic, although not significant increase in EI at all flow conditions. The influence of stenting is apparent in the case of the AB sample also; in that case however, a small positive increase of ∼2% is observed in the Q17.5 flow case, with a decreasing trend at all other flow conditions. In the 3XQ70 flow case a decrease of ∼5% from baseline is apparent. The observed decreasing trend is confirmed when considering the significance between the differences observed in (Fig. 3b): p∼0.05 for the Q17.5 to Q70, and p < 0.05 for the Q17.5 to 3XQ70 comparison.
3.2RBC membrane damage
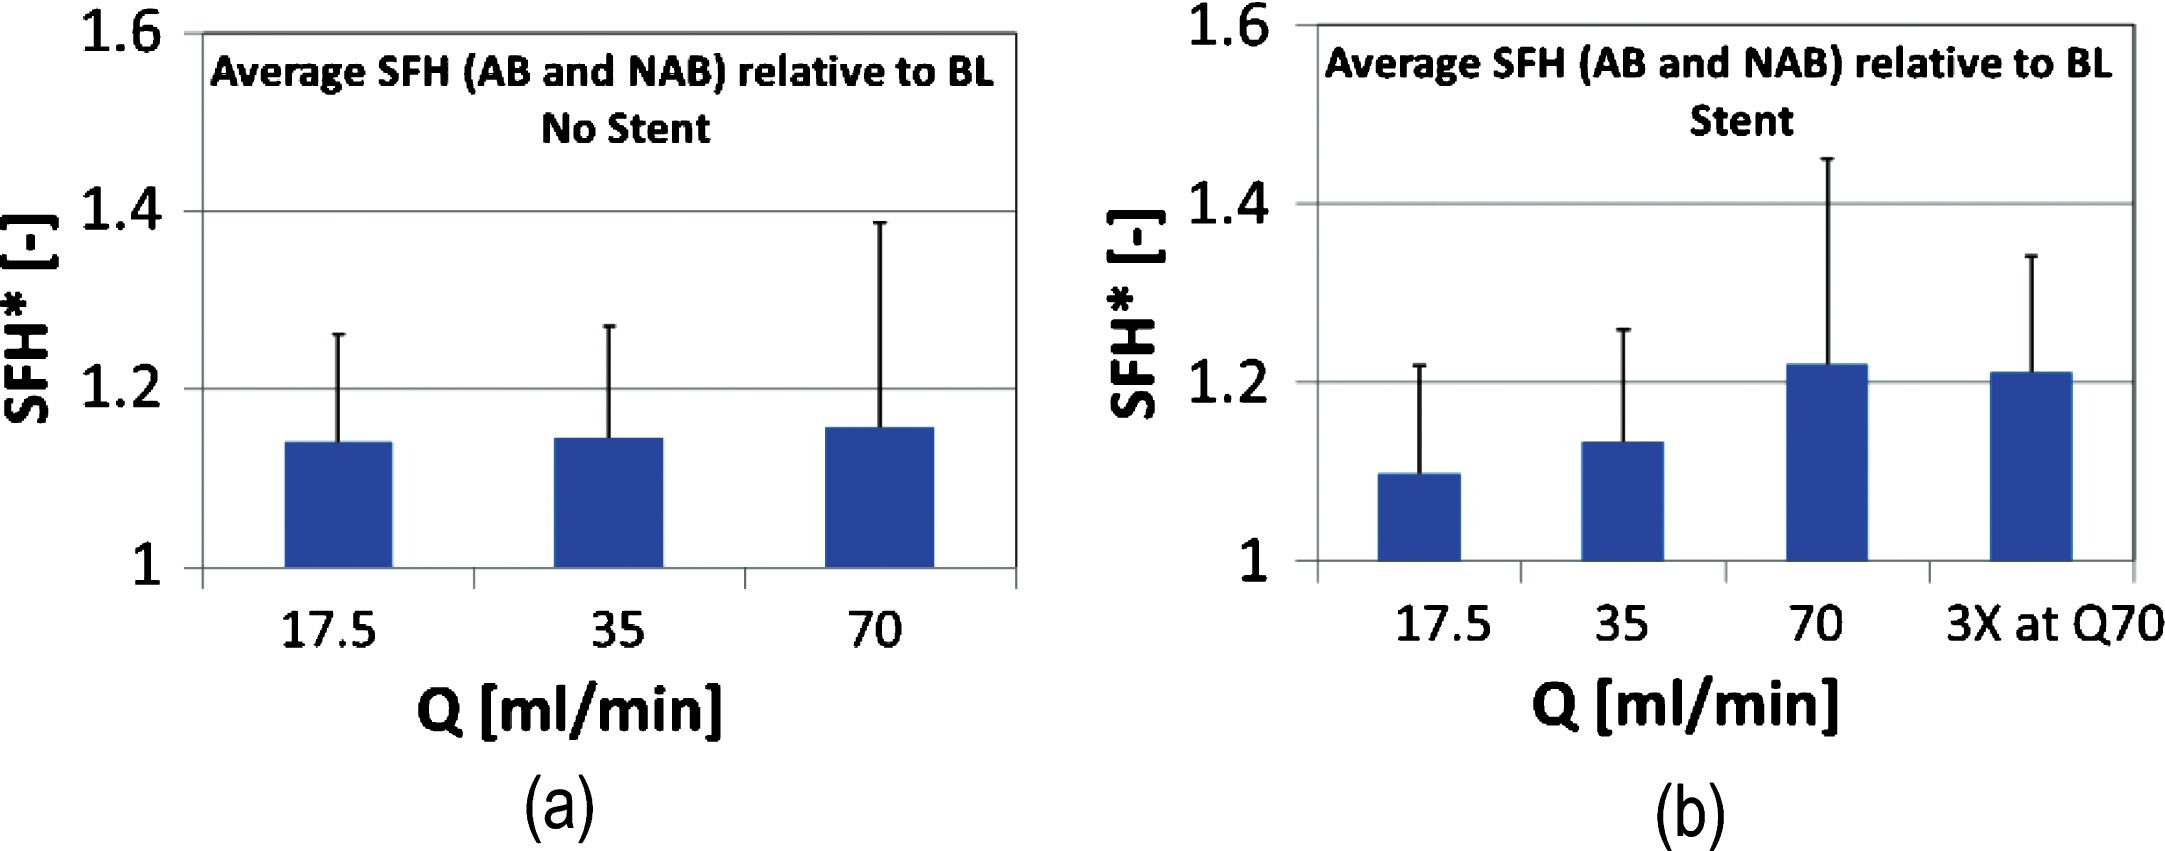
Further to changes in the deformability of the RBCs, any destruction of the cell membrane could not be assessed with the EI index. Therefore, serum free haemoglobin (SFH) was utilised as an indirect estimation of RBC membrane destruction. SFH was assessed collectively for the AB and NAB samples, since at the high shear conditions where membrane damage is expected to occur the difference in the viscous forces developed between the samples is relatively small. No significant trends were observed for the non-stented cases for both AB and NAB samples: Figure 4a shows the average serum free haemoglobin for both AB and NAB samples (n = 12), normalised by the BL case values (denoted as SFH*). A slight trend of increasing SFH is observed in the stented case: it is illustrated in Fig. 4b that an increase of approximately 20% from the baseline value exists in the case of the stented tube, however, this is not significant (p > 0.05 when comparing the Q17.5 with the Q70 and the 3XQ70 conditions). Inspecting the results in Fig. 4, it is apparent that an increase of 10% minimum from the baseline (i.e. at SFH* = 1) exists, in both the stented and non-stented configurations, which may reflect sample handling effects. This increase is more systematic in the non-stented case. The mean value of the SFH* for the two extreme flow conditions in the stented cases (Fig. 4b) exceed 20% above the baseline, that is approximately 10% increase of SFH, excluding possible sample handling issues.
Fig.4
Average (n = 10) serum free haemoglobin for both AB and NAB samples, normalised by the BL case values (SFH*) (the non- stented case is shown in panel (a)). SFH* for the stented case is shown in panel (b).
Visual inspection of the samples confirmed that RBC lysis may have taken place in the extreme flow conditions of the stented case. Figure 5 shows the mean image intensity ratio of the supernatant (plasma or PBS) part, to the sediment (RBCs) part of the sample, calculated from images of the Eppendorf tubes:
Fig.5
Mean normalized image intensity ratio of the supernatant (plasma or PBS), to the sediment (RBCs) part of the sample, calculated from images of the samples in the Eppendorf tubes. I* is shown in Panel (a) as an average for both AB and NAB samples in the non-stented cases. Results for the stented cases is shown in Panel (b).
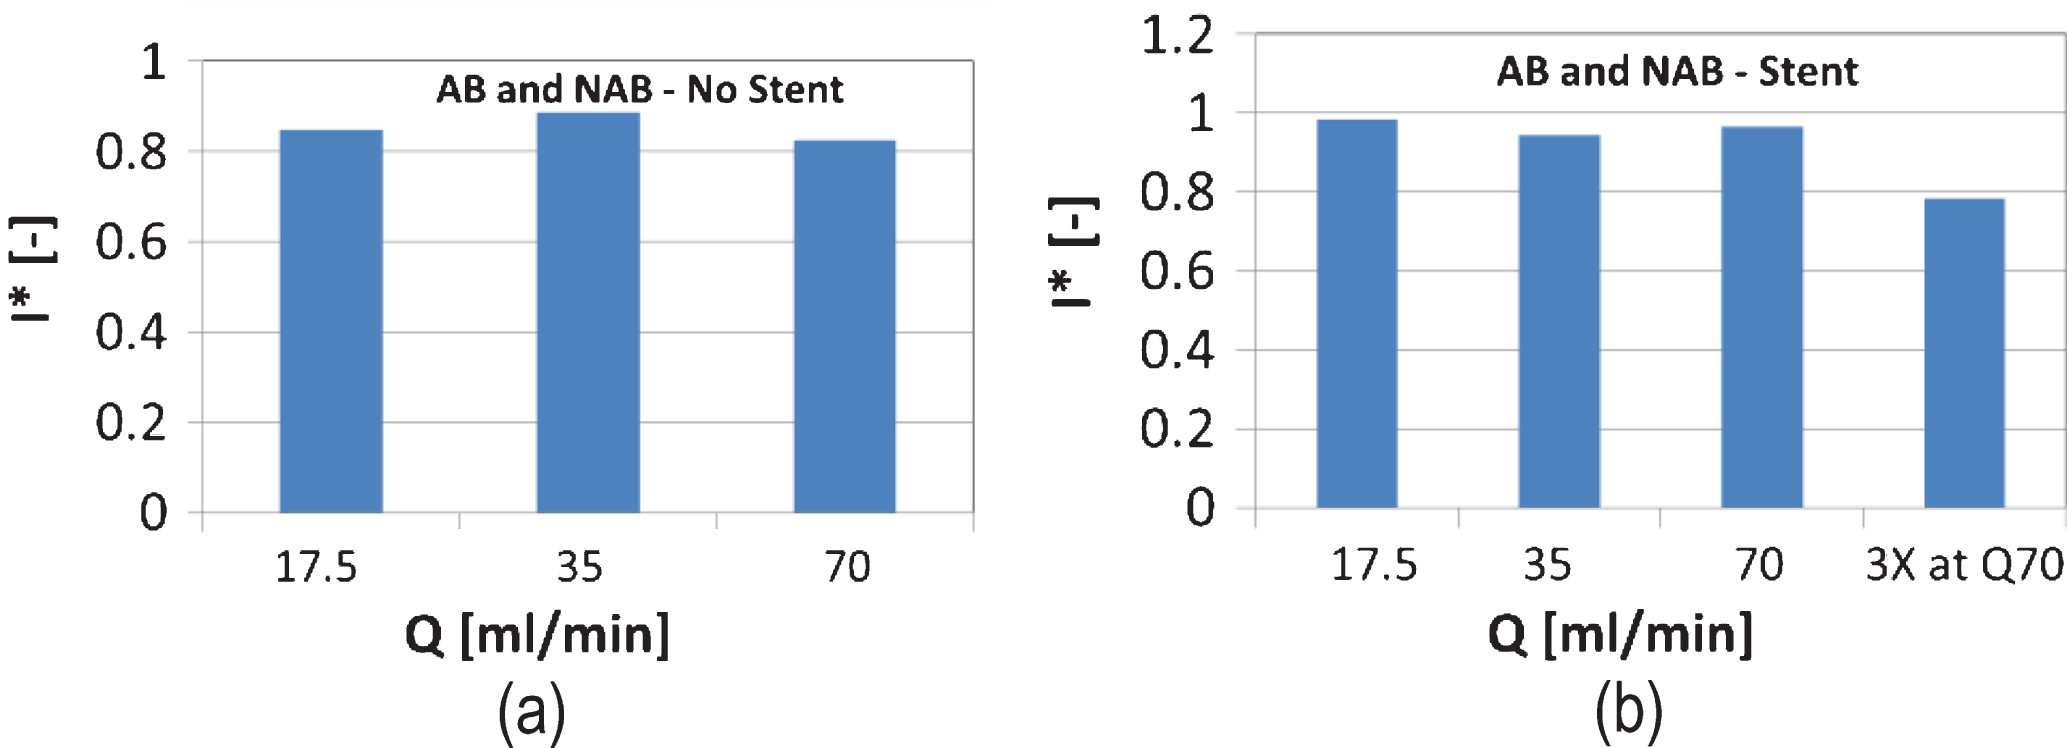
Fig.6
Representative images of RBCs captured by conventional microscopy (Panels (a), (b), (c) and (d)) and SEM (panels (e) and (f)). The images in Panels (a) and (b) have been captured from samples infused in the stented configuration, for the BL and the Q70 conditions respectively. The images in Panels (c) and (d) illustrate the appearance of a population of affected RBCs for the Q35 condition. Panels (e) and (f) show details of affected RBCs.
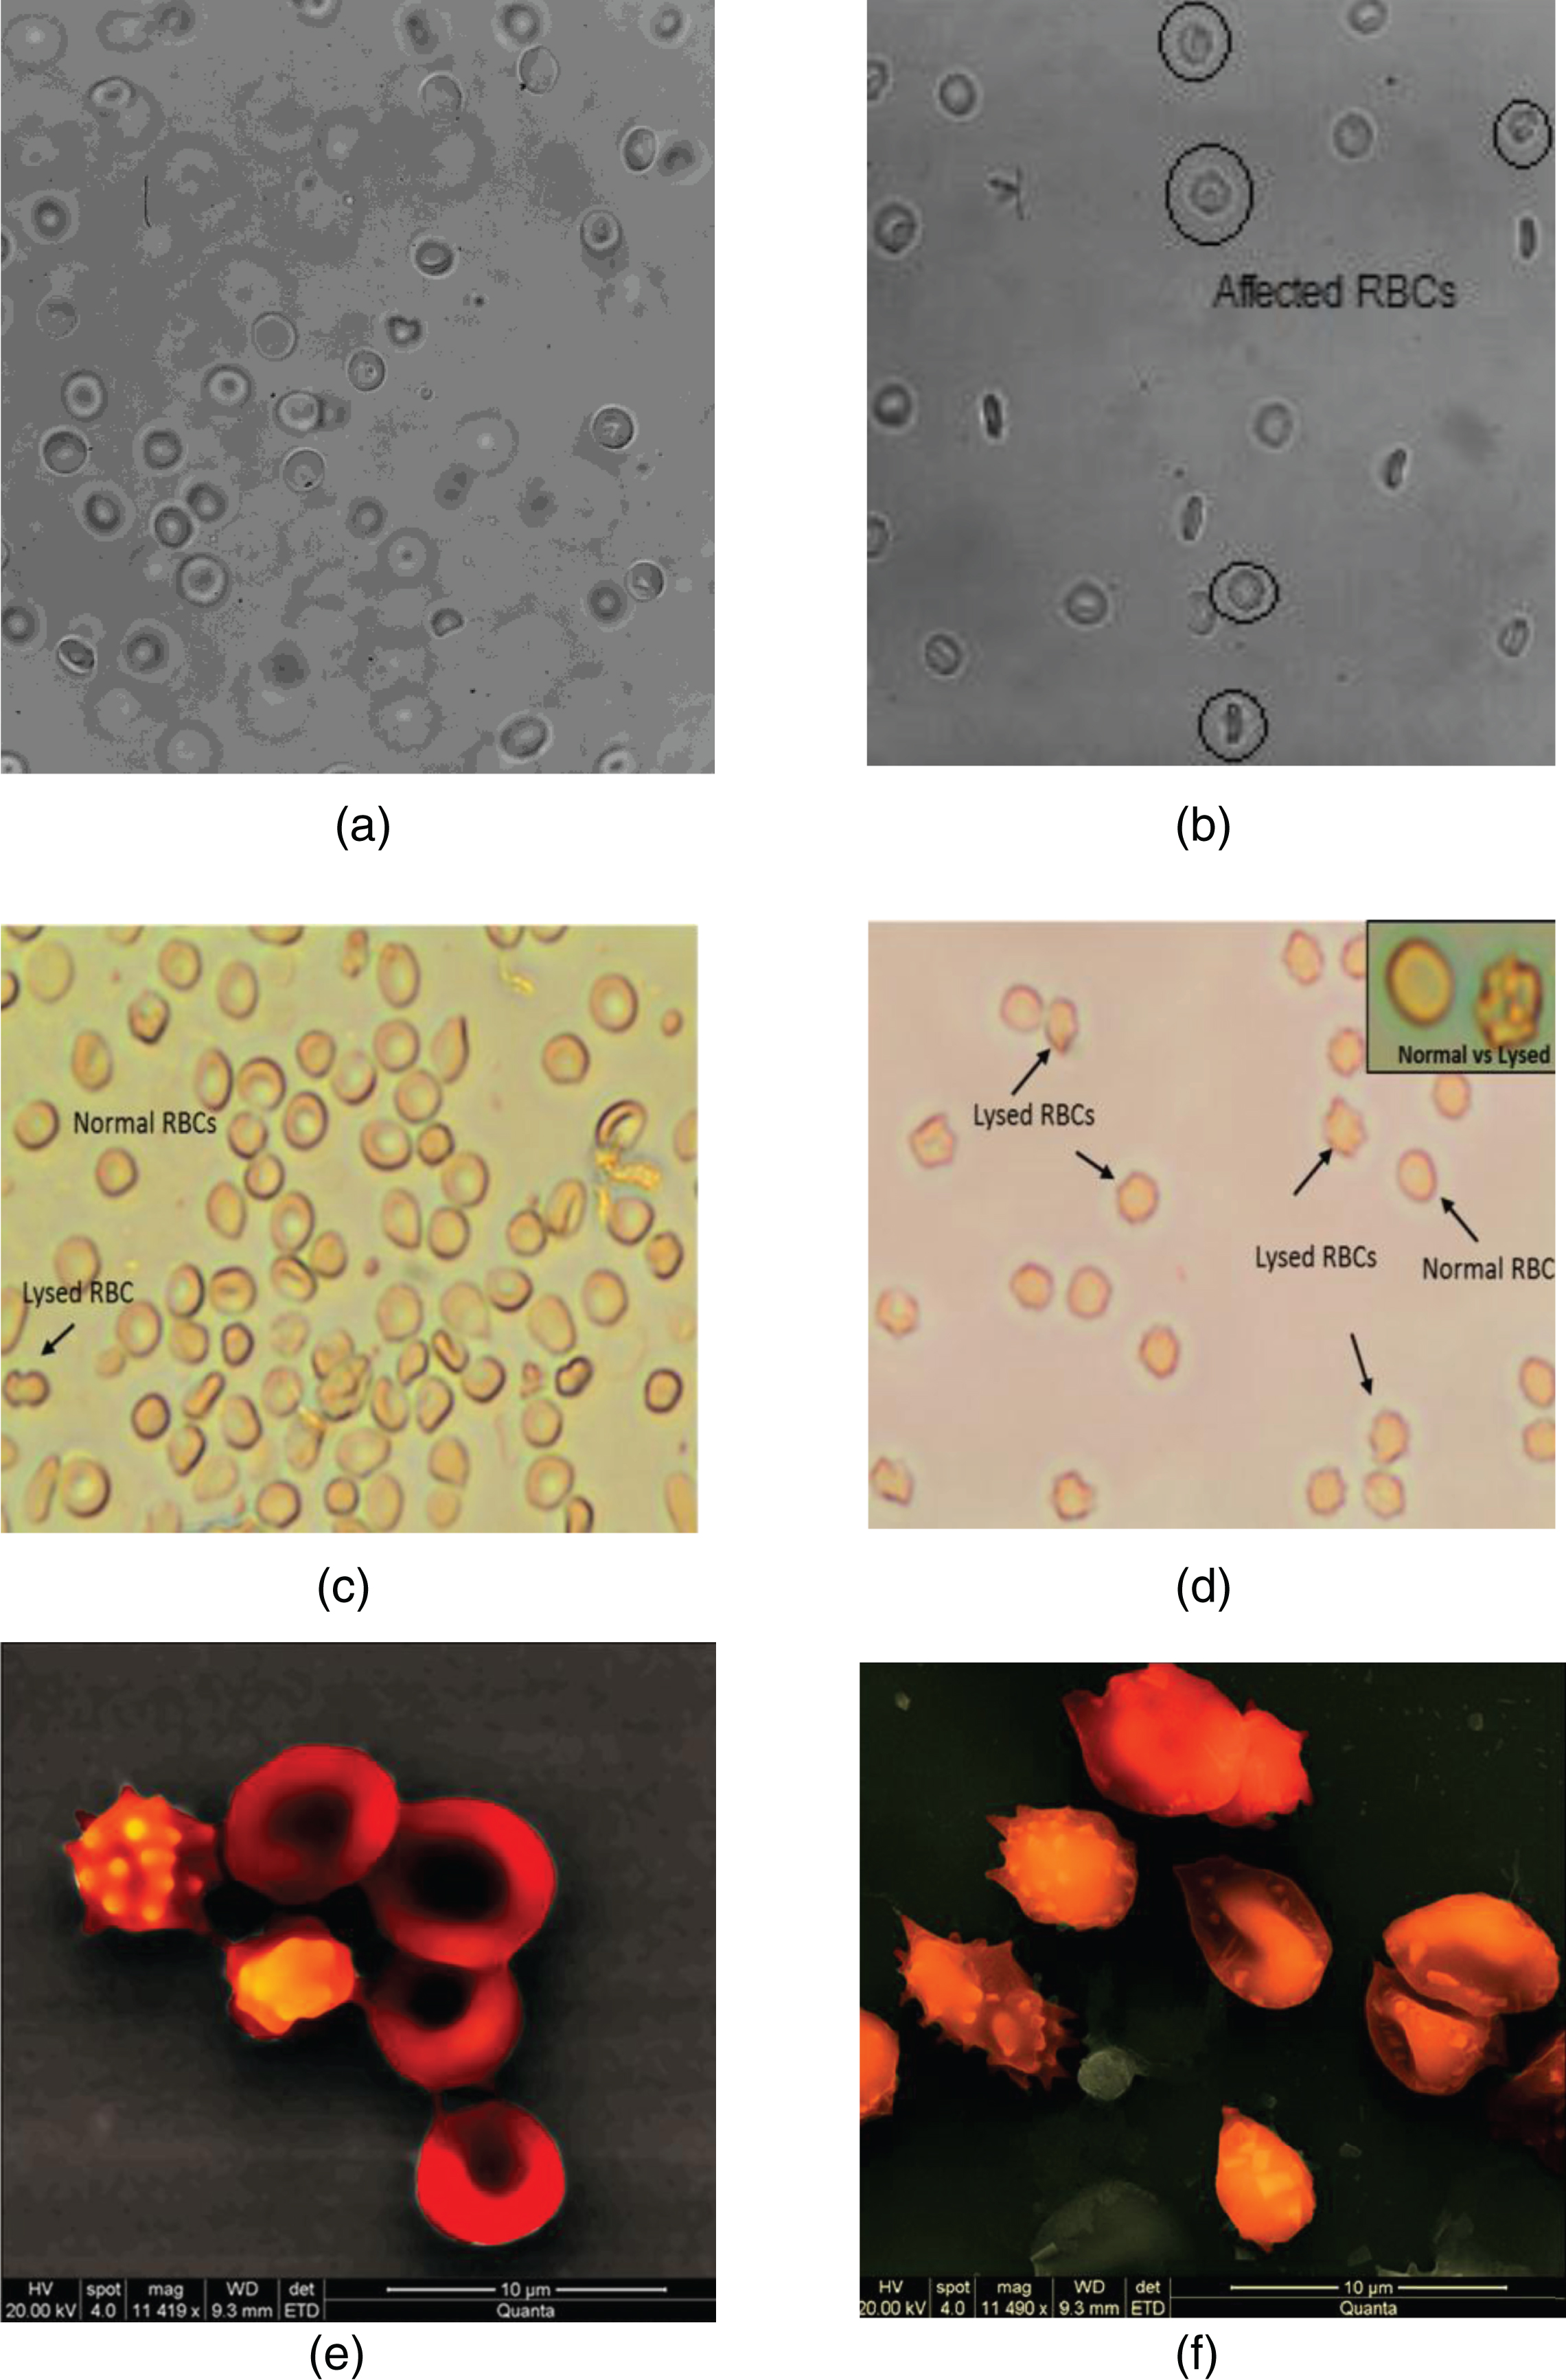
Microscopy and SEM images attest to the abovementioned information on the possibility of loss of RBC membrane integrity. Figure 6 illustrates that, indeed, the integrity of a population of RBCs has been compromised as a result of the stenting in the tube. Echinocytes are present, which may be the result of mechanical damage of the membrane.
3.3RBC aggregation
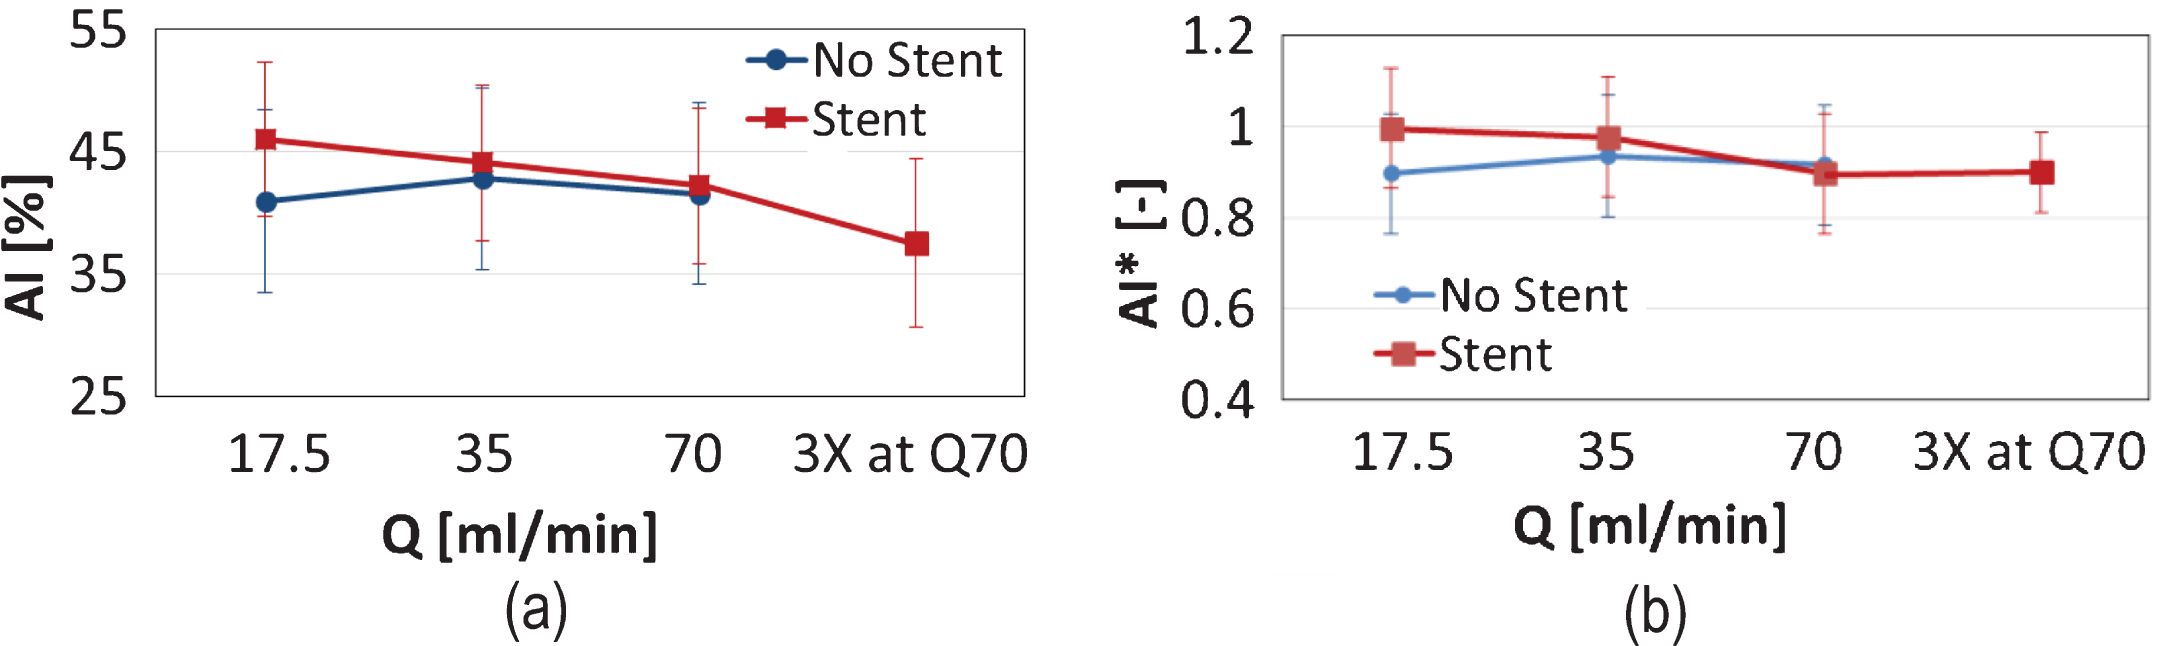
RBC aggregation was assessed for the AB samples only. The aggregation index AI (expressed as percentage) is shown in Fig. 7a for the two tube configurations and the various flow conditions. It is observed that in the non-stented case the AI shows no particular trends. In the stented case, however, an elevated AI is observed in the Q17.5 and the Q35 flow conditions, compared to the non-stented case, and a slight monotonic decreasing trend is apparent. When the AI index is normalised by the BL values (Fig. 7b), an approximately 10% difference between the Q17.5 and the 3XQ70 cases is observed, however, with no statistical significance (p > 0.05). Given that the non-stented configuration is regarded as the control case, Fig. 7b suggests that mild/physiological flow conditions in the stented tube result to an increase in RBC aggregation. The slight drop of AI* from the BL cases observed in the non-stented case (Fig. 7b), may reflect sample handling issues; it is known for example that sample oxygenation (not performed in the BL cases) may decrease RBC aggregation [32, 33].
Fig.7
Mean values of the RBC aggregation index AI, for the AB sample, at the two tube configurations, and all flow conditions (please note that no 3XQ70 exposure was performed for the non-stented case). Panel (a) illustrates the mean value of AI (as percentage) and Panel (b) presents the values of AI normalised by the baseline values.
3.4Viscosity
Sample viscosity results were normalised by their plasma (or PBS medium) viscosities to obtain the dimensionless relative viscosity
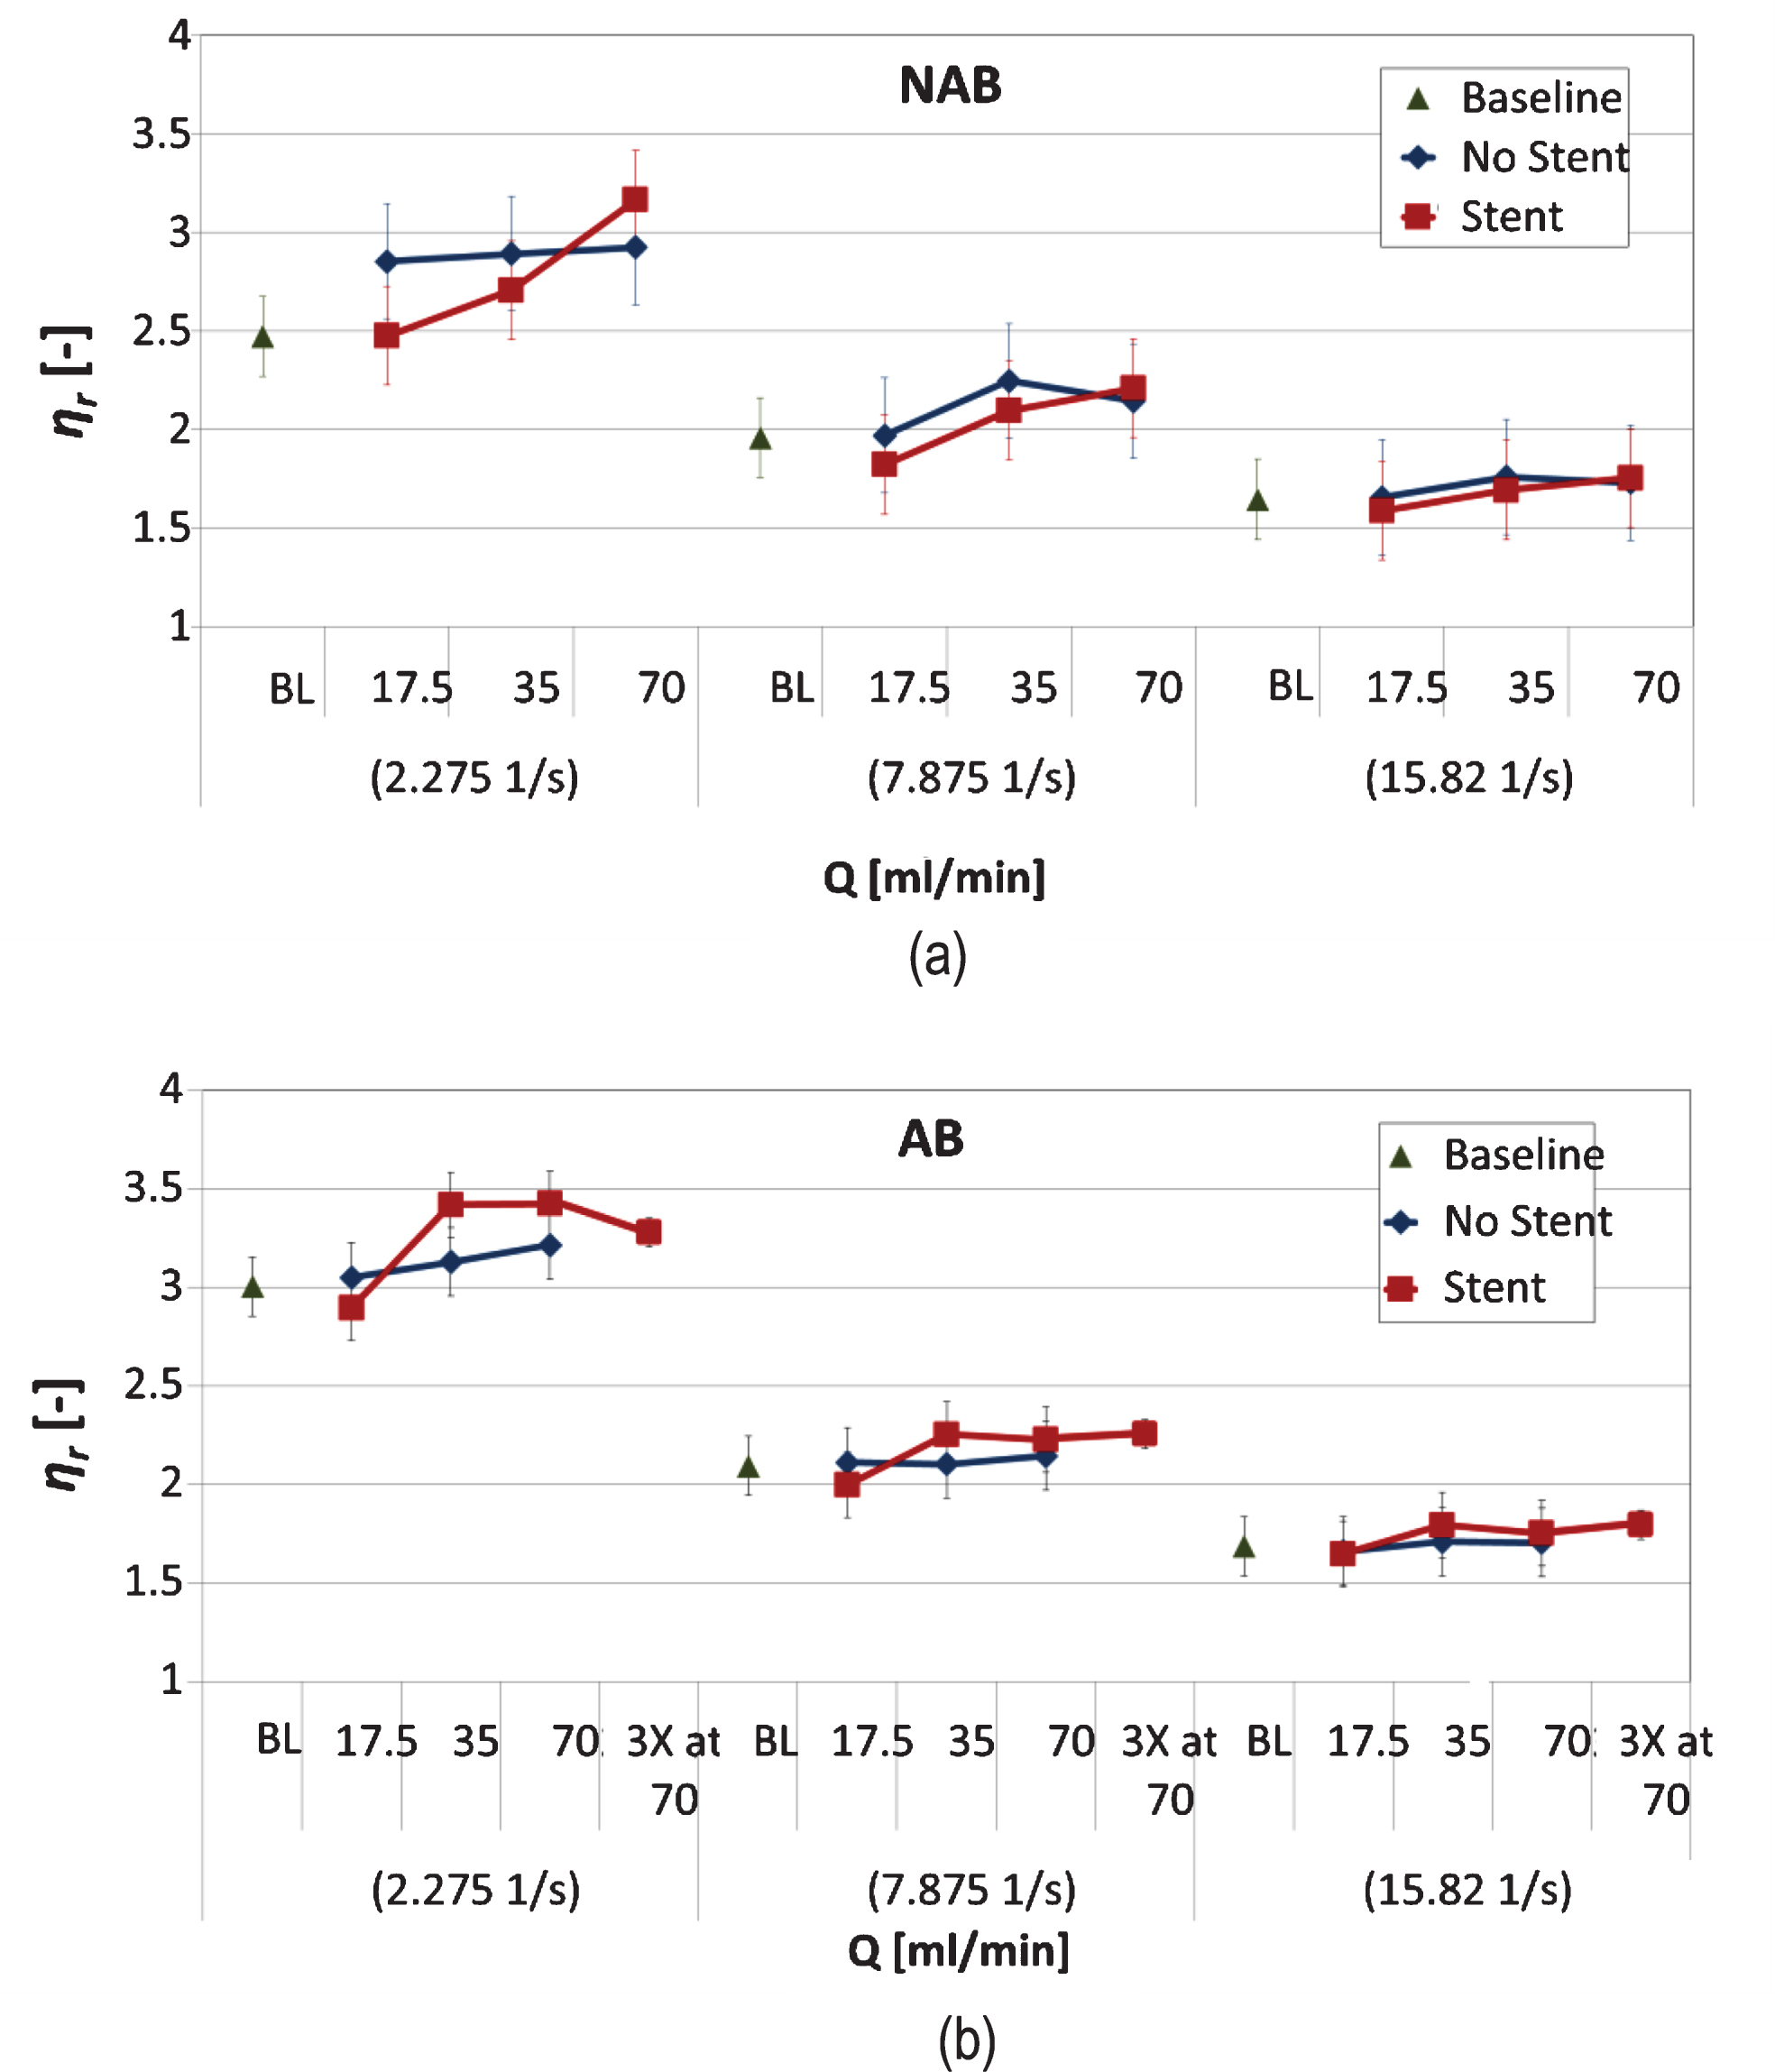
Figure 8 presents the results for ηr calculated for the various cases and flow conditions. Note that the viscosity of the baseline cases is also included for comparison, in order to avoid further normalisation of the ηr data. The first notable observation in both Panels (a) and (b) is that differences in ηr, between the flow conditions (i.e. BL, Q17.5, Q35, Q70 and 3XQ70), are more pronounced as the shear rate decreases. The viscosity of both AB and NAB samples (presented separately for clarity), which have been infused through the non-stented tube, show no significant differences between the flow conditions tested. The effect of stenting on the NAB sample is apparent in (Fig. 8a), where, for the 2.275 s–1 shear rate, a significant difference (p < 0.05) exists between the baseline case (and the Q17.5 condition) and the Q70 flow condition. The behaviour of the relative viscosity ηr for the AB sample in the stented configuration (Fig. 8b) differs from this of the NAB sample, in that ηr increases from BL, reaching a maximum at Q35 and Q70, and decreases considerably in the extreme condition of 3XQ70. The observed increase in ηr for the AB sample in the 2.275 s–1 shear rate is significant between the BL (or the Q17.5 condition) and the Q35, Q70 and 3XQ70 conditions, however, no significance is observed between the last three flow conditions.
Fig.8
Relative viscosity ηr against all flow conditions (BL, Q17.5 Q35, Q70 and 3XQ70), for the two flow configurations (stented and non-stented tubes), presented for three distinct shear rates (2.275, 7.878 and 15.820 s–1). The results for the NAB and AB samples are shown in panels (a) and (b) respectively (presented separately for clarity).
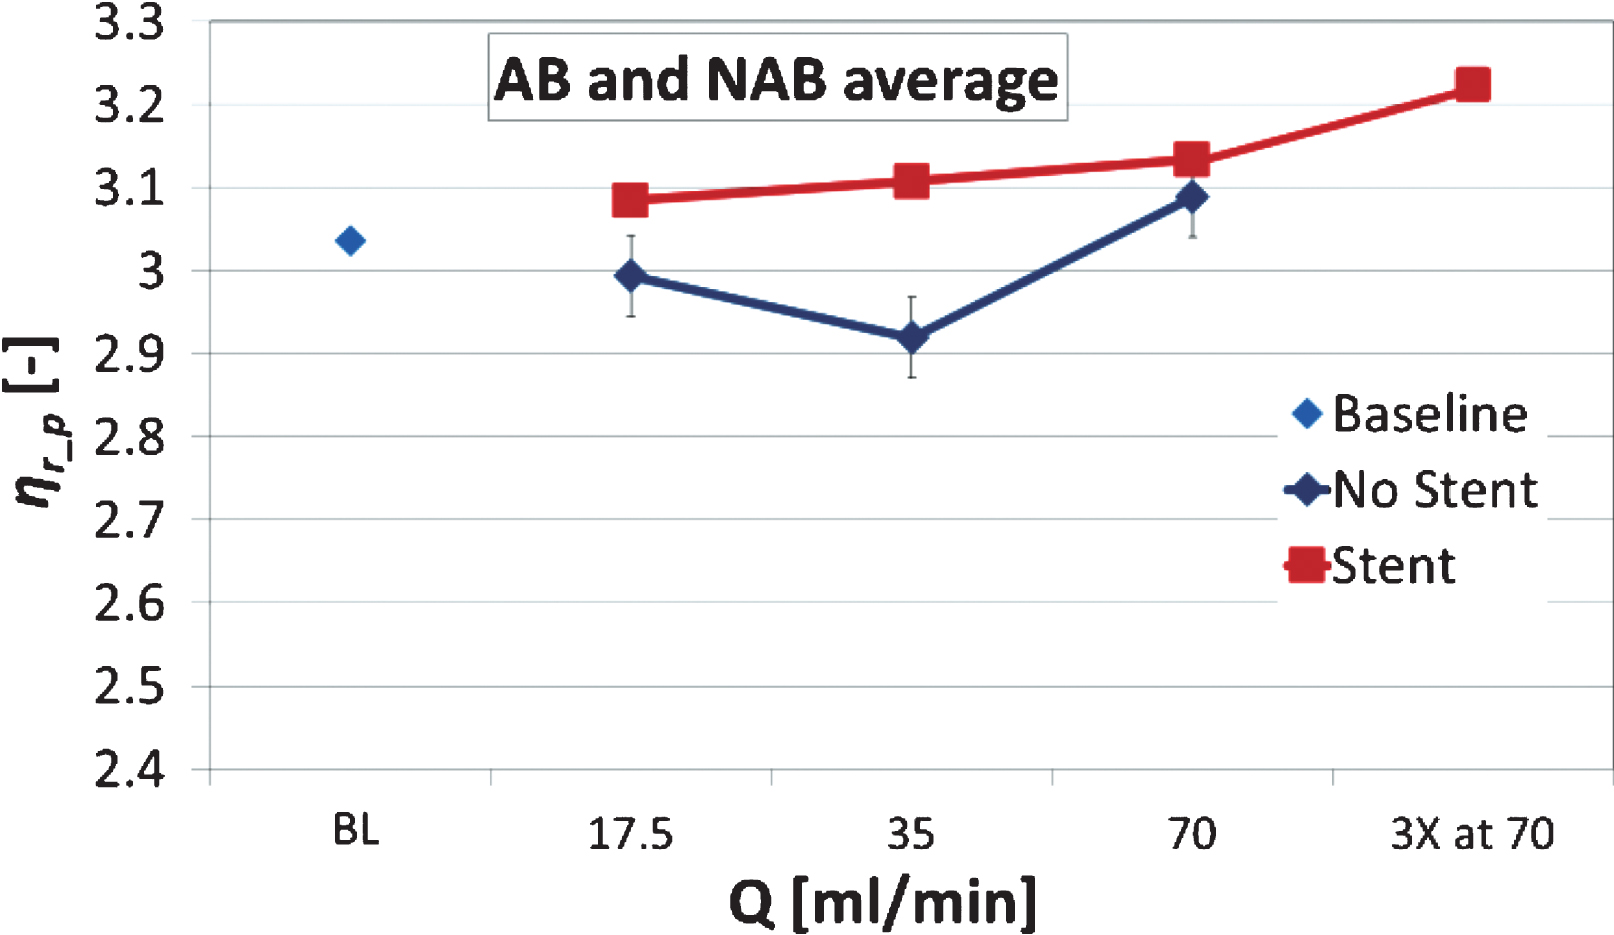
Low viscosity measurements are influenced by the RBC aggregation phenomenon, however, the high shear rate viscosity reflects more the effects of the deformability of the RBCs. The normalised viscosity ηr_p measured at the highest shear rate (251.2 s–1) is compared as an average for both the AB and NAB samples in Fig. 9, plotted with the standard error. An increasing trend is observed for the stented configuration, however, of no statistical significance. This slight increasing trend observed in (Fig. 9) for the stented case persists from the lower shear rates, as it is shown in (Fig. 8a and 8b).
Fig.9
Normalised viscosity ηr_p measured at the highest shear rate (251.2 s–1) as an average for both the AB and NAB samples (n = 16). Standard error bars also included on the data (negligible in the BL and stented cases).
4Discussion
4.1RBC deformability
The results of the study indicate that stenting has an effect on the hemorheological properties and physiology of RBCs. Regarding the deformability of the RBCs, the findings suggest that the EI decreases as the flow rate increases (from Q17.5 to Q70), and when the sample is further exposed to the extreme condition (3XQ70). This is observed in both the aggregating (AB) and the non-aggregating blood (NAB) samples, when infused in the stented tube (Fig. 3). The decrease in EI is observed to be approximately 8% for both AB and NAB samples, and statistical significance exists between the extreme conditions (BL, or Q17.5, to Q70/3XQ70). The observed trend of decreasing deformability lies outside the 4% combined uncertainty level introduced due to the methodological issues discussed earlier. Variation in deformability exists within each examined RBC population as well [34], as indicated by the standard deviation of the data extracted from a single sample in (Fig. 2b). This intra-sample variation in EI is quantified for the baseline case by calculating the pooled STD deviation (STDp) and found to be at approximately 8% of the mean
The dependency of the RBC deformability on the increasing flow rate (Q17.5 to Q70) and flow rate exposure (3XQ70), is due to the increasing shear stresses (SS) developed in the flow configuration. The relationships between RBC deformability, SS and SS exposure are well established in the literature, as discussed earlier. Regarding the shear stress developed in the tube the maximum magnitude occurs at the walls (WSS) and for the Newtonian case can be calculated as:
(1)
It should be noted that the WSS is found to be significantly elevated from the Newtonian values when calculated for the non-Newtonian case, utilising a power-law model [36] with a consistency index k = 0.16 Pa sn and an exponent of n = 0.7:
(2)
Furthermore, the local geometrical characteristics of the stented area are expected to influence the local flow in a more complex manner, and computational approaches are definitely more appropriate for investigating the problem [3]. In computational fluid dynamics studies, using non-Newtonian models for viscosity, it has been shown that the highest WSS develops in the regions between the struts of the stent. Importantly, in the stented-tube flow simulated in [3] the WSS was found to be locally increased multiple times, when compared to the un-stented Newtonian calculation for WSS (using Equation (1), for the specific diameter, viscosity and flow rate of the case in [3]). Nevertheless, the Newtonian assumption in the present study could also hold, as the nominal shear rate in the tube, calculated by the ratio of the mean velocity to the tube diameter
The WSS values estimated for the stented case (Newtonian or non-Newtonian) are indeed elevated, however, it is the synergistic effect of the SS magnitude and duration that affects the deformability of the RBCs. In the Simmonds and Meiselman study [20] it was shown that stresses in the order of 32 Pa could have a statistically significant impact on the deformability of the RBCs for a stress exposure of 32 seconds. In the same study an exposure of 4 seconds to 64 Pa resulted in a statistically significant change in RBC deformability. In the aforementioned and in subsequent studies the SS/SS exposure dependency of the mechanical sensitivity of the RBC was established in detail, covering SS magnitudes up to 60 Pa and time periods of exposure up to 60 seconds [20, 22]. In the present study the duration of the flow in each flow condition were 3.43, 1.71, 0.86 and 2.57 seconds for the Q17.5, Q35, Q70 and 3XQ70 conditions respectively. At the wall region the velocity of the fluid decreases significantly, and assuming that no significant cell depleted layers develop at the walls (a phenomenon generally seen in microscale flows [37, 38]), it is expected that a portion of the RBCs would be exposed to high SS for a portion of the total flow time. The reduction in EI seen in the present work (Fig. 3) could be justified by the significantly elevated SS in conjunction to the RBC residual times in the stented area. The RBC residual times are expected to be small, as the length of the stent is also relatively small at approximately 3.3 mm. In the extreme flow condition of 3XQ70 the residual time for a fluid element at a radius of ∼0.99rmax is approximately a tenth of a second. The actual RBC residual times, however, could be larger than the gross estimate, provided the assumptions of a straight tube and Newtonian flow are used. Nevertheless, in [20] it was shown by extrapolation that sub-second time exposures to SS in the vicinity of 80 Pa, would suffice to impair RBC deformability to a “subhaemolytic damage point”. It is therefore reasonable to assume that the stent presence is responsible for the traceable, albeit small, impairment of RBC deformability observed in the study.
Another interesting observation regarding the deformability of the RBC is the improvement in EI (although not statistically significant) seen in Figure 3b (AB sample), for the Q17.5, compared to the BL condition. A similar increase in EI, however for all Q conditions, is observed for the not stented case in the same figure. Improved deformability as a result of low SS exposure has also been reported in the literature [20, 22, 39]; it has been shown that, low SS in the order of 1 Pa applied for small time periods (1 s) could have a positive, influence in the deformability of the RBC. For the low flow rate condition of Q17.5 in the stented configuration of the present work, the residual times for the RBCs flowing in regions of low SS, seem to suffice for an improvement in EI to be traced. Improvement in EI is not observed for the NAB sample in (Fig. 3a); this might be due to the difference in the local stresses developed in the tubes, as the PBS medium is of lower viscosity than the plasma in the AB samples and there is no aggregation between the RBCs.
4.2Membrane damage
The exposure of RBCs in high supraphysiological SS magnitudes for relatively short time periods could result in permanent membrane damage and destruction. It has been shown that RBC lysis occurs when cells are exposed to SS levels of >450 Pa, even for sub-second periods of ∼0.6 s [40]. The presence of the stent in the tube and the non-Newtonian nature of the blood could have, as a result, the substantial increase of the local SS, and indeed (Figs. 4 and 5) provide evidence of RBC lysis in the extreme flow conditions (Q70 and 3XQ70). As mentioned earlier, when a power law viscosity model is used for the calculations of stresses in the reduced section of the tube due to stenting, magnitudes in the vicinity of 600 Pa result for the WSSn–N in the Q70 condition. This high WSS value is indeed extreme, however, it is calculated for the smooth/straight wall condition. Nonetheless, local effects of the stent presence in the flow could result in similar magnitudes, although not possible to be estimated in the current work. The susceptibility of the RBC to destructive damage is found to also depend on the stress exposure history, as it has been shown in recent studies [21]; preconditioning of RBCs to repeated cycles of stress (64 Pa×3 s, or 88 Pa×2 s) result in either an impairment of deformability (and increased sensitivity to mechanical damage), or in an improvement of deformability. Impaired deformability is seen for a small number of stress cycles (1–4), whereas improved deformability and resistance to mechanical damage is seen after a larger number of cycles. The mesh pattern of the stent used in the present study (Fig. 1a) suggests that cells could be subjected to repeated stresses while encountering the protruding struts in the flow, however, the time period of exposure is expected to be very small.
The images of RBCs in (Fig. 6), acquired after exposure in the stented configuration, provide evidence that the membrane integrity of a population of RBCs has been affected by the flow in the stented tube. The population of affected RBCs in the image of (Fig. 6a) (BL condition) is almost untraceable by visual inspection, whereas in the image of (Fig. 6b) (Q70 condition) the shape of 4-5 RBCs (within a population of ∼20) appear to be in a nearly acanthocyte state. The RBC lysis of ∼10%, suggested by analysing the results presented in (Figs. 4 and 5), seems indeed abnormally high. Nevertheless, other studies have shown that increases of plasma free haemoglobin of approximately 0.5% are expected for SS exposures of 64 Pa×3 s, or 88 Pa×2 s [21], and ∼4% when RBCs are subjected to much higher SS (450 Pa×1.238 s). Given, that the stenting configuration used in the current work does indeed represent an extreme case (the whole stent is exposed to the flow, with no expansion), and according to the calculations for the developed WSSn–N discussed earlier, it might be reasonable to expect large magnitudes of SS to develop in the region, and therefore increased membrane destruction and elevated SFH levels.
4.3RBC aggregation
The affected RBC deformability is expected to influence the RBC aggregation phenomenon to a certain degree, as reduced deformability of RBCs results in reduced RBC aggregation [41, 42]. This is indicated in the results of (Fig. 7), where a slight decreasing trend in AI is observed as the flow rate and exposure increase. The decreasing AI trend follows that of the EI in (Fig. 3). There is not enough evidence in the literature to suggest alteration of the physicochemical characteristics of the RBC membrane (for example alteration of the sialic acid content of the membrane), due to the flow through the flow/stress exposure in stented vessel, and therefore alteration in the aggregability of the cells. Therefore, it is assumed that the aggregability of the RBCs is not significantly affected by the exposure to the various flow conditions in the present study. Nonetheless, in the absence of other external influences, it can be suggested that the trends observed in EI and AI are qualitatively related.
4.4AB and NAB viscosity
Figure 8 presents the results from the viscosity measurements. RBC deformability and aggregation affect the viscosity of blood in a predictable manner [43], and this is reflected in (Fig. 8a) where statistically significant differences are observed between the baseline and the Q70 condition for the NAB sample, in the 2.275 s–1 case. In the absence of aggregation, the major factor to cause the observed increase should be the reduced RBC deformability seen in (Fig. 3). The results in (Fig. 8b) also indicate an increase in viscosity for the AB sample, between the BL and the higher flow rates (at 2.275 s–1), however, this increase is not monotonic, that is, the viscosity is decreased in the 3XQ70 compared to the Q35 and Q70 conditions. The reduced deformability of the RBCs may play a role in the increase of viscosity in the AB sample, however, it is expected that RBC aggregation would dominate the behaviour of viscosity at the lower shear rates. Indeed, the decrease in viscosity observed in the aforementioned case, could be linked to the behaviour of RBC aggregation illustrated in (Fig. 7). The reduced RBC aggregation seen in the higher flow rates and exposure (Q70 and 3XQ70) seems to be the cause of the observed decrease of viscosity in the 3XQ70 case of (Fig. 8). The influence of the affected RBC deformability can also be seen in (Fig. 9), which shows the high shear viscosity for all conditions tested and for both AB and NAB samples as an average. In this condition, RBC aggregation effects are negligible and the dominant factor influencing the viscosity of the samples is the deformability of the cells. A slight monotonic increasing trend is apparent for the stented case, although statistically not significant, indicating that indeed the decreased deformability might affect the viscosity of the samples negatively.
4.5Consequences in circulatory physiology
The interpretation of the results in the present study, regarding the physiological consequences of altered hemorheology due to stenting in the circulation, should be made in view of the situation replicated in the in vitro configuration of the present work. That is, the stent is inserted in the rigid tube with no expansion (or over-expansion), and being fully exposed to the upcoming flow. Although stent overexpansion is not recommended in the clinical practice in order to avoid vessel damage [44], the suggested optimal stent expansion should match the healthy artery diameter (i.e. stent/vessel diameter ratio of ∼1 : 1), hence avoiding the development of low WSS in the area [15]. In the present work, the positioning of the stent in the tube resulted in a stent-to-tube ratio of ∼0.8 : 1, implying stent under-expansion, which is possible to occur in the clinical practice [45]. The flow rates set in the present work agree with those developed in the cortical branches of the anterior cerebral artery, which have a diameter of 0.8–1.8 mm and flow rates around 30–50 ml/min [46, 47]. Flow rates of approximately 40 ml/min are observed in the left anterior descending coronary artery, with usual internal diameter of ∼3 mm, which in the diseased state can be significantly reduced [48]. Furthermore, the experimental setting is relevant to the clinical scenario of Drug Eluting Stenting, where re-endothelialization is delayed and stent struts are exposed to blood flow for a longer periods of time [49, 50].
The examination of the data in the present study indicates that samples exposed to conditions of Q35 and Q17.5 have not been affected significantly in terms of RBC deformability, lysis and aggregation, whereas a moderate increase in the viscosity is apparent (Figs. 8 and 9). The increased flow rate of Q70 seems to have an influence on RBC physiology (EI, SFH, aggregation), and the further exposure to this condition (3XQ70) exaggerates this effect. The Q70 condition is set to account for double the resting heart flow rate (Q35) in vessels with geometries similar to that used in the present study, whereas the triple exposure to this condition may reflect the situation where such a high flow rate is maintained for long time periods. Given that patients treated with cardiovascular stenting may lie within groups with increased levels of inflammation [51, 52], RBC aggregation [53, 54] and viscosity [55], it could be suggested with caution that increased flow rates may attenuate RBC aggregation and viscosity for the short term, however, on the expense of RBC deformability. In previous studies [23, 25] on the effects of coronary and carotid stenting, a decrease in blood, plasma viscosity and aggregation was observed immediately after stenting, however, this reduction was accompanied by decreased levels of the protein fibrinogen, which affects both viscosity and aggregation. In vivo effects of cardiovascular stenting on the deformability of the RBCs have not been reported in the literature, and therefore no suggestions can be made on this issue. Finally, it has been previously demonstrated that the RBCs have active nitric oxide (NO) synthesizing mechanisms, which may play important role in maintaining normal RBC mechanical properties. Our findings suggest that high shear rates might lead to changes in intracellular NO concentration and thus an increased release of NO which could influence erythrocyte and platelet behavior [33, 56, 57].
5Conclusions
The present study examined the effects of stenting on the rheology of blood, as determined by the RBC mechanical characteristics. Aggregating and non-aggregating samples were subjected to various flow rates within the physiological range, in a stented tube configuration, and a non-stented configuration was used as a control case. It was found that the increased flow rates, and further exposure to these flow rates, had an effect on the rheological properties of blood (reduced RBC deformability, reduced aggregation, increased viscosity). In some instances the alteration of the rheological properties of blood was found to be statistically significant. The physiological consequences in the circulation, as a result of the altered hemorheological properties of blood due to stenting, cannot be easily deduced from the present study. It is clear that further work needs to be performed in order to more accurately simulate the circulation characteristics, i.e. cyclic exposure to flow through the stented tube, with periods of rest to milder stress exposure, etc. Furthermore, effects of other hemorheological parameters, such as the presence of leukocytes and relevant proteins, platelet activation or medication, could also be examined to shed more light on the effects of vessel stenting on blood rheology.
Acknowledgments
The authors would like to thank Dr. Michael Simmonds for the helpful discussions and suggestions on part of the results of the study. The study has been partly supported with funding from the internal Start-Up Grants of the Cyprus University of Technology.
References
[1] | Grimm J , Brunn H , Mueller-Huelsbeck S . Hemolytic effect of deformed intra-arterial stents and stent grafts in vitro. Eur Radiol. (2003) ;13: (6):1333–8. |
[2] | Kapnisis KK , Pitsillides CM , Prokopi MS , Lapathitis G , Karaiskos C , Eleftheriou PC , et al. In vivo monitoring of the inflammatory response in a stented mouse aorta model. J Biomed Mater Res - Part A. (2016) ;104: (1):227–38. 10.1002/jbm.a.35560 |
[3] | Benard N , Perrault R , Coisne D . Computational approach to estimating the effects of blood properties on changes in intra-stent flow. Ann Biomed Eng. (2006) ; 10.1007/s10439-006-9123-7 |
[4] | Rogers C , Edelman ER . Endovascular stent design dictates experimental restenosis and thrombosis. Circulation. (1995) ;91: (12):2995–3001. 10.1161/01.CIR.91.12.2995 |
[5] | McLean DR , Eiger NL . Stent design: implications for restenosis. Rev Cardiovasc Med. (2002) ;3: (Suppl 5):S16–22. |
[6] | N RL, H CG, W SJ. Clinical impact of stent design. Interv Cardiol Rev. (2014) ;9: (2):89–93. |
[7] | Kouvelos GN , Patelis N , Antoniou GA , Lazaris A , Matsagkas MI . Meta-analysis of the effect of stent design on 30-day outcome after carotid artery stenting. J Endovasc Ther. (2015) ;22: (5):789–97. 10.1177/1526602815598753 |
[8] | Anadol R , Gori T . The mechanisms of late scaffold thrombosis. Jünger M, Krüger-Genge A, Jung F, editors. Clin Hemorheol Microcirc. (2017) ;67: (3-4):343–6. 10.3233/CH-179214 |
[9] | Sinn S , Scheuermann T , Deichelbohrer S , Ziemer G , Wendel HP . A novel in vitro model for preclinical testing of the hemocompatibility of intravascular stents according to ISO 10993-4. J Mater Sci Mater Med. (2011) ;22: (6):1521–8. 10.1007/s10856-011-4335-2. |
[10] | Kealey CP , Whelan SA , Chun YJ , Soojung CH , Tulloch AW , Mohanchandra KP , et al. In vitro hemocompatibility of thin film nitinol in stenotic flow conditions. Biomaterials. (2010) ;31: (34):8864–71. 10.1016/j.biomaterials.2010.08.014 |
[11] | van Oeveren W . Obstacles in Haemocompatibility Testing. Scientifica (Cairo). (2013) ;2013: :1–14. 10.1155/2013/392584 |
[12] | Jung F , Braune S . Thrombogenicity and hemocompatibility of biomaterials. Biointerphases. (2016) ;11: (2):029601. 10.1116/1.4938557 |
[13] | Morris PD , Narracott A , von Tengg-Kobligk H , Silva Soto DA , Hsiao S , Lungu A , et al. Computational fluid dynamics modelling in cardiovascular medicine. Heart. (2015) . 10.1136/heartjnl-2015-308044 |
[14] | Berry JL , Santamarina A , Moore JE , Roychowdhury S , Routh WD . Experimental and computational flow evaluation of coronary stents. Ann Biomed Eng. (2000) ;28: (4):386–98. 10.1114/1.276 |
[15] | Gundert TJ , Dholakia RJ , McMahon D , LaDisa JF . Computational Fluid Dynamics Evaluation of Equivalency in Hemodynamic Alterations Between Driver, Integrity, and Similar Stents Implanted Into an Idealized Coronary Artery. J Med Device. (2013) ;7: (1):011004. 10.1115/1.4023413 |
[16] | Morlacchi S , Migliavacca F . Modeling stented coronary arteries: Where we are, where to go. Vol. 41: , Annals of Biomedical Engineering. (2013) . p. 1428–44. 10.1007/s10439-012-0681-6 |
[17] | Altinbas A , Algra A , Brown MM , Featherstone RL , Kappelle LJ , de Borst GJ , et al. Effects of carotid endarterectomy or stenting on hemodynamic complications in the International Carotid Stenting Study: A randomized comparison. Int J Stroke. (2014) ;9: (3):284–90. 10.1111/ijs.12089 |
[18] | Baskurt OK , Meiselman HJ . Red blood cell mechanical stability test. Clin Hemorheol Microcirc. (2013) ;55: (1):55–62. 10.3233/CH-131689 |
[19] | Simmonds MJ , Atac N , Baskurt OK , Meiselman HJ , Yalcin O . Erythrocyte deformability responses to intermittent and continuous subhemolytic shear stress. In: Biorheology. (2014) . 10.3233/BIR-140665 |
[20] | Simmonds MJ , Meiselman HJ . Prediction of the level and duration of shear stress exposure that induces subhemolytic damage to erythrocytes. Biorheology. (2016) ; 10.3233/BIR-16120 |
[21] | McNamee AP , Tansley GD , Sabapathy S , Simmonds MJ . Biphasic impairment of erythrocyte deformability in response to repeated, short duration exposures of supraphysiological, subhaemolytic shear stress. Biorheology. (2016) ; 10.3233/BIR-15108 |
[22] | McNamee AP , Horobin JT , Tansley GD , Simmonds MJ . Oxidative Stress Increases Erythrocyte Sensitivity to Shear-Mediated Damage. Artif Organs. (2018) ; 10.1111/aor.12997 |
[23] | Késmárky G , Tóth K , Vajda G , Habon L , Halmosi R , Róth E . Hemorheological and oxygen free radical associated alterations during and after percutaneous transluminal coronary angioplasty. Clin Hemorheol Microcirc. (2001) . |
[24] | LaDisa JF , Olson LE , Guler I , Hettrick D a , Audi SH , Kersten JR , et al. Stent design properties and deployment ratio influence indexes of wall shear stress: a three-dimensional computational fluid dynamics investigation within a normal artery. J Appl Physiol. (2004) ; 10.1152/japplphysiol.01329.2003 |
[25] | Szapary L , Bagoly E , Kover F , Feher G , Pozsgai E , Koltai K , et al. The effect of carotid stenting on rheological parameters, free radical production and platelet aggregation. Clin Hemorheol Microcirc. (2009) ;43: (3):209–17. 10.3233/CH-2009-1210 |
[26] | Chesebro JH , Lam JYT , Badimon L , Fuster V . Restenosis after arterial angioplasty: A hemorrheologic response to injury. Am J Cardiol. (1987) ;60: (3):10–6. 10.1016/0002-9149(87)90477-2 |
[27] | Baskurt OK , Uyuklu M , Ulker P , Cengiz M , Nemeth N , Alexy T , et al. Comparison of three instruments for measuring red blood cell aggregation. Clin Hemorheol Microcirc. (2009) ;43: (4):283–98. 10.3233/CH-2009-1240 |
[28] | Dobbe JGG , Hardeman MR , Streekstra GJ , Strackee J , Ince C , Grimbergen CA . Analyzing red blood cell-deformability distributions. Blood Cells, Mol Dis. (2002) ; 10.1006/bcmd.2002.0528 |
[29] | Kaliviotis E , Yianneskis M . Fast response characteristics of red blood cell aggregation. Biorheology. (2008) ;45: (6):639–49. 10.3233/BIR-2008-0514 |
[30] | Fischer TM . A method to prepare isotonic dextran-salt solutions. Cytom Part A. (2010) ;77A: (8):805–10. 10.1002/cyto.a.20909 |
[31] | Singh M , Stoltz JF . Influence of temperature variation from 5 degrees C to 37 degrees C on aggregation and deformability of erythrocytes. Clin Hemorheol Microcirc. (2002) . |
[32] | Cicha I , Suzuki Y , Tateishi N , Maeda N . Changes of RBC aggregation in oxygenation-deoxygenation: pH dependency and cell morphology. Am J Physiol Heart Circ Physiol. (2003) ; 10.1152/ajpheart.01030.2002 |
[33] | Uyuklu M , Meiselman HJ , Baskurt OK . Role of hemoglobin oxygenation in the modulation of red blood cell mechanical properties by nitric oxide. Nitric Oxide. (2009) ;21: (1):20–6. 10.1016/j.niox.2009.03.004 |
[34] | Bosch FH , Werre JM , Schipper L , Roerdinkholder-Stoelwinder B , Huls T , Willekens FLA , et al. Determinants of red blood cell deformability in relation to cell age. Eur J Haematol. (1994) ; 10.1111/j.1600-0609.1994.tb01282.x |
[35] | Dobbe JGG , Streekstra GJ , Hardeman MR , Ince C , Grimbergen CA . Measurement of the Distribution of Red Blood Cell Deformability Using an Automated Rheoscope. Clin Cytom. (2002) ; 10.1002/cyto.10171 |
[36] | Elblbesy MA , Hereba AT . Computation of the Coefficients of the Power law model for Whole Blood and Their Correlation with Blood Parameters. Appl Phys Res. (2016) ; 10.5539/apr.v8n2p1 |
[37] | Sherwood JM , Dusting J , Kaliviotis E , Balabani S . The effect of red blood cell aggregation on velocity and cell-depleted layer characteristics of blood in a bifurcating microchannel. Biomicrofluidics. (2012) 6: (2). 10.1063/1.4717755 |
[38] | Kaliviotis E , Sherwood JM , Dusting J , Balabani S . Quantification of local blood flow characteristics in microfluidic applications. Ser Biomech. (2016) ;30: (1):5–14. |
[39] | Kuck L , Grau M , Simmonds MJ . Recovery time course of erythrocyte deformability following exposure to shear is dependent upon conditioning shear stress. Biorheology. (2018) ; 10.3233/BIR-17151 |
[40] | Paul R , Apel J , Klaus S , Schügner F , Schwindke P , Reul H . Shear stress related blood damage in laminar Couette flow. Artif Organs. (2003) ; 10.1046/j.1525-1594.2003.07103.x |
[41] | Muralidharan E , Tateishi N , Maeda N . Simultaneous influence of erythrocyte deformability and macromolecules in the medium on erythrocyte aggregation: a kinetic study by a laser scattering technique. BBA - Biomembr. (1994) ; 10.1016/0005-2736(94)90307-7 |
[42] | Ju M , Ye SS , Low HT , Zhang J , Cabrales P , Leo HL , et al. Effect of deformability difference between two erythrocytes on their aggregation. Phys Biol. (2013) ; 10.1088/1478-3975/10/3/036001 |
[43] | Baskurt OK , Meiselman HJ . Blood Rheology and Hemodynamics. Semin Thromb Hemost. (2003) ;29: (5):435–50. 10.1055/s-2003-44551 |
[44] | Briguori C , Sarais C , Pagnotta P , Liistro F , Montorfano M , Chieffo A , et al. In-stent restenosis in small coronary arteries: Impact of strut thickness. J Am Coll Cardiol. (2002) ; 10.1016/S0735-1097(02)01989-7 |
[45] | Wilson A , Ardehali R , Brinton TJ , Yeung AC , Lee DP . Cutting balloon inflation for drug-eluting stent underexpansion due to unrecognized coronary arterial calcification. Cardiovasc Revascularization Med. (2006) ; 10.1016/j.carrev.2006.05.005 |
[46] | Zarrinkoob L , Ambarki K , Wåhlin A , Birgander R , Eklund A , Malm J . Blood flow distribution in cerebral arteries. J Cereb Blood Flow Metab. (2015) ; 10.1038/jcbfm.2014.241 |
[47] | Tanaka H , Fujita N , Enoki T , Matsumoto K , Watanabe Y , Murase K , et al. Relationship between variations in the circle of Willis and flow rates in internal carotid and basilar arteries determined by means of magnetic resonance imaging with semiautomated lumen segmentation: Reference data from 125 healthy volunteers. Am J Neuroradiol. (2006) ; 27/8/1770 [pii]. |
[48] | Chiastra C , Gallo D , Tasso P , Iannaccone F , Migliavacca F , Wentzel JJ , et al. Healthy and diseased coronary bifurcation geometries influence near-wall and intravascular flow: A computational exploration of the hemodynamic risk. J Biomech. (2017) ; 10.1016/j.jbiomech.2017.04.016 |
[49] | Krüger-Genge A , Hiebl B , Franke RP , Lendlein A , Jung F . Effects of Tacrolimus or Sirolimus on the adhesion of vascular wall cells: Controlled in-vitro comparison study. Clin Hemorheol Microcirc. (2017) ; 10.3233/CH-179211 |
[50] | Hytönen J , Leppänen O , Braesen JH , Schunck WH , Mueller D , Jung F , et al. Activation of Peroxisome Proliferator-Activated Receptor-δ as Novel Therapeutic Strategy to Prevent In-Stent Restenosis and Stent Thrombosis. Arterioscler Thromb Vasc Biol. (2016) ; 10.1161/ATVBAHA.115.306962 |
[51] | Chatzizisis YS , Giannoglou GD . Shear stress and inflammation: Are we getting closer to the prediction of vulnerable plaque? Expert Rev Cardiovasc Ther. (2010) ;8: (10):1351–3. 10.1586/erc.10.126 |
[52] | Danesh J , Lewington S , Thompson SG , Lowe GDO , Collins R , Kostis JB , et al. Plasma fibrinogen level and the risk of major cardiovascular diseases and nonvascular mortality: An individual participant meta-analysis. J Am Med Assoc. (2005) ;294: (14):1799–809. 10.1001/jama.294.14.1799 |
[53] | Maharshak N , Arbel Y , Shapira I , Berliner S , Ben-Ami R , Yedgar S , et al. Increased strength of erythrocyte aggregates in blood of patients with inflammatory bowel disease. Inflamm Bowel Dis. (2009) ;15: (5):707–13. 10.1002/ibd.20838 |
[54] | Arbel Y , Banai S , Benhorin J , Finkelstein A , Herz I , Halkin A , et al. Erythrocyte aggregation as a cause of slow flow in patients of acute coronary syndromes. Int J Cardiol. (2012) ;154: (3):322–7. 10.1016/j.ijcard.2011.06.116 |
[55] | Danesh J , Collins R , Peto R , Lowe GDO . Haematocrit, viscosity, erythrocyte sedimentation rate: Meta-analyses of prospective studies of coronary heart disease. Eur Heart J. (2000) ;21: (7):515–20. 10.1053/euhj.1999.1699 |
[56] | Ulker P , Yaras N , Yalcin O , Celik-Ozenci C , Johnson PC , Meiselman HJ , et al. Shear stress activation of nitric oxide synthase and increased nitric oxide levels in human red blood cells. Nitric Oxide. (2011) ;24: (4):184–91. 10.1016/j.niox.2011.03.003 |
[57] | Radomski MW , Palmer RM , Moncada S . Comparative pharmacology of endothelium-derived relaxing factor, nitric oxide and prostacyclin in platelets. Br J Pharmacol. (1987) ;92: (1):181–7. |


