
Cancer immunoediting: A game theoretical approach
Abstract
The role of the immune system in tumor development increasingly includes the idea of cancer immunoediting. It comprises three phases: elimination, equilibrium, and escape. In the first phase, elimination, transformed cells are recognized and destroyed by immune system. The rare tumor cells that are not destroyed in this phase may then enter the equilibrium phase, where their growth is prevented by immunity mechanisms. The escape phase represents the final phase of this process, where cancer cells begin to grow unconstrained by the immune system. In this study, we describe and analyze an evolutionary game theoretical model of proliferating, quiescent, and immune cells interactions for the first time. The proposed model is evaluated with constant and dynamic approaches. Population dynamics and interactions between the immune system and cancer cells are investigated. Stability of equilibria or critical points are analyzed by applying algebraic analysis. This model allows us to understand the process of cancer development and might help us design better treatment strategies to account for immunoediting.
1Introduction
Understanding how the immune system affects cancer progression is one of the most important topics in cancer immunology. The immune system plays an important role in cancer evolution. Cancer cells are originated by mutations in tumor suppressor genes, DNA repair genes, and oncogenes in normal cells [1]. Tumor cells replicate through uncontrolled cell division and spread into surrounding tissues [2]. Immunoediting consists of three distinct phases: (i) elimination, (ii) equilibrium and (iii) escape. In elimination phase, immune cells such as natural killer cells and T cells are activated by cytokines. They kill cancer cells and consequently cells that have escaped enter equilibrium phase. It is the longest cancer immunoediting phase. In the escape phase, cancer cells gain more resistance to immune detection and it is the most dangerous phase [3, 4, 5].
The presence of cancer cells elicits a host immune response, the dynamics of which have been the subject of many recent studies. Many different methods have been proposed for modeling development and evolution of cancer such as Cellular automaton [6, 7], evolutionary game theory [8–17] defferential equations [18–20], multiagent systems [21].
Game theory is a mathematical tool for modeling interactions between entities. In a game in canonical game theory, each of the players rationally selects a strategy to maximize its profit [22]. Evolutionary game theory originated as an application of game theory to evolutionary contexts. In this approach, the selection is based on repetition and strategies represent fixed phenotypes. Evolutionary games have three important features. In such games, the population is considered to be infinite, reproduction is asexual and the interactions are mutual [28]. Cancer, being a process of somatic evolution, is amenable to evolutionary game theory [24].
Many studies have used evolutionary game theory (EGT) to model cancer evolution and in each of them the focus is the interactions between different cancer phenotypes. Tomlinson and Bodmer [11] were the first ones to use EGT to model cancer. In their work the interactions between cancer cells in the context of angiogenesis is considered. Later, Tomlinson introduced another model in which the interaction of three phenotypes is studied: cells producing a paracrine growth factor and cells producing an autocrine growth factor to prevent apoptosis for other cells or themselves, respectively. Moreover, they described cells which are susceptible to paracrine growth factors but are not able to produce them themselves. In [13], Basanta and Deutsch study cell behaviour in environmental poisoning as a result of glycolytic metabolism and how the introduction of a new phenotype, even if not an evolutionary successful one, can influence the evolutionary dynamics of the tumor. In a subsequent study, Basanta et al. [12] proposed a different model where the interaction between cancer cells and stroma cells is studied. Recently, Gatenbee et al. [25] explore the evolution of immune escape strategies in ductal cancers. In summary, they show that spatial competition and structure influence transient dynamics during invasion.
In many research, interaction between cancer and immune cells are investigated with math equations and none of them investigated by a game-theoretical approach. So, the previous game theory models never consider the interactions between cancer and immune cells. The main contribution of this paper is threefold: First, in the proposed model we describe the interactions between two types of cancer cells (proliferating and quiescent) and immune cells. Second the model is analyzed in three tumor phases, and third the proposed model will be investigated with static and dynamic analysis approaches.
To the best of our knowledge, this is the first time that an evolutionary game model of cancer and immune cells interactions has been proposed. The paper is organized as follows. We will first describe the model in Section 2 following by analysis presented in Section 3. We will then in Section 4 present some examples based on biologic reality for each development phase of a tumor and provide conclusions.
2The proposed evolutionary game theory model
Interactions between immune and cancer cells create the immunoediting process. It consists of three phases: elimination, equilibrium and escape. Figure 1(a) illustrates immunoediting process. In the elimination phase, the innate and adaptive immune systems work together to kill susceptible cancer tumor cells. Molecules and immune cells that are active in this phase can recognize and kill cancer cells. Moreover, dangerous signals such as type I IFNs are released from dying tumor cells or from damaged tissues during tumor progression. These cytokines activate immune cells and provide adaptive anti-tumor immune response. Ligands such as MICA/B and H60 that are abundant on the surface of tumor cells, bind to activating receptors on immune system cells and activate them. The spread of CD4+T and CD8+T cells leads to a coordination and balance in activation of both innate and adaptive immune response [3].
![Cancer Immunoediting. It is reproduced from the information presented in [3].](https://content.iospress.com:443/media/isb/2020/14-1-2/isb-14-1-2-isb200475/isb-14-isb200475-g001.jpg)
Ideally all cancer cells in this phase are killed by the immune system as shown in Figure 1(b). If, however, some tumor cells remain, it may then progress to the equilibrium phase. The equilibrium phase is a function of adaptive immunity. In this phase, tumor cells are maintained by IL-12, T, IFNγ factors. This phase may last as long as the lifetime of the host [5, 26]. In the escape phase, changes and transformations such as antigene reduction occurs in tumor cell surface. It leads to a reduction in the recognition of tumor cells by the immune system. Also in this phase, cellular resistance may increase to the cytotoxic effects of immunity. For example, anti-apoptotic mechanisms such as activation of factors such as STAT3 or expression of anti-apoptotic molecules like BCL-2 can lead to the increase cellular resistance (Figure 1(b)).
Cancer proliferating cells are dangerous cells that have enough nutrients and ability to cell devision. Due to low immunogenic level of these cells, the probability of recognition by the immune system is low. Moreover, the cells will remain hidden from immune system. The cancer quiescent cells are alive but have not sufficient nutrient source to support cell division. {Some researches have considered interaction between quiescent cells with other cells [6, 7, 20, 41–43]. The immune system can usually recognize the highly immunogenic cells. Therefore, the cost imposed to these cells increase. Now we model the interaction between cancer proliferating cells(P), cancer quiescent cells (Q) and immune cells (I) by evolutionary game theory. These cells interact together by producing significant factors. Therefore, we define proliferating cancer cell, quiescent cancer cell and immune cell as players that their benefit are based on their abilities to survive themselves. Figure 2 shows possible interactions considered in the proposed model. Green solid lines indicate stimulation and red dashed lines indicate inhibition. Stimulations of cancer-immune interaction may cause tumor elimination, tumor dormancy or tumor escape.
Fig. 2
Interactions considered in the proposed model.
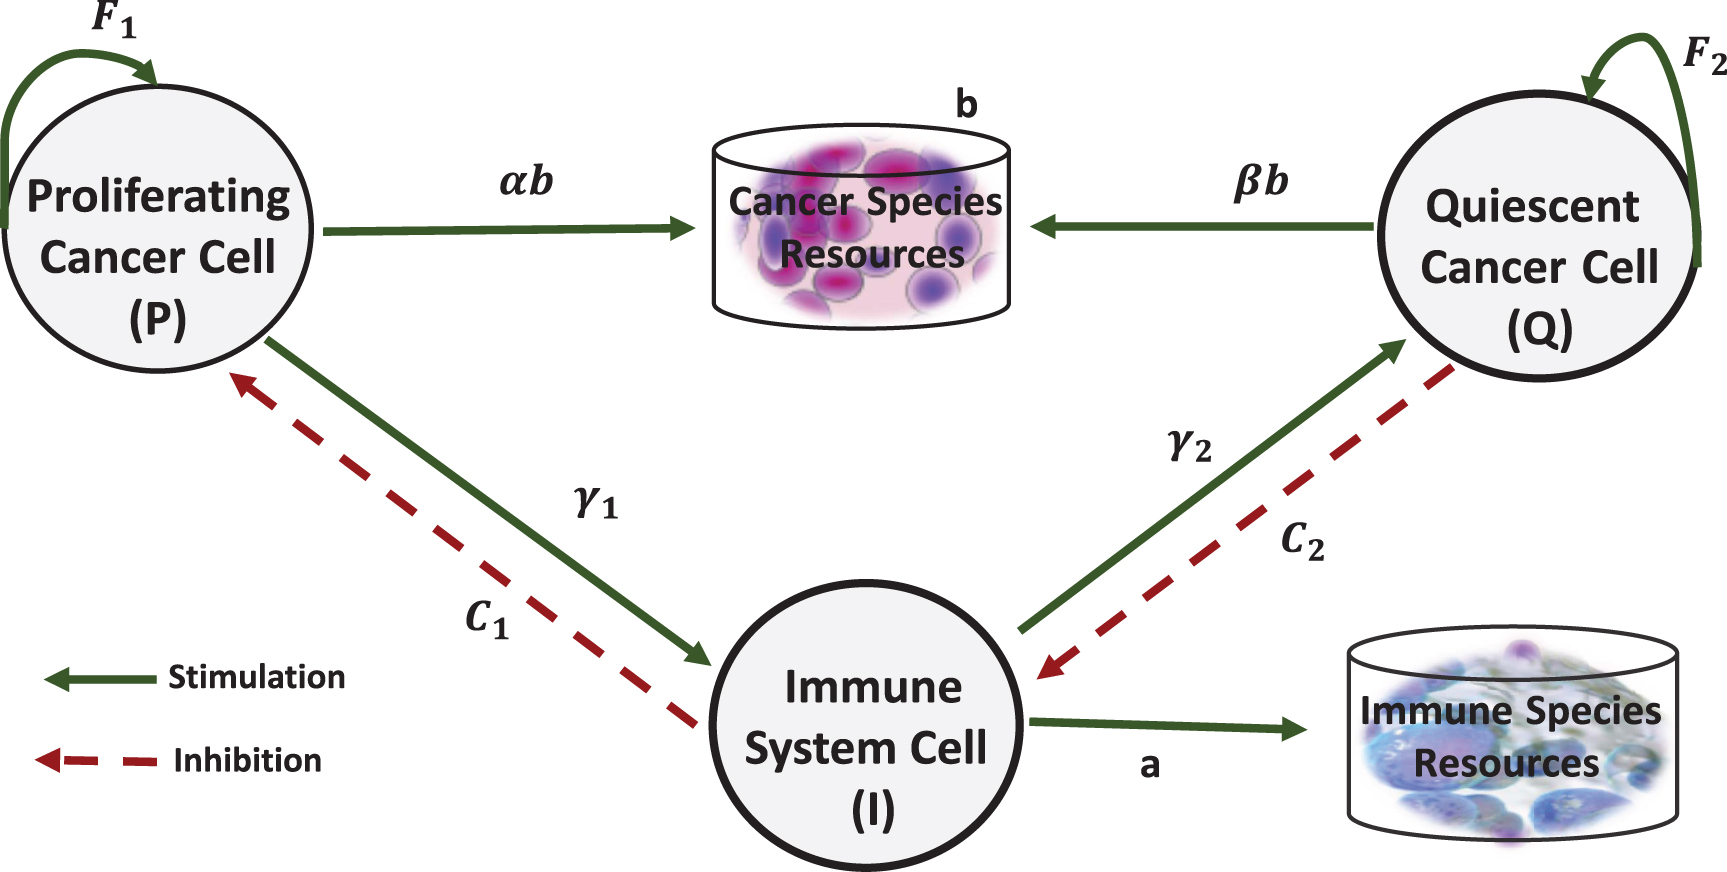
Table 1 translates the described interactions between three cells (Figure 2) to real values that show the cell’s payoffs.
In this model, the sources of cancer cells and immune cells are assumed to be separated. a and b represent the basic payoff that immune and cancer cells can obtain from their proprietary source, respectively. As shown in the first row of Table 1, there are three types of the interactions for proliferating cells. When proliferating cells interact with themselves, the amount of basic payoff is equally divided between them (
As described in the second row of Table 1, βb represents the payoff for quiescent cells when interacting with proliferating cells. when quiescent cells interact with themselves, they gain a fitness advantage from growth factors, which is represented by F2. When quiescent cells interact with immune cells, the cost value C2 is imposed on them.
As shown in the third row of Table 1, the payoff for immune cells playing together is
3Analysis of the proposed evolutionary game
In this study we investigate two approaches (i.e., static and dynamic) to analyze evolutionary game theory. The first approach originates from the model presented by Smith [28] that captures the dynamic process of natural selection using a static definition of ESS. To describe how the ESS is achieved, to determine which one Evolutionary Stable Strategy (ESS) point will be selected when there are more than one ESS in the game, and to analyze other type of stabilities of the game we use replicator dynamics [40].
In Game Theory, Nash Equilibrium (NE) is a state of the game where no player can increase its payoff by deviating from the state unilaterally. In Evolutionary Game Theory, an ESS is a strategy profile such that, if most members of a population adopt it, there is no mutant strategy that would give a higher reproductive fitness [28]. The ESS concept has been proposed by Maynard Smith [28]. ESSs can be monomorphic or polymorphic [29]. A profile of strategies represents a monomorphic (polymorphic) ESS, if it cannot be invaded by other pure (mixed2) strategies. We formalize this concept in the following definition.
Definition 1. In a symmetric game3, the strategy (phenotype)
An ESS is a stability concept that was inspired by the replicator dynamic. In other words an ESS is a strategy profile that is resistant to invasion by new strategies [44]. Let assume that a population of players is playing a given strategy, then a small population of invaders change their strategies. The old strategy is an ESS if it obtain higher payoff rather the mixture of the new and old strategies. In this case, the old strategy is winner phenotype in the competition over times and natural selection favors it. In the following sections, we have analyzed the proposed model with two static and dynamic approaches. In static analysis, we investigated the Nash equilibrium (NE) and the evolutionary stable strategy (ESS). NE and ESS represent the stage in cancer progression where no more changes are expected.
3.1Static analysis
In the static analysis of a game, the final state of the population is considered. In this section, we investigate the conditions that lead to dominance in each of phases: elimination, equilibrium and escape. As discussed in the previous section, sometimes immune system can detect and inhibit cancer cells which results in preventing the development of many cancers. The following proposition demonstrates the conditions under which the immune cells’ natural capability are able to destroy cancer cells. In the metaphor of the game we say that the immune cells are stable strategy. This phase is called elimination.
Proposition 1. In the elimination phase, strategy profile (I,I), under the following condition is a monomorphic ESS.
(1)
Proof. It is easy to check that according to mentioned conditions, strategy profile (I,I) is strict Nash equilibrium and consequently it is a monomorphic ESS. fitness
(2)
(3)
(4)
(5)
Immune cells can eradicate proliferative and quiescent cancerous cell completely, however, sometimes, cancer cells may escape from the immune system’s detection and destruction. In this situation, cancer cells can suppress the immune system’s response through several mechanisms (please see Section 2), and also enable invasive cells to move and spread to the neighboring tissues [30]. The following proposition represents conditions that induce a monomorphic ESS in the escape phase.
Proposition 2. In the escape phase, strategy profile (P,P), under the following conditions is a monomorphic ESS.
(6)
Proof. It is easy to check that according to mentioned conditions: fitness
(7)
(8)
(9)
(10)
Moreover, in some situations, cancer cells may not be completely eradicated but instead manage to survive immune destruction and so enter into an equilibrium state in which the immune system derives tumor growth. In the game theory metaphor, if quiescent cells go to a stable state, or quiescent and immune cells compose a polymorphic stable state, then during cancer immunoediting, the immune system drives tumor cells go to the equilibrium phase.
Proposition 3. The equilibrium phase of cancer includes one of the following:
i) Strategy profile (Q,Q), under the following conditions is a monomorphic ESS.
(11)
Proof. i) It is similar to the proof of Proposition 1.
fitness
(12)
(13)
(14)
(15)
(16)
3.2Dynamic analysis
The process of carcinogenesis includes all principles of evolutionary theory: reproduction, mutation, and selection. In cancer, the fitness of phenotypes or genotypes depends on their relative frequencies in the population [45–48]. There are many evidences that the selection and expansion of one cell population in tumor influences and is influenced by the relative frequencies of other cell populations (including normal cells) [49]. This type of selection is called frequency-dependent selection [45]. This type of selection is a driver of heterogeneity and genetic diversity in tumors. Many models that analyze cancer evolution and development often disregard frequency-dependent selection and suppose that evolution is interpreted over a given fitness landscape. They have assumed that each phenotype has a definite fitness value that is not depending on the relative frequencies. Hence, this may result in misleading [45, 46, 49]. Replicator dynamic is a standard tool to capture the frequency-dependent nature of interactive populations [50, 51] Hence, in this study, we have employed replicator dynamics. Moreover, replicator dynamics only assume the inheriting of pure strategy that is in accordance with cancer nature.
The replicator dynamic was developed for evolutionary games by Maynard Smith and Price [28]. In addition, the replicator equations are employed to the deterministic evolutionary process [40]. These equations describe how the proportions of a population change over time based on different in the fitness of each of the other populations in a frequency dependent manner [31]. Hence, in applications of EGT to cancer, researchers employ replicator equations to investigate the dynamics of the populations [12].
In our model we show the proportion of P cells, the proportion of Q cells and the proportion of I cells at a given time t shown by x, y and z, respectively. The absolute fitness of each cell is:
(17)
(18)
(19)
(20)
(21)
(22)
(23)
4Result
The final stage of cancer can be one of the following: cancer- free status (immune cells are stable), dormant status (quiescent cells are stable) or lethal and dangerous status (proliferating cells are stable). In our problem, the status of the tumor must be changed from proliferating to controlled states (equilibrium or elimination phase) for patients treatment. It can control or recover the disease. Therefore a good understanding of this process can help us to design treatment strategies.
4.1Numerical simulation
In this section, we want to investigate the evolution of different phenotypes in the tumor population using the replicator equations in a number of scenarios. In other hand, we have not considered the exact real values for payoffs in a specific tumor, because the payoffs differ from individual to individual. In this paper, we don’t restrict ourselves to a specific situation and we analyze the general forms of the model. This is a standard way to analyze highly variable environmental. In most of the papers in this area, there doesn’t exist any calibration for extracting exact real value of the payoff and most of the applied parameters are qualitative [8, 9, 12, 13, 38, 39]. Despite these, we delineate the phenotypes behaviors using the several possible scenarios under various environment conditions. This scenario represents different payoff in different environment. In fact we investigate different behavior of the phenotypes instead of investigating a special case using exact value. Theses scenarios are determined by the model variables: α, C1, C2, F1, F2, γ1, and γ2. In each case, the replicator equations iterate for 20 generations. In this regard, we investigate two scenarios that describe three phases including elimination, equilibrium and escape phases.
Scenario i) In this scenario, the imposed costs on cancer cells are low then population dynamic direct toward escape or equilibrium phase by increasing the impact of cancer growth factors.
As the first row in Figure 3 shows, the outcomes from the phases determined by α and the sum of costs (C1+C2) that set to lower than 1. Outcome is P phenotype (escape phase) if 2F1-γ1 is suffciently small.
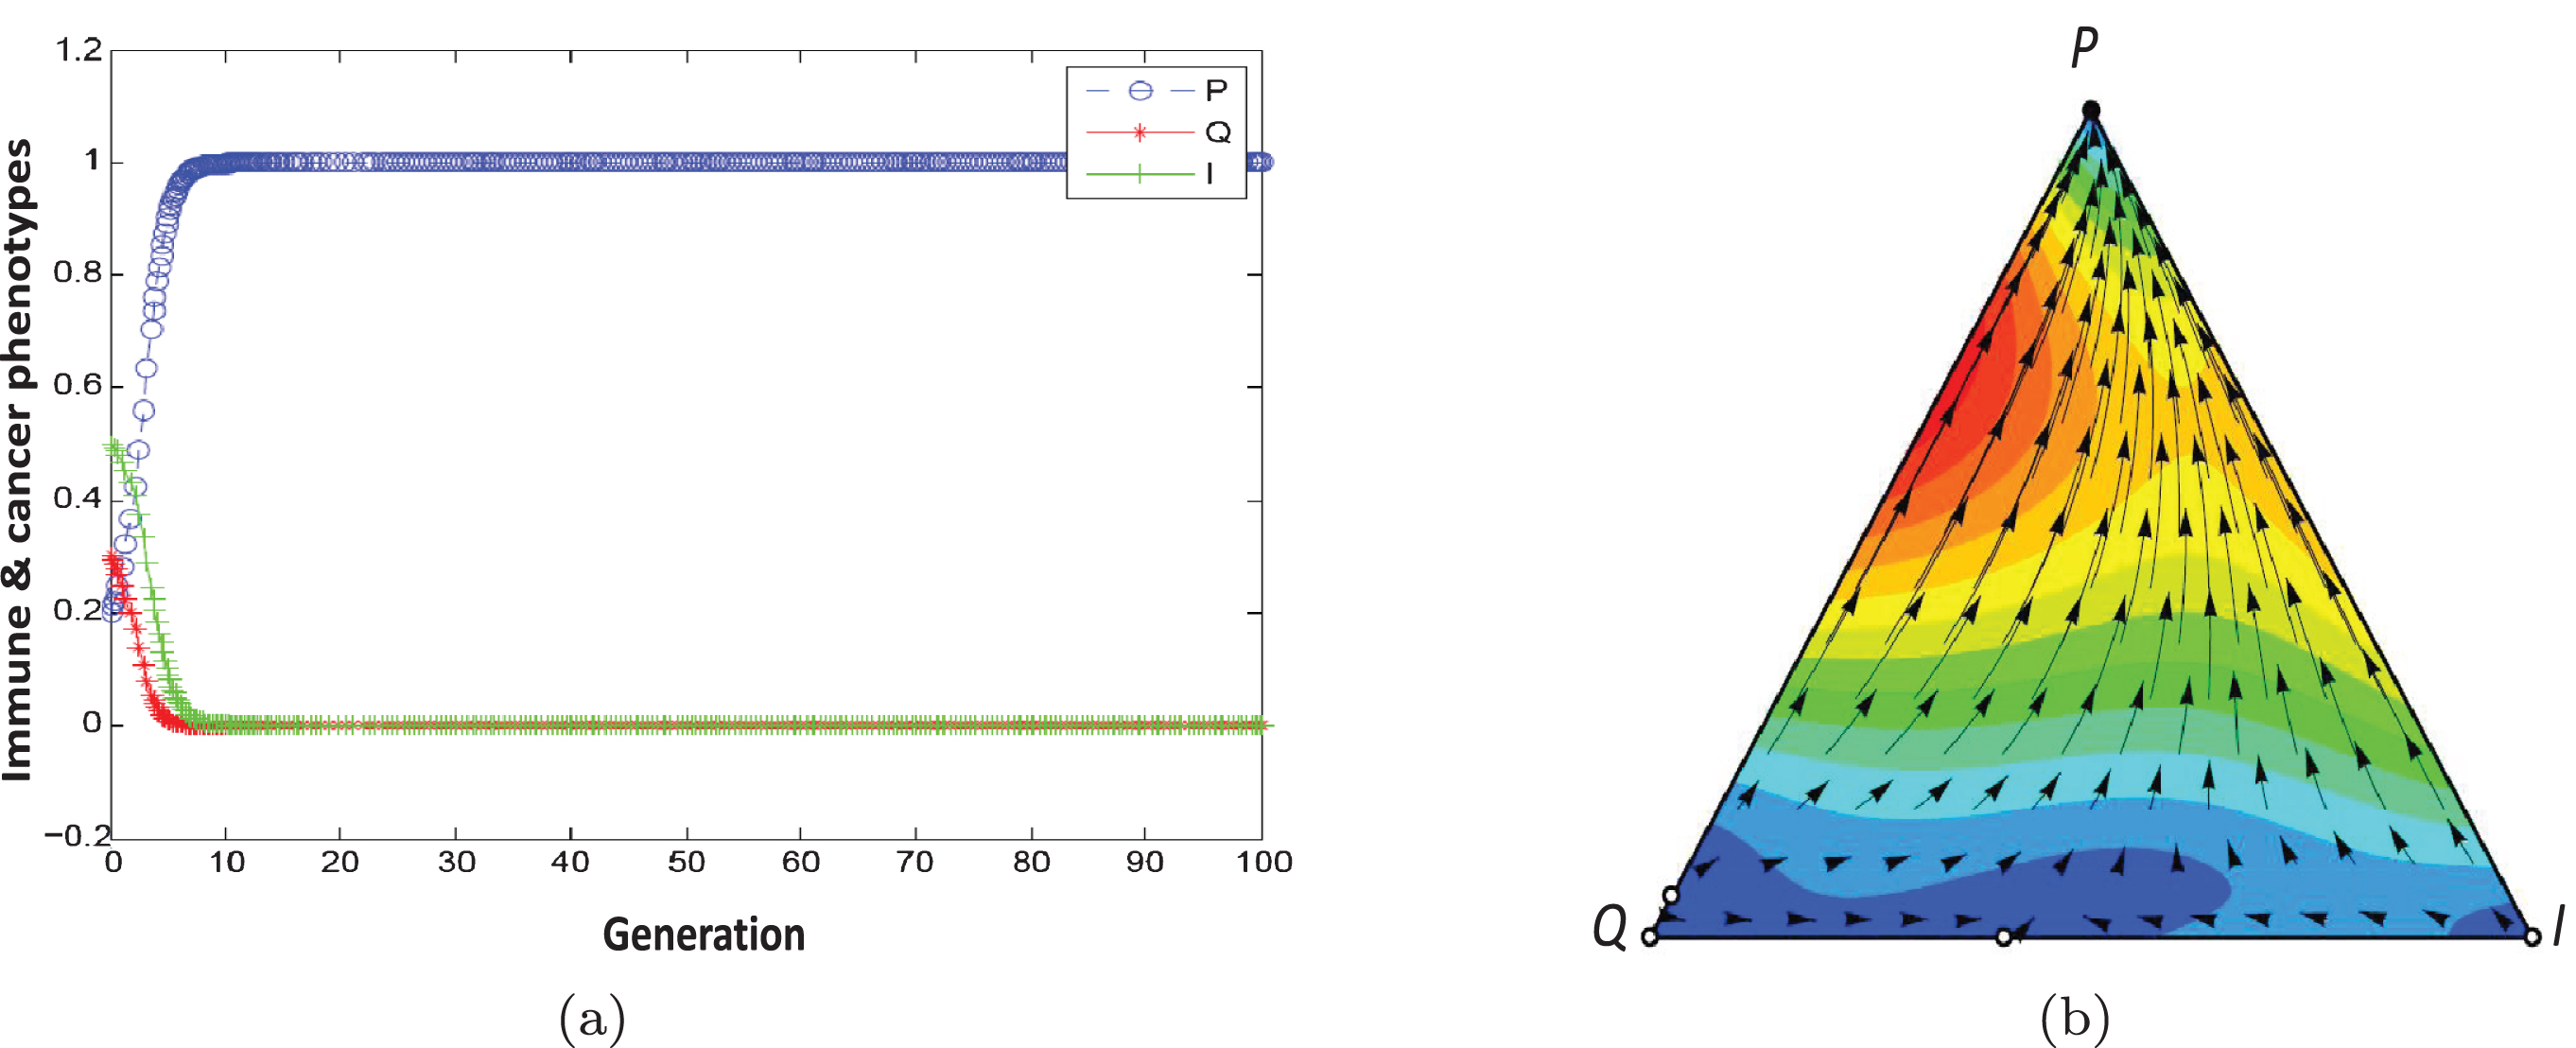
Figures 4(a) and 4(b) show the population dynamic for the example of escape phase. Using initial conditons a, b = 1, α = 0.9, β = 0.1, F1 = 1.5, F2 = 0.5, γ2 = 0.2, γ1 = 0, C1 = 0 and C2 = 0.2, the conditions of Proposition 2 are satisfied. They show the population dynamics of tumor cells for 100 generations.
Fig. 3
Outcomes from the replicator equations. Each box represents the outcome in which specific values of 2F1-γ1 and 2F2-γ2 are varied (from 0 to 1).
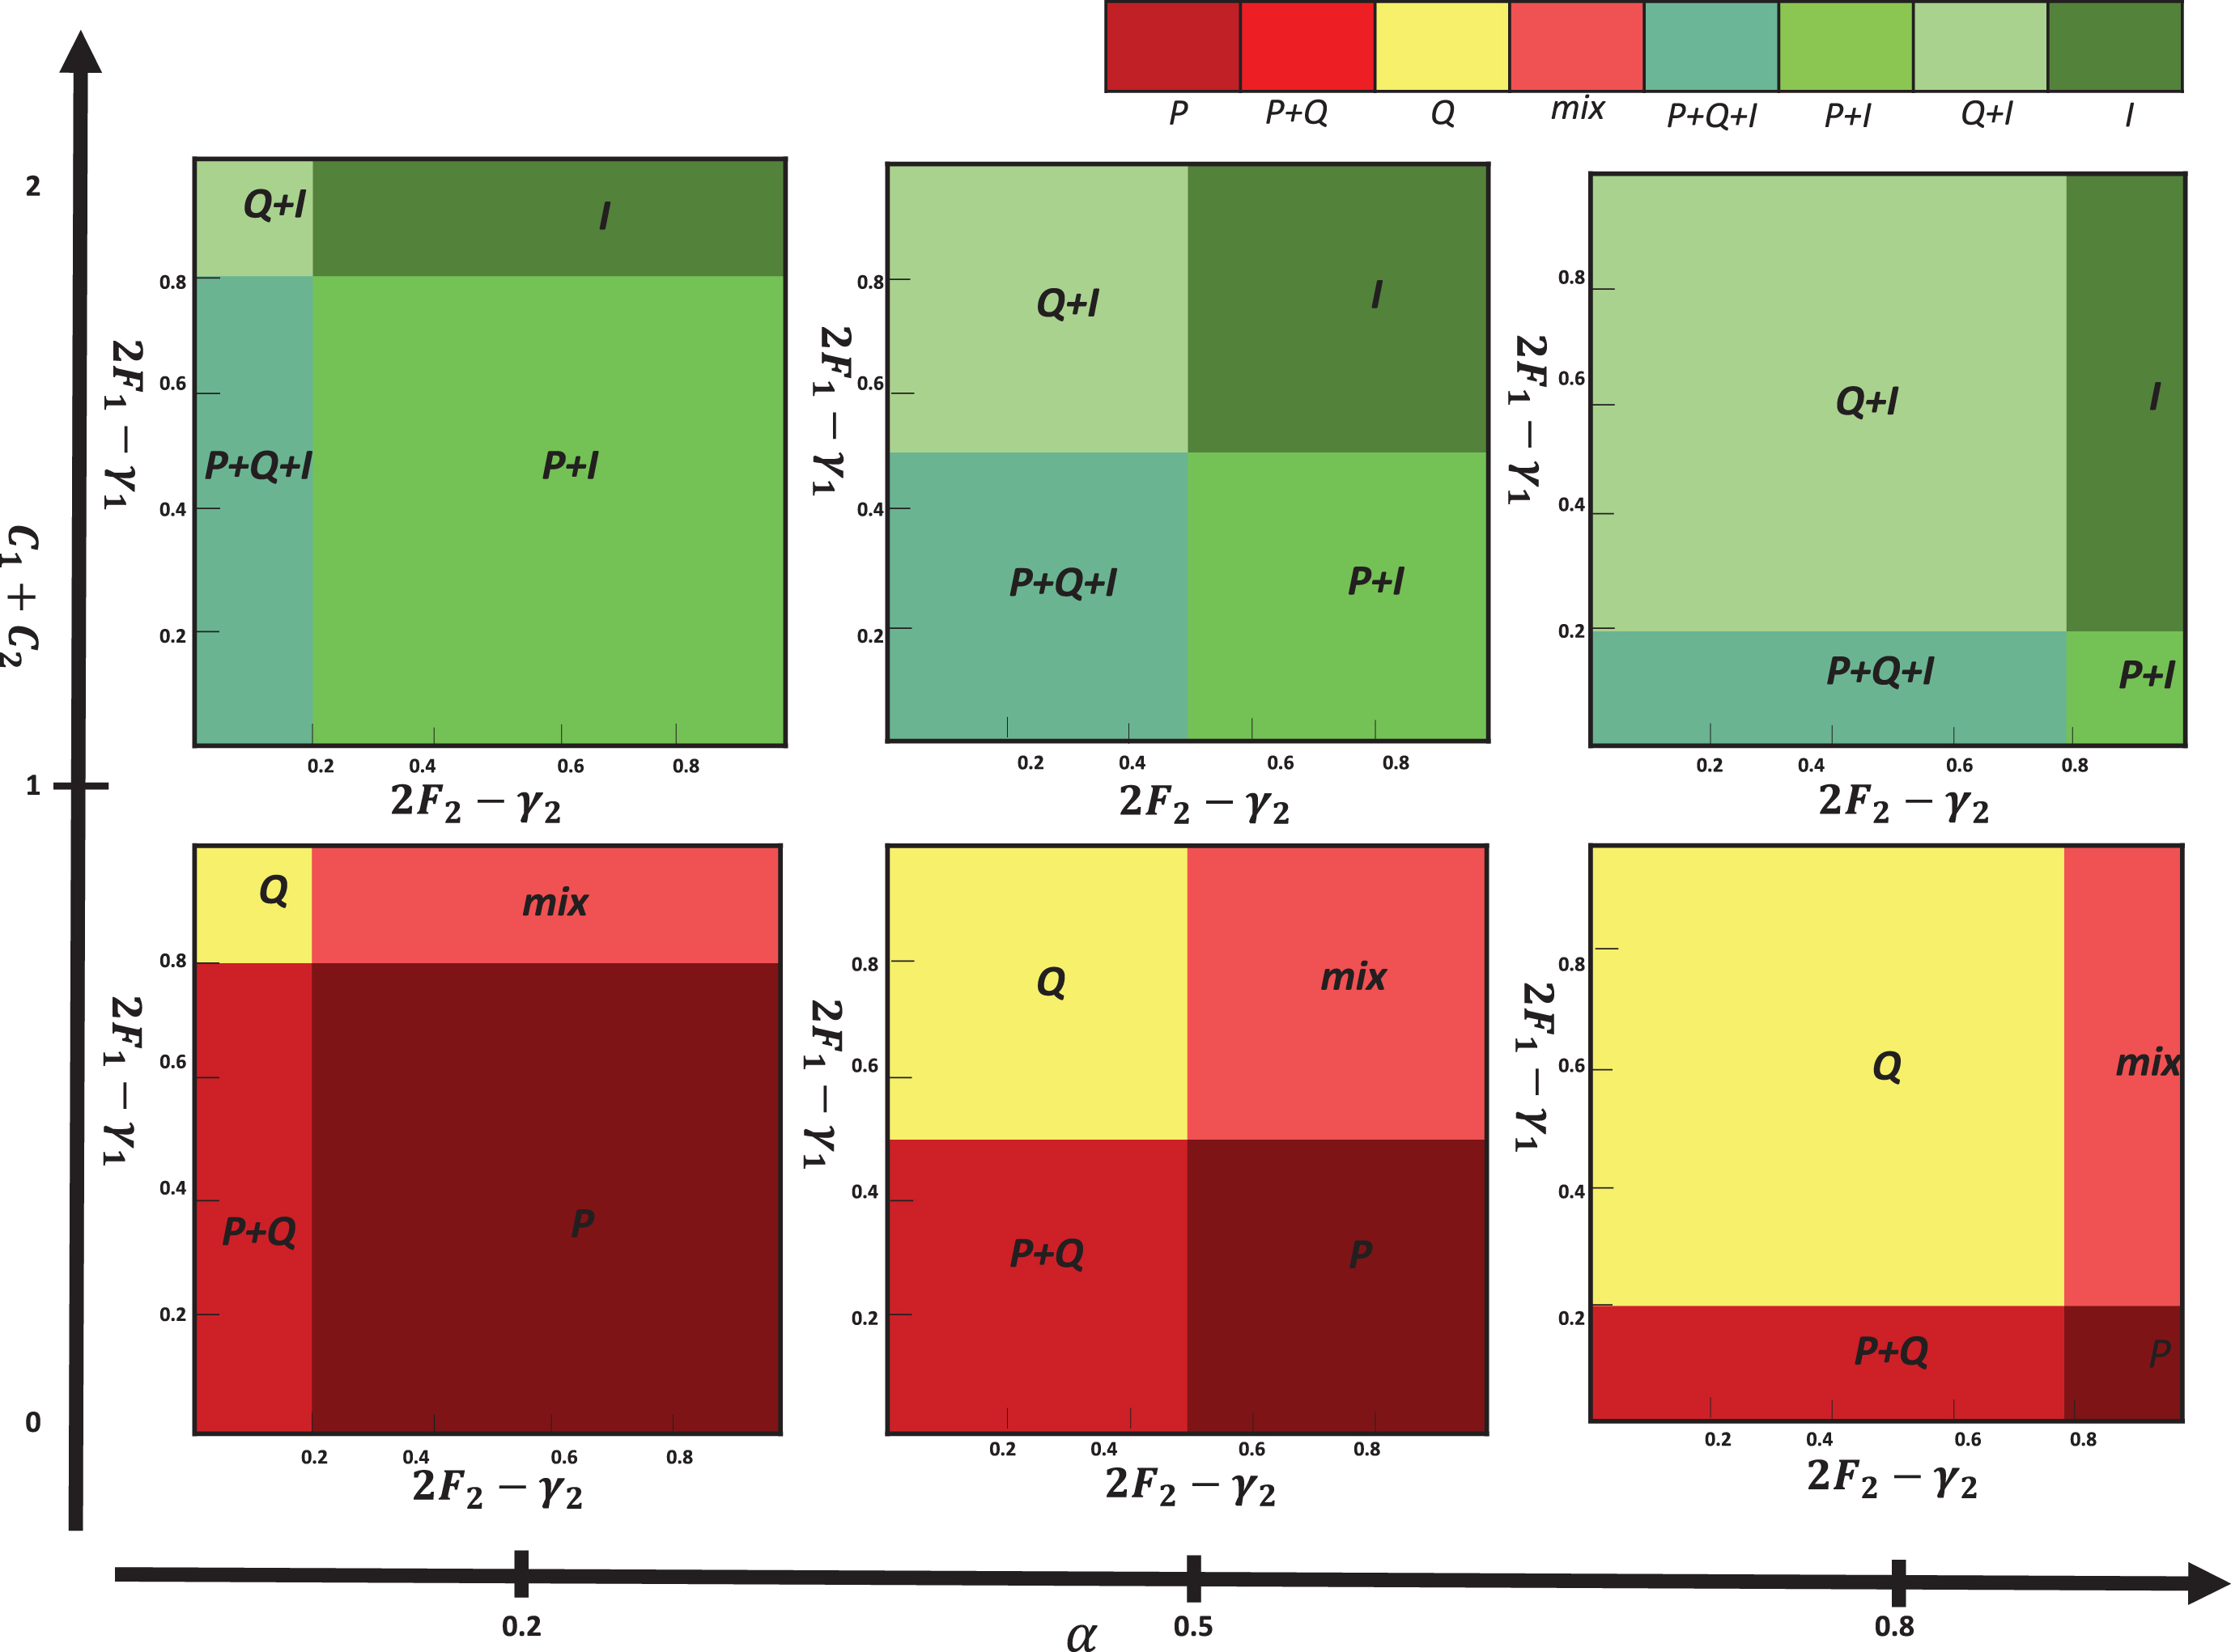
Fig. 4
Population dynamic in the escape phase. The parameters characterising this game are a, b = 1, α = 0.9, β = 0.1, F1 = 1.5, F2 = 0.5, γ2 = 0.2, γ1 = 0, C1 = 0, C2 = 0.2 ..
Equilibria are not always stable. Since stable and unstable equilibria play quite different roles in the dynamics of a system, it is useful to classify equilibrium points based on their stability. We consider biological network that are modeled by differential equations.
Definition 2. Let dynamic equations are calculated like the following system:
where P1, . . . , Pn, Q1 ≠ 0, . . . , Qn ≠ 0 are polynomials in λ1, . . . , λn, x1, . . . , xn. We can obtain critical points by equating equations to zero [32, 33]. A point
(24)
(a) If all the eignvalues of the matrix
(b) If the jacobian matrix
According to our definition 2, the equilibrium point (1,0,0) is stable (Table 3). In this game, the population dynamics direct toward the dominance of proliferating cells and a strategy profile (P,P) is NE and ESS. Tumor progression leads to an escape state resulting from the reduced ability of immune system in recognizing and killing cancer cells (C1 = 0, C2 = 0.2) or, alternatively, an increase in cellular resistance to the effects of cytotoxics (F1 = 1.5, F2 = 0.5).
In this scenario, outcome is Q phenotype (equilibrium phase) if 2F1-γ1 is high enough. When α is large, population dynamic is leading to the coexistence of three phenotypes. Figures 5(a) and 5(b) show population dynamic for the example of equilibrium phase. Using initial conditons a, b = 1, α = 0.1, β = 0.9, F2 = 1.5, F1 = 0.5, γ2 = 0, γ1 = 0.2, C2 = 0, and C1 = 0.2 the conditions of Proposition 3 are satisfied. As seen in Table 3, equilibrium point (0,1,0) is stable in Definition 2. In this game, population dynamic direct toward dominant quiescent cells and strategy profile(Q,Q) is NE and ESS. Empirical evidences indicate that tumors can remain dormant in patients for many years (at least 10 years). This state of dormant can be disrupted and cells escaped from immune control.
Fig. 5
Population dynamic in the equilibrium phase.The parameters characterising this game are a, b = 1, α = 0.1, β = 0.9, F2 = 1.5, F1 = 0.5, γ2 = 0, γ1 = 0.2, C2 = 0, C1 = 0.2 .
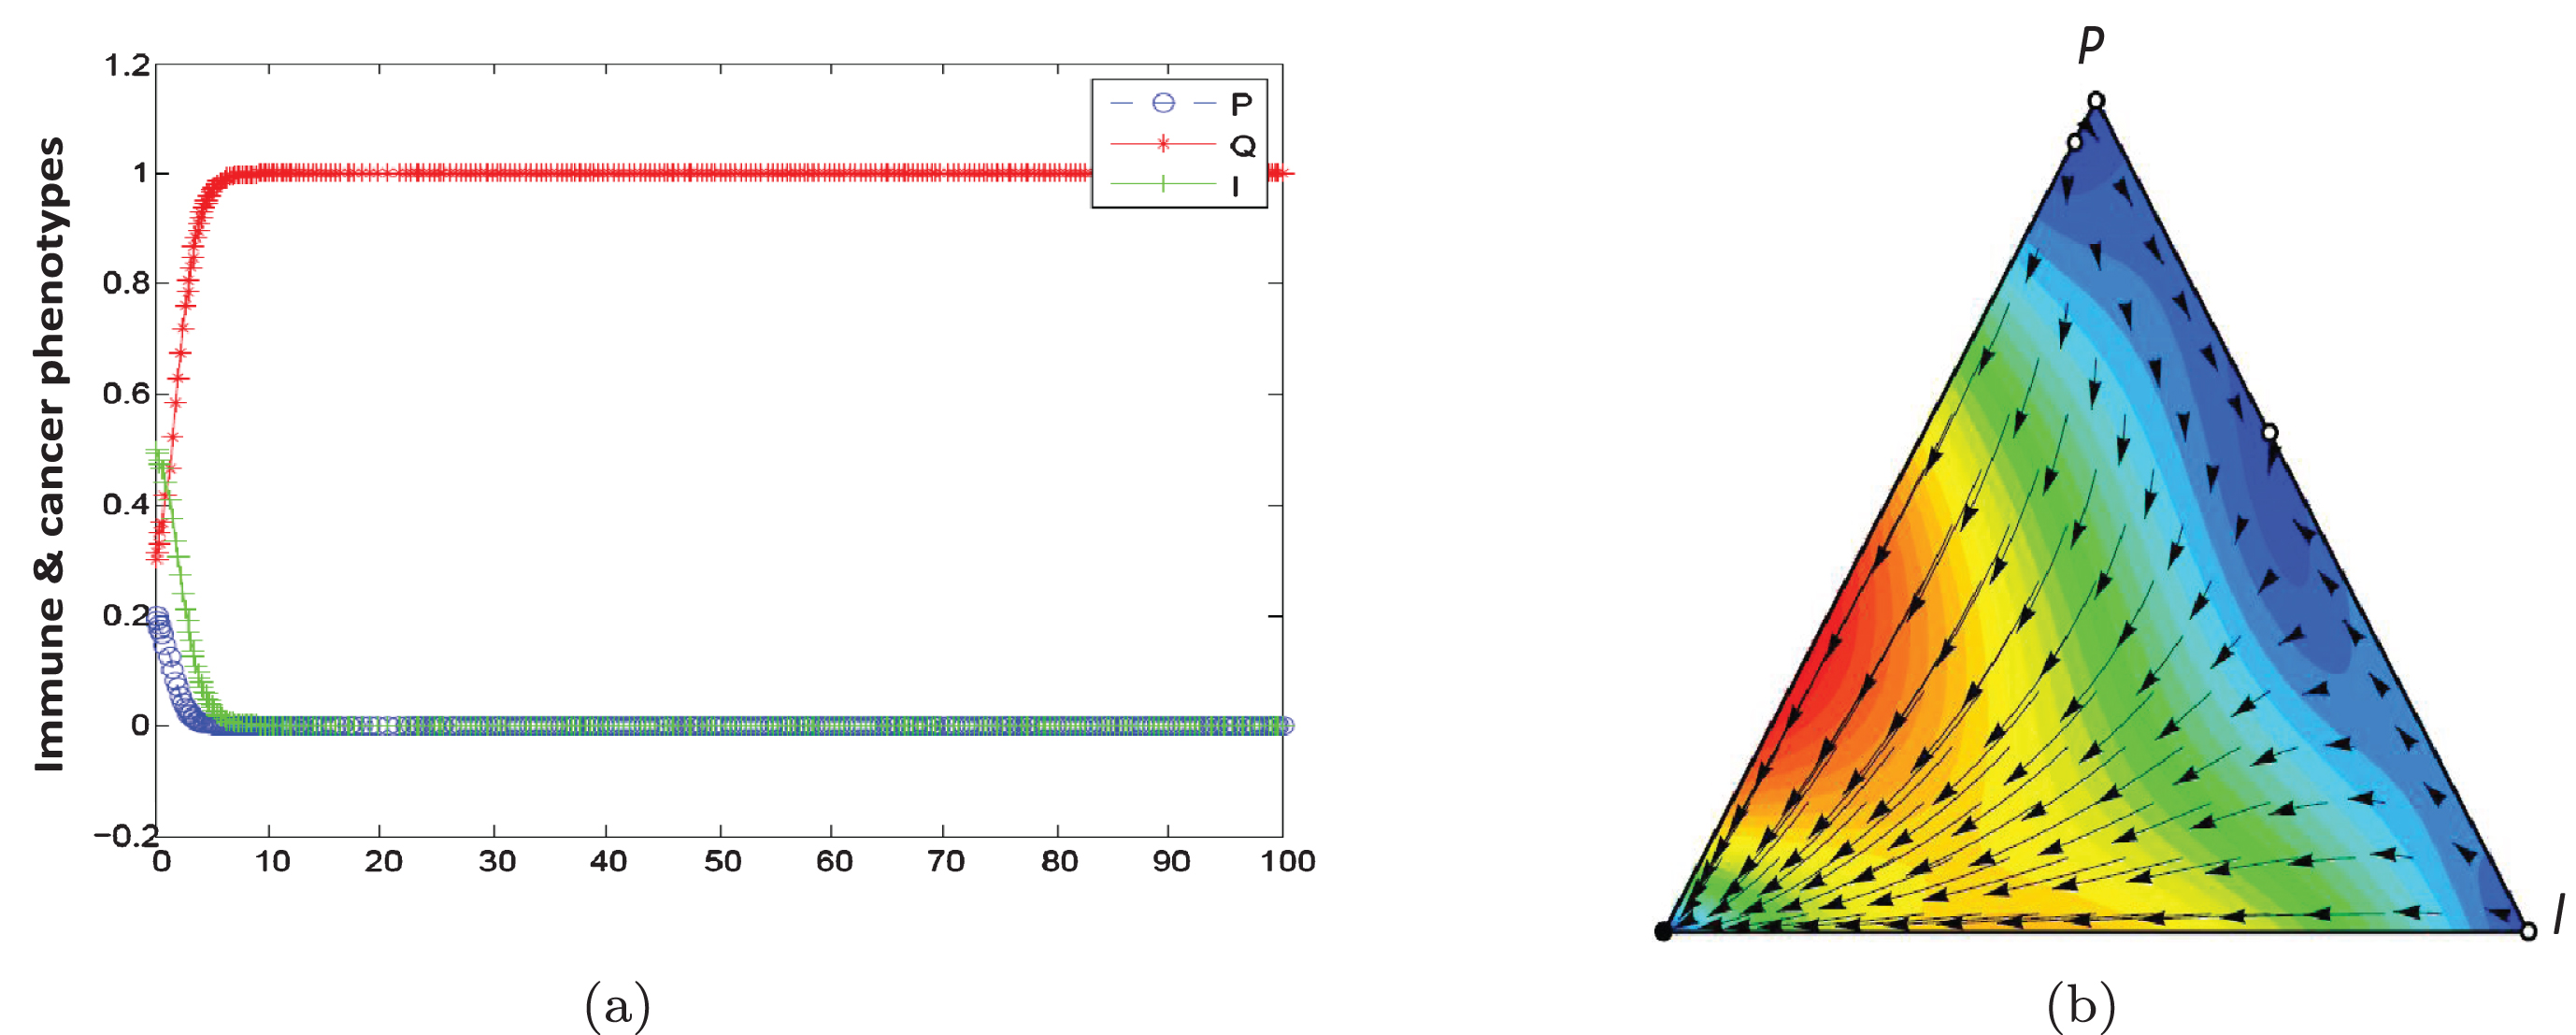
Table 1
This table represents the general reward matrix for interactions between immune (I), proliferating (P) and quiescent(Q) cells. For example, αb is proliferating (P) payoff interaction between quiescent (Q) and proliferating (P) type
| Phenotype | P | Q | I |
| P |
| αb | b-C1 |
| Q | βb |
| b-C2 |
| I | a+γ1 | a+γ2 |
|
Table 2
Description of Model Parameters
| Parameter | Description |
| P | Proliferating cancer cells |
| Q | Quiescent cancer cells |
| I | Immune cells |
| b | Basic payoff for cancer cells |
| a | Basic payoff for immune cells |
| γ1, γ2 | Net benefit |
| C1, C2 | The costs of cancer cells that imposed by immune cells |
| F1, F2 | The benefit produced by growth factors |
| αb | Fraction from basic payoff for proliferating cancer cell |
| βb | Fraction from basic payoff for quiescent cancer cell |
Table 3
Analysis of critical points
| Scenario | Critical Points | Eigenvalues | Description |
| (2) | X0 = (0, 0, 0) | 0, 0, 0 | Free of cancer |
| X1 = (1, 0, 0) | -1, - 0.5, 1 | Unstable | |
| X2 = (0, 1, 0) | -1, - 0.5, 1 | Unstable | |
| X3 = (0, 0, 1) | -0.5, - 0.5, - 0.5 | Stable | |
| X4 = (0.5, 0.5, 0) | 1.25, - 0.75, 0.25 | Unstable | |
| (1) | X0 = (0, 0, 0) | 0, 0, 0 | Free of cancer |
| X1 = (1, 0, 0) | -1, - 0.1, 0.2 | Unstable | |
| X2 = (0, 1, 0) | -2, - 1.9, - 1 | Stable | |
| X3 = (0, 0, 1) | -0.5, 0.3, 0.5 | Unstable | |
| X4 = (0.6, 0, 0.4) | -0.92, - 0.12, 0.02 | Unstable | |
| X5 = (0.95, 0.05, 0) | -0.955, 0.095, 0.235 | Unstable | |
| (1) | X0 = (0, 0, 0) | 0, 0, 0 | Free of cancer |
| X1 = (1, 0, 0) | -2, - 1.9, - 1 | stable | |
| X2 = (0, 1, 0) | -1, 0.1, 0.2 | unstable | |
| X3 = (0, 0, 1) | -0.5, 0.5, 0.3 | unstable | |
| X4 = (0, 0.6, 0.4) | -0.12, - 0.92, 0.02 | unstable | |
| X5 = (0.05, 0.95, 0) | 0.095, - 0.955, 0.235 | unstable |
Scenario ii) The use of cytokines to reinforce the immune system constitutes a typical application of immunotherapy [34, 35]. A cytokine is hormone protein which is produced by active lymphocytes. Cytokines mediate between adaptive and innate immune systems. Cytokine enhancement increases the costs imposed on quiescent and proliferating cells (C1+C2). As the second row in Figure 3 shows, the outcomes by α and the sum of costs (C1+C2) that set to higher than 1. When C1+C2 and 2F2-γ2 are heigh, phenotype I dominates the population and spread through it. Hence in this situation the tumor will be in elimination phase. As shown in Figure 3, The patient’s condition can be changed from escape state to equilibrium or elimination state by proceeding more cytokines. Figures 6(a) and 6(b) show population dynamic for the example of elimination phase. Let a,b=1, under Proposition 1 conditions, we can use initial condition α = 0.5, β = 0.5, F1 = 0.5, F2 = 0.5, γ2 = 1, γ1 = 1, C1 = 1 and C2 = 1 . Following the predetermined initial conditions, immune cells become the dominant over the cancer cells. Also, according to Definition 2, the equilibrium point (0,0,1) is stable (Table 3).
Fig. 6
Population dynamic in the elimination phase. The parameters characterising this game are α = 0.5, β = 0.5, F1 = 0.5, F2 = 0.5, γ2 = 1, γ1 = 1, C1 = 1, C2 = 1 .
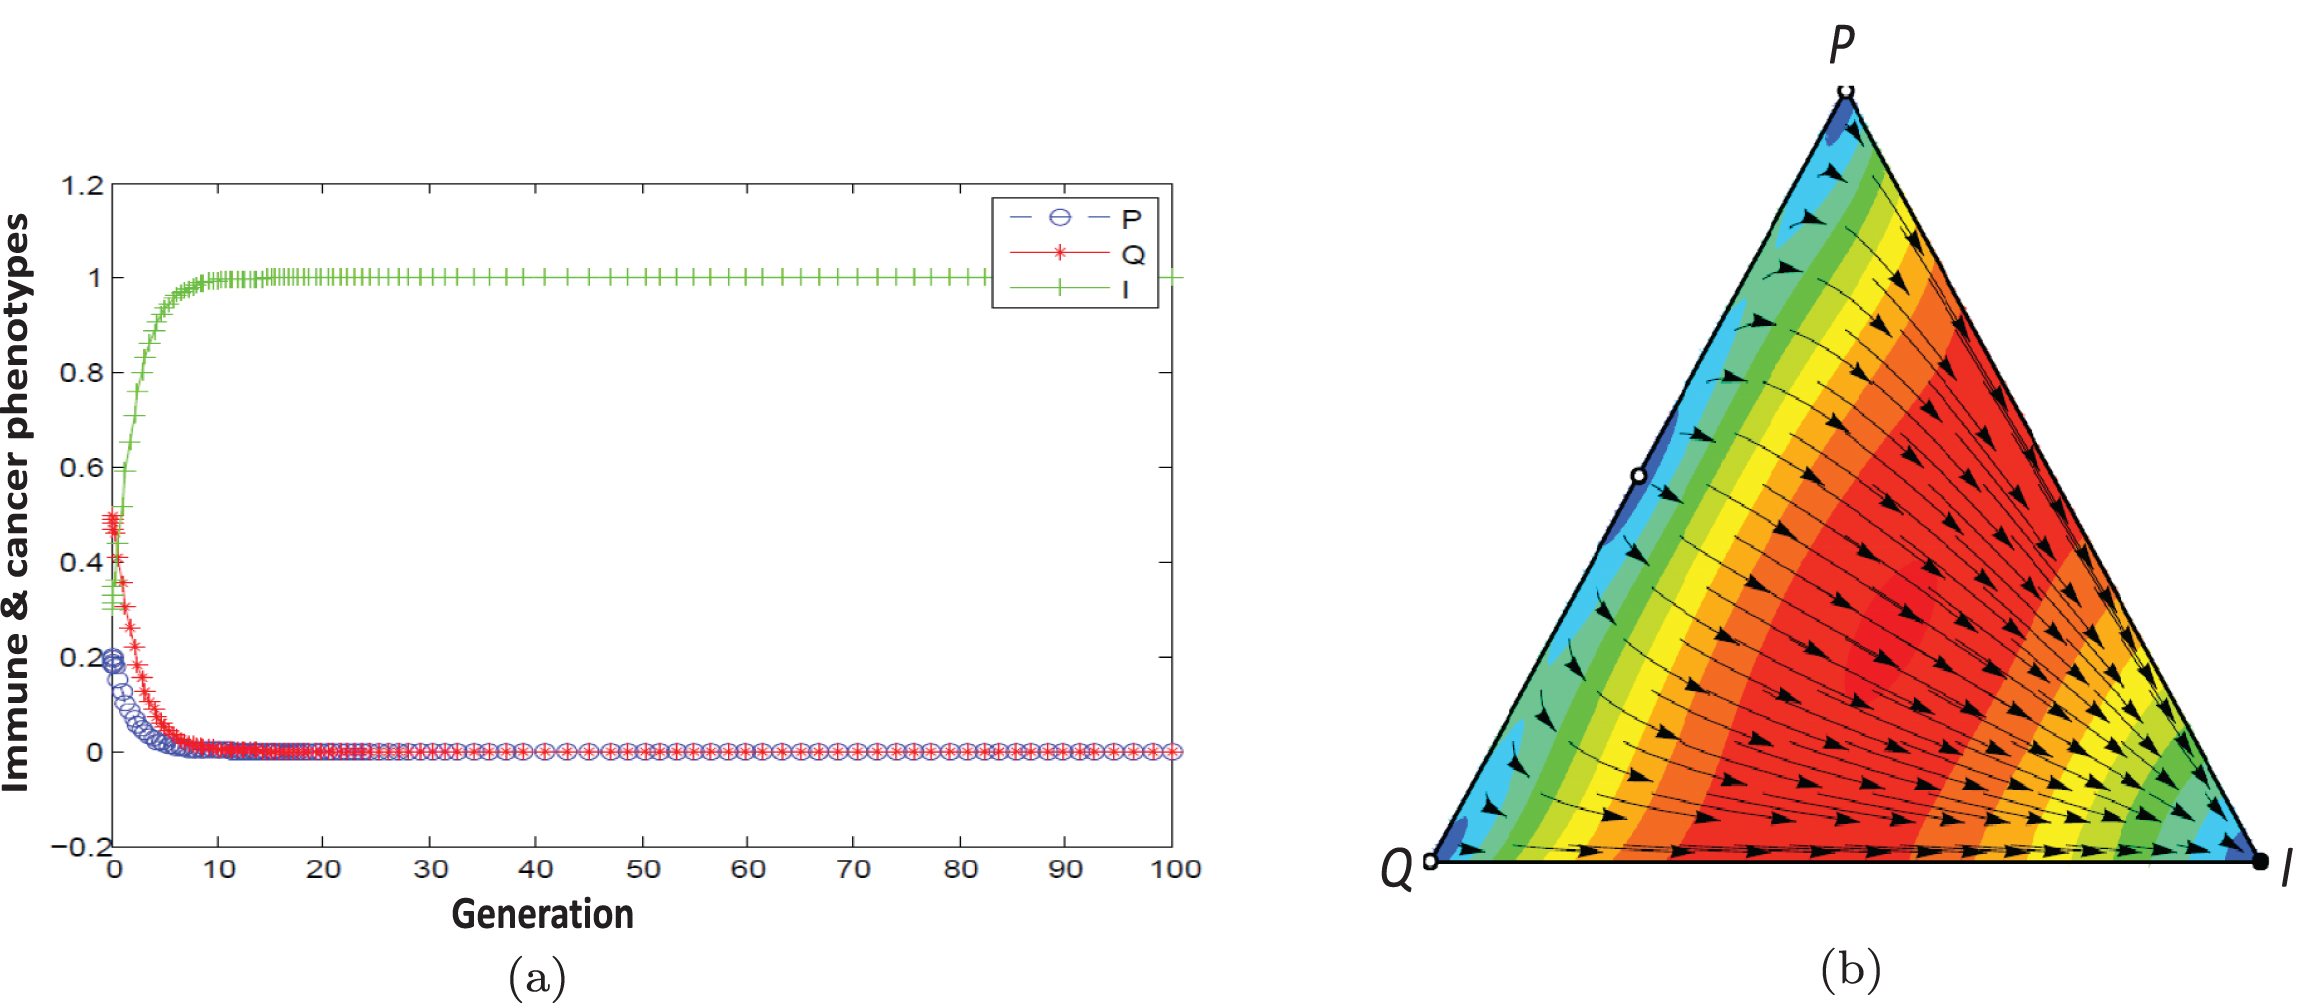
Fig. 7
a) Population dynamic in the escape phase without considering therapy. b) With considering therapy, population dynamic is leading to the elimination state (m = 0.7854).
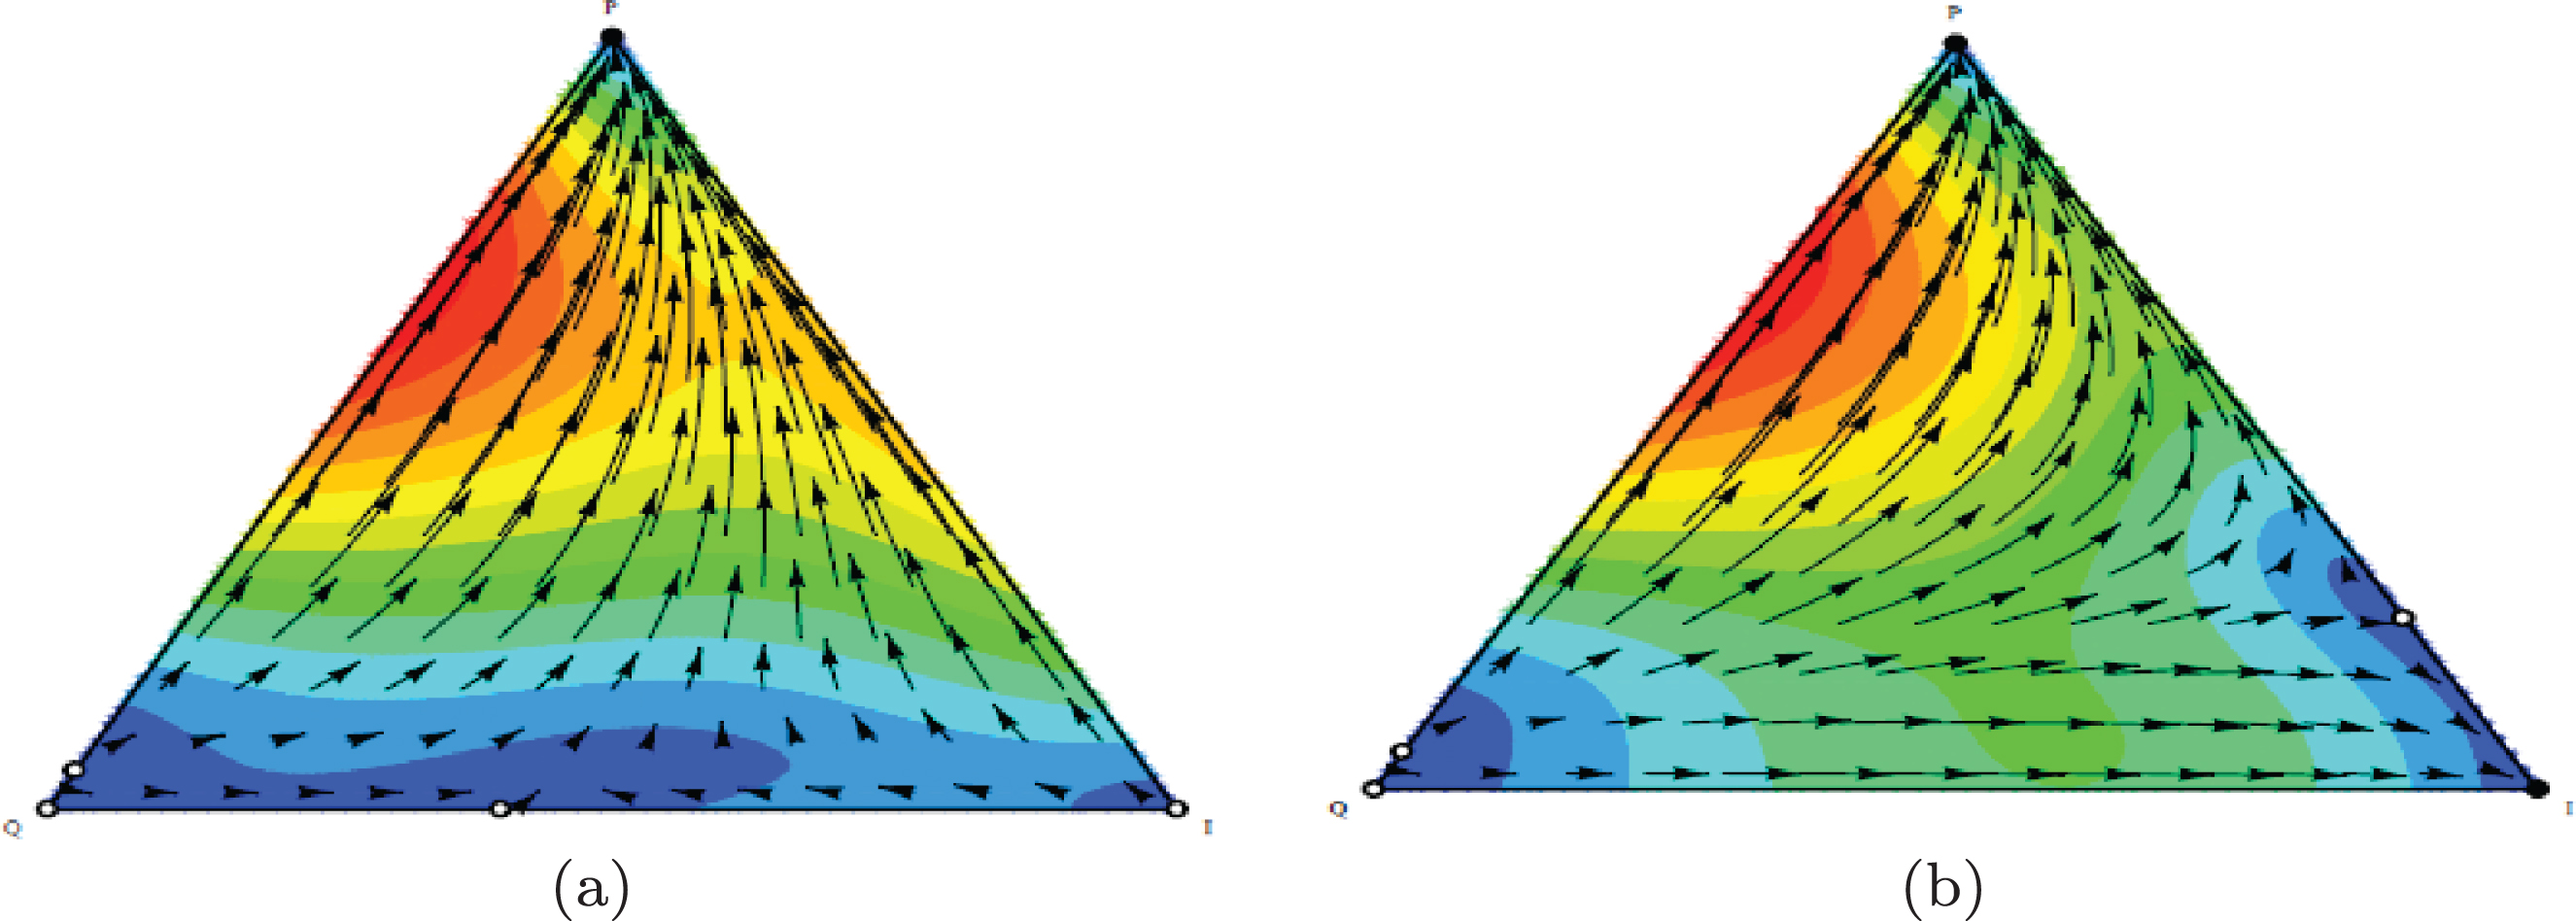
Fig. 8
a) Population dynamic in the equilibrium phase without considering therapy. b) With considering therapy, population dynamic is leading to the elimination state (m = 0.5).
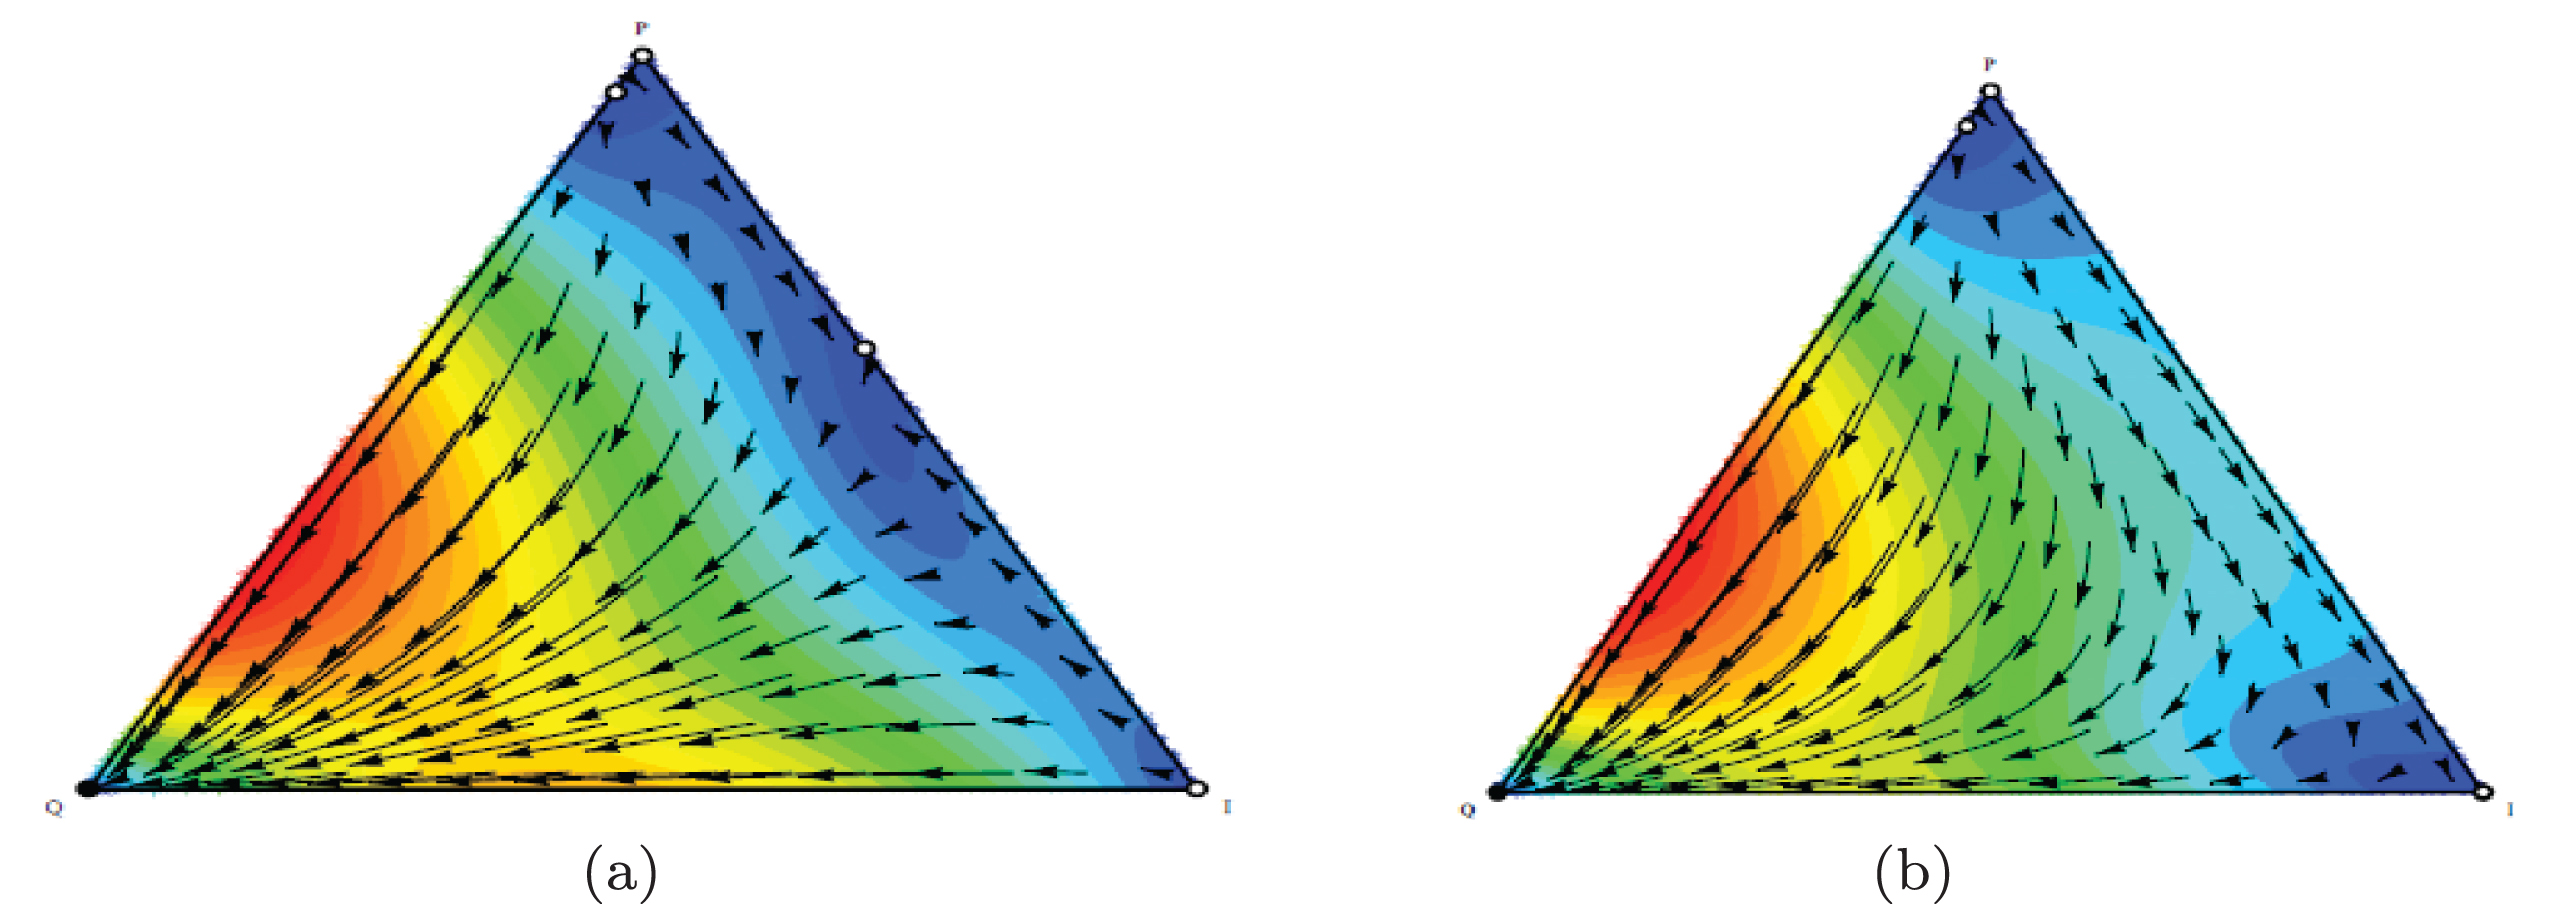
Table 4
Reward matrix for a patient in escape state with Bortezomib therapy
| Phenotype | P | Q | I |
| P | 2 | 0.9 | 1-cos 2m |
| Q | 0.1 | 1 | 0.8-cos 2m |
| I | 1 | 1.2 | 0.5 |
5Discussion
Therapy methods like surgery and radiotherapy have a limited impact on the survival of patients. Different immunotherapy strategies have been developed, based on the use of dendritic cells, antibodies and peptide vaccination. Bortezomib, a proteasome inhibitor, is a chemotherapeutic drug that is commonly used to treat a variety of human cancers that has shown clinical activity in several human tumors, including myeloma. By using Bortezomib the uptake of human myeloma cells in myeloma cancer by dendritic cells (DCs) after tumor cell death, but not irradiation or steroids, results in to the induction of antitumor immunity, including against primary tumor cells, without the need for any additional adjuvants [36]. Treatment of tumor cells with bortezomib led to the upregulation of Hsp60 and Hsp90 on the cell surface and promoted their phagocytosis by dendritic cells (DCs) [37]. Bortezomib effects our model parameters C1, C2, γ1, γ2.
Table 5
Reward matrix for a patient in escape state with Bortezomib therapy
| Phenotype | P | Q | I |
| P | 1 | 0.1 | 0.8-cos 2m |
| Q | 0.9 | 2 | 1-cos 2m |
| I | 1.2 | 1 | 0.5 |
We analyze our proposed model using Bortezomib. The patient conditions in escape and equilibrium states are considered and therapy is applied using a periodical treatment. In this analysis, certain threshold values for drug doses are derived that the patient conditions from escape or equilibrium state lead to elimination state. We add a periodical function cos 2m to the general reward matrix for interactions between immune (I), proliferating (P) and quiescent (Q) cells (Table 1) that mimics the periodical dosage. While proliferating and quiescent cells interact with immune cells, injected cytokine kill cancer cells. So, periodical function cos 2m represents the cost of cancer cells which is imposed by cytokine. Table 4 represents the reward matrix for a patient in escape state with considering therapy.
The point (1,0,0) under the condition 0.5 < cos2m < 1.3 is stable for the example. As Figure 7 shows population dynamic direct toward dominant immune and proliferating cells. The patient’s condition can be changed from escape state to elimination state by proceeding more drug doses.
Table 20 represents the reward matrix for a patient in quiescent state with considering therapy.
As shown in the figure the point (1,0,0) under the condition cos 2m > 0.5 is stable. The patient’s conditions can be changed from equilibrium state to elimination state as seen in Figure 8.
6Conclusion
Modeling of cancer disease leads to understand tumor growth process, estimate cancer risk and design effective treatment strategy. In this paper, the interaction between immune system cells and cancer cells has been modeled by evolutionary game theory. Analysis of model has shown three phases of tumor growth process. Model graphs of the population variation have shown the direction of population and finally which strategy has been stable in population. Equilibrium points stability by algebraic analysis has been studied. Therefore, in this model the cancer development process can be well understood and provide the possibility of testing treatment methods on model and find the effective parameters in treatment.
References
[1] | Weinberg R. , The biology of cancer, Garland Science (2013), 334. |
[2] | Hanahan D. and Weinberg R. , Hallmarks of cancer: the next generation, Cell 5: (144) ((2011) ), 646–674. |
[3] | Schreiber R. , Old L. and Smyth M. , Cancer immunoediting: integrating immunitys roles in cancer suppression and promotion, Science 331: ((2011) ), 1565–1570. |
[4] | Kim R. , Emi M. and Tanabe K. , Cancer immunoediting from immune surveillance to immune escape, Immunology 121: ((2007) ), 1–4. |
[5] | Dunn G. , Old L. and Schreiber R. , The three Es of cancer immunoediting, Annu Rev Immunol 22: ((2004) ), 329–360. |
[6] | Chen D. , Jiao Y. and Torquato S. , A cellular automaton model for tumor dormancy: emergence of a proliferative switch, PloS One 9: ((2014) ), e109934. |
[7] | Kansal A. , Torquato S. , Harsh G.R. , Chiocca Iv E.A. and Deisboeck T.S. , Cellular automaton of idealized brain tumor growth dynamics, Biosystems 55: ((2000) ), 119–127. |
[8] | Mansury Y. , Diggory M. and Deisboeck T.S. , Evolutionary game theory in an agent-based brain tumor model: exploring the genotypephenotypelink, Journal of Theoretical Biology 238: ((2006) ), 146–156. |
[9] | Pacheco J. , Santos F. and Dingli D. , The ecology of cancer from an evolutionary game theory perspective, Interface Focus 4: ((2014) ), 20140019. |
[10] | Liu Q. and Liu Z. , Malignancy through cooperation: an evolutionary game theory approach, Interface Focus 45: ((2012) ), 365–377. |
[11] | Tomlinson I. and Bodmer W. , Modelling the consequences of interactions between tumour cells, British Journal of Cancer 75: ((1997) ), 157. |
[12] | Basanta D. , Scott J.G. , Fishman M.N. , Ayala G. , Hayward S.W. and Anderson A.R. , Investigating prostate cancer tumourstroma interactions: clinical and biological insights from an evolutionary game, British Journal of Cancer 106: ((2012) ), 174–181. |
[13] | Basanta D. and Deutsch A. , A game theoretical perspective on the somatic evolution of cancer, In Selected Topics in Cancer Modeling (2008), 1–16. |
[14] | Kaznatcheev A. , Scott J. and Basanta D. , Edge effects in game-theoretic dynamics of spatially structured tumours, Journal of The Royal Society Interface 12: ((2015) ), 20150154. |
[15] | Sartakhti Salimi, S. ; Manshaei, M.H. and Sadeghi, M. , MMP-TIMP interactions in cancer invasion: An evolutionary game-theoretical framework, Journal of Theoretical Biology 412: ((2017) ), 17–26. |
[16] | Sartakhti Salimi J. , Manshaei M.H. , Basanta D. and Sadeghi M. , Evolutionary emergence of angiogenesis in avascular tumors using a spatial public goods game, PloS One 12: ((2017) ), e0175063. |
[17] | Sartakhti Salimi J. , Manshaei M.H. , Bateni S. and Archetti M. , Evolutionary dynamics of tumor-stroma interactions in multiple myeloma, PloS One 12: ((2016) ), e0168856. |
[18] | Moore H. and Li N.K. , A mathematical model for chronic myelogenous leukemia (CML) and T cell interaction, Journal of Theoretical Biology 227: ((2004) ), 513–523. |
[19] | Evans N.D. , Errington R.J. , Shelley M. , Feeney G.P. , Chapman M.J. , Godfrey K.R. , Smith P.J. and Chappell M.J. , A mathematical model for thekinetics of the anti-cancer agent topotecan, Mathematical Biosciences 189: ((2004) ), 185–217. |
[20] | Wilkie K.P. , A review of mathematical models of cancerimmune interactions in the context of tumor dormancy, In Systems Biology of Tumor Dormancy. Springer (2013), 201–234. |
[21] | Wang Z. , Birch C.M. , Sagotsky J. and Deisboeck T.S. , Cross-scale, cross-pathway evaluation using an agent-based non-small cell lung cancer model, Bioinformatics 25: ((2009) ), 2389–2396. |
[22] | Osborne M.J. and Rubinstein A. , A course in game theory. MIT press; ((1994) ). |
[23] | Smith J.M. , Evolution and the Theory of Games, Cambridge university press; ((1982) ). |
[24] | Wodarz D. and Komarova N. , Lecture notes and mathematical modeling, World Scientific (2005). |
[25] | Gatenbee C. , West J. , Baker A.M. , Guljar N. , Jones L. , Graham T.A. , Robertson-Tessi Anderson M. and Alexander R.A. , Macrophage-mediated immunoediting drives ductal carcinoma evolution: Space is the game changer. bioRxiv 2019 Cold Spring Harbor Laboratory. |
[26] | Teng M. , Swann J. , Koebel C. , Schreiber R. and Smyth M. , Immune-mediated dormancy: an equilibrium with cancer, Journal of Leukocyte Biology 84: ((2008) ), 988–993. |
[27] | Dunn G. , Bruce A. , Ikeda H. , Old L. and Schreiber R. , Cancer immunoediting: from immunosurveillance to tumor escape, Nature Immunology 3: ((2002) ), 991–998. |
[28] | Smith J. , The theory of games and the evolution of animal conicts, Journal of Theoretical Biology 47: ((1974) ), 209–221. |
[29] | Shuster S. and Wade M. , Mating systems and strategies. Princeton University Press; ((2003) ). |
[30] | Murphy K. and Weaver C. , Janeway’s immunobiology. Garland Science; (2016). |
[31] | Sandholm W. , Population games and evolutionary dynamics. MIT presspublisher-name; ((2010) ). |
[32] | Li X. , Mou C. , Niu W. and Wang D. , Stability analysis for discrete biological models using algebraic methods, Mathematics in Computer Science 5: ((1974) ), 247–262. |
[33] | Niu W. and Wang D. , Algebraic approaches to stability analysis of biological systems, Mathematics in Computer Science 1: ((2008) ), 507–539. |
[34] | Sotolongo-Costa O. , Molina L. , Perez D. , Antoranz J. and Reyes M.C. , Behavior of tumors under nonstationary therapy, Physica D: Nonlinear Phenomena 178: ((2003) ), 242–253. |
[35] | De Vries J. and Figdor C. , Immunotherapy: Cancer vaccine triggers antiviral-type defences, Nature (2016). |
[36] | Spisek R. , Charalambous A. , Mazumder A. , Vesole D. , Jagannath S. and Dhodapkar M. , Bortezomib enhances dendritic cell (DC)-mediated induction of immunity to human myeloma via exposure of cell surface heat shock protein 90 on dying tumor cells: therapeutic implications, Blood (2007), 4839–4845. |
[37] | Chang C. , Hsu Y. , Wu C. , Yang Y. , Wang C. , Wu T. and Hung C. , Immune mechanism of the antitumor effects generated by bortezomib, The Journal of Immunology (2012), 3209–3220. |
[38] | Basanta D. , Scott J.G. , Rockne R. , Swanson K.R. and Anderson A.R. , The role of IDH1 mutated tumour cells in secondary glioblastomas: an evolutionary game theoretical view, Physical Biology (2011), 015016. |
[39] | Archetti M. , Evolutionary game theory of growth factor production: implications for tumour heterogeneity and resistance to therapies, British Journal of Cancer (2013), 1056–1062. |
[40] | Taylor P.D. and Jonker L.B. , Evolutionary stable strategies and game dy594 namics, Mathematical Biosciences (1978), 145156. |
[41] | Page K. and Uhr J. , Mathematical models of cancer dormancy, Leukemia and Lymphoma 46: (3) ((2005) ), 313327. |
[42] | Michelson S. and Leith J.T. , Dormancy, regression, and recurrence: towards a unifying theory of tumor growth control, Journal of Theoretical Biology 169: (4) ((1994) ), 327338. |
[43] | Alt W. , Deutsch A. and Dunn G. , Dynamics of cell and tissue motion, Birkhuser ((2012) ). |
[44] | Shoham Y. and Leyton-Brown K. , Multiagent systems: Algorithmic, game-theoretic, and logical foundations, Cambridge University Press. ((2008) ). |
[45] | Korolev K.S. , Xavier J.B. and Gore J. , Turning ecology and evolution against cancer, Nature Reviews Cancer 14: (5) ((2014) ), 371–380. |
[46] | Wu A. , Liao D. , Tlsty T.D. , Sturm J.C. and Austin R.H. , Game theory in the death galaxy: interaction of cancer and stromal cells in tumour microenvironment, Interface Focus 4: (4) ((2014) ), 2014–2028. |
[47] | Nowell P.C. , The clonal evolution of tumor cell populations, Science 194: (4260) ((1976) ), 23–28. |
[48] | Gerstung M. , Nakhoul H. and Beerenwinkel N. , Evolutionary games with affine fitness functions: applications to cancer, Dynamic Games and Applications 1: (3) ((2011) ), 370–385. |
[49] | Dingli D. , Chalub F.A.C.C. , Santos F.C. , Van Segbroeck S. and Pacheco J.M. , Cancer phenotype as the outcome of an evolutionary game between normal and malignant cells, British Journal of Cancer 101: (7) ((2009) ), 1130–1136. |
[50] | Nowak M.A. and Sigmund K. , Evolutionary dynamics of biological games, Science 303: (5659) ((2004) ), 793–799. |
[51] | Hofbauer J. and Sigmund K. , Evolutionary games and population dynamics, Cambridge university press ((1998) ). |
Notes
2 A mixed strategy profile induces a probability on the pure strategy profile. By mixed strategy a player can randomly chose a pure strategy. There exist infinite number of mixed strategies for a player, because probabilities are continuous.
3 A symmetric game is a game in which each player obtains the same payoff when choosing the same strategy against similar strategies of his opponent. In other word, the payoffs only depend on the players strategies not on who is playing them.


