
Clinical machine learning predicting best stroke rehabilitation responders to exoskeletal robotic gait rehabilitation
Abstract
BACKGROUND:
Although clinical machine learning (ML) algorithms offer promising potential in forecasting optimal stroke rehabilitation outcomes, their specific capacity to ascertain favorable outcomes and identify responders to robotic-assisted gait training (RAGT) in individuals with hemiparetic stroke undergoing such intervention remains unexplored.
OBJECTIVE:
We aimed to determine the best predictive model based on the international classification of functioning impairment domain features (Fugl– Meyer assessment (FMA), Modified Barthel index related-gait scale (MBI), Berg balance scale (BBS)) and reveal their responsiveness to robotic assisted gait training (RAGT) in patients with subacute stroke.
METHODS:
Data from 187 people with subacute stroke who underwent a 12-week Walkbot RAGT intervention were obtained and analyzed. Overall, 18 potential predictors encompassed demographic characteristics and the baseline score of functional and structural features. Five predictive ML models, including decision tree, random forest, eXtreme Gradient Boosting, light gradient boosting machine, and categorical boosting, were used.
RESULTS:
The initial and final BBS, initial BBS, final Modified Ashworth scale, and initial MBI scores were important features, predicting functional improvements. eXtreme Gradient Boosting demonstrated superior performance compared to other models in predicting functional recovery after RAGT in patients with subacute stroke.
CONCLUSION:
eXtreme Gradient Boosting may be an invaluable prognostic tool, providing clinicians and caregivers with a robust framework to make precise clinical decisions regarding the identification of optimal responders and effectively pinpoint those who are most likely to derive maximum benefits from RAGT interventions.
1Introduction
Although clinical machine learning (ML) algorithms offer promising potential in forecasting optimal stroke rehabilitation outcomes, their specific capacity to ascertain favorable outcomes and identify responders to robotic-assisted gait training (RAGT) in individuals with hemiparetic stroke undergoing such intervention remains unexplored. Thakkar et al. (2020) used ML models to forecast the prognostic sensorimotor functional recovery based on three key predictors in 239 individuals with chronic hemiparetic stroke who received a comprehensive task-oriented intervention, including RAGT. Kuo et al. (2021) applied ML models to ascertain the functional ambulatory category outcome based on demographic and clinical characteristics (e.g., onset time, side of the lesion, age, sex, diagnosis, and initial functional ambulatory category) and RAGT parameters (e.g., body weight support, guiding force, and speed) in 91 individuals with stroke, spinal cord injury, traumatic brain injury, and other neurological disorders. These studies reported good to excellent accuracy (85.42–98.23%). However, clinical ML predicting best stroke rehabilitation responders to exoskeletal RAGT remains unknown because the baseline international classification of functioning (ICF) clinical functional (e.g., Fugl– Meyer assessment (FMA), Modified Barthel Index (MBI), and Berg balance scale (BBS)) were not accounted to best predict the model. In fact, the initial impairment level has been used to identify subacute stroke patients who are more likely to experience proportional recovery, where the amount of recovery is proportional to the initial impairment according to the Proportional Recovery Rule (Kundert et al., 2019; Bowman et al., 2021; Krakauer & Marshall, 2015). Moreover, it remains unknown which ML algorithms are the best to predict the best stroke rehabilitation responders in individuals with subacute hemiparetic stroke who received RAGT based on the ICF clinical functional and structural impairments-related features (Thakkar et al., 2020). Therefore, there is a need to develop special tree-based ML algorithms to predict the best responders for RAGT stroke rehabilitation based on the baseline demographic and clinical impairment features. Our aim was to develop the predictive models based on the ICF clinical functional and structural impairment measure-related features in patients with subacute stroke and determine their responsiveness to RAGT.
2Materials and methods
2.1Study design
This was an observational cohort study that used secondary analysis of data from our previous ongoing projects. Data screening was performed by three investigators. Two investigators determined the eligibility and completeness of the data. Patients that completed the interventions and outcome measurements at pre- and post-intervention were included for analysis during 01.01.2022∼01.01.2023.
2.2Participants
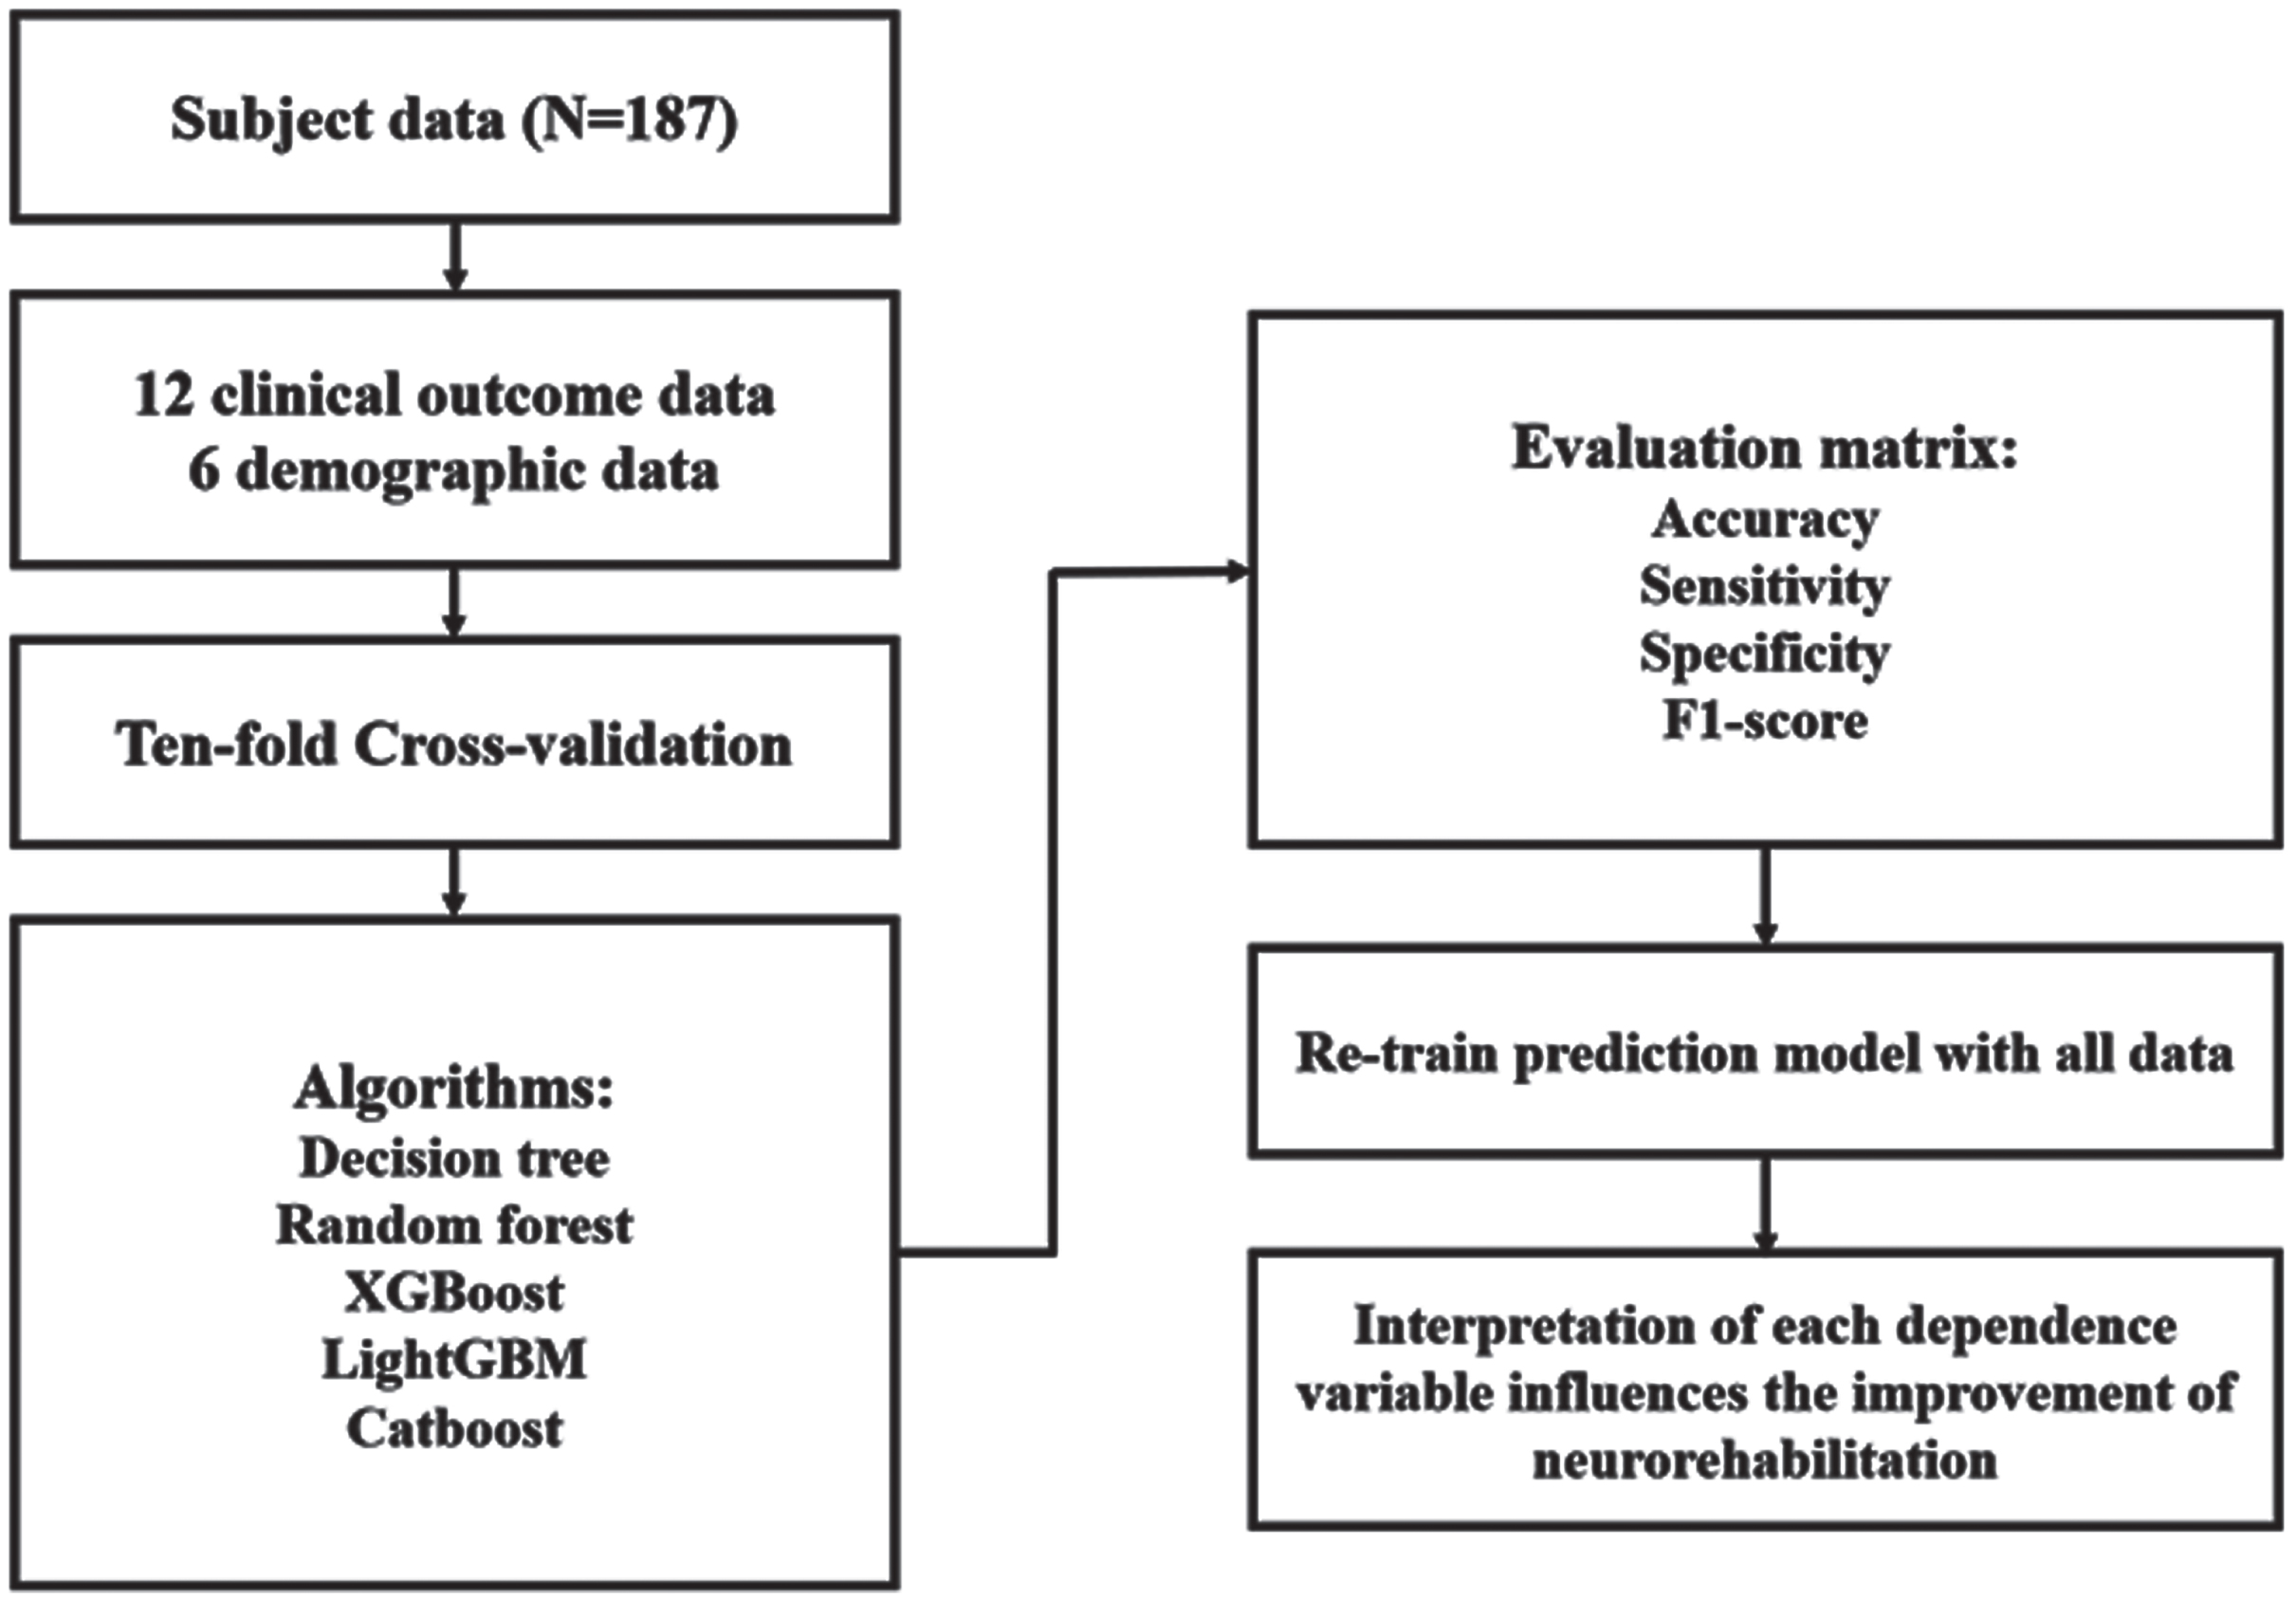
In total, 187 patients with subacute stroke (mean age, 64±13.33 years; sex, 111 male and 76 female individuals) were recruited from a major hospital in masked for review. Tables 2 and 3 outline the characteristics of patients with hemiparetic stroke. The inclusion and exclusion criteria are presented in Supplementary file 1. Interestingly, 51.3% (n = 91) of the 187 patients with stroke exhibited good improvement, while the rest demonstrated the poor improvement. An experienced physical therapist was consistently conducted all outcome measurements. All participants provided their informed consent prior to the initiation of clinical trials. This study was conducted in accordance with the tenets of the Declaration of Helsinki. The present study protocol was approved by the Institutional Review Board of Chungdam Rehabilitation Hospital Center (CDIRB-2023-004). The study flowchart is presented in Fig. 1.
Fig. 1
The study flowchart.
2.3Potential predictors
We selected the 18 potential predictors based on ICF to include “Body function” and “Activity.” We compiled data on 12 clinical outcomes and six demographic features, reflecting the patient’s body function and activity domain. The six demographic data were: (1) age, (2) sex, (3) side of the lesion, (4) onset time, (5) height, and (6) weight. The 12 clinical outcome data were: (1) initial FMA, (2) final FMA, (3) initial BBS, (4) final BBS, (5) initial MBI, (6) final MBI, (7) initial MMSE, (8) final MMSE, (9) initial trunk impairment scale (TIS), (10) final TIS, (11) initial modified Ashworth scale (MAS), and (12) final MAS scores (Tamura et al., 2022; Zeltzer, 2010; Verheyden et al., 2004; Loewen & Anderson, 1988; Blackburn et al., 2002; Bour et al., 2010). Interestingly, the MAS measurements specifically targeted the ankle plantar flexor muscles. In both research and clinical contexts, these features are commonly utilized to gauge the rehabilitation recovery of patients with stroke (Tamura et al., 2022; Zeltzer, 2010; Verheyden et al., 2004; Loewen & Anderson, 1988; Blackburn et al., 2002; Bour et al., 2010).
2.4Feature importance analysis
To investigate the feature importance among the various input features, the five ML algorithms were used to forecast good or poor functional and structural improvement in individuals with subacute stroke who underwent RAGT (compared to the first session) and elucidate how certain features influence the improvement after RAGT. Feature importance is a valuable metric, offering a quantitative measure of the impact each predictor variable on the target outcome, extracting the clinical insights (Kuo et al., 2021). For a comprehensive evaluation, our study compared among the feature importance values derived from the decision tree (DT) model and ensemble model based on the DT model, including random forest (RF), eXtreme Gradient Boosting (i.e., XGBoost [XGB]), the light gradient boosting machine (i.e., LightGBM [LGB]), and the categorical boosting (i.e., Catboost [Cat]). Subsequently, a comparative analysis was performed to ascertain the consistency in feature importance rankings across the different models.
We also constructed partial dependence plots (PDP) to identify the most influential features and characterize the contribution of each feature to the initial ability of individuals with subacute stroke, visualizing the relationship between these features and the model’s predicted outcome (Kuo et al., 2021; Zheng et al., 2022).
2.5Machine learning algorithms and hyperparameter tunning
In our analysis, we considered a set of 18 predictors. The primary objectives of this study were (1) to determine the best predictive model for categorizing stroke patients into “good” and “poor” functional and structural improvement groups based on their response to Walkbot RAGT intervention and (2) identify key features that significantly influence individuals with subacute stroke recovery who underwent RAGT. For our ML analysis, we deployed five distinct models. These models were chosen for their capability in handling the binary and multiple classification tasks effectively, as well as for their proven ability to discern feature importance. Such features are instrumental in understanding combined factors related to the prognosis of structural recovery, balance function, and overall independence-related ambulation in patients with subacute stroke (Fujita et al., 2020).
It is important to highlight that while RF adopts a bagging ensemble approach, XGB, LGB, and Cat use the boosting ensemble methodology. These ensemble models have been extensively applied in various clinical domains, showcasing features, such as quick training duration, minimal overfitting, and commendable accuracy (Al Daoud, 2019). To ensure a rigorous evaluation and guard against model overfitting, we adopted the 10-fold cross-validation technique. The dataset was partitioned into 10 subsets: nine of these were utilized for training, with the remaining one reserved for testing (Kuo et al., 2021; Rodríguez et al., 2010).
2.6Classification of individuals with subacute stroke improvement
To effectively examine the degree of patient’s functional and structural improvement, including FMA, BBS, and MBI after RAGT, this study introduces two keys classification criteria: the minimal clinically important difference (MCID) and the four-effect level. MCID is defined as the minimal change in assessment scores that patients perceive as clinically significant in relation to their health status (Cook, 2018). In this research, ICF framework informed our selection of three primary outcomes for evaluation: the FMA, BBS, and MBI. These measures, extensively employed in similar studies, provide a comprehensive insight into a patient’s level of body function and activity domain (Patel et al., 2020). The FMA is a 226-point scale and is divided into five domains (i.e., motor and sensory function, balance, joint range of motion, and joint pain) developed as an evaluation tool for overall recovery from stroke (Pandian et al., 2016). The BBS is a 56-point balance function scale (Tamura et al., 2022). The MBI is a 100-point scale assessing the activities of daily living (Hsieh et al., 2007).
Another classification metric utilized is the four-effect level, which quantifies the impact of the Walkbot RAGT. Four-effect level ranges from 0 to 3, where each number represents the sum of MCID achieved across the FMA, BBS, and MBI: Effect Level 0, 1, 2, and 3 indicate poor, moderate, good, and excellent improvement, respectively. This grading provides a multi-faceted understanding of post-treatment progress, adding depth to the MCID’s binary classification.
2.7Model evaluation metrics
The performance of ML models was evaluated using the standard ML performance metrics including (1) accuracy, (2) recall, (3) precision, and (4) F1 scores (Kuo et al., 2021). The accuracy, recall, precision, and F1 score were defined as follows:
Table 1 represents the confusion matrix. Accuracy is an overall index of prediction performance. Sensitivity is the ratio of participants who were correctly identified as positive by the model to those who were actually positive. Precision is the ratio of participants who were correctly identified as positive by the model to those who were labeled as positive by the model. F1 scores are the harmonic mean of precision and recall and are a combination index. The F1 score, ranging between 0 and 1, indicates the classification performance, with a higher value approaching 1 indicating better classification accuracy (Hsieh et al., 2007).
Table 1
Confusion matrix
| Actual | |||
| Positive | Negative | ||
| Predicted | Positive | True positive | False positive |
| Negative | False negative | True negative | |
2.8Statistical analysis
The categorical variables were coded, and continuous variables were standardized. Google Colaboratory (Google LLC, Mountain View, CA, USA), which is a web integrated development environment for python, was employed for model development and statistical analysis (Sokolova et al., 2009). For continuous variables, means and standard deviation were calculated, and for categorical variables, frequencies and percentages were calculated. The chi-square test and independent t-test were used to compare the categorical and continuous variables between the good and poor improvement groups. The level of significance was set at p < 0.05.
3Results
3.1Significant differences were observed in RAGT parameters in the two study groups
Descriptive statistical analyses of continuous and categorical variables of the 187 patients with hemiparetic stroke in Tables 2 and 3, respectively. Age, initial Mini-Mental State Examination (MMSE), final MMSE, initial FMA, final FMA, initial BBS, final BBS, initial MBI, final MBI, initial TIS, and final TIS scores were significantly different between the “good-improvement group” and the “poor-improvement group”. The onset time, weight, height, and all categorical variables did not significantly differ between the two groups.
Table 2
Descriptive statistics of categorical variables for the good or poor functional and structural improvement groups in RAGT
| Continuous variable | Poor improvement (N = 91) | Good improvement (N = 96) | p-value | |||
| n | % | n | % | |||
| Diagnosis | Hemorrhagic | 50 | 52.08 | 55 | 60.44 | 0.3156 |
| Infarction | 46 | 47.92 | 36 | 39.56 | ||
| Side of the lesion | Right | 44 | 45.83 | 41 | 45.05 | 1.0000 |
| Left | 52 | 54.17 | 50 | 54.95 | ||
| Sex | Male | 53 | 55.21 | 58 | 63.74 | 0.2994 |
| Female | 43 | 44.79 | 33 | 36.26 | ||
| Initial MAS | 0 | 22 | 22.92 | 29 | 31.87 | 0.0546 |
| 1 | 39 | 40.62 | 47 | 51.65 | ||
| +1 | 25 | 26.04 | 14 | 15.38 | ||
| 2 | 3 | 3.12 | 0 | 0.0 | ||
| 3 | 5 | 5.21 | 1 | 1.1 | ||
| 4 | 1 | 1.04 | 0 | 0.0 | ||
| 5 | 1 | 1.04 | 0 | 0.0 | ||
| Final MAS | 0 | 23 | 23.96 | 31 | 34.07 | 0.0977 |
| 1 | 40 | 41.67 | 46 | 50.55 | ||
| +1 | 23 | 23.96 | 11 | 12.09 | ||
| 2 | 3 | 3 | 2 | 2.2 | ||
| 3 | 4 | 4 | 1 | 1.1 | ||
| 4 | 2 | 2 | 0 | 0.0 | ||
| 5 | 1 | 1 | 0 | 0.0 | ||
MAS, Modified Ashworth scale. *p < 0.05.
Table 3
Descriptive statistics of continuous variables for the good or poor functional and structural improvement groups in RAGT
| Continuous variable | Poor improvement (N = 91) | Good improvement (N = 96) | p-value | ||
| Mean | SD | Mean | SD | ||
| Onset time | 5.2812 | 7.1623 | 3.7582 | 3.8133 | 0.0734 |
| Age | 67.2708 | 11.135 | 61.8352 | 11.8455 | 0.0014 * |
| Height | 163.8646 | 8.7439 | 165.7253 | 8.8657 | 0.1502 |
| Weight | 61.6167 | 9.3104 | 64.0088 | 11.2908 | 0.1149 |
| Initial MMSE | 16.2500 | 10.3110 | 21.6813 | 8.3983 | 0.0001 ** |
| Final MMSE | 17.3646 | 9.9706 | 24.3407 | 7.3200 | 0.0000 ** |
| Initial FMA | 21.6458 | 23.5519 | 30.7692 | 24.6008 | 0.0403 * |
| Final FMA | 23.625 | 23.5655 | 37.4615 | 25.8665 | 0.0005 ** |
| Initial BBS | 7.2396 | 11.3571 | 10.8791 | 10.5555 | 0.0246 * |
| Final BBS | 8.1042 | 8.5156 | 21.2418 | 11.7760 | 0.0000 ** |
| Initial MBI | 28.1146 | 19.1211 | 41.4066 | 19.4998 | 0.0000 ** |
| Final MBI | 33.0208 | 20.4131 | 53.5385 | 16.4630 | 0.0000 ** |
| Initial TIS | 4.4271 | 5.4052 | 7.3407 | 5.6080 | 0.0004 ** |
| Final TIS | 5.9271 | 6.0354 | 11.0879 | 6.0436 | 0.0000 ** |
BBS, Berg balance scale; FMA, Functional motor assessment; MMSE, Mini mental state examination; SD, standard deviation; TIS, Trunk impairment scale. *p < 0.05, **p < 0.01.
3.2Model performance
The predictive performances of different ML algorithms with 10-fold cross-validation using different numbers of input sessions to predict the improvements in FMA, BBS, and MBI’s MCID of the 12th session are delineated in Table 4. The XGB algorithm resulted in achieving the high performance of 0.8015, 0.7910, 0.8344, and 0.8010 in accuracy, sensitivity, specificity, and F1 score, respectively (Table 4a). We investigated whether there were significant differences in the means of the accuracy, sensitivity, and specificity between the ML models. In Table 4b, the accuracies from different ML model evaluated by 10-fold-cross validation for four levels were ranked from the highest to the lowest as follows: RF, 0.5192; LGB, 0.5082; XGB, 0.5020; Cat, 0.4857; and DT, 0.4216. Comparing the results outlined in Table 4a, the experimental findings revealed that employing all sessions as input to forecast improvements in FMA, BBS, and BMI’s MCID specifically by the 12th session provided a more detailed estimation. This approach aimed to discern whether an outcome variable performed below a certain threshold, as opposed to a binary classification of improvement. This enhanced granularity in estimation was attributed to the utilization of a greater number of classes for prediction.
Table 4
Prediction performance of models
| (a) Prediction performance of model to predict three outcome changes by 10-fold cross-validation | ||||
| Algorithms | Accuracy | Sensitivity | Specificity | F1 score |
| Decision tree | 0.6994 | 0.7070 | 0.6700 | 0.6847 |
| Random forest | 0.7798 | 0.7823 | 0.8033 | 0.7830 |
| XGBoost | 0.8015 | 0.7910 | 0.8344 | 0.8010 |
| LightGBM | 0.7801 | 0.7966 | 0.7911 | 0.7754 |
| CatBoost | 0.7801 | 0.7735 | 0.8033 | 0.7793 |
| (b) Prediction performance of model to predict the effect level changes by 10-fold cross-validation | ||||
| Decision tree | 0.4216 | 0.3630 | 0.3571 | 0.3507 |
| Random forest | 0.5191 | 0.3897 | 0.4083 | 0.3760 |
| XGBoost | 0.5020 | 0.4383 | 0.4298 | 0.4196 |
| LightGBM | 0.5082 | 0.4339 | 0.4304 | 0.4155 |
| CatBoost | 0.4857 | 0.3762 | 0.3857 | 0.3615 |
3.3Model interpretation
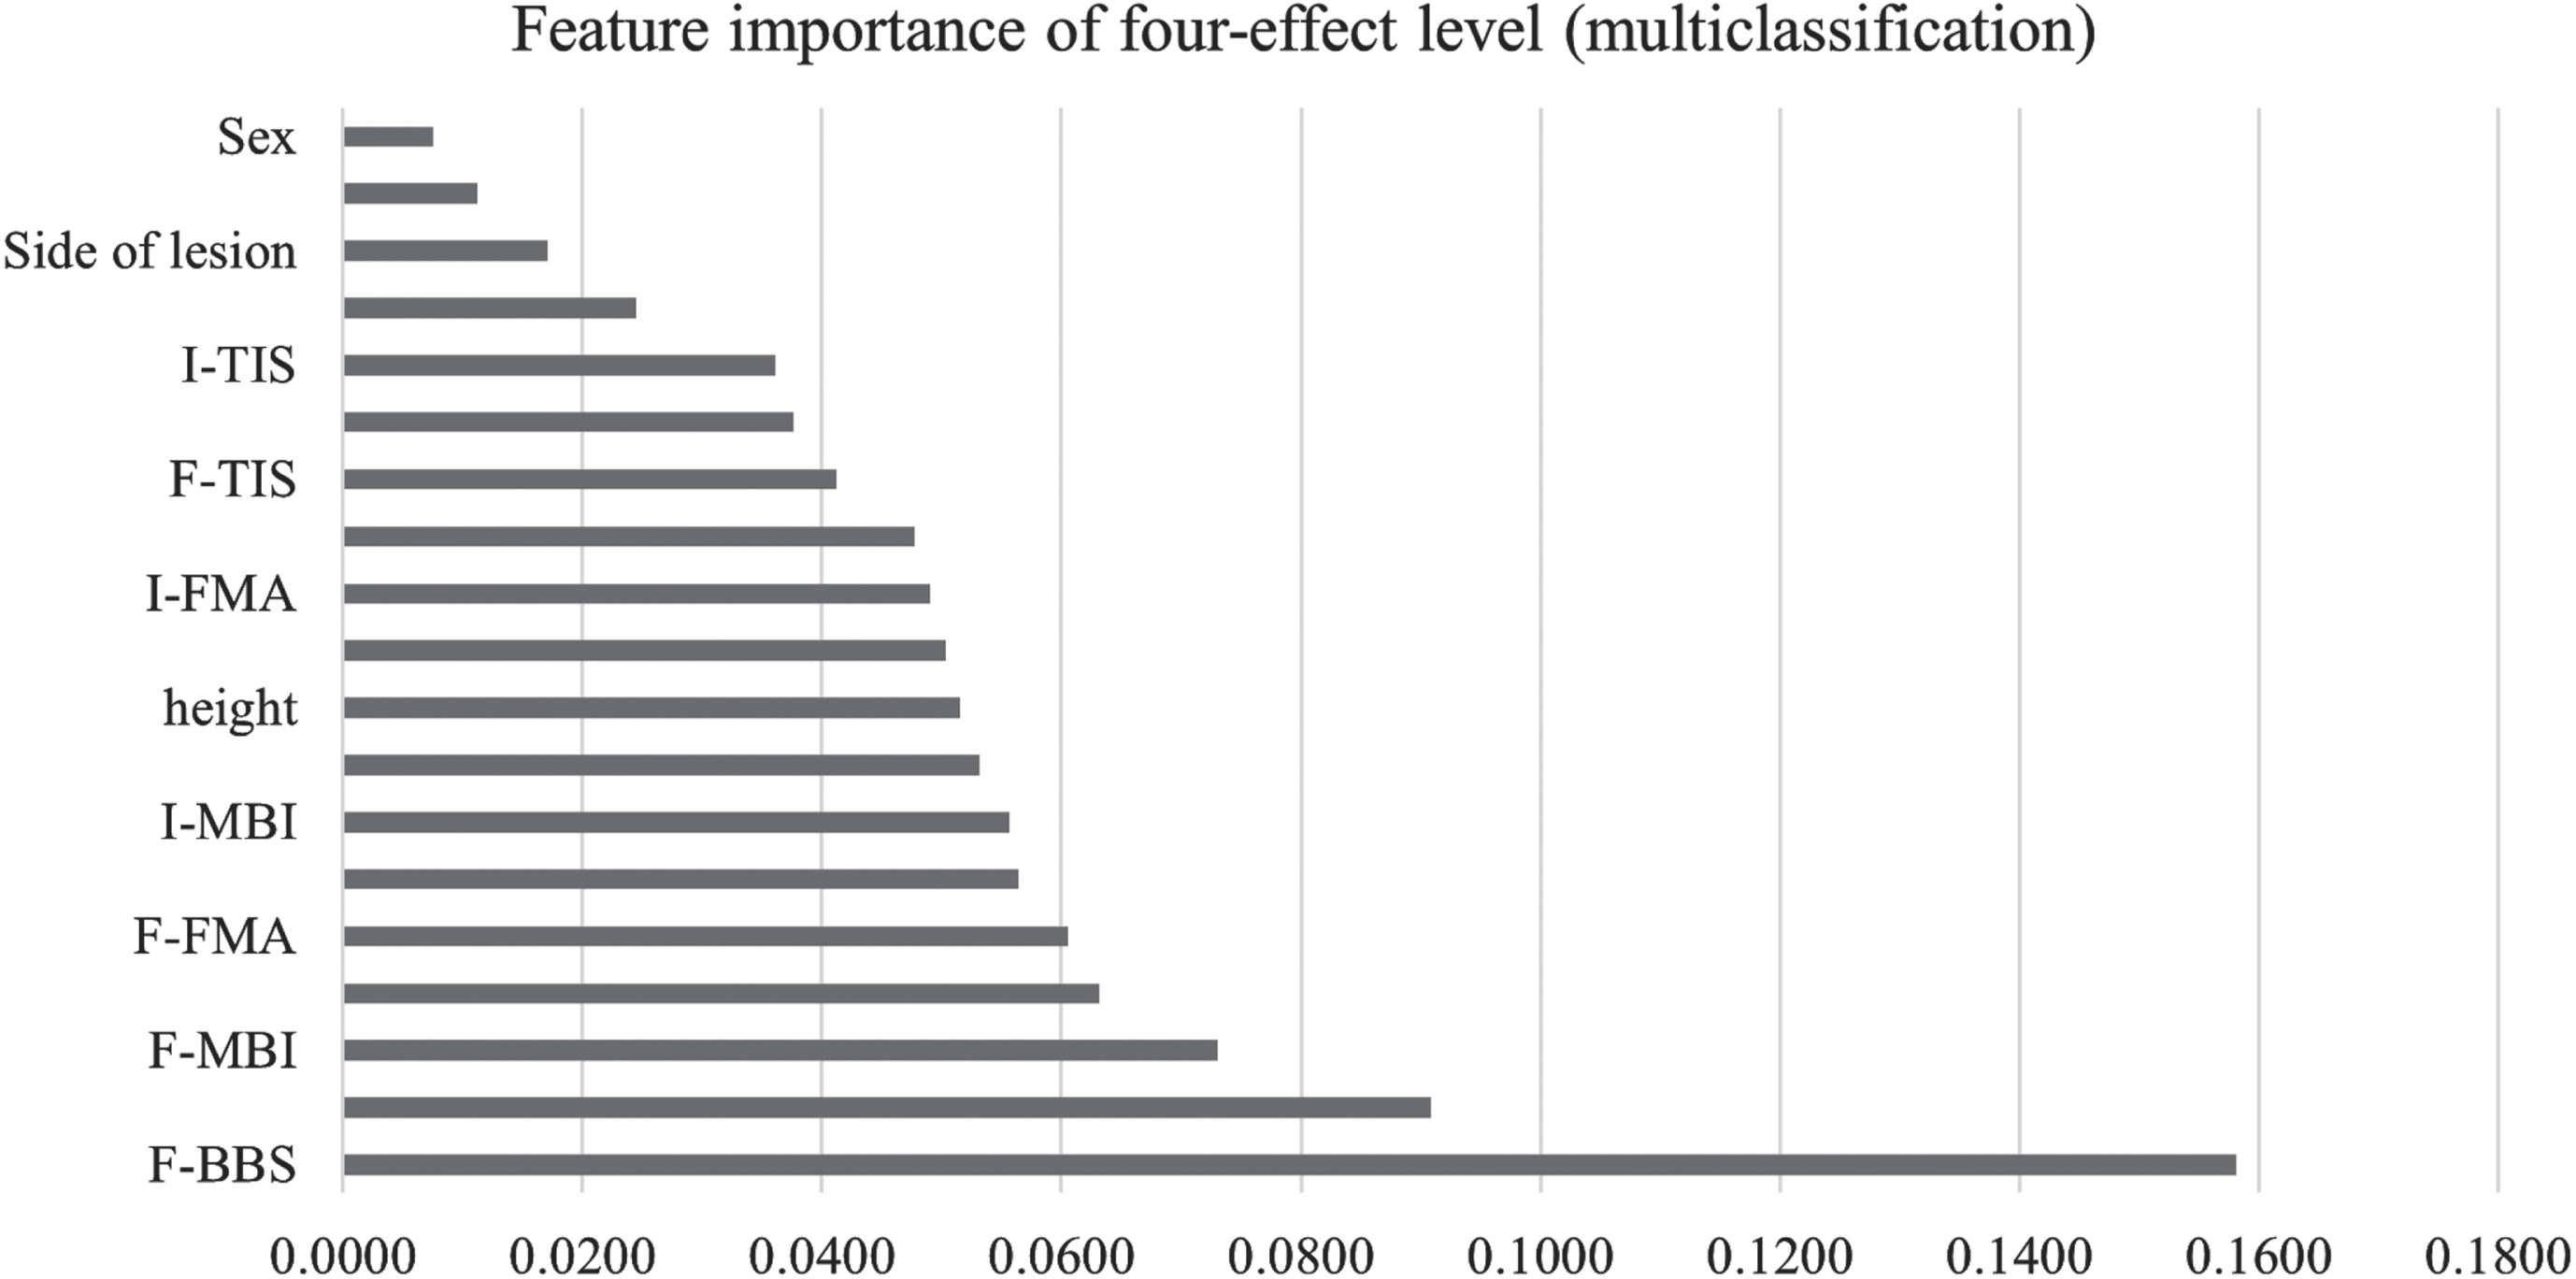
The contribution of features in the five ML models with best performance is summarized in supplementary file 2. The feature importance among the five models was similar. The average of the feature importance is presented in Fig. 2a and 2b. The primary four features in the MCID model, ranked by importance, are final BBS, initial BBS, initial MBI, and final MAS scores. In contrast, the effect level model prioritizes the following top four features by importance: final BBS, initial BBS, final MAS, and initial MBI scores.
Fig. 2a
Feature importance of MCID (binary classification).
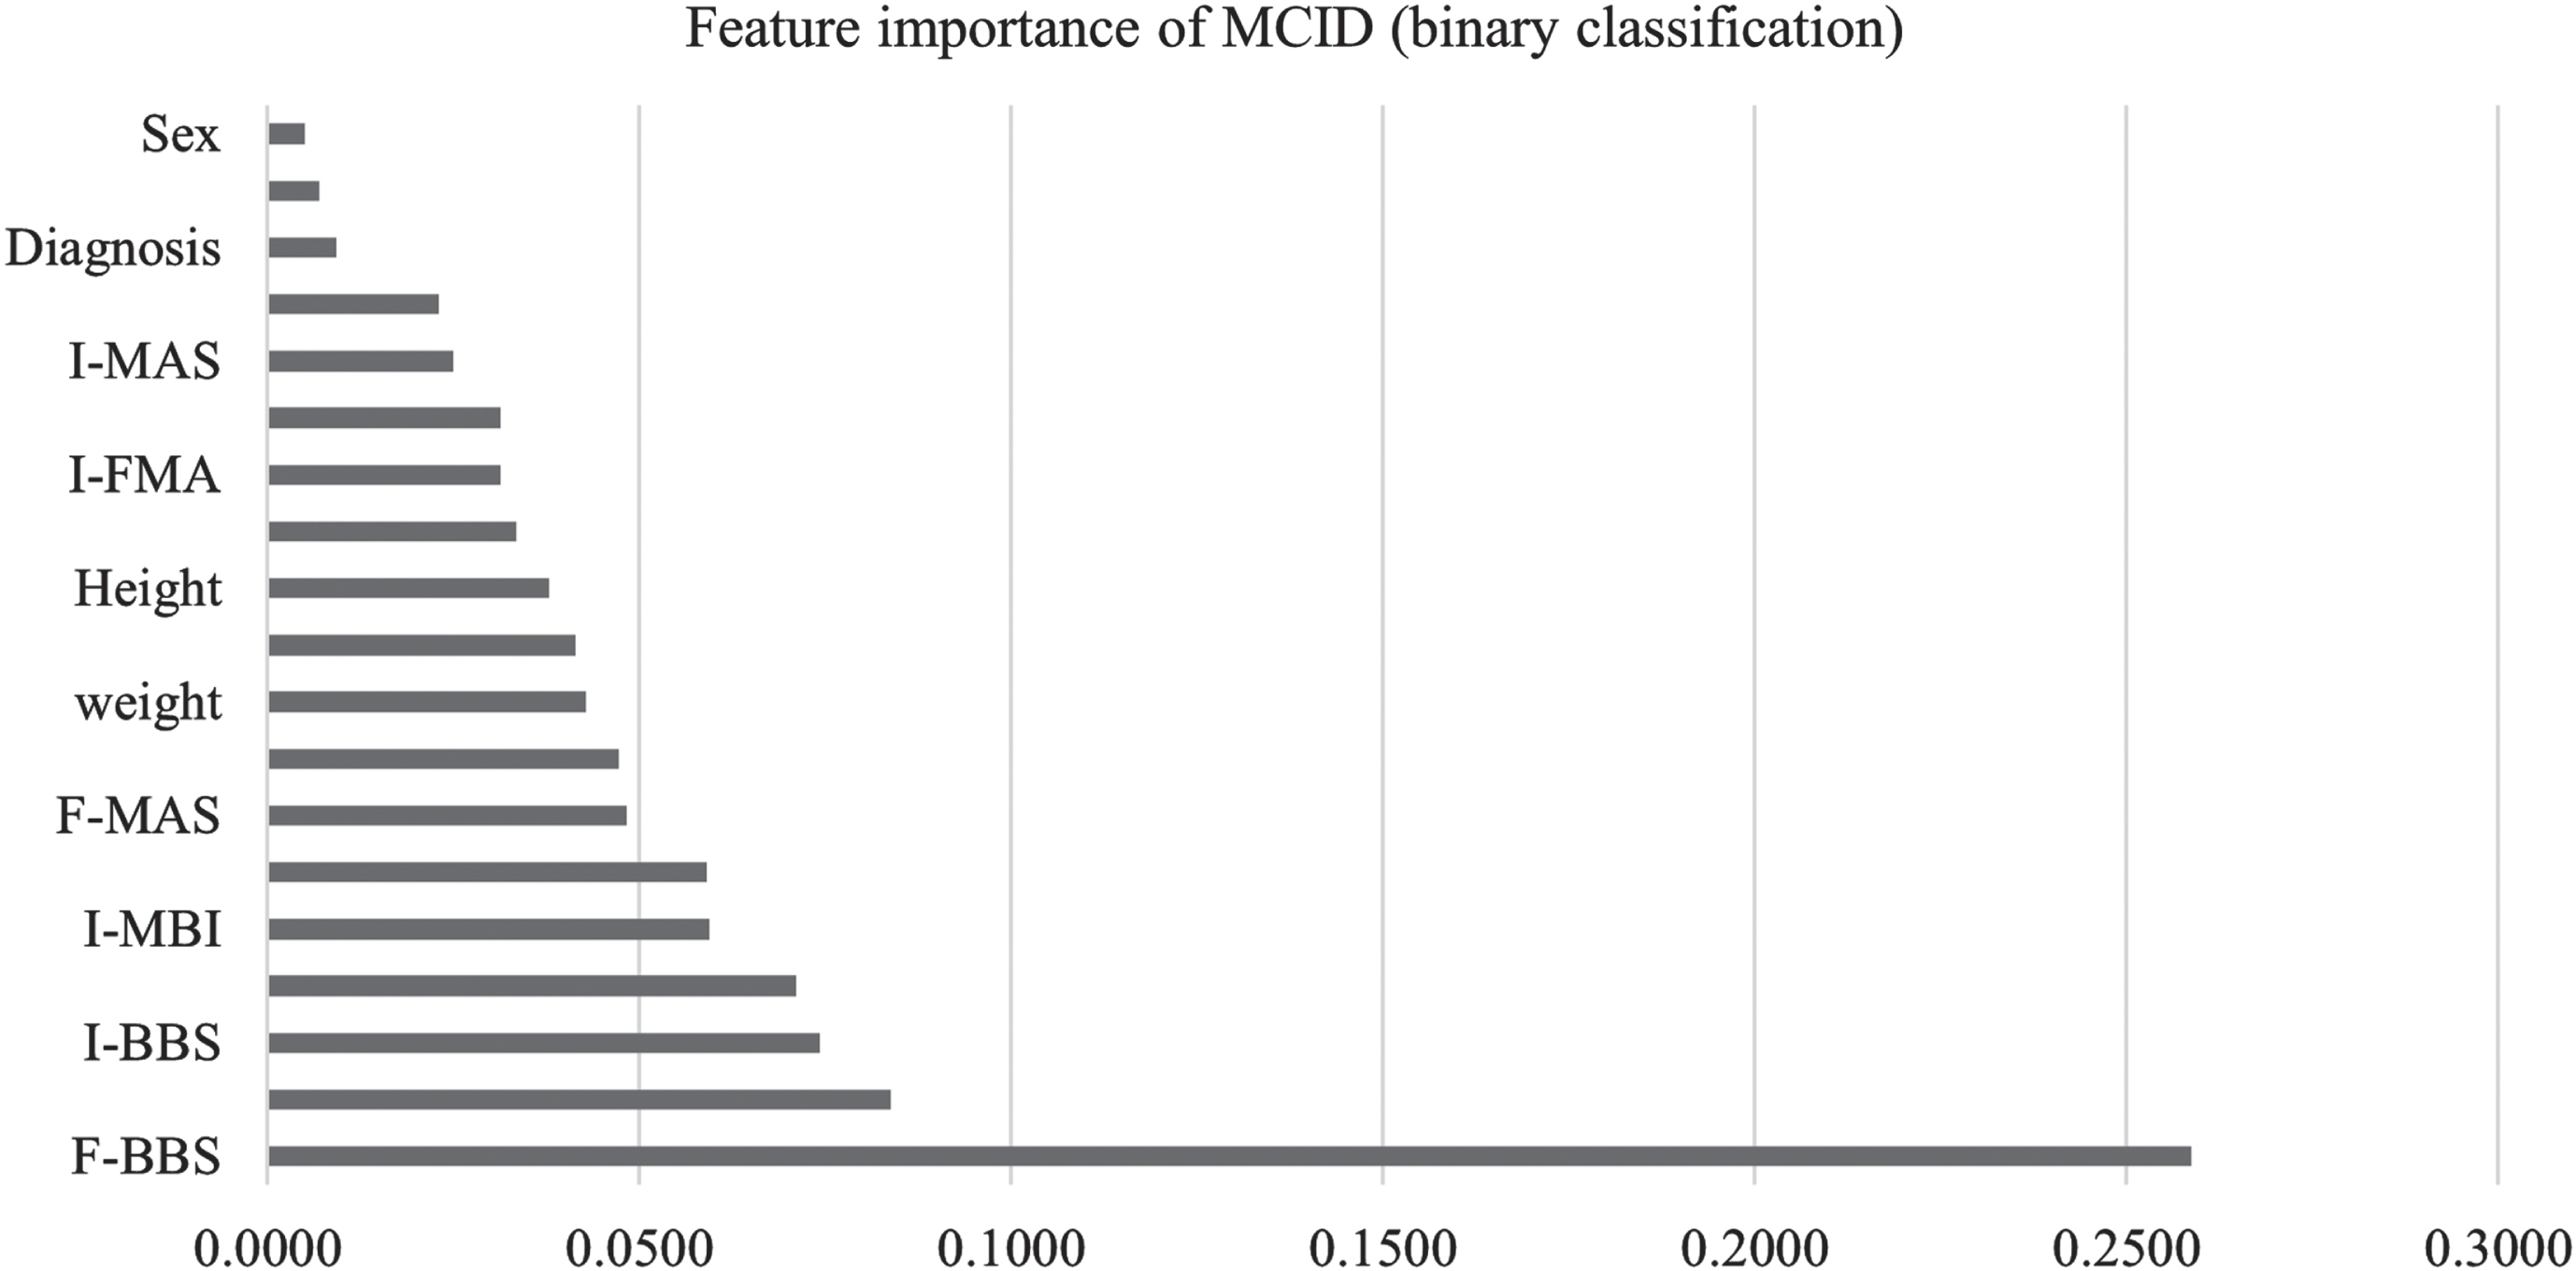
Fig. 2b
Feature importance of four-effect level (multiclassiffication).
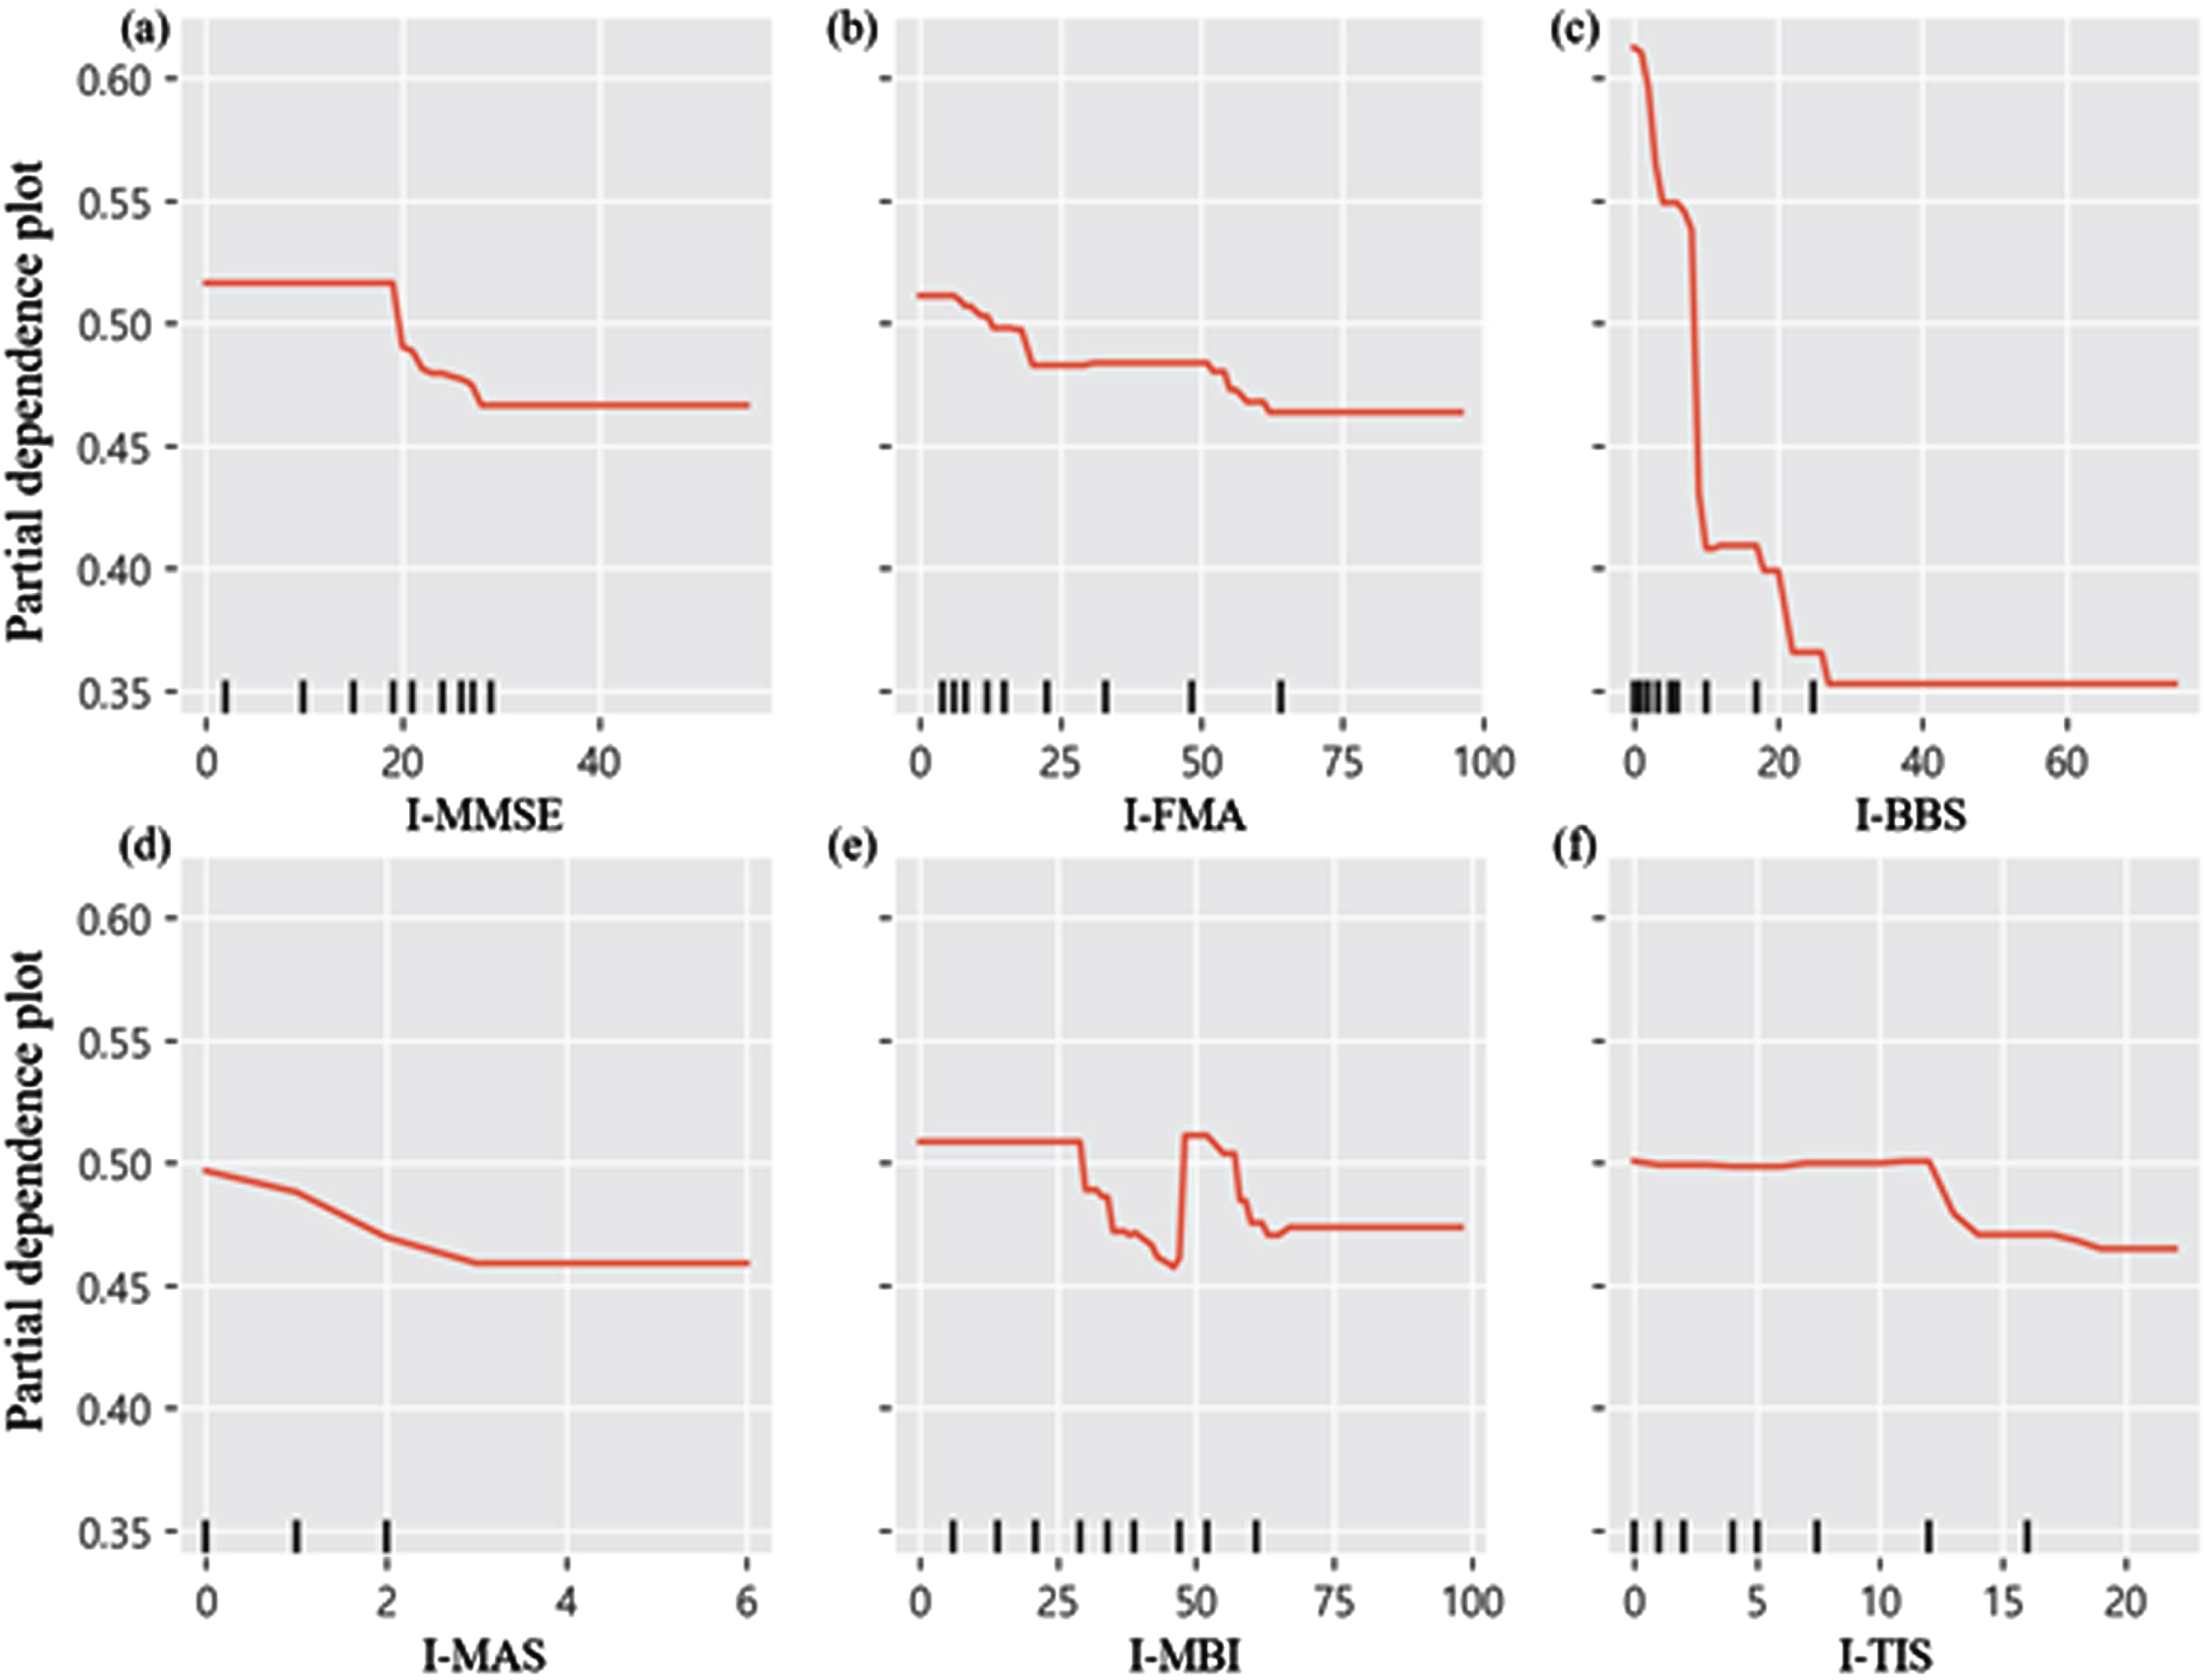
As shown in Fig. 3 and supplementary file 3∼6, in accordance with the PDP, we can see that the initial BBS, MAS, and TIS scores were negatively associated with ICF structural and functional domain improvements. We demonstrated a positive correlation, indicating that a higher median value of initial FMA, initial MMSE, and initial MBI corresponds to a greater likelihood of observing substantial improvement. The effect level model’s PDP is similar to that of the MCID model’s PDP in supplementary file 7.
Fig. 3
Partial dependence plot of initial clinical outcomes.
4Discussion
To our knowledge, this clinical ML study is the first to highlight the performance of ML algorithms on accurately predicting best responders who underwent RAGT interventions among 187 patients with subacute hemiparetic stroke based on the demographic and ICF clinical functional and structural impairment-related features. Most importantly, the XGB model out of the five ML algorithms was capable of predicting binary classification based on clinical functional and structural measures (i.e., FMA, BBS, and MBI) with good accuracy (80%). Furthermore, we discovered the four key features derived from the final BBS, initial BBS, final MAS, and initial MBI scores for predicting the good or poor improvement in the ICF functional and structural impairment domains. PDP analysis indicated that lower scores in initial BBS, MAS, and TIS are more indicative of optimal responders. Conversely, the median scores in initial FMA, initial MMSE, and initial MBI are more closely associated with optimal responders.
The accuracy of the XGB had good prediction performance on binary classification, which could distinguish between the good and poor responders to RAGT with 80% chances. Such a good prediction performance may have resulted from the utilization of the unique tree-boosting approach in the process of XGB modeling (Kuroki, 2021). The XGB algorithm is an ensemble model of weak learners, the DT that updates the weights using gradient descent, during the tree-boosting modeling process, thereby avoiding or reducing overfitting by early stopping with XGB at an optimal epoch (Kuroki, 2021). The ML data of the previous study corroborate the earlier clinical ML evidence, demonstrating 85% accuracy performance with the application of the XGB algorithm in the good and poor responders in neurological conditions from acute to chronic (Thakkar et al., 2020). Although this study’s prediction accuracy was slightly higher than ours, the stage for patients with neurological issues— particularly stroke— is clinically significant. The results of clinical outcome variables are different according to the stage of poststroke who underwent RAGT intervention. According to the progression of stroke, the clinical outcome variables of those with chronic stroke were less apparent than those of patients with acute/subacute stroke (Kundert et al., 2019; Bowman et al., 2021; Krakauer & Marshall, 2015). Our study included cases of subacute stroke, which is feasible and applicable for those who are expected to the superior clinical improvement after RAGT intervention. Future research could lead to predictive model studies of neurologically impaired patients with gait disorders, such as cerebral palsy, spinal cord injury, and Parkinson’s disease.
Furthermore, we discovered four key features obtained from final BBS, initial BBS, final MAS, and initial MBI outcome measures for predicting the good or poor improvements in the ICF functional and structural impairments domains. Initial baseline balance function may be a key feature in predicting function ambulation recovery in subacute stroke with a prediction accuracy of 74.1% (Zheng et al., 2023; Bland et al., 2012; Tsang & Mak, 2004; Kwakkel et al., 1996). The initial BBS score is another outcome measure for forecasting motor and cognitive enhancement in individuals with subacute stroke (Chang et al., 2021). The initial Barthel index features, such as dressing and bathing item-related ambulation, were also observed to be excellent in prognosticating functional independence of the individuals with stroke with a prediction accuracy of 74.1% (De Wit et al., 2014). The final MAS score in the plantar flexor spasticity was another feature that may accurately predict functional gait recovery in the early stage in individuals with post-stroke who underwent RAGT (De Wit et al., 2014; Lamontagne et al., 2003).
PDP analysis demonstrated that the lower score of initial BBS, initial MAS, and initial TIS, the median score of initial FMA, initial MMSE, and initial MBI is more likely to best responders. The initial BBS (<20 points), MAS (< +1 point), and TIS (<13 points) scores indicated that patients with subacute stroke with a lower level of balance ability (higher risk of falling), lower level of plantar flexor spasticity, lower level of trunk motor ability, a median of stroke recovery stage, lower level of cognitive impairment, and MBI scores of > 44 and < 60 points tend to have more functional and structural improvement. Certainly, our findings showed that, in patients with subacute stroke, the initial score of the functional measures can be used to predict functional and structural improvement prior to RAGT intervention. These features might be useful indicators for helping clinicians and caregivers identify individuals with subacute stroke who can benefit most from RAGT interventions.
4.1Study limitations
Our study had two main limitations. First, the focus was primarily on body function, structure, and activity domains of the ICF framework, suggesting the need for future research to explore “participation restriction” and other contextual factors. Second, the study did not explore a range of potential ML models that could further enhance prediction of gait-related impairments, indicating a direction for future studies to optimize predictive analytics in rehabilitation.
5Conclusion
Leveraging advanced ML technology, our study highlights the XGB algorithm’s effectiveness in predicting functional and structural recovery in patients with subacute stroke after RAGT. Demonstrating superiority over other algorithms, it is ideal for clinical implementation. Key predictive markers, such as the initial low BBS, MAS, and TIS scores, as well as the median scores of FMA, MMSE, and MBI, are critical for determining patient response to RAGT. These insights significantly enhance patient selection for RAGT, revolutionizing stroke gait rehabilitation and care optimization.
Conflict of interest
The authors do not have any conflict of interest to disclose related to this manuscript.
Informed consent
This study was conducted in accordance with the tenets of the Declaration of Helsinki. The present study protocol was approved by the Institutional Review Board of Chungdam Rehabilitation Hospital Center (CDIRB-2023-004). All participants provided informed consent prior to the initiation of clinical trials.
Funding
This study was supported by the Brain Korea 21 PLUS Project Grant (No. 2021-51-0151), a National Research Foundation of Korea (NRF) grant funded by the Korean government (MSIT) (No. RS-2023-00221762), ‘Regional Innovation Strategy (RIS)’ through the NRF funded by the Ministry of Education (MOE) (2022RIS-005), the Institute for Project-Y Seed Grant of 2023 (No. 2023-22-0277), and the Department of Physical Therapy, Graduate School, Yonsei University.
SUPPLEMENTARY MATERIAL
[1] The supplementary material is available in the electronic version of this article: https://dx.doi.org/10.3233/NRE-240070.
REFERENCE
1 | Al Daoud, E. ((2019) ). Comparison between XGBoost, LightGBM and CatBoost using a home credit dataset. International Journal of Computer and Information Engineering, 13: (1), 6–10. |
2 | Blackburn, M. , Van Vliet, P. , Mockett, S. P. ((2002) ). Reliability of measurements obtained with the modified Ashworth scale in the lower extremities of people with stroke. Physical Therapy, 82: (1), 25–34. |
3 | Bland, M. D. , Sturmoski, A. , Whitson, M. , Connor, L. T. , Fucetola, R. , Huskey, T. ,... Lang, C. E. ((2012) ). Prediction of discharge walking ability from initial assessment in a stroke inpatient rehabilitation facility population. Archives of Physical Medicine and Rehabilitation, 93: (8), 1441–1447. |
4 | Bour, A. , Rasquin, S. , Boreas, A. , Limburg, M. , Verhey, F. ((2010) ). How predictive is the MMSE for cognitive performance after stroke? Journal of Neurology, 257: , 630–637. |
5 | Bowman, H. , Bonkhoff, A. , Hope, T. , Grefkes, C. , Price, C. ((2021) ) Inflated estimates of proportional recovery from stroke: the dangers of mathematical coupling and compression to ceiling. Stroke, 52: (5), 1915–1920. |
6 | Chang, S. C. , Chu, C. L. , Chen, C. K. , Chang, H. N. , Wong, A. M. , Chen, Y. P. , Pei, Y. C. ((2021) ). The comparison and interpretation of machine-learning models in post-stroke functional outcome prediction. Diagnostics, 11: (10), 1784. |
7 | Cook, C. E. ((2008) ). Clinimetrics corner: the minimal clinically important change score (MCID): a necessary pretense. Journal of Manual & Manipulative Therapy, 16: (4), 82E–83E. |
8 | De Wit, L. , Putman, K. , Devos, H. , Brinkmann, N. , Dejaeger, E. , De Weerdt, W ,... Schupp, W. ((2014) ). Long-term prediction of functional outcome after stroke using single items of the Barthel Index at discharge from rehabilitation centre. Disability and Rehabilitation, 36: (5), 353–358. |
9 | Fujita, T. , Ohashi, Y. , Kurita, M. , Yamane, K. , Yamamoto, Y. , Sone, T. ,... Iokawa, K. ((2020) ) Functions necessary for gait independence in patients with stroke: A study using decision tree. Journal of Stroke and Cerebrovascular Diseases 29: (8), 104998. |
10 | Hsieh, Y. W. , Wang, C. H. , Wu, S. C. , Chen, P. C. , Sheu, C. F. , Hsieh, C. L. ((2007) ). Establishing the minimal clinically important difference of the Barthel Index in stroke patients. Neurorehabilitation and Neural Repair 21: (3), 233–238. |
11 | Krakauer, J. W. , Marshall, R. S. ((2015) ). The proportional recovery rule for stroke revisited. Annals of Neurology, 78: (6), 845–847. |
12 | Kundert, R. , Goldsmith, J. , Veerbeek, J. M. , Krakauer, J. W. , Luft, A. R. ((2019) ). What the proportional recovery rule is (and is not): methodological and statistical considerations. Neurorehabilitation and Neural Repair, 33: (11), 876–887. |
13 | Kuo, C. Y , Liu, C. W , Lai, C. H , Kang, J. H , Tseng, S. H , Su, E. C. Y. ((2021) ). Prediction of robotic neurorehabilitation functional ambulatory outcome in patients with neurological disorders. Journal of NeuroEngineering and Rehabilitation, 18: (1), 174. |
14 | Kuroki, M. ((2021) ). Using Python and Google Colab to teach undergraduate microeconomic theory. International Review of Economics Education, 38: , 100225. |
15 | Kwakkel, G. , Wagenaar, R. C. , Kollen, B. J. , Lankhorst, G. J. ((1996) ). Predicting disability in stroke— a critical review of the literature. Age and Ageing, 25: (6), 479–489. |
16 | Lamontagne, A. , Malouin, F. , Richards, C. L. , Dumas, F. ((2002) ). Mechanisms of disturbed motor control in ankle weakness during gait after stroke. Gait & Posture, 15: (3), 244–255. |
17 | Loewen, S. C. , Anderson, B. A. ((1988) ). Reliability of the modified motor assessment scale and the Barthel index. Physical Therapy, 68: (7), 1077–1081. |
18 | Pandian, S. , Arya, K. N. , Kumar, D. ((2016) ). Minimal clinically important difference of the lower-extremity fugl– meyer assessment in chronic-stroke. Topics in Stroke Rehabilitation, 23: (4), 233–239. |
19 | Patel, K. , Straudi, S. , Yee Sien, N. , Fayed, N. , Melvin, J. L. , Sivan, M. ((2020) ). Applying the WHO ICFframework to the outcome measures used in the evaluation of long-term clinical outcomes in coronavirus outbreaks. International Journal of Environmental Research and Public Health 17: (18), 6476. |
20 | Rodriguez, J. D. , Perez, A. , Lozano, J. A. ((2009) ). Sensitivity analysis of k-fold cross validation in prediction error estimation. IEEE transactions on pattern analysis and machine intelligence, 32: (3), 569–575. |
21 | Sokolova, M. , Lapalme, G. ((2009) ). A systematic analysis of performance measures for classification tasks. Information Processing & Management, 45: (4), 427–437. |
22 | Tamura, S. , Miyata, K. , Kobayashi, S. , Takeda, R. , Iwamoto, H. ((2022) ). The minimal clinically important difference in Berg Balance Scale scores among patients with early subacute stroke: a multicenter, retrospective, observational study. Topics in Stroke Rehabilitation, 29: (6), 423–429. |
23 | Thakkar, H. K. , Liao, W. W. , Wu, C. Y. , Hsieh, Y. W. , Lee, T. H. ((2020) ). Predicting clinically significant motor function improvement after contemporary task-oriented interventions using machine learning approaches. Journal of NeuroEngineering and Rehabilitation, 17: (1), 131. |
24 | Tsang, Y. L. , Mak, M. K. ((2004) ). Sit-and-reach test can predict mobility of patients recovering from acute stroke. Archives of Physical Medicine and Rehabilitation, 85: (1), 94–98. |
25 | Verheyden, G. , Nieuwboer, A. , Mertin, J. , Preger, R. , Kiekens, C. , De Weerdt, W. ((2004) ). The Trunk Impairment Scale: a new tool to measure motor impairment of the trunk after stroke. Clinical Rehabilitation, 18: (3), 326–334. |
26 | Zeltzer, L. (2010). Fugl-Meyer Assessment of Sensorimotor Recovery After Stroke (FMA). |
27 | Zheng, J. , Li, J. , Zhang, Z. , Yu, Y. , Tan, J. , Liu, Y. ,... Guo, Z. ((2023) ). Clinical Data based XGBoost Algorithm for infection risk prediction of patients with decompensated cirrhosis: a 10-year (2012–2021) Multicenter Retrospective Case-control study. BMC Gastroenterology, 23: (1), 310. |
28 | Zheng, X. , Wang, F. , Zhang, J. , Cui, X. , Jiang, F. , Chen, N. ,... Zou, J. ((2022) ). Using machine learning to predict atrial fibrillation diagnosed after ischemic stroke. International Journal of Cardiology, 347: , 21–27. |


