
Long-term 3D culture of the SCC4 cell line using three different culture methods and initial seeding densities
Abstract
INTRODUCTION:
In recent years, many different methods were introduced for generation of 3D cell culture. However, many currently available three-dimensional techniques are not suitable for certain cell lines and sometimes showed a lack of reproducibility. Therefore, specific protocols for cell lines are needed. In this work, we demonstrate different methods of generating 3D cell culture for SCC4 tongue cancer cell line and discuss their applicability.
MATERIALS AND METHODS:
Using three different methods, tumor spheroids were generated from SCC4 cells and cultured for 20 days. To investigate the influence of initial seeding density on spheroid morphology and size during long term culture, the same set of different cell numbers was used for each method. Using phase-contrast microscopy, spheroids were monitored until day 20 and their sizes were determined.
RESULTS:
We observed that spheroids were formed within 24 hours regardless of the method and initial cell density. Further, in all groups the spheroid size was maximal at day 2, followed by a decline until day 20. Spheroids remained stable until day 20 independent of initial seeding concentration in all groups.
DISCUSSION:
We have generated long-term culture spheroids of SCC4 cells. The size of the spheroids can be influenced by varying the initial cell seeding density until day 20. This may be useful if different sizes of spheroids are required, e.g. in hypoxia research.
1Introduction
Oral squamous cell carcinoma (OSCC) is the sixth most common malignancy worldwide and despite improved patient outcomes in a range of cancers the prognostic implications of OSCC remain poor, especially if diagnosed with late stage cancer [1]. For patients who present with stage I or II of the disease there is an 80% or 65% chance of being cured, respectively [2]. Unfortunately, for the patients who present in the late stages of the disease the prospects are worse since treatment becomes harder and the disease metastasizes to other parts of the body. Stage III is defined as when the tumour can be seen in the lymph nodes and stage IV when the tumour is metastatic throughout the body [3, 4]. The 5-year survival rates for patients who present with stage III or IV are between 10% and 40% [5, 6]. Despite advances in surgical techniques and post-operative therapy, there has been no significant improvement in patient survival rates over the last 20 years [7]. Therefore, there is great need for developments in novel diagnostic and drug delivery systems for OSCC.
In vitro models using cancer cell lines are valuable tools in oral cancer research [8]. Cell-based assays are indispensable in drug discovery to predict the in vivo drug response [9]. Monolayer cell culture models are being intensively used since several decades as simple, fast and cost-effective models to test new substances. However, it was recently shown that only about 7% of the therapeutic substances that have been tested in oncology Phase I clinical trials are effective therapeutics in vivo [10]. It is now well accepted that cells in monolayer cultures tend to lose tissue specific properties and show altered gene expression profiles compared to cells cultured in 3D. This may be a major reason for the limited success in translating preclinical information efficient therapeutics [11].
Since in 3D culturing systems the cells show similar gene expression as compared to their natural environment in vivo, they can more accurately mimic the natural in vivo architecture of tissues and tumours than monolayer cultures [12]. A robust and frequently used form of 3D cultivation is that of spheroids. Similar to tumours, spheroids are comprised of cells in various stages, usually including proliferating, quiescent, apoptotic, hypoxic, and necrotic cells. Furthermore, due to their spherical shape drug diffusion shows gradient formation similar to the in vivo situation. Together, these aspects render spheroids as promising and reliable platform for drug testing [13, 14].
1.1Objective
In previous studies, the SCC4 spheroids were cultured only up to 72 h [4]. Therefore, the aim of this study was to compare three different culture methods to create a long-term culture model of three-dimensional spheroids of the tongue cancer cell line SCC4. The initial cell seeding concentration of each method was varied to examine the influence of the initial cell number on the long-term culture behaviour and to determine the optimal seeding density. Spheroids were generated using the following 3 methods: 10% methylcellulose (MC), 20% MC, and Lipidure® 96well ULA (Ultra-Low Attachment) plates. The initial cell seeding concentrations varied between 12,000 cells/well, 3,000 cells/well, and 1,500 cells/well. Using ImageJ, the areas of the spheroids were measured at days 2, 4, 6, 8, 10, 12, 14, 16, 18, and 20.
2Materials and methods
2.1Cell line and cell culture
The human SCC4 tongue squamous carcinoma cell line was purchased from American Type Culture Collection (ATCC, Manassas, VA, USA). Cells were maintained in F12/Dulbecco’s Modified Eagle’s Medium (DMEM) media (Sigma Aldrich, Germany) supplemented with 10% fetal bovine serum (FBS) (Gemini Bioproduct Inc., Woodland, CA, USA), 1% penicillin, streptomycin, 15 mM HEPES, 1 mM Sodium pyruvate (Life Technologies GmbH, Darmstadt, Germany) and 400 mg/ml hydrocortisone (Sigma, St. Louis, MO, USA). Cells were maintained at 37 °C in an incubator with 5% CO2. The medium was changed every 3 days. Subcultivation was carried out at 70% to 80% of confluence.
2.2Study design
The study comprised 3 main groups, each characterized by a different cultivation method. These main groups were further subdivided into 3 subgroups with varying initial cell densities. Table 1 details the study design.
Table 1
Tabular depiction of the experimental design
| Group | Subgroup | Initial seeding density | Medium | Coating type |
| A | A1 | 12,000 cells/well | Methylcellulose 20% | — |
| A2 | 3,000 cells/well | |||
| A3 | 1,500 cells/well | |||
| B | B1 | 12,000 cells/well | Methylcellulose 10% | |
| B2 | 3,000 cells/well | |||
| B3 | 1,500 cells/well | |||
| C | C1 | 12,000 cells/well | DMEM F12/HAM 1 : 1 | Lipidure® plate |
| C2 | 3,000 cells/well | |||
| C3 | 1,500 cells/well |
Each group consists of n = 4. Groups A1-A3 represent the method MC 20% with either 12,000, 3,000, or 1,500 cells/well, groups B1-B3 represent the method MC 10% with either 12,000, 3,000, or 1,500 cells/well, and groups C1-C3 represent the method Lipidure® plate with either 12,000, 3,000, or 1,500 cells/well initial seeding density.
2.3Tumor spheroid formation
Tumor spheroids were generated using 3 different methods described below. In order to examine the effects of different cell seeding concentrations on long term culture, SCC-4 cells were seeded at day 0 with varying densities (12×103, 3×10³, and 1,5×10³ cells per well). After seeding, the plates were centrifuged for 5 min at 800×g. Subsequently, spheroids were cultured statically under standard culture conditions (5% CO2, 37 °C) in 100μl of medium. Every other day, 50% of medium was changed to maintain proliferation and viability in all plates.
The 3 main cultivation methods used are described in the following:
Methods 1 and 2: MC (either 10% or 20% in cell culture medium):
This method was described before in more detail [15]. Briefly, 7.2 g of MC powder (Sigma-Aldrich, Germany) was autoclaved with a magnetic stirrer. 300 ml of 60 °C warmed DMEM F12/HAM 1 : 1 medium was added to the methylcellulose solution and stirred for 20 min. Thereafter, 20% FCS was added sterile and the solution was mixed again overnight at 4 °C under sterile conditions. The solution was aliquoted in 15 ml tubes, centrifuged at 5000×g for 2 h at 23 °C, and the supernatant was stored at –20 °C. Final concentration of MC was either 10% or 20% per well of a 96 well plate.
Method 3: Lipidure plate: Lipidure® coated u-bottom plates were obtained from AMS Biotechnology, Germany. Depending on the group, the corresponding initial cell number was pipetted with 150μl medium/well into the 96-well ULA plate. Subsequently, the plates were incubated statically with 5% CO2, at 37 °C.
2.4Analysis of tumor spheroids
To determine the long-term proliferation of each method, the spheroid sizes were examined at day 2, 4, 6, 8, 10, 12, 14, 16, 18, and 20 using an inverted phase-contrast microscope (Axioviert 25, Zeiss). The digitalized images were then processed and analyzed using Image J [16]. The area of the spheroids was measured using ImageJ.
2.5Statistical analysis
All statistical tests were conducted with GraphPad Prism V6.04 (GraphPad Software Inc, USA). Two-way ANOVA with Turkey’s multiple comparisons post hoc test (confidence level 95%) was used for comparisons of multiple groups. Significance levels were indicated by asterisks in corresponding figure legends (*P 0.01 to 0.05, **P 0.001 to 0.01, ***P 0.0001 to 0.001, ****P < 0.0001).
3Results
Spheroids formed within 24 h regardless of the method and initial cell density. In all groups, the maximum area was reached at day 2, followed by a decline until day 20. Spheroids remained stable until day 20 independent of initial seeding concentration in all groups.
3.1Qualitative analysis of spheroids
Figure 1 shows representative microscopic pictures of all methods and initial cell densities. The nine groups are as follows: group A1-A3 (MC 20%; 12,000, 3,000 and 1,500 cells/well), group B1-B3 (MC 10%; 12,000, 3,000 and 1,500 cells/well) and group C1-C3 (Lipidure® plate; 12,000, 3,000 and 1,500 cells/well).
Fig.1
Representative phase-contrast microscopy images of in vitro generated SCC4 spheroids. The images were taken with a 5x objective. Spheroids were generated using 3 different methods: MC 20% (A1; A2; A3), MC10% (B1; B2; B3) and Lipidure© plate (C1; C2; C3). For each method, three different initial seeding densities were used (12,000, 3,000 and 1,500 cells/well). Spheroids were cultured until day 20. Only images from day 2, 6, 10, 14, 18 and 20 are shown. Scale bars correspond to 200μm.
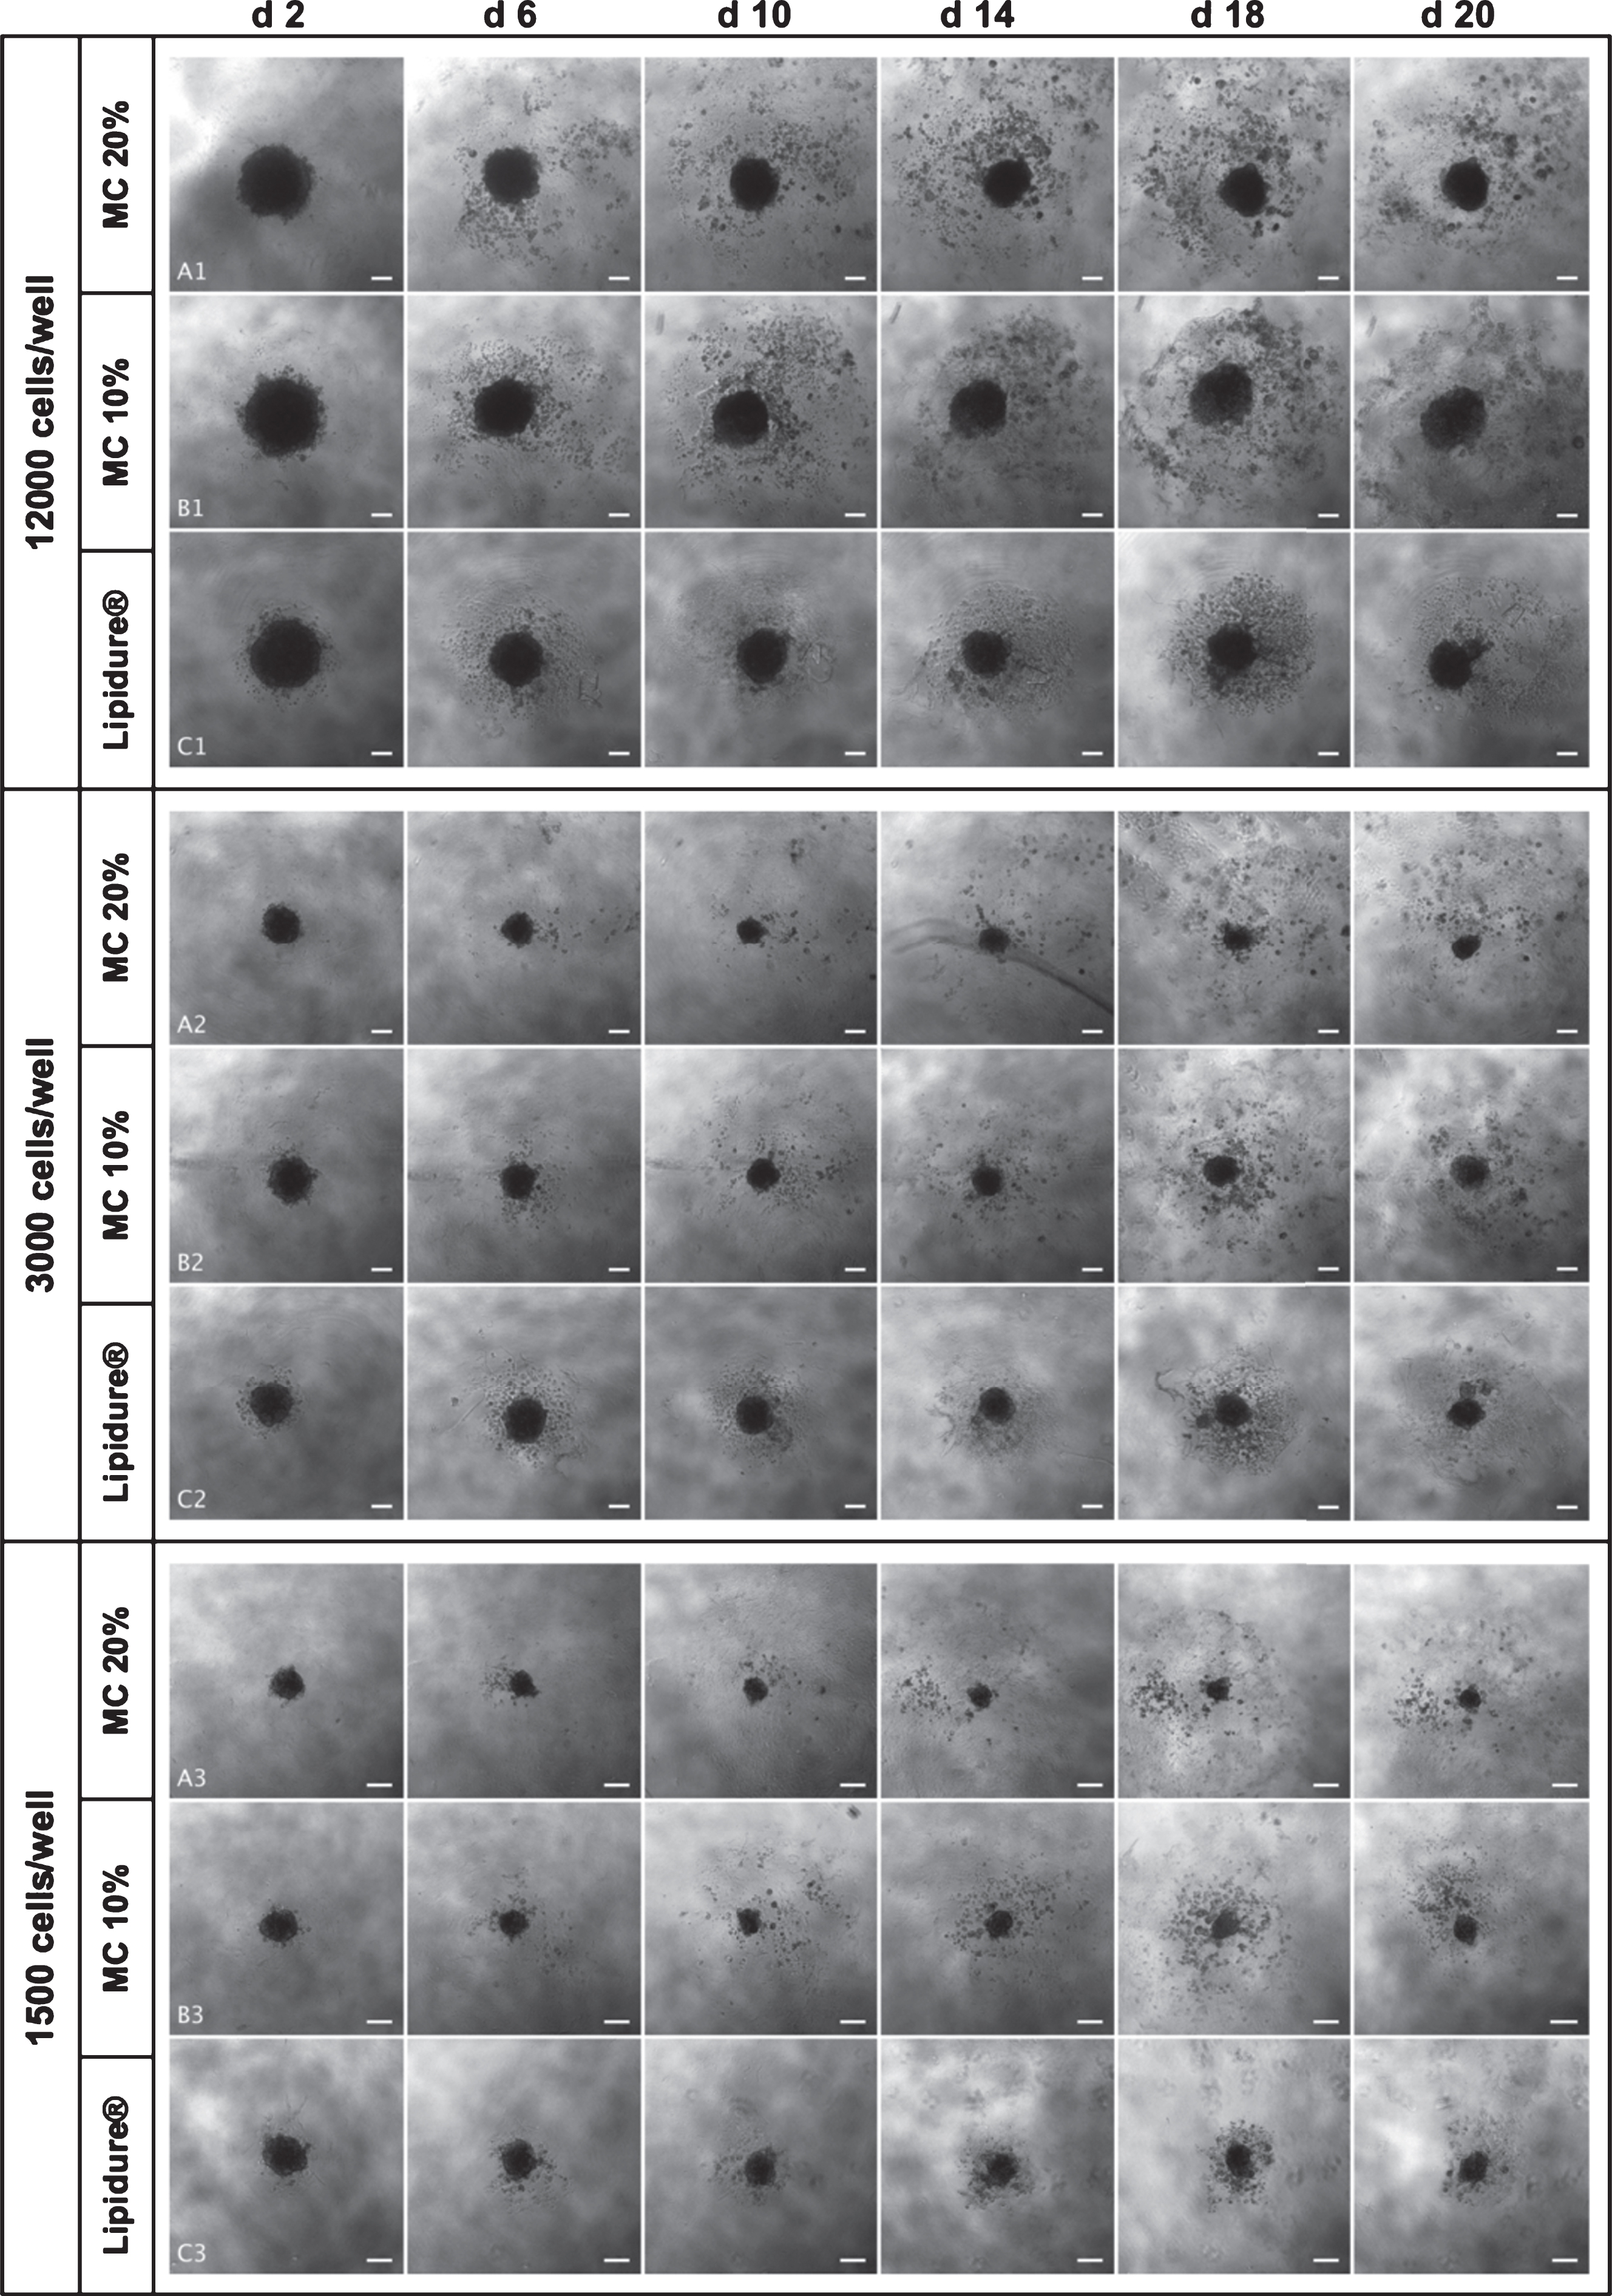
3.1.1Influence of the method on the morphology of the spheroids
Spheroids generated using 20% methylcellulose showed generally rounded morphology but with a rougher-appearing perimeter. Non-adhered and adhered cells around the spheroids perimeter were distributed in a much larger radius compared to the groups B1-B3 and C1-C3. Cell density within the perimeter area increased until day 18. Spheroid morphologies generated with 10% MC were similar to those generated with 20% methylcellulose, but with a more pronounced rougher-appearing perimeter and higher perimeter cell density until day 18. Cells cultured on Lipidure® plates produced more rounded spheroids with a more compact perimeter area. Cells at the perimeter of the spheroids grew more compact around the spheroids and appeared denser as compared to cultures using MC.
3.1.2Influence of the initial seeding density on the morphology of the spheroids
To investigate the effects of initial cell density on spheroid morphology during long-term cultivation, the following initial cell densities were seeded into 96 round bottom well plates for each of the three different methods: 12,000 cells/well (group A1 (MC 20%); group B1 (MC 10%); group C1 (Lipidure® plate); 3,000 cells/well (group A2 (MC 20%); group B2 (MC 10%); group C2 (Lipidure® plate), and 1,500 cells/well (group A3 (MC 20%); group B3 (MC 10%); group C3 (Lipidure® plate). A correlation between initial seeding density and spheroid area was observed. The size of spheroids increased significantly with a higher seeding density, independently of the culture method until day 20. Similarly, the density of the cells at the perimeter of the spheroids increased with higher initial cell densities, but not the spreading radius.
3.2Quantitative analysis of tumor spheroids
3.2.1Influence of the method on the area of spheroids
A summary of the results is provided in Fig. 2. At day 2, there were no significant differences in the spheroid areas generated with the different methods at an initial cell density of 12,000 cells/well (group A1 (39×104μm2±5×104μm2), B1 (38×104μm2±3×104μm2), and C1 (38×104μm2±1×104μm2)). At day 4, spheroids generated with 20% MC (group A1 (34×104μm2±5×104μm2)) were significantly larger compared to those generated in 10% MC (group B1 (28×104μm2±2×104μm2)) (p < 0.0001) and Lipidure® plates (group C1 (27×104μm2±2×104μm2)) (p < 0.0001). Starting from day 6 until day 20 no significant differences were measured between all three groups, with an exception at day 20 between group B1 (10% MC) (19×104μm2±5×104μm2) and group C1 (Lipidure® plate (14×104μm2±2×104μm2) (p < 0.0001) (Fig. 2-I.).
Fig.2
Effect of the culture method on spheroid generation. Spheroids were generated by three different methods: Methylcellulose 20%, Methylcellulose 10% and Lipidure® plate, each with an initial cell density of I. 12,000 cells/well, II. 3,000 cells/well or III. 1,500 cells/well. Areas of the spheroids were measured at days 2, 4, 6, 8, 10, 12, 14, 16, 18, and 20. All values are expressed as mean values±standard deviation.
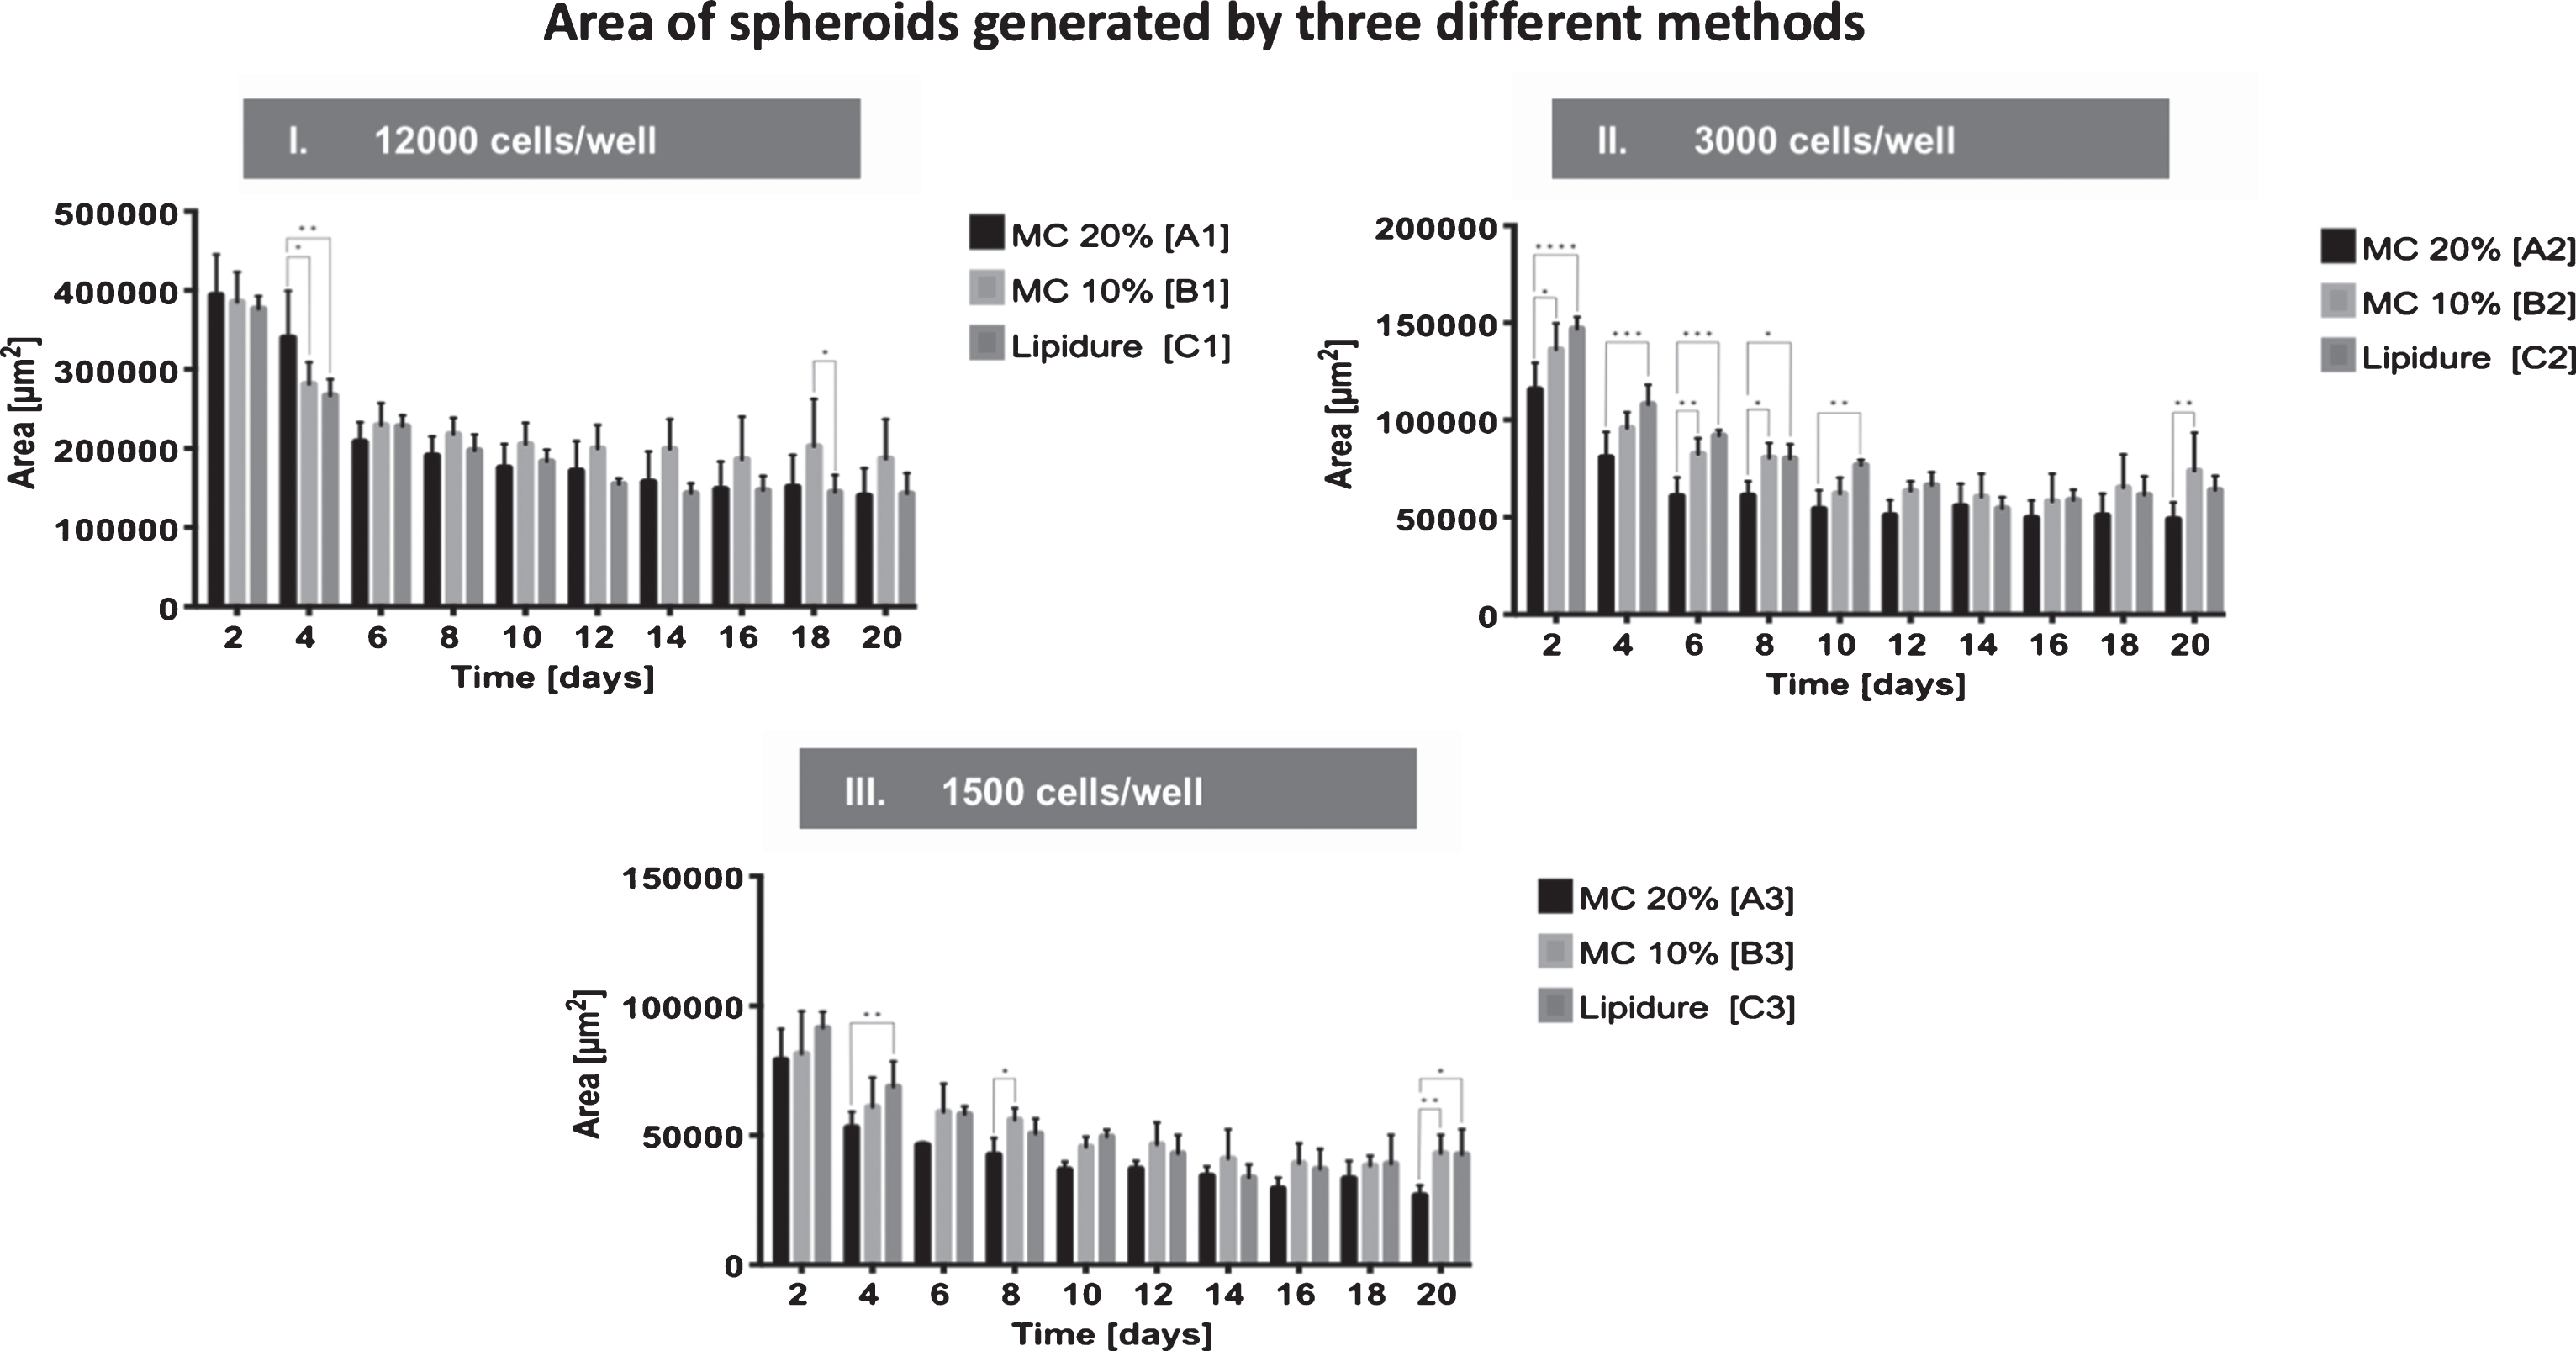
Spheroids seeded with an initial seeding density of 3,000 cells/well were significantly larger in group C2 (Lipidure® plate (15×104μm2±1×104μm2)) compared to group A2 (MC 20% (12×104μm2±1×104μm2)) (p < 0.0001) but not in group B2 (MC 10% (14×104μm2±1×104μm2)). Spheroids generated with 10% MC (group B2 (14×104μm2±1×104μm2))) were significantly larger than those cultured in 20% MC (group A2 (12×104μm2±1×104μm2)) (p < 0.0001). From day 4 until day 10, spheroids from group C2 (Lipidure® plate (11×104μm2±1×104μm2)) were significantly larger than in group A2 (MC 20% (8×104μm2±1×104μm2)). Also, spheroids from group B2 (MC 10% (10×104μm2±1×104μm2)) were significantly larger between day 6 (8×104μm2±1×104μm2) (p < 0.0001) and day 8 (8×104μm2±1×104μm2) (p < 0.0001) and at day 20 (7×104μm2±2×104μm2) (p < 0.0001) compared to group A2 (MC 20% (5×104μm2±1×104μm2)) (Fig. 2-II.).
At days 4 and 20, spheroids seeded at an initial cell density of 1,500 cells/well were significantly larger in group C3 (Lipidure® plate) (7×104μm2±1×104μm2 and 4×104μm2±1×104μm2) compared to group A3 (MC 20% (5×104μm2±1×104μm2 and 3×104μm2±0×104μm2) (p < 0.0001 and p < 0.0001). At day 8, spheroids generated in 10% MC (group B3) were significantly larger than those cultured in Lipidure® plates (group C3) (6×104μm2±0×104μm2 vs. 5×104μm2±1×104μm2) (p < 0.0001) (Fig. 2-III.).
3.2.2Influence of the initial seeding density on the area of the spheroids
Figure 3 displays the measured area of spheroids seeded with various initial seeding densities. From days 2 to 20, spheroids cultured in 20% MC were significantly larger in group A1 (12,000 cells/well) compared to group A2 (3,000 cells/well) and group A3 (1,500 cells/well). The area ranged between 39×104μm2±5×104μm2 at day 2 to 14×104μm2±4×104μm2 at day 20 in group A1 (12,000 cells/well). Spheroids in group A2 (3,000 cells/well) ranged from 12×104μm2±1×104μm2 at day 2 to 5×104μm2±1×104μm2 at day 20. Spheroids in group A3 (1,500 cells/well) were sized 8×104μm2±1×104μm2 at day 2 and 3×104μm2±0×104μm2 at day 20 (Fig. 3-I.).
Fig.3
Effect of seeding density on spheroid generation. Spheroids were generated with three different methods and three different initial cell seeding densities: I. methylcellulose 20%, II. methylcellulose 10% and III. Lipidure® plate either with an initial cell density of 12,000 cells/well, 3,000 cells/well and 1,500 cells/well. Areas of spheroids were measured at days 2, 4, 6, 8, 10, 12, 14, 16, 18, and 20. All values are expressed as mean values±standard deviation.
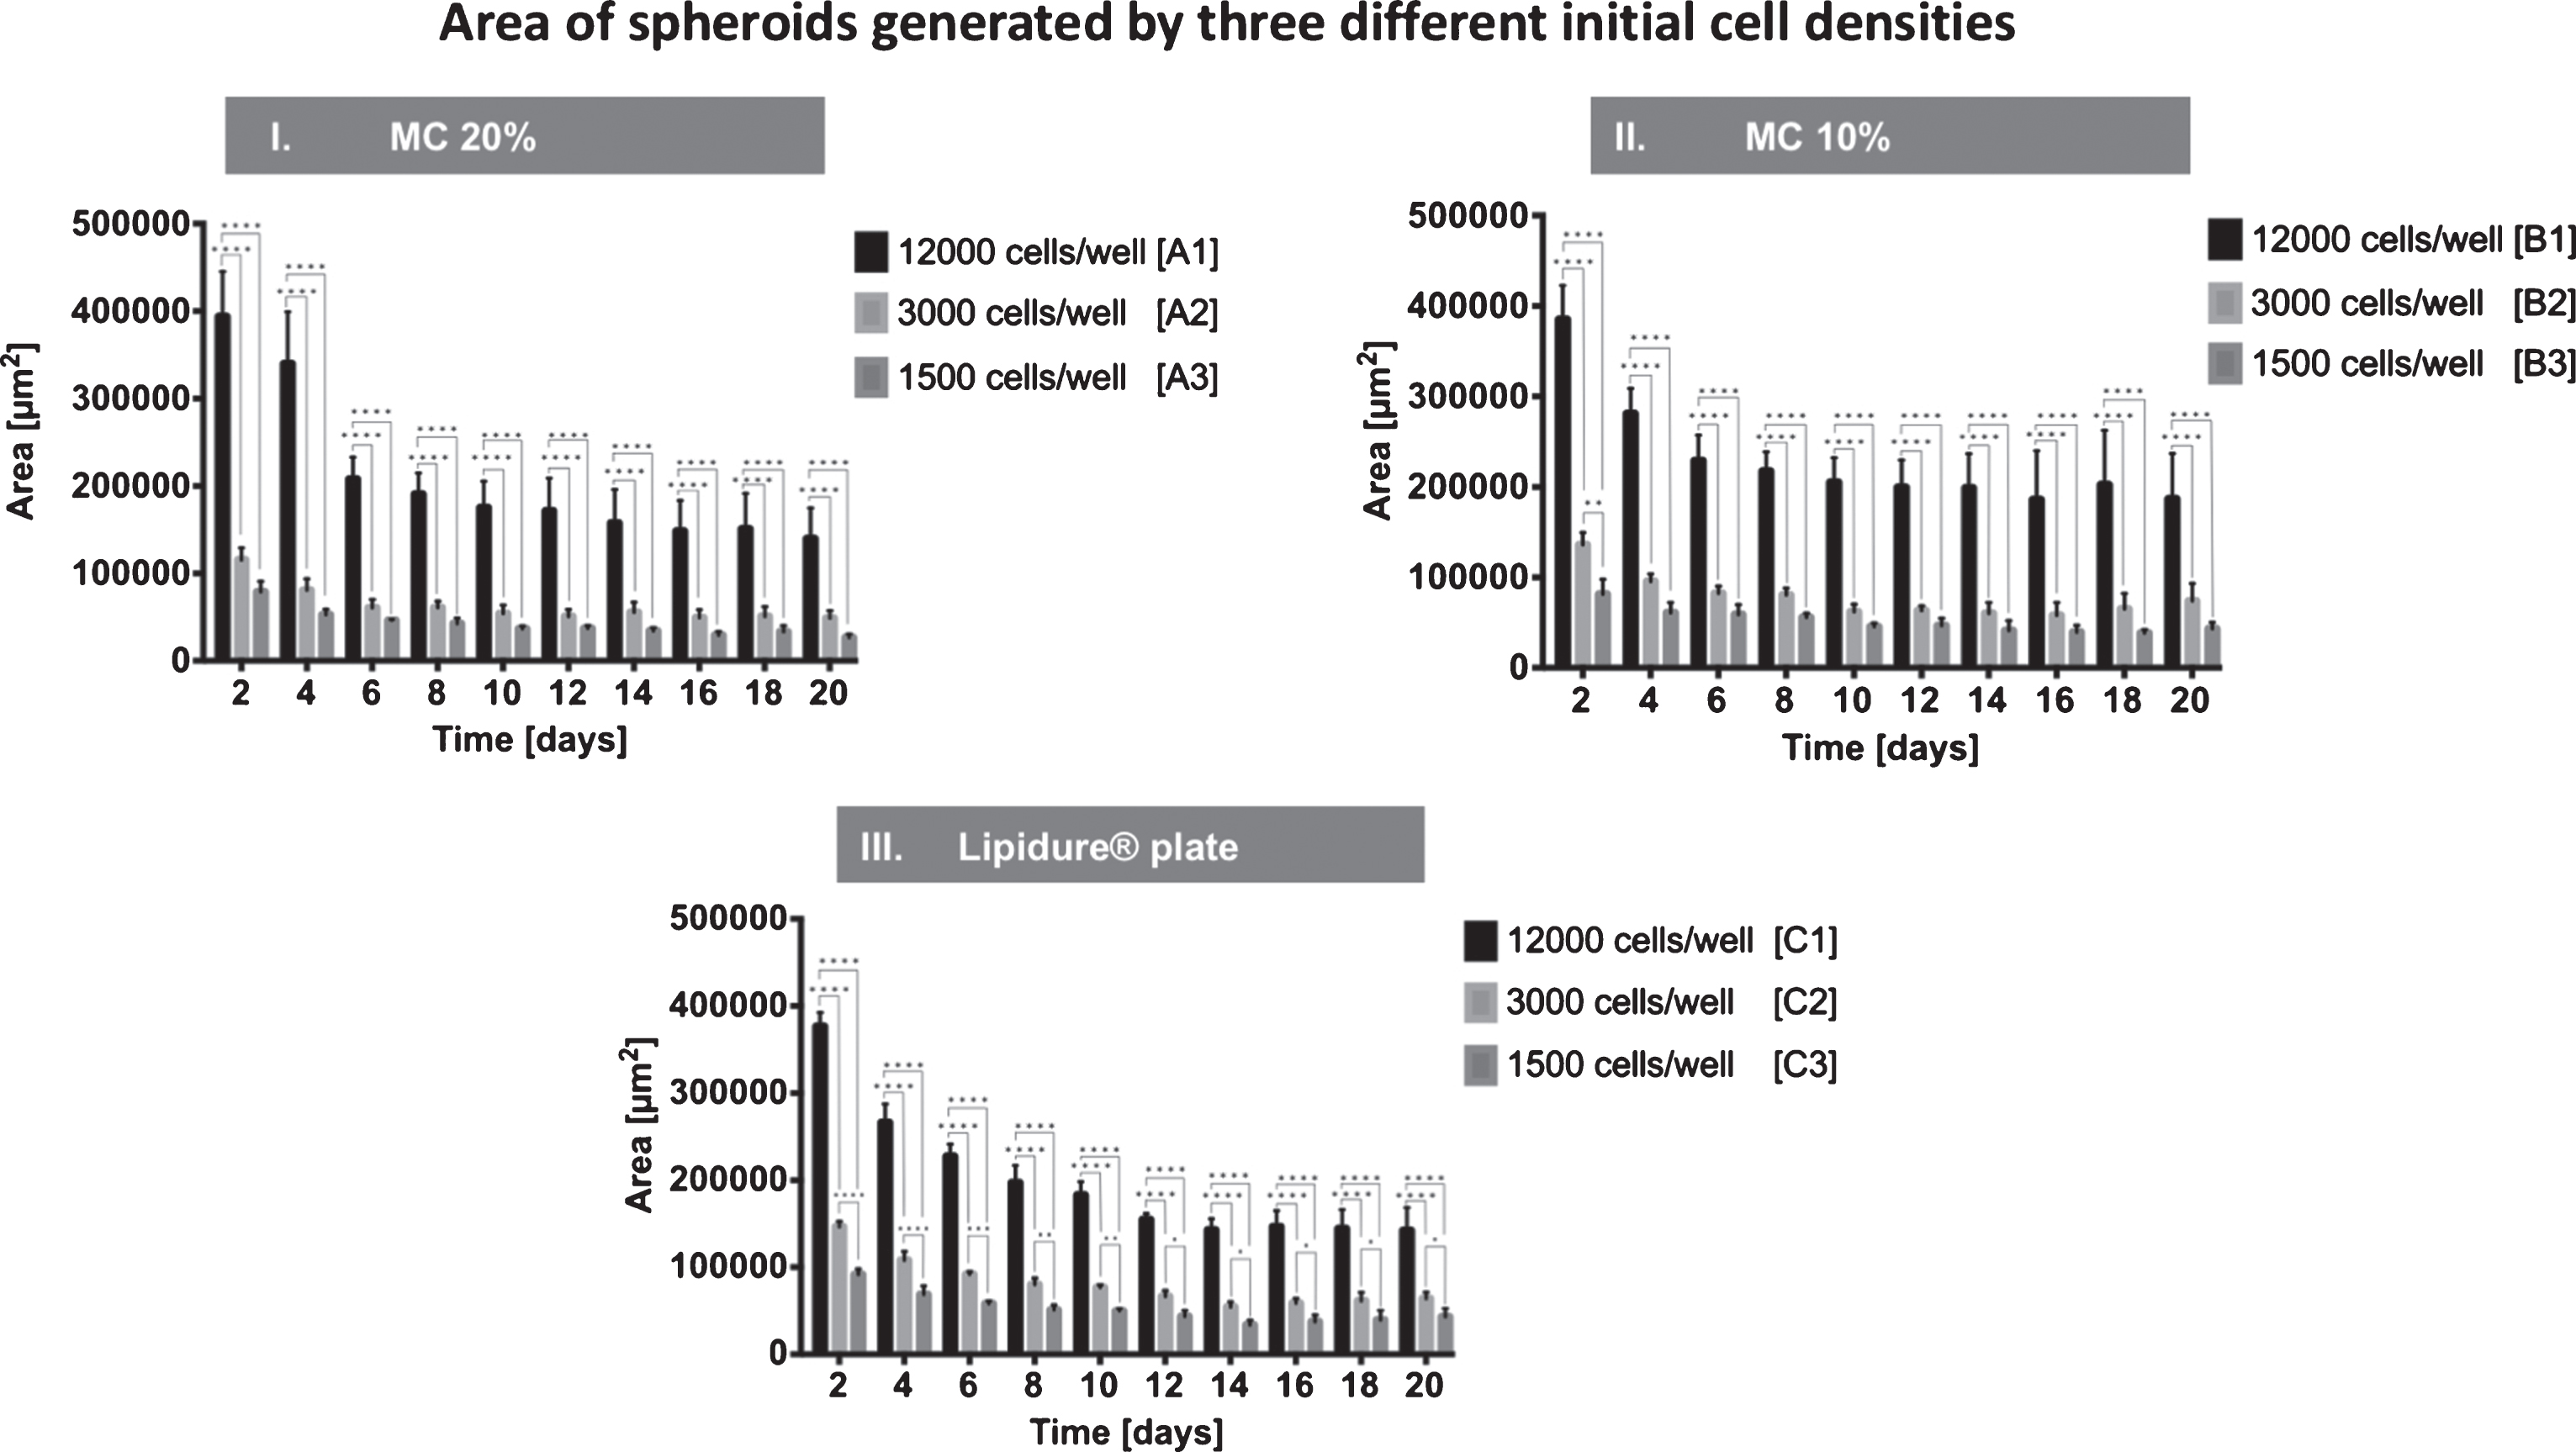
Also, spheroids seeded in 10% MC were significantly larger when seeded initially with 12,000 cells/well (group B1) as compared to group B2 (3,000 cells/well) and group B3 (1,500 cells/well) over the entire observation period. Areas ranged between 38×104μm2±4×104μm2 at day 2 to 19×104μm2±5×104μm2 at day 20 in group B1 (12,000 cells/well). Spheroids in group B2 (3,000 cells/well) ranged from 14×104μm2±1×104μm2 at day 2 to 7×104μm2±2×104μm2 at day 20. The areas of spheroids in group B3 (1,500 cells/well) were 8×104μm2±2×104μm2 at day 2 and 4×104μm2±1×104μm2 at day 20 (Fig. 3-II.).
Finally, spheroids seeded in Lipidure® plates at a higher initial seeding concentration (group C1; 12000 cells/well) were significantly larger over the entire observation period compared to both other Lipidure® groups. Spheroids in group C1 ranged from 38×104μm2±2×104μm2 at day 2 to 14×104μm2±3×104μm2 at day 20. Spheroids in group C2 (3,000 cells/well) ranged from 15×104μm2±1×104μm2 at day 2 to 6×104μm2±1×104μm2 at day 20. Areas of spheroids in group C3 (1,500 cells/well) were 9×104μm2±1×104μm2 at day 2 and 4×104μm2±1×104μm2) at day 20 (Fig. 3-III.).
4Discussion
The development and progression of OSCC is thought to be critically dependent on integrins and their downstream signal transduction [17]. Since the expression of integrins and growth factor receptors are altered in monolayer cultures compared to 3D cultures, it is essential to grow cells in a more physiological environment when studying the effects of new therapeutic substances [8]. Spheroids are valuable in vitro tools in pre-clinical drug screenings. So far, there exist a variety of different methods to generate spheroids in vitro. However, not all spheroid generation methods are equivalent. The size and the morphology of the spheroids is significantly dependent on the methodology and initial cell seeding density and may also vary between different cell lines [18].
To date, only few studies generated 3D in vitro models of SCC4 cells with varying degree of success. For example, Coley et al. failed to generate a 3-dimensional in vitro model of the oral epithelium that replicates tumor progression using OSCC cell line SCC4 [4]. In contrast, Schmidt et al. were able to generate SCC4 spheroids using ULA 96 well plates and to maintain them in culture for up to 72 h [19]. However, there is still no study in which a long-term culture of SCC4 spheroids could be demonstrated.
In the present study, we compared 3 different methods to generate spheroids using the oral squamous cell carcinoma cell line SCC4. Furthermore, we analysed the influence of different initial cell seeding densities for each method on spheroid formation during long-term culture until day 20. The results demonstrated that the initial cell seeding density of SCC4 cells represents the main factor that affects the spheroid size during an observation period of 20 days. In contrast, the examined cultivation methods, i.e. MC vs. Lipidure had only a negligible influence on the size of the spheroids.
Depending on the scientific question, generation of spheroid in vitro models, which vary in size, can be of major importance. Prime examples are the investigation of effects of hypoxia or resistance to chemotherapy and radiotherapy [20, 21]. Indeed, since spheroids are avascular, cells in the center of spheroids become hypoxic and have a reduced uptake of oxygen if they are larger than 100μm in size [22], and the size of spheroids has been reported to affect hepatocyte viability and function in the 3D culture [23]. However, if the spheroid size is too small, they produce significantly less albumin as a result of poor maturation [24].
In spheroids, hypoxia-inducible factor 1- α (HIF1α) is stabilised about 80μm from the periphery and thus spheroids with a diameter of greater than 160μm in diameter should start to develop hypoxic cores. If they grow larger to between 400 and 500μm they will become necrotic. However, the pattern of these features in spheroids is cell line specific and needs to be validated in the model of use [20].
Drug screenings were frequently carried out on small spheroids with a size of up to 200μm. Spheroids in this range may indeed be sufficient to reflect 3D cell–cell and cell–matrix interactions but is clearly inappropriate when attempting to resemble pathophysiological conditions with hypoxic areas in the spheroid center or to develop proliferation gradients [25]. Thus, it may also be necessary to grow large spheroids within a short time. One possibility would be to use a high cell seeding concentration.
5Conclusion
We have demonstrated, that it is feasible to generate long-term culture spheroids with the OSCC tumor cell line SCC4 using three different culture methods. The size of spheroids was significantly dependent on the initial cell seeding concentration. Such a 3D SCC4 in vitro model may be useful for basic research or pharmacological screenings on OSCC entities in a more tumour-relevant context.
Acknowledgments
This work was funded by the German Federal Ministry of Research (BMBF) as part of the Innovation Partnership M2Aind, project M2OGA (03FH8I02IA) within the framework “Starke Fachhochschulen – Impuls für die Region” (FH-Impuls) to RR and MH. This research project is part of the Forschungscampus M2OLIE and funded by the German Federal Ministry of Education and Research (BMBF) within the Framework “Forschungscampus: public-private partnership for Innovations”. This work was co-funded by the VAND e.V. (Association of Azerbaijani doctors in Germany) to VR and VY.
References
[1] | Argiris A , Karamouzis MV , Raben D , Ferris RL . Head and neck cancer. Lancet (2008) ;371: (9625):1695–709. |
[2] | Yao M , Epstein JB , Modi BJ , Pytynia KB , Mundt AJ , Feldman LE . Current surgical treatment of squamous cell carcinoma of the head and neck. Oral Oncol (2007) ;43: (3):213–23. |
[3] | Choi S , Myers JN . Molecular pathogenesis of oral squamous cell carcinoma: Implications for therapy. J Dent Res (2008) ;87: (1):14–32. |
[4] | Colley HE , Hearnden V , Jones AV , Weinreb PH , Violette SM , Macneil S , et al. Development of tissue-engineered models of oral dysplasia and early invasive oral squamous cell carcinoma. Br J Cancer (2011) ;105: (10):1582–92. |
[5] | Bello IO , Soini Y , Salo T . Prognostic evaluation of oral tongue cancer: Means, markers and perspectives (I). Oral Oncol (2010) ;46: (9):630–5. |
[6] | Bello IO , Soini Y , Salo T . Prognostic evaluation of oral tongue cancer: Means, markers and perspectives (II). Oral Oncol (2010) ;46: (9):636–43. |
[7] | Scully C , Bagan J . Oral squamous cell carcinoma overview. Oral Oncol (2009) ;45: (4-5):301–8. |
[8] | Hehlgans S , Lange I , Eke I , Cordes N . 3D cell cultures of human head and neck squamous cell carcinoma cells are radiosensitized by the focal adhesion kinase inhibitor TAE226. Radiother Oncol (2009) ;92: (3):371–8. |
[9] | Haycock JW . 3D cell culture: A review of current approaches and techniques. Methods Mol Biol (2011) ;695: :1–15. |
[10] | Hay M , Thomas DW , Craighead JL , Economides C , Rosenthal J . Clinical development success rates for investigational drugs. Nat Biotechnol (2014) ;32: (1):40–51. |
[11] | Kola I . The state of innovation in drug development. Clin Pharmacol Ther (2008) ;83: (2):227–30. |
[12] | Wennerberg K . Cancer cell drug response transcriptomes in 3D. Cell Chem Biol (2016) ;23: (11):1323–4. |
[13] | Kim JB . Three-dimensional tissue culture models in cancer biology. Semin Cancer Biol (2005) ;15: (5):365–77. |
[14] | Khaitan D , Chandna S , Arya MB , Dwarakanath BS . Establishment and characterization of multicellular spheroids from a human glioma cell line; Implications for tumor therapy. J Transl Med (2006) ;4: :12. |
[15] | Longati P , Jia X , Eimer J , Wagman A , Witt MR , Rehnmark S , et al. 3D pancreatic carcinoma spheroids induce a matrix-rich, chemoresistant phenotype offering a better model for drug testing. BMC Cancer (2013) ;13: :95. |
[16] | Collins TJ . ImageJ for microscopy. Biotechniques (2007) ;43: (1 Suppl):25–30. |
[17] | Janes SM , Watt FM . New roles for integrins in squamous-cell carcinoma. Nat Rev Cancer (2006) ;6: (3):175–83. |
[18] | Achilli TM , Meyer J , Morgan JR . Advances in the formation, use and understanding of multi-cellular spheroids. Expert Opin Biol Ther (2012) ;12: (10):1347–60. |
[19] | Schmidt M , Scholz CJ , Polednik C , Roller J . Spheroid-based 3-dimensional culture models: Gene expression and functionality in head and neck cancer. Oncol Rep (2016) ;35: (4):2431–40. |
[20] | Leek R , Grimes DR , Harris AL , McIntyre A . Methods: Using three-dimensional culture (spheroids) as an in vitro model of tumour hypoxia. Adv Exp Med Biol (2016) ;899: :167–96. |
[21] | Riffle S , Pandey RN , Albert M , Hegde RS . Linking hypoxia, DNA damage and proliferation in multicellular tumor spheroids. BMC Cancer (2017) ;17: (1):338. |
[22] | Ramasamy TS , Yu JS , Selden C , Hodgson H , Cui W . Application of three-dimensional culture conditions to human embryonic stem cell-derived definitive endoderm cells enhances hepatocyte differentiation and functionality. Tissue Eng Part A (2013) ;19: (3-4):360–7. |
[23] | Glicklis R , Shapiro L , Agbaria R , Merchuk JC , Cohen S . Hepatocyte behavior within three-dimensional porous alginate scaffolds. Biotechnol Bioeng (2000) ;67: (3):344–53. |
[24] | Glicklis R , Merchuk JC , Cohen S . Modeling mass transfer in hepatocyte spheroids via cell viability, spheroid size, and hepatocellular functions. Biotechnol Bioeng (2004) ;86: (6):672–80. |
[25] | Friedrich J , Seidel C , Ebner R , Kunz-Schughart LA . Spheroid-based drug screen: Considerations and practical approach. Nat Protoc (2009) ;4: (3):309–24. |


