Chronic ethanol treatment depletes glutathione regeneration capacity in hepatoma cell line HepG2
Abstract
Chronic alcohol abuse is the leading cause of liver cirrhosis in western countries. Ethanol, even at lower concentrations, can cause pleiotropic effects at the cellular level such as the formation of reactive oxygen species (ROS) and DNA damage. Ethanol is oxidized to acetaldehyde by liver alcohol dehydrogenase and by a microsomal ethanol-oxidizing system which is dependent on CYP2E1. There are numerous reports on CYP2E1-mediated formation of ROS. These lower the levels of intracellular glutathione, an efficient antioxidant. We were interested to investigate ethanol effects on glutathione levels independent of CYP2E1. We chose human hepatoma cell line HepG2 as a model known to lack physiological CYP2E1 expression. We found that 40 mM ethanol, a dosage comparable to blood ethanol concentration after heavy alcohol drinking, reduced intracellular HepG2 glutathione levels only by 18%. Within 24 hours, this effect could be normalized by the glutathione regeneration system. When HepG2 cells were exposed to 40 mM ethanol for one week, the cells gradually lost their ability to regenerate intracellular glutathione stores. We conclude that chronic ethanol exposure has a substantial effect on the glutathione regeneration capacity in liver cells which might contribute to alcohol-induced liver disease.
1Introduction
Alcohol is the most frequent cause of liver disease in western countries, affecting millions of people worldwide [1]. Long-term consumption of more than 30 g absolute alcohol per day increases the risk for liver cirrhosis. In central Europe there are 15 deaths per 100.000 people due to alcohol-induced liver cirrhosis [1]. At the cellular level, it is well known that ethanol has pleiotropic effects which could lead to short-term cytotoxicity as well as to long-term effects such as DNA damage and subsequent carcinogenesis. In the liver, alcohol is mainly metabolized by alcohol dehydrogenase leading to acetaldehyde. Ethanol conversion into acetaldehyde can also be catalyzed by a microsomal ethanol oxidizing system (MEOS) which is dependent on CYP2E1 [2, 3]. CYP2E1 expression in hepatocytes can be induced by ethanol [4–6]. Massive ethanol oxidation to acetaldehyde by both alcohol dehydrogenase and MEOS causes the balance of the NAD +/NADH redox system to shift which contributes to ethanol cytotoxicity [7]. Furthermore, acetaldehyde production can cause lipid peroxidation [8] and leads to the formation of advanced glycation end-products that also could contribute to alcohol-induced liver disease (ALD) [9]. Ethanol increases the concentration of reactive oxygen species (ROS) produced by the mitochondrial respiratory chain, by CYP2E1-dependent MEOS and by cytosolic aldehyde oxidase [3, 10–12]. In turn, ROS such as superoxide (O2- ), hydrogen peroxide (H2O2) and hydroxyl radicals (OH. ) can lead to a plethora of damages at intracellular macromolecules, including genotoxic DNA damage [13]. Ethanol-induced formation of ROS reduces the levels of cytosolic and mitochondrial glutathione (GSH), an effective antioxidant. GSH is an essential component of the glutathione peroxidase system, a cellular defense against oxidative stress, and GSH is a cofactor for liver phase II enzyme glutathione transferase. Glutathione exists in thiol-reduced (GSH) and disulfide-oxidized (GSSG) forms and is highly concentrated in the liver. Glutathione reductase uses NADPH to regenerate GSH from GSSG.
Studies with HepG2 cells overexpressing CYP2E1 have demonstrated a substantial increase of ethanol-induced cytotoxicity while parental HepG2 cells apparently lack CYP2E1 expression [14, 15]. Lowering of hepatocellular GSH levels by chronic ethanol treatment is thought to be crucial for liver toxicity leading to ALD [11].
Here we were interested to investigate ethanol effects on GSH levels independent of CYP2E1 MEOS. We found that exposure of HepG2 cells to subtoxic ethanol concentrations for seven days substantially affects the GSH regeneration capacity.
2Material and methods
2.1Cell culture
HepG2 cells (ATCC HB-8065) were cultured in DMEM (Biochrom AG, Berlin, Germany) supplemented with 10% fetal bovine serum = FBS Gold (PAA Laboratories GmbH, Solingen, Germany), 2 mM L-glutamine (Biochrom AG), 100 U/ml penicillin and 0.1 mg/ml streptomycin (PAA Laboratories GmbH). HepG2 were passaged once a week with seeding of 2,500 cells per cm2. All analyses of HepG2 cells were performed at passages 15–20.
2.2Ethanol treatment and GSH Assay
The GSH assay relies on the specific binding of fluorescent substance o-phthalaldehyde (OPA) to GSH [16]. HepG2 cells were seeded at a density of 1×10⁵ cells per cm2 into 6-well plates. The assay work flow was as the following (Fig. 1): Ethanol treatment started 24 hours upon seeding. For short-treatment, medium was removed and substituted with medium containing 20 or 40 mM ethanol (VWR International, Darmstadt, Germany). For chronic ethanol exposure, cell culture medium containing 40 mM ethanol was replaced daily. GSH consumption was evaluated 1, 3 or 24 hours after start of each new ethanol exposure. At the indicated time points, cells were washed with PBS, and 4 ml 0.1 M NaH2PO4 / 5 mM EDTA buffer (PEB, pH 8.0) were added. Cells were harvested by using a cell scraper, frozen in liquid nitrogen, and cell extracts were further prepared by ultrasound treatment liquid nitrogen, and cell extracts were further prepared by ultrasound treatment for 5 min (Ultrasonic Cleaner, VWR International). Cell extracts were centrifuged at 15,000 g at 4°C for 1.5 hours. To 1 ml of supernatants 100 μl 7.5 mM OPA (Sigma-Aldrich, St. Louis, USA), dissolved in methanol, were added. As positive control, 900 μl PEB was mixed with 100 μl GSH (160 μM) and incubated with 100 μl OPA. As negative control (blank value), 1 ml PEB was mixed with 100 μl 7.5 mM OPA. Samples (80 μl) were added to black bottom 96 well plates.
Fluorescent product was activated at 350 nm, and emission was detected at 420 nm by using a Cytofluor II Fluorescence Multi-Well Plate Reader (PerSpective Biosystems, Darmstadt, Germany). Absolute GSH levels were obtained from a regression curve with known GSH concentrations (Fig. 2). Specificity testing of this assay was performed by incubation of OPA with 160 μM GSSH (Sigma-Aldrich®, St. Louis, USA), 160 μM L-cysteine (Sigma-Aldrich®) or 160 μM N-ethylmaleimide (NEM, VWR International®, Darmstadt, Germany) instead of GSH. N-ethylmaleimide is an inhibitor of GSH reaction with OPA.
3Results
The pathophysiological development of alcohol-induced liver damage (ALD) is still not completely understood. Ethanol consumption can substantially reduce intracellular glutathione (GSH) levels through the formation of reactive oxygen species (ROS). We were interested to investigate the kinetics GSH consumption in liver carcinoma cell line HepG2 as a consequence of chronic treatment with ethanol.
3.1Validation of GSH assay
In order to investigate the influence of ethanol treatment on GSH levels in HepG2 cells, we employed an assay based on the reaction of o-phthalaldehyde (OPA) with the thiol group of GSH and subsequent fluorescence quantitation. We first investigated the assay detection limit by preparing a standard curve. Figure 2 shows the linear increase of fluorescence with increasing GSH concentration. In most cells, physiological GSH concentrations are in the millimolar range [17]. The assay showed a GSH detection limit at about 10 μM. The assay should thus be sensitive enough to measure GSH levels which were substantially reduced in cells exposed to oxidative stress conditions.
We next tested whether the OPA reagent would also act with the oxidized variant of glutathione, GSSG, or with free L-cysteine. Using identical concentrations of test reagents, we measured that the reaction of OPA with both GSSG and L-cysteine yielded fluorescent signals which were less than 5% of the GSH-OPA fluorescence signal (Fig. 3). Apparently, OPA interactions with GGSG and L-cysteine were negligible since values were close to the detection limit of our assay. As a further control to examine the specificity of OPA-GSH interaction, we tested reaction inhibition by treatment of GSH with N-ethylmaleimide (NEM). This alkylating reagent is known to form a stable complex with GSH which should result in almost complete inhibition of OPA reaction with GSH. Indeed, Fig. 3 shows that obtained strong signals were due to OPA-GSH reaction since signal formation can be almost completely blocked by NEM.
3.2Daily ethanol exposure interferes with GSH regeneration capacity
We next were interested to analyze ethanol-mediated GSH consumption in liver cells. As test system we used hepatocellular carcinoma line HepG2. In order to find a concentration of ethanol that is not directly interfering with cell viability, we performed XTT assays. We found that ethanol concentrations higher than 50 mM caused a significant decrease of cell viability. However, the XTT test revealed that there was no short-term reduction in cell viability when HepG2 cells were treated with as high as 40 mM ethanol (data not shown). Hence 40 mM ethanol was defined as the highest concentration that can be used for chronic ethanol treatment. This dosage is equivalent to 0.23% ethanol concentration which is at a range that can be found in the blood of persons with heavy alcohol consumption.
We first exposed HepG2 cells to ethanol for 1 hour followed by GSH level analysis. Figure 4 shows that 20 mM ethanol reduced GSH stores by almost 12% while doubling the dosage to 40 mM ethanol led to a reduction of 18%. Thus the effect of a single ethanol exposure close to the maximum short-term tolerated dose, as revealed by XTT test, did reduce but not deplete intracellular GSH levels. Apparently, liver cancer cell line HepG2 seemed to be quite resistant to short-term ethanol exposure. This might be due to limiting expression levels of CYP2E1 in HepG2 cells. CYP2E1 is the predominant enzyme that makes up the microsomal ethanol-oxidizing system (MEOS). By using FACS analysis based on the ROS indicator DCFH, we found that a single 40 mM ethanol exposure for 1 hour caused an ROS increase which is smaller than 10% compared to control cells (data not shown). It thus seems likely that observed GSH reduction by ethanol was caused by this moderate ROS production which should be independent of the CYP2E1-based MEOS.
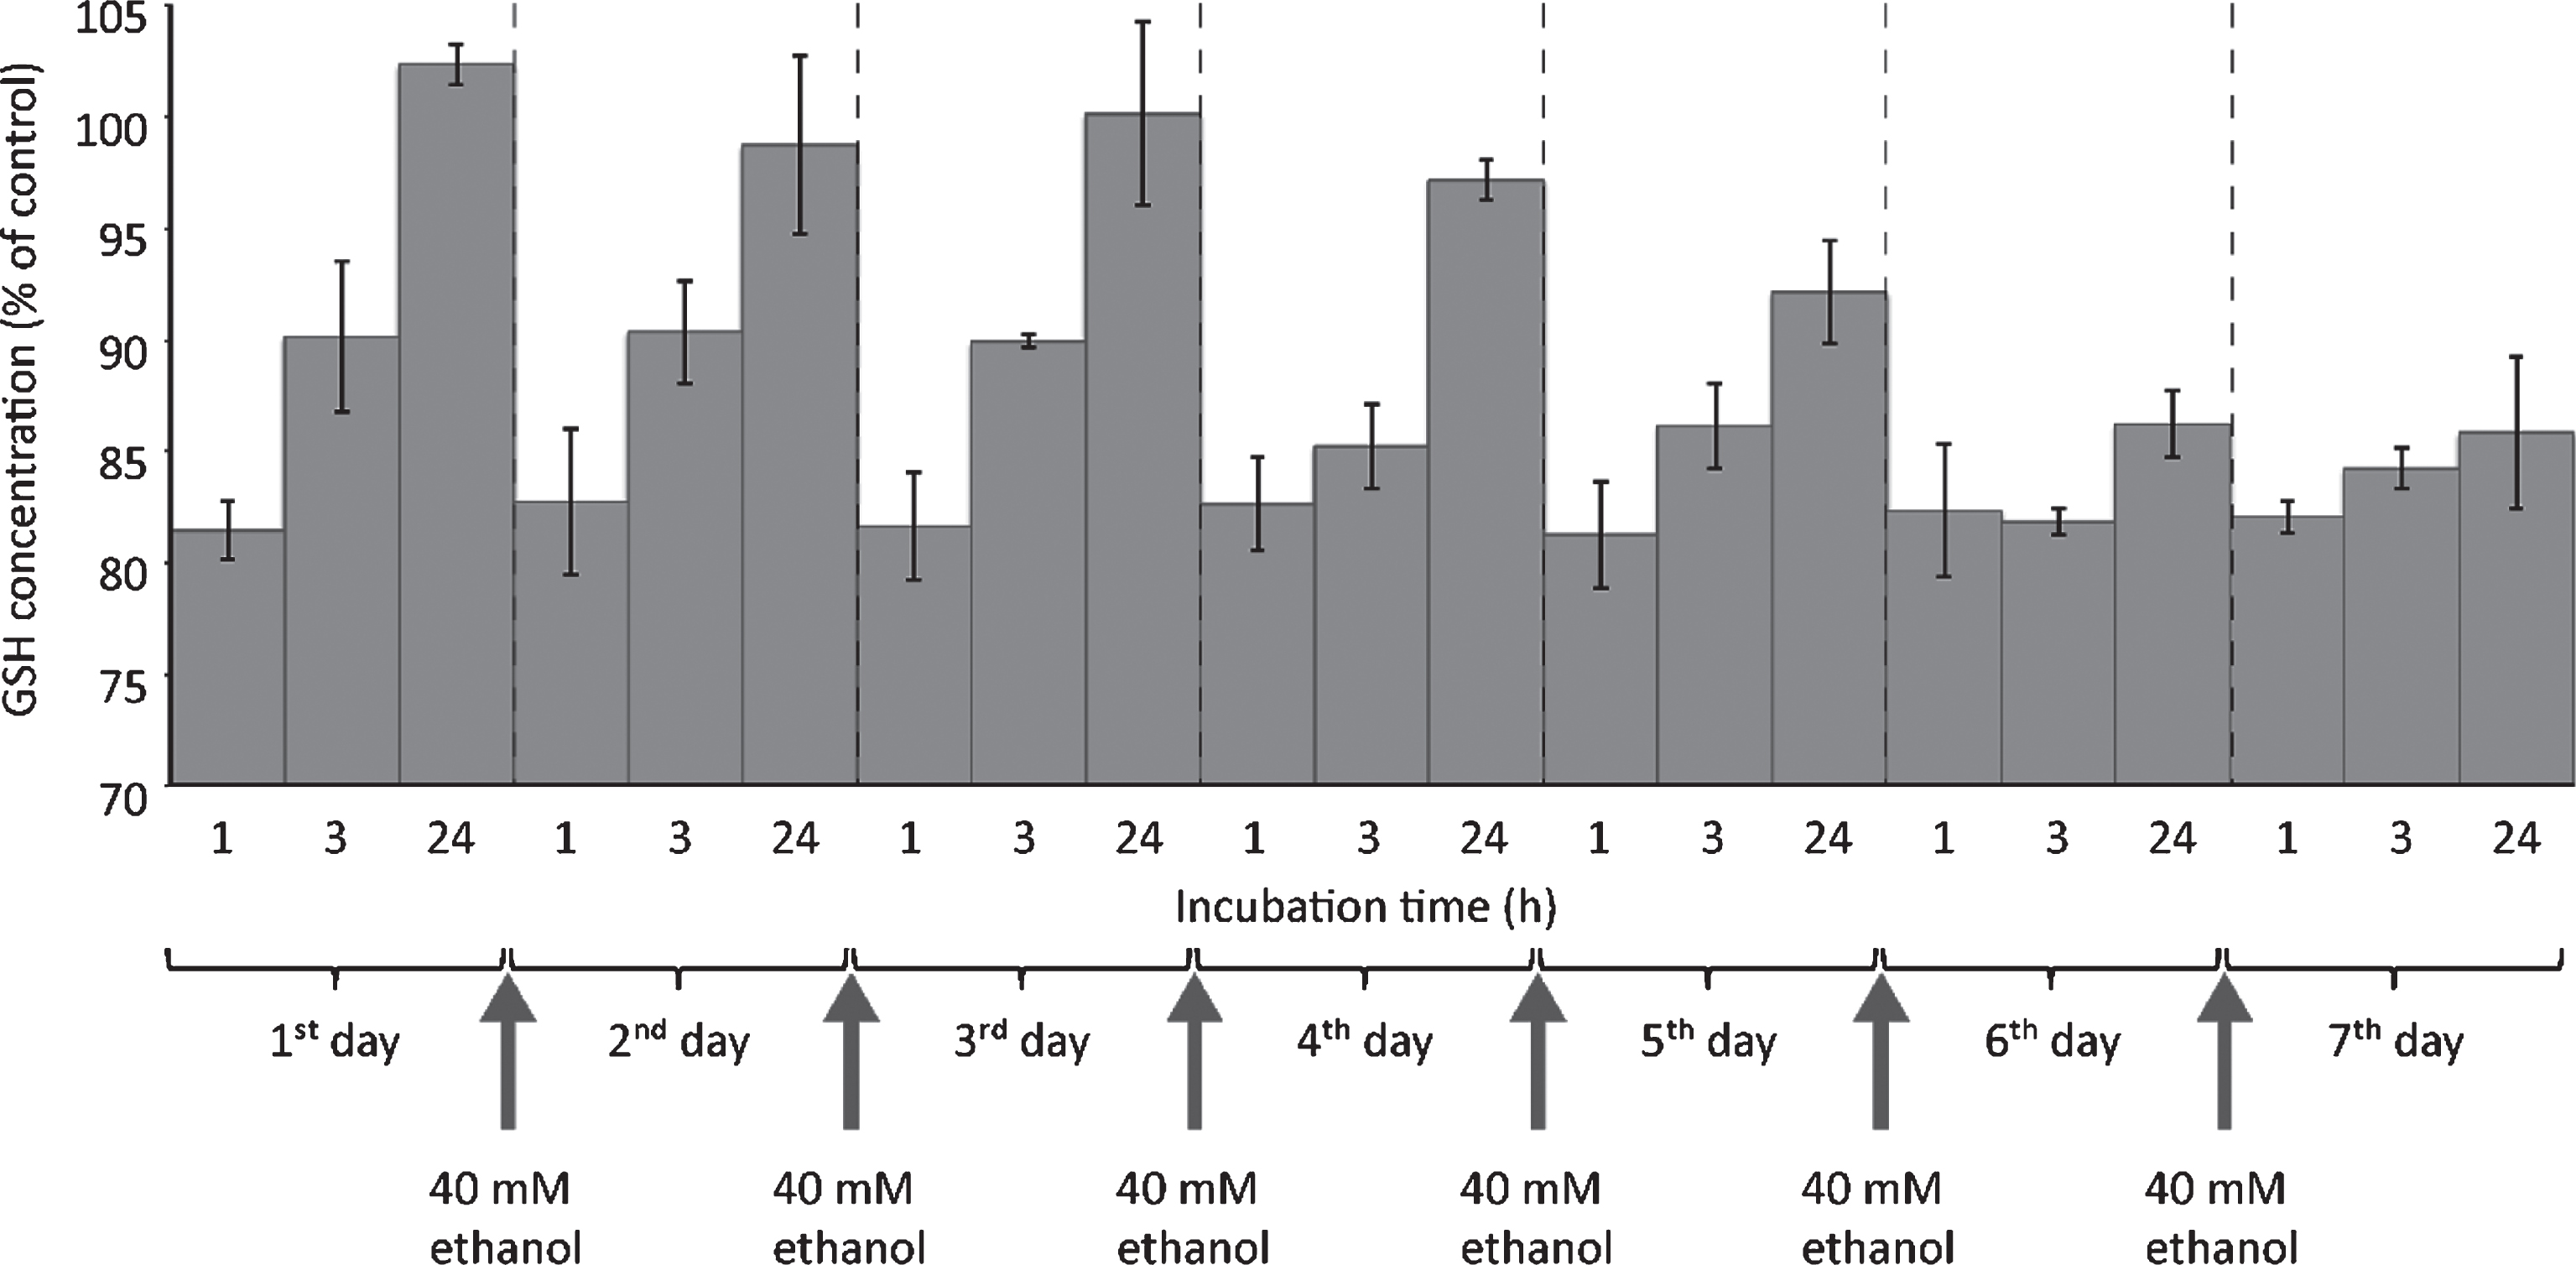
In order to get a clue about the influence of long-term ethanol treatment on the kinetics of GSH consumption, HepG2 were exposed to 40 mM ethanol for seven days, with medium changes every day. As can be seen in Fig. 5, on day one about 18% GSH reduction could be observed 1 hour after addition of medium containing 40 mM ethanol. This exactly reproduced the result shown in Fig. 4. After 3 hours, a partial recovery of intracellular GSH levels was visible. After 24 hours, the intracellular GSH levels were even slightly higher than normal. Apparently, there was an overcompensation of GSH regeneration. Until the fourth day, GSH levels were regenerated to almost normal levels within 24 hours after ethanol addition. Beginning with day five, GSH regeneration capacity apparently decreased: 24 hours after ethanol addition, the cells did not regenerate their intracellular GSH levels to normal values. On day seven, there was almost no GSH regeneration capacity visible any longer. Despite the fact that absolute GSH levels were not decreased by more than 20%, the absolute GSH regeneration capacity was almost used up when HepG2 cells were exposed to 40 mM ethanol for seven days, a concentration that did not affect short-term cell viability.
4Discussion
We were interested to investigate ethanol-induced hepatocellular cytotoxicity. Since there are many reports on ethanol cytotoxicity through the CYP2E1 microsomal ethanol-oxidizing system (MEOS)[3, 10, 11, 15, 18], we decided to investigate ethanol effects independent of CYP2E1 activity. In fact, several mechanisms exist that contribute to alcohol-induced alcoholic liver disease (ALD) with MEOS being one of them. We chose hepatocarcinoma HepG2 cell line as model known to lack significant CYP2E1 expression [14, 15]. Apparently, CYP2E1 gene expression is down-regulated in HepG2 cells but can be induced again by trichostatin M treatment [19]. Trichostatin M, which is an inhibitor of histone deacetylases, can cause rescue of epigenetically silenced gene expression [20]. Interestingly, HepG2 cell clones with exogenous overexpression of CYP2E1 showed substantial increases of ethanol-induced cytotoxicity [11, 15] thus seem to superimpose ethanol effects which are independent of MEOS.
We found that treatment of HepG2 cells with up to 40 mM ethanol did not cause a direct cytotoxic effect as measured by cell viability, in contrast to concentrations exceeding 50 mM (data not shown). This is in line with previously published results on HepG2 cells [21, 22]. By contrast, the group of Cederbaum did not find any significant toxicity with ethanol concentrations as high as 100 mM [15]. These divergent results might be due to the fact that we and Neuman et al. [21, 22] used parental HepG2 cells while the group of Cederbaum employed a HepG2 cell clone transduced by the retrovirus shuttle vector PMV-7. By contrast, when these HepG2 cells overexpressed human CYP2E1, a dramatic increase in ethanol-mediated cytotoxicity could be observed [15]. In our study, 40 mM ethanol was used as the highest concentration that is not directly cytotoxic.
We found that treatment of HepG2 with ethanol for up to seven days resulted in a reduction of GSH levels by only about 20% (Fig. 5). A similar moderate reduction of GSH stores by treatment of HepG2 cells with 30 mM ethanol for 48 hours was reported previously [23].
Despite any measurable direct cytotoxic effect and only moderate GSH consumption by 40 mM ethanol, this dosage apparently exerted a substantial long-term effect on GSH regeneration capacity. We found that HepG2 cells exposed to 40 mM ethanol could restore their initial GSH levels within a narrow time range of four days. Thereafter, GSH regeneration capacity gradually decreased with minimum if at all GSH regeneration at day seven. As HepG2 cells are known to lack CYP2E1 expression, this effect should be independent of MEOS. We conclude that long-term ethanol exposure has a substantial effect on GSH regeneration capacity in liver cells and that this could contribute toALD.
Acknowledgments
This work was funded by Ministerium für Arbeit, Soziales, Frauen und Familie, Land Brandenburg, Germany, and of Europäischer Sozialfonds (ESF 1398125).
References
[1] | Bruha R , Dvorak K , Petrtyl J . Alcoholic liver disease. World J Hepatol (2012) ;4: (3):81–90. |
[2] | Lieber CS , Decarli LM . Hepatic microsomal ethanol-oxidizing system. In vitro characteristics and adaptive propertiesin vivo. J Biol Chem (1970) ;245: (10):2505–12. |
[3] | Lieber CS . Microsomal ethanol-oxidizing system (MEOS): The first 30 years (1968–1998)—a review. Alcohol Clin Exp Res (1999) ;23: (6):991–1007. |
[4] | Wu D , Cederbaum AI . Oxidative stress mediated toxicity exerted by ethanol-inducible CYP2E1. Toxicol Appl Pharmacol (2005) ;207: (2 Suppl):70–6. |
[5] | Carpenter SP , Lasker JM , Raucy JL . Expression, induction, and catalytic activity of the ethanol-inducible cytochrome P450 (CYP2E1) in human fetal liver and hepatocytes. Mol Pharmacol (1996) ;49: (2):260–8. |
[6] | Kostrubsky VE , Strom SC , Wood SG , Wrighton SA , Sinclair PR , Sinclair JF . Ethanol and isopentanol increase CYP3A and CYP2E in primary cultures of human hepatocytes. Arch Biochem Biophys (1995) ;322: (2):516–20. |
[7] | Clemens DL , Forman A , Jerrells TR , Sorrell MF , Tuma DJ . Relationship between acetaldehyde levels and cell survival in ethanol-metabolizing hepatoma cells. Hepatology (2002) ;35: (5):1196–204. |
[8] | Uysal M , Ozdemirler G , Kutalp G , Oz H . Mitochondrial and microsomal lipid peroxidation in rat liver after acute acetaldehyde and ethanol intoxication. J Appl Toxicol (1989) ;9: (3):155–8. |
[9] | Hayashi N , George J , Takeuchi M , Fukumura A , Toshikuni N , Arisawa T , et al. Acetaldehyde-derived advanced glycation end-products promote alcoholic liver disease. PLoS One (2013) ;8: (7):e70034. |
[10] | Albano E . Alcohol, oxidative stress and free radical damage. Proc Nutr Soc (2006) ;65: (3):278–90. |
[11] | Cederbaum AI , Lu Y , Wu D . Role of oxidative stress in alcohol-induced liver injury. Arch Toxicol (2009) ;83: (6):519–48. |
[12] | Gutierrez-Ruiz MC , Gomez Quiroz LE , Hernandez E , Bucio L , Souza V , Llorente L , et al. Cytokine response and oxidative stress produced by ethanol, acetaldehyde and endotoxin treatment in HepG2 cells. Isr Med Assoc J (2001) ;3: (2):131–6. |
[13] | Schieber M , Chandel NS . ROS function in redox signaling and oxidative stress. Curr Biol (2014) ;24: (10):R453–R462. |
[14] | Garige M , Gong M , Rao MN , Zhang Y , Lakshman MR . Mechanism of action of ethanol in the down-regulation of Gal(beta)1, 4GlcNAc alpha2,6-sialyltransferase messenger RNA in human liver cell lines. Metabolism (2005) ;54: (6):729–34. |
[15] | Wu D , Cederbaum AI . Ethanol cytotoxicity to a transfected HepG2 cell line expressing human cytochrome P4502E1. J Biol Chem (1996) ;271: (39):23914–9. |
[16] | Senft AP , Dalton TP , Shertzer HG . Determining glutathione and glutathione disulfide using the fluorescence probeo-phthalaldehyde. Anal Biochem (2000) ;280: (1):80–6. |
[17] | Johansson AS , Mannervik B . Human glutathione transferase A3-3, a highly efficient catalyst of double-bond isomerization in the biosynthetic pathway of steroid hormones. J Biol Chem (2001) ;276: (35):33061–5. |
[18] | French SW . The importance of CYP2E1 in the pathogenesis of alcoholic liver disease and drug toxicity and the role of the proteasome. Subcell Biochem (2013) ;67: :145–64. |
[19] | Yang H , Nie Y , Li Y , Wan YJ . Histone modification-mediated CYP2E1 gene expression and apoptosis of HepG2 cells. Exp Biol Med (Maywood) (2010) ;235: (1):32–9. |
[20] | Grassi G , Maccaroni P , Meyer R , Kaiser H , D’Ambrosio E , Pascale E , et al. Inhibitors of DNA methylation and histone deacetylation activate cytomegalovirus promoter-controlled reporter gene expression in human glioblastoma cell line U87. Carcinogenesis (2003) ;24: (10):1625–35. |
[21] | Neuman MG , Shear NH , Cameron RG , Katz G , Tiribelli C . Ethanol-induced apoptosis in vitro. Clin Biochem (1999) ;32: (7):547–55. |
[22] | Neuman MG , Koren G , Tiribelli C . In vitro assessment of the ethanol-induced hepatotoxicity on HepG2 cell line. Biochem Biophys Res Commun (1993) ;197: (2):932–41. |
[23] | Ogony J , Matthews R , Anni H , Shannon K , Ercal N . The mechanism of elevated toxicity in HepG2 cells due to combined exposure to ethanol and ionizing radiation. J Appl Toxicol (2008) ;28: (3):345–55. |
Figures and Tables
Fig.1
Workflow of GSH assay. For more details see text.
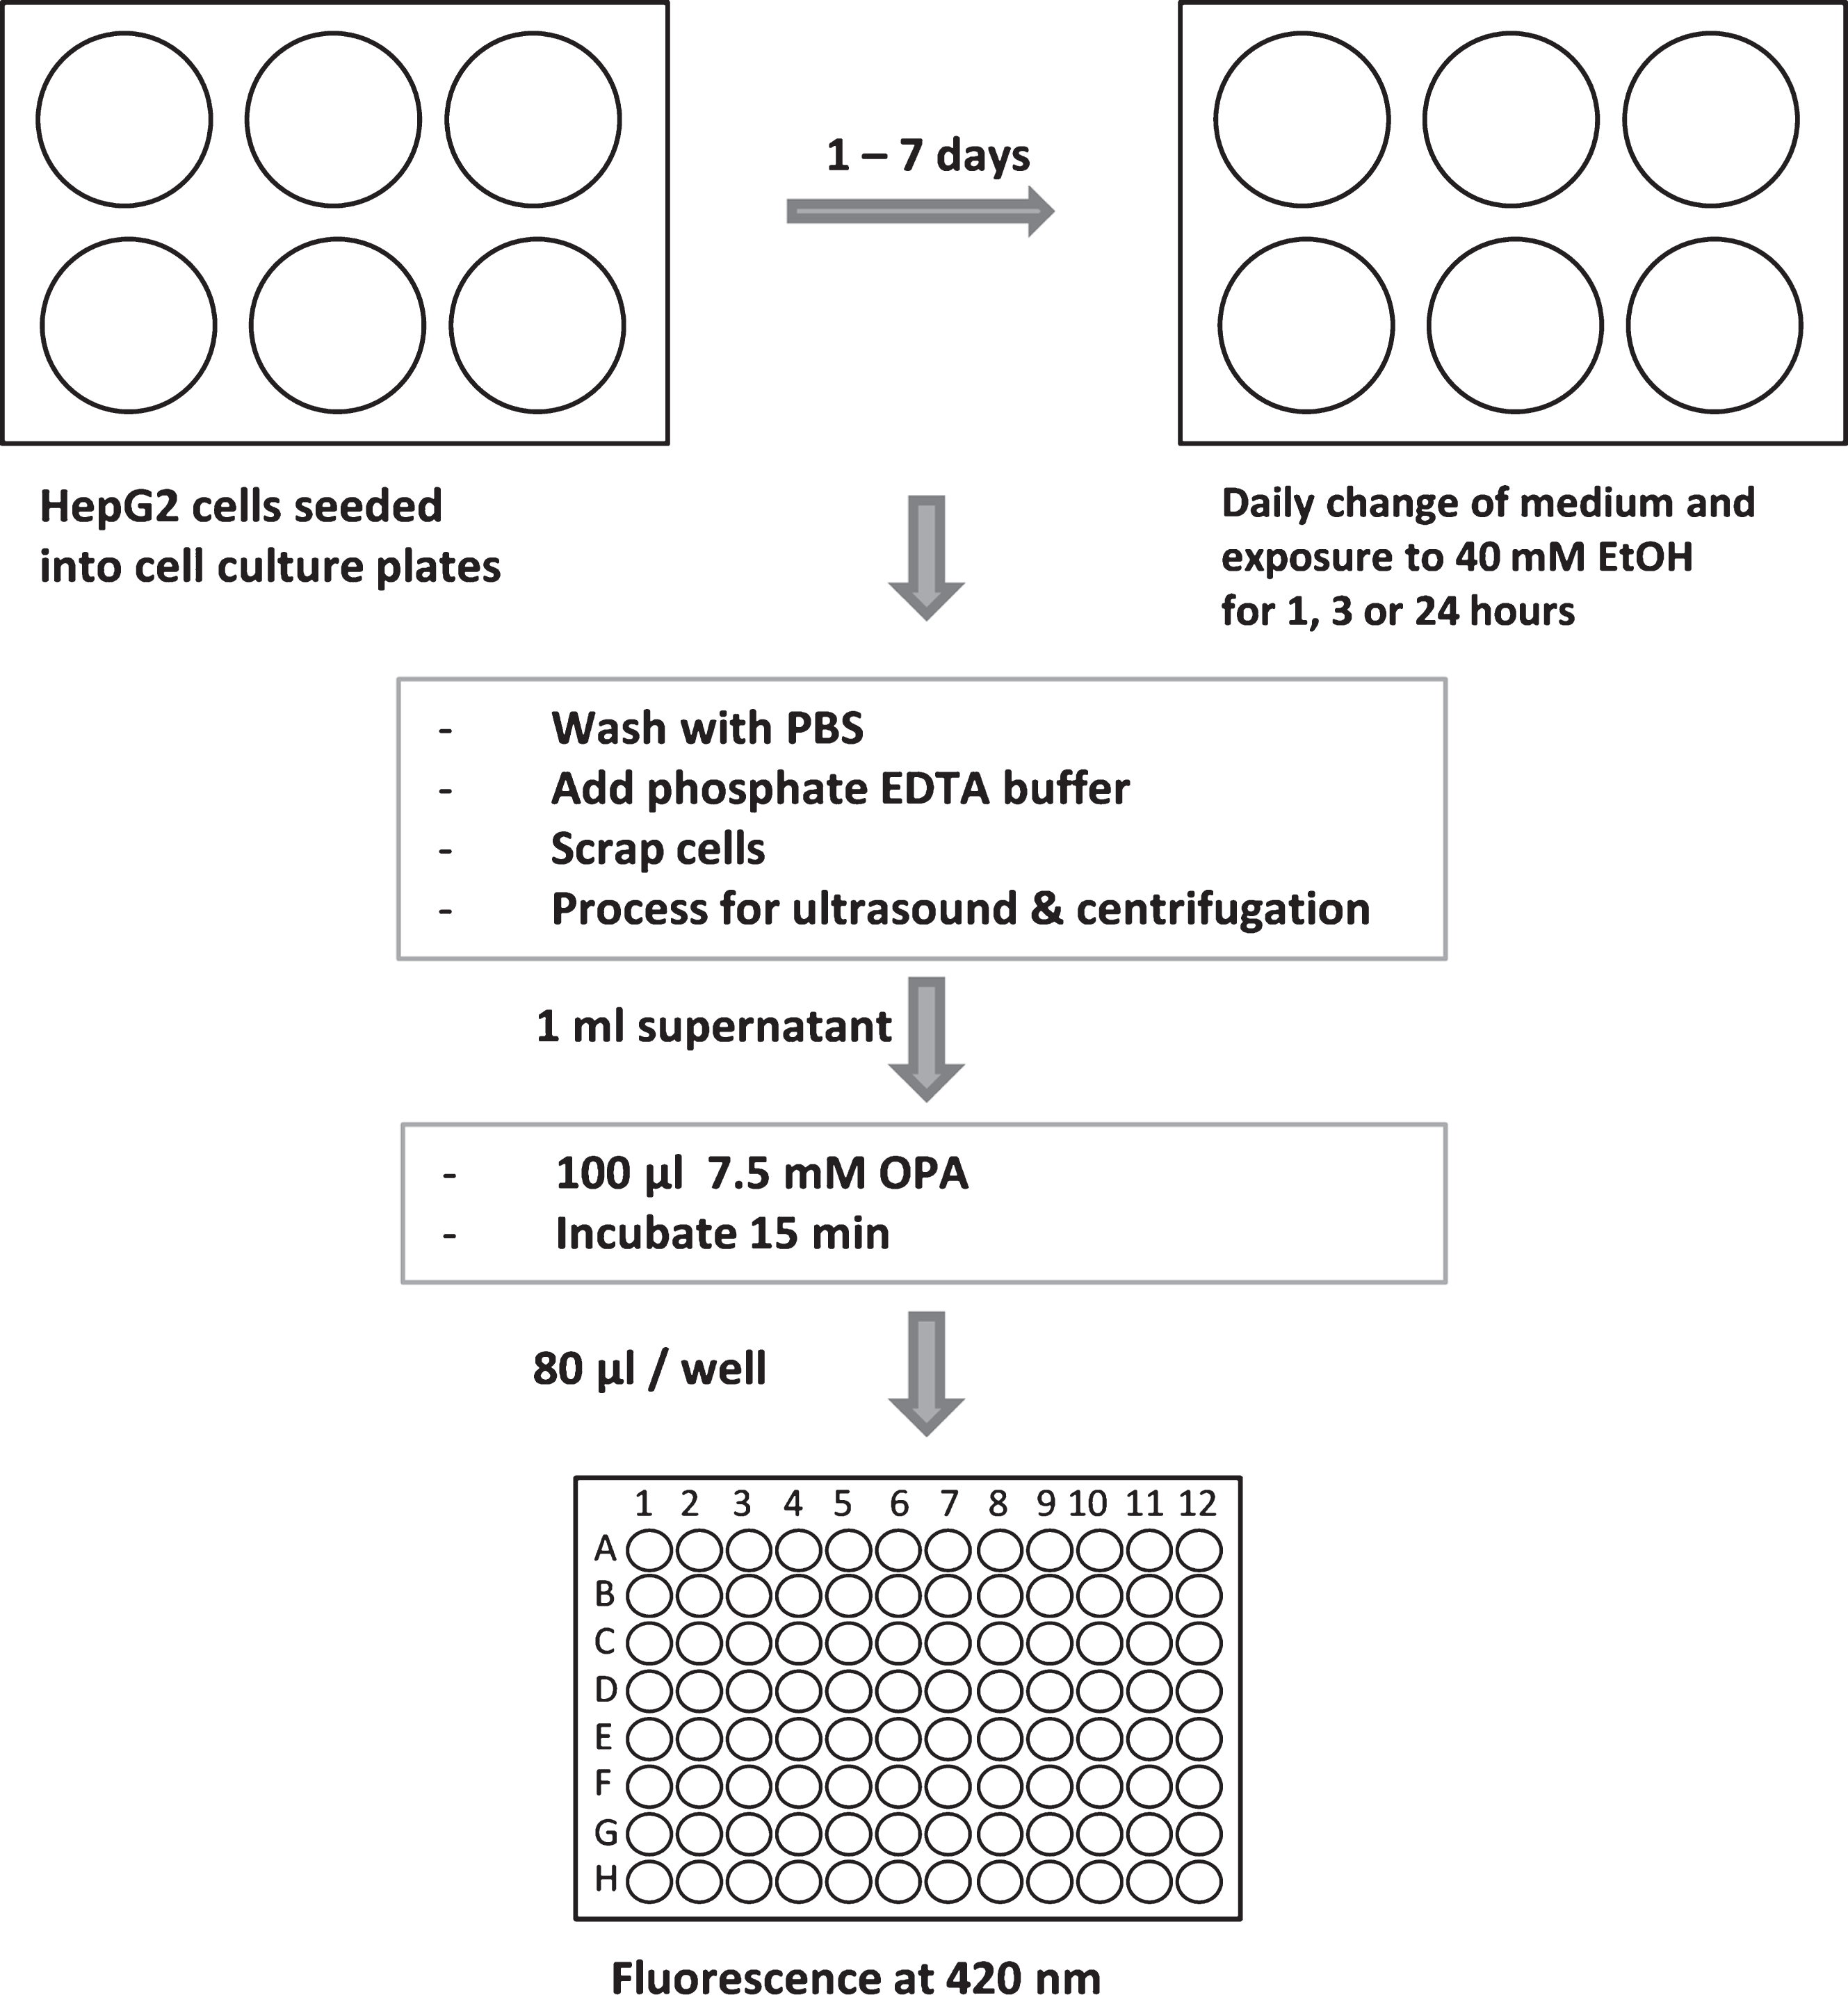
Fig.2
GSH calibration curve. GSH was diluted in PEB and incubated with OPA as described in Materials and Methods. Fluorescent GSH-OPA product was analyzed by using a Fluorescence Multi-Well Plate Reader (excitation 350 nm / emission 420 nm). One well containing only PEB was used as blank and subtracted from each sample value.
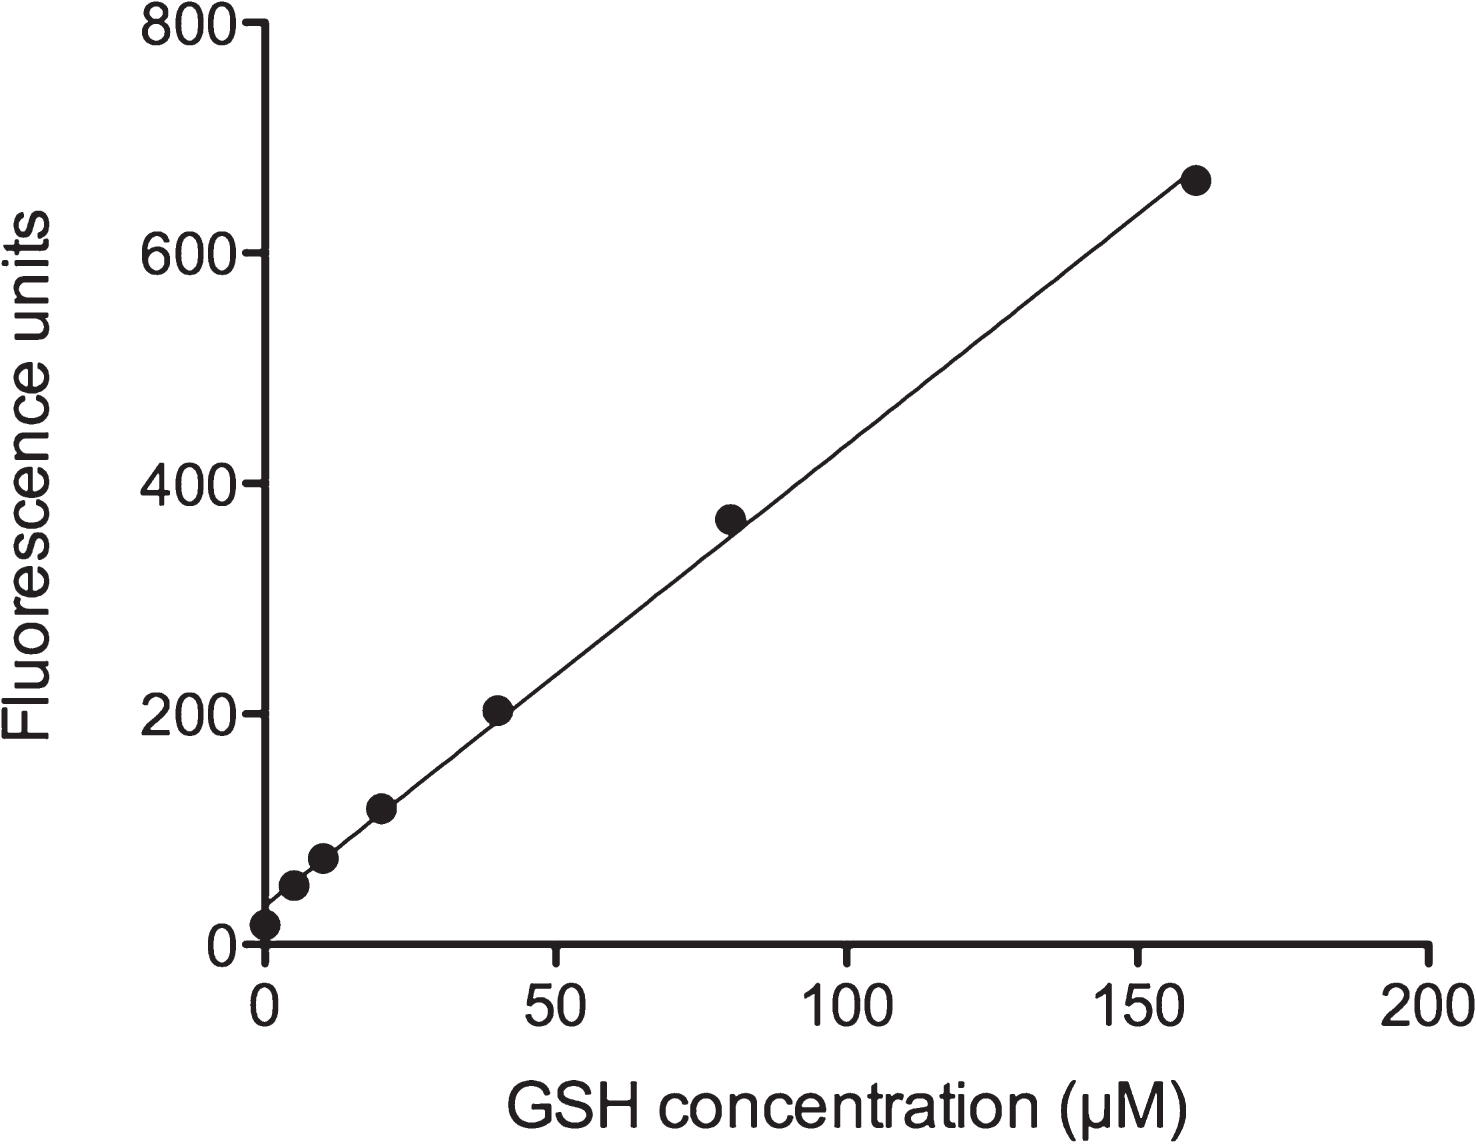
Fig.3
Specificity of OPA reaction with GSH. To exclude unspecific reactions of OPA with intracellular GSSG or L-cysteine, the binding specificity of OPA to GSH was verified. As described in Materials and Methods, GSH was substituted by the identical concentration (160 μM) of GSSH or L-cysteine. Reactions were evaluated by using a Fluorescence Multi-Well Plate Reader (excitation 350 nm / emission 420 nm). In addition, blocking of the OPA-GSH reaction by using N-ethylmaleimide (NEM) was investigated as indicated.
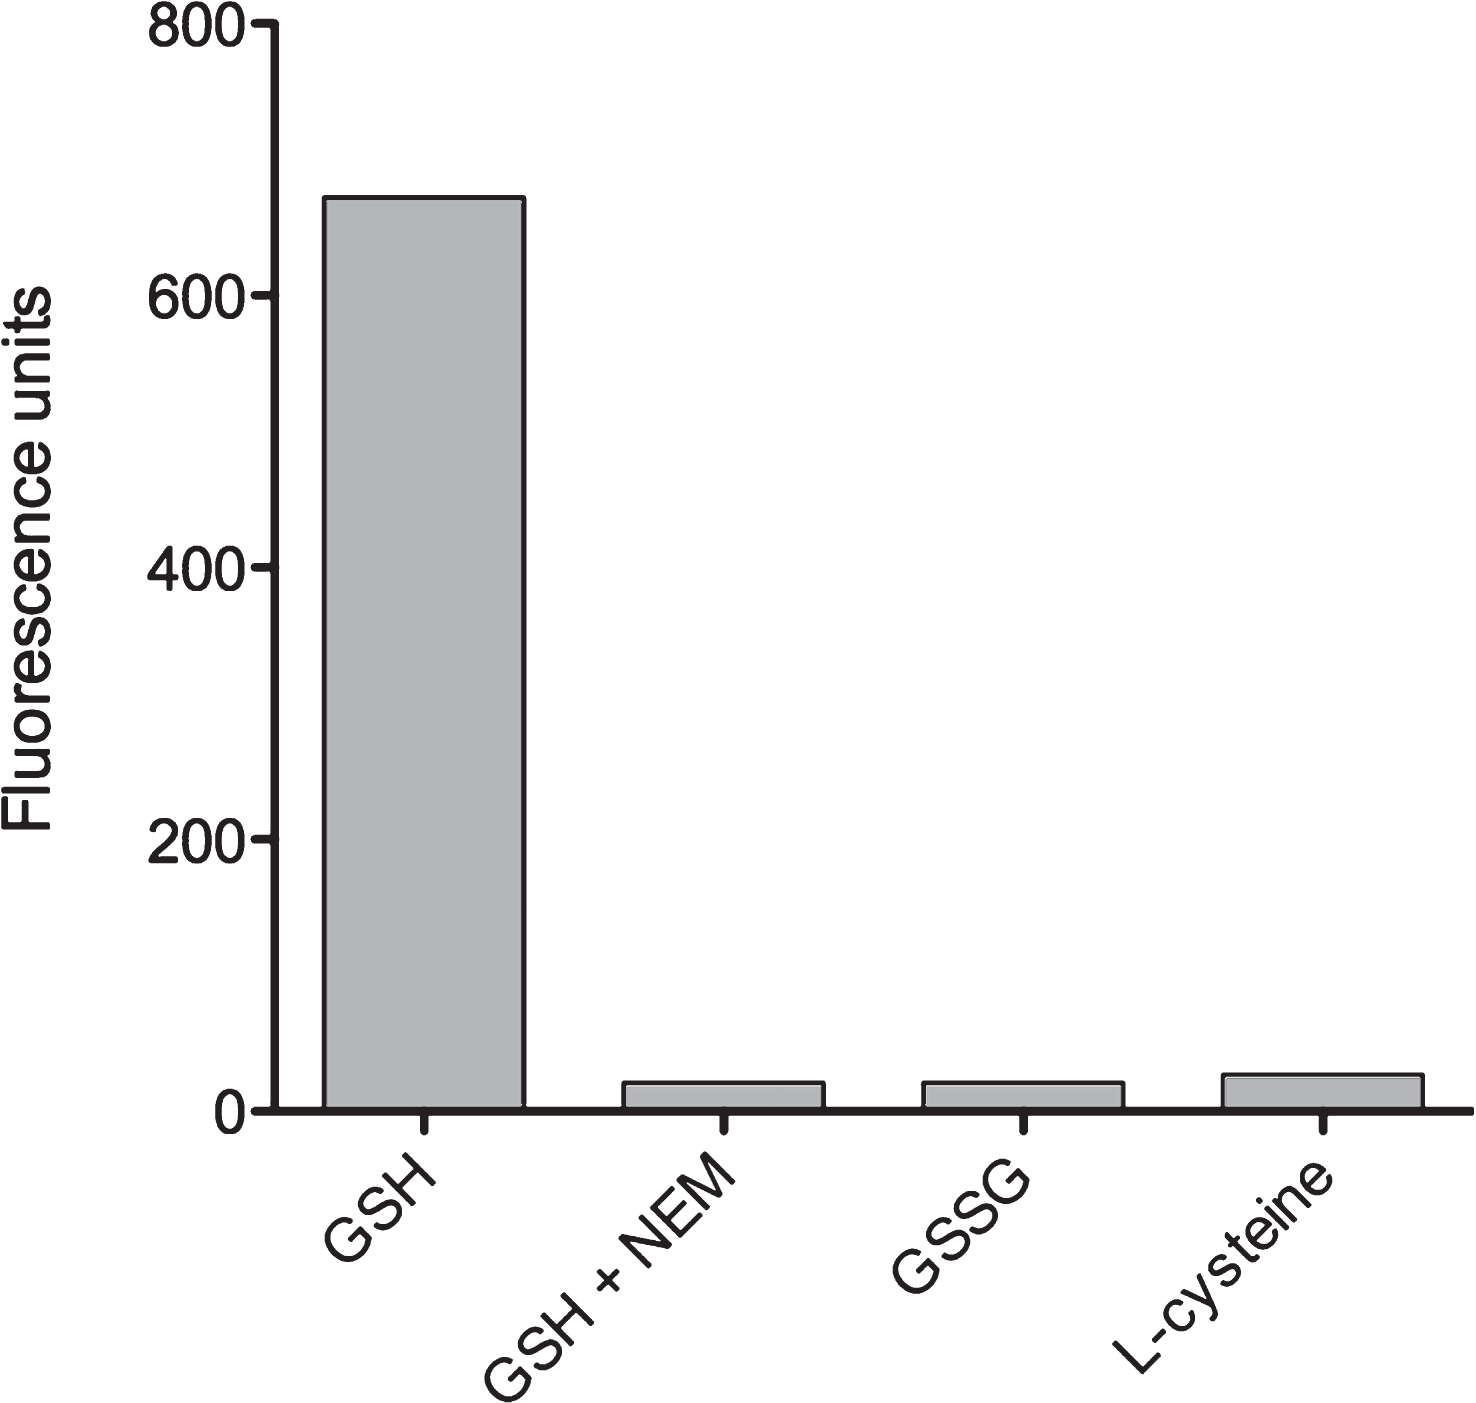
Fig.4
Short-term ethanol exposure reduces GSH levels. Twenty four hours after seeding of HepG2 cells into 6 well plates, medium was changed and cells were exposed to different ethanol concentrations for 1 hour, as indicated. Thereafter, cells were harvested and processed for fluorometric detection of GSH levels as described in Materials and Methods. GSH concentrations are depicted as % of control (no ethanol treatment). Data are expressed as mean±SD of three independent experiments performed in triplicates.
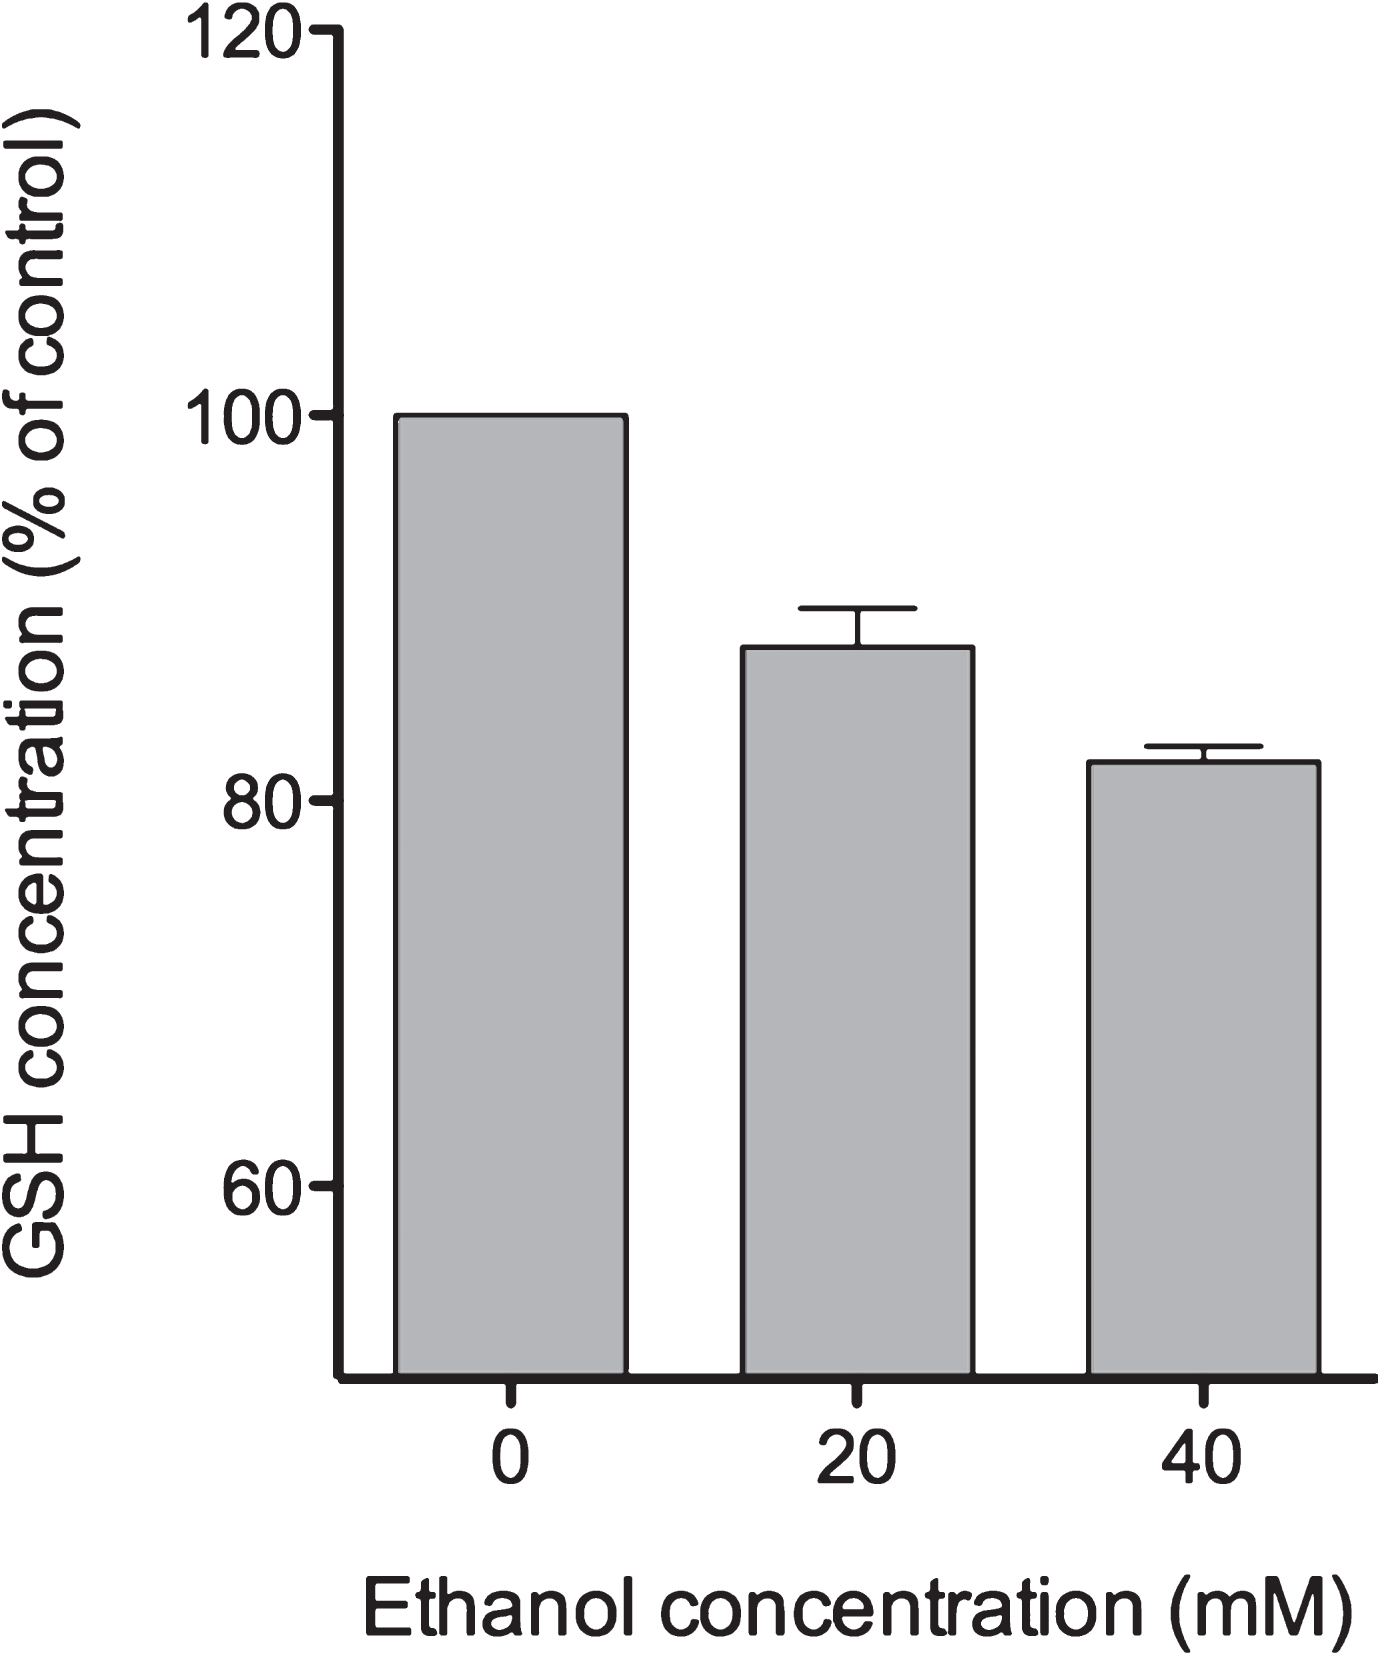
Fig.5
One-week ethanol exposure causes cessation of GSH regeneration capacity. HepG2 cells were seeded into 6 well plates and cultivated for 24 hours. Thereafter, medium was changed and cells were exposed to 40 mM ethanol. For chronic ethanol exposure, cell culture medium containing 40 mM ethanol was replaced daily until day 7. GSH consumption was evaluated 1, 3 or 24 hours after start of each new ethanol exposure. At the indicated time points, cells were harvested and further processed for fluorometric detection of GSH levels as described in Materials and Methods. Data are expressed as mean ± SD of three independent experiments performed in triplicates.