
Cellular automata model for human articular chondrocytes migration, proliferation and cell death: An in vitro validation
Abstract
Articular cartilage is characterized by low cell density of only one cell type, chondrocytes, and has limited self-healing properties. When articular cartilage is affected by traumatic injuries, a therapeutic strategy such as autologous chondrocyte implantation is usually proposed for its treatment. This approach requires in vitro chondrocyte expansion to yield high cell number for cell transplantation. To improve the efficiency of this procedure, it is necessary to assess cell dynamics such as migration, proliferation and cell death during culture. Computational models such as cellular automata can be used to simulate cell dynamics in order to enhance the result of cell culture procedures. This methodology has been implemented for several cell types; however, an experimental validation is required for each one. For this reason, in this research a cellular automata model, based on random-walk theory, was devised in order to predict articular chondrocyte behavior in monolayer culture during cell expansion. Results demonstrated that the cellular automata model corresponded to cell dynamics and computed-accurate quantitative results. Moreover, it was possible to observe that cell dynamics depend on weighted probabilities derived from experimental data and cell behavior varies according to the cell culture period. Thus, depending on whether cells were just seeded or proliferated exponentially, culture time probabilities differed in percentages in the CA model. Furthermore, in the experimental assessment a decreased chondrocyte proliferation was observed along with increased passage number. This approach is expected to having other uses as in enhancing articular cartilage therapies based on tissue engineering and regenerative medicine.
1Introduction
Articular cartilage is a specialized connective tissue located at the ends of bones in the articular surfaces [1]. The functional properties of articular cartilage are related to reducing friction coefficient and support mechanical loads between opposing joint surfaces [2]. Given its damping function, articular cartilage is continuously exposed to mechanical loads that often result in an important number of individuals affected worldwide with cartilage related diseases [3]. Limited articular cartilage self-healing properties entail novel therapeutic options for its treatment, particularly when it is affected by traumatic injuries [4–7]. Among these are non-invasive interventions, such as physical therapy to relieve pain locally [8] or invasive treatments such as microfractures, mosaicplasty, osteotomy and Autologous Chondrocyte Implantation (ACI) to repair or reconstruct the injured cartilage [3, 4, 6, 9]. The ACI is a technique intended to expand the patient’s chondrocytes through in vitro cultures. Once a sufficient number of chondrocytes have been obtained, cells are re-implanted into the injured articular cartilage for restorative benefits [5, 6, 10, 11]. The employment of the ACI technique entails the consideration of several variables in the cell cultures such as the cell culture time, the cell population to be reached and the molecular synthesis [12]. Therefore, this treatment could be enhanced if computational methods allow to predict chondrocyte cell dynamics: migration, proliferation and cell death in order to improve in vitro procedures and increase the success of the therapy on articular cartilage recovery. The combination of agent-based models with experimental procedures, such as the use of a cellular automata (CA), can help to understand the behavior of experimental procedures to improve the cost-efficient performance of the experimental procedures carried out in cell culture [13].
A CA is an agent-based model that considers particles occupying a space in a regular lattice. Particles move randomly and change of state depending on current position and neighbors [14]. The CA can simulate cell dynamics such as migration, proliferation and cell death, provided that the CA is combined with stochastic tools that homogeneously model and distribute the particles in a given space [13]. In this context, the random-walk theory is a stochastic process formed by a successive sum of variables, independent and identical, randomly distributed (Gaussian distribution) [15]. Such theoretical approach has facilitated the simulation of the random cell migration, the number of proliferating cells during cell dispersion and the differentiation process [13, 16]. Moreover, the random-walk theory presents advantages over other models, such as diffusion. This model, used to simulate migration and proliferation, tend to create a smooth variation in cell density, which is an event that does not occur physiologically [16]. Additionally, the cell culture dynamics such as cell culture density, population-average, speed of locomotion and spatial cell distribution, all of them essential to determine temporal evolution of cell proliferation rates, can be predicted using a CA [17].
Regarding the applications, a CA helped to demonstrate that cell migration is a random fluctuation that does not depend on the surface area, but it is highly dependent on the initial parameters [18]. Longo and co-workers implemented a CA to analyze the spatial and temporal movements of blastocoel roof cells during epiboly. Their results showed that the model was able to predict cell rearrangements during epiboly and lateral dispersion of a patch of cells implanted in the blastocoel roof [19]. On the other hand, a CA in combination with random-walk theory was implemented to simulate the dynamics of muscle satellite cells: migration, proliferation and differentiation. Results from this work demonstrated that it was possible to predict the cell behavior through the computational model and the feedback with the in vitro experiments [13]. In this context, in order to validate CA results it is necessary to perform in vitro experiments for each cell type [13, 16, 20, 21]. Even though computer models have assessed cell dynamics in different cellular types [13, 21], to our knowledge, a CA model is yet to be done to simulate chondrocyte behavior. For instance, a CA was implemented to model the random cell motion and the production of substrate adhesion molecules of avian limb bud precartilage cells. Results showed that the CA adequately simulates the cell proliferation, the cell focal condensation over the well plate surface and substrate adhesion molecules production [22]. Additionally, the model was enhanced by adding multipixel cells with variable geometry and separation of spatial scales in the form of modeling cells and extracellular matrix molecules on grids of differing mesh size [23]. In these works, the implemented CA was used to simulate the chondrogenesis process, where mesenchymal cells proliferate and differentiate into chondrocytes forming a cartilaginous mold that subsequently undergoes in an ossification process (endochondral ossification) [24]. However, no studies have been carried out to assess the behavior of articular cartilage cells cultured in vitro. Thus, the aim of this research was to shed light on articular chondrocyte monolayer culture behavior. Accordingly, in this research the cell dynamics of chondrocytes was simulated using a CA, based on random-walk theory, with the aim to predict migration, proliferation and cell death. We hypothesize that the three processes can be accurately modeled as being completely stochastic.
Additionally, in this study two cell culture passages were assessed in order to document the replicative senescence experienced by a monolayer cell culture. Cell culture passages are referring to reseeding a subset of the cells obtained from previous proliferation periods in a new cell culture well plate. Furthermore, the surface tension effect was monitored in order to ensure that cell distribution was completely homogeneous over the entire surface of the well plate, since cells cultured in monolayer tend to locate in the well plate edges [13]. In this context, the results obtained from this study are relevant to enhance culture conditions of articular chondrocytes for future therapeutic strategies in tissue engineering and regenerative medicine. Moreover, the experimental and computational data allow to establish the best cell culture time and cell culture passage in order to standardize the in vitro procedures [6].
2Material and methods
2.1Experimental data
2.1.1Cell culture
Human articular chondrocytes of the knee (LONZA, Walkersville, MD USA) were cultured and expanded at passages one (P1) and two (P2). Cells were then seeded onto 96 well plates at 3.000 cells per well (according to instructions by LONZA, Walkersville, MD USA). Culture media was changed every other day, and cells were maintained in humidified atmosphere at 37°C with 5% CO2.
2.1.2Surface tension assay
Different culture media volumes per well were added in order to assess the surface tension effect on cell distribution within the well plate (Fig. 1A–E). Photographic records were daily captured within the week of culture. The meniscus formed at the superior border of the cell culture medium is the result of the surface tension effect. In this study, instead of measuring the surface tension, we rely on the theory of this physical phenomenon to explain the meniscus effect over the cell distribution.
Fig.1
Representative scheme to evaluate the surface tension effect over cell distribution. Different volumes of cell culture medium were implemented per each well plate. A) 50μl. B)100μl. C) 150μl. D) 200μl. E) 250μl.

2.1.3Cell migration assay
Cell migration was evaluated by photographic record in the third day, when cells are in a 50% of confluence and it is possible to observe random movement. The chondrocytes were assessed under normal cell culture conditions (200μl of cell culture medium). Photographs were taken every two hours for a total period of 12 hours and the snap shot location was ensured by a reference point in the well. Pictures taken at different times can only illustrate cell movement inside the well plate. There is no quantification of how many cells and which distance they moved.
2.1.4Proliferation and cell death assay
Cell proliferation was assayed on a daily basis for one week. Cells were counted with a hemocytometer; viability and cell death were determined by Trypan blue stain. Viable cells selectively inhibit Trypan blue to cross the cell membrane. Hence, dead cells become blue and can be counted under a light microscope. Proliferation between P1 and P2 was compared by slope values during the Lag phase: from day zero to day four of culture and log phase from day four to one week of culture.
2.1.5Statistical analysis
All analyses were performed as mean ± SD (n = 3). Experimental and computational data obtained were analyzed by non-parametric statistics for each time-point (day zero, four days, one week). Wilcoxon rank test was performed for cell migration and proliferation. Kruskal-Wallis test for cell death (GraphPad v.6.0, Software Inc., California USA). In addition, in order to compare the proliferation differences between P1 and P2 chondrocytes, an F test was performed between slope values. Statistical differences were considered significant at p < 0.05.
2.2Computational implementation
2.2.1Cellular automata algorithm
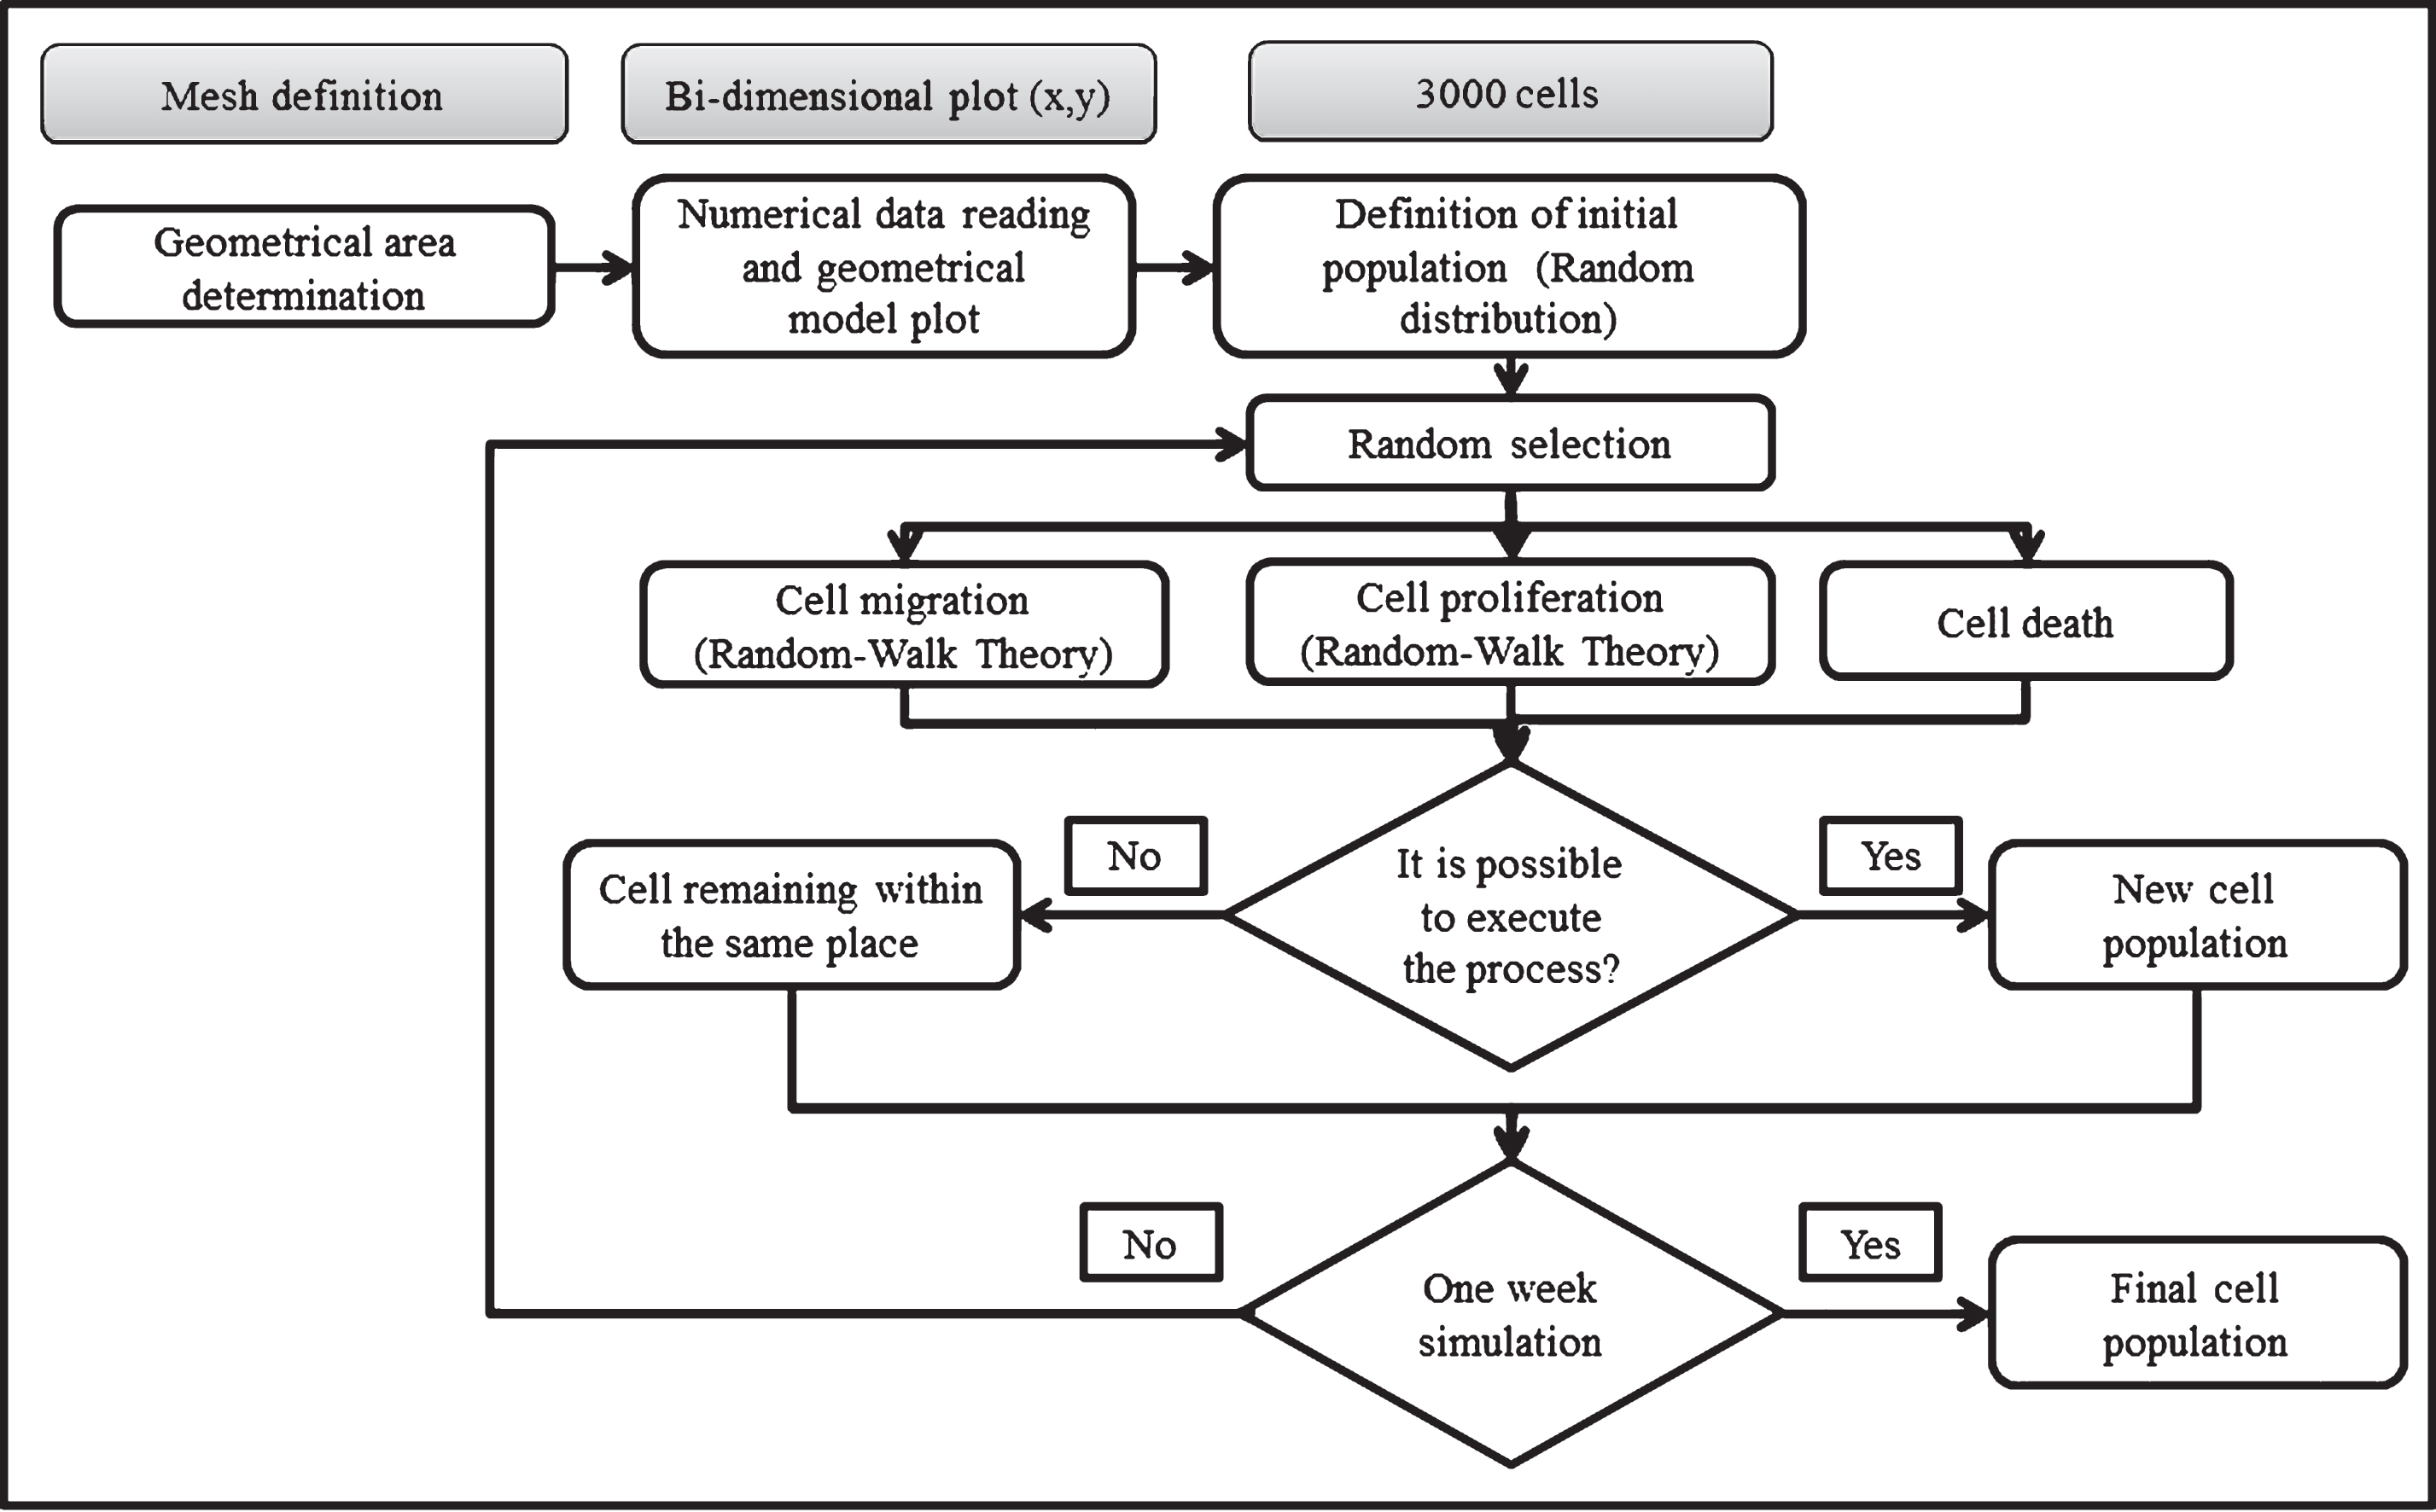
To solve the CA the following algorithm was implemented (Fig. 2). First, the geometrical model (surface area and seeded cells) was represented and plotted in a bi-dimensional space (x-y plane). Secondly, an initial population of 3.000 cells was randomly distributed in 384.400 elements. Each element was only occupied by one cell. Once cells were arbitrarily distributed, a scheduled routine localized possible neighbors for each cell. Last, the model considered a computational framework to weigh probabilities for cell migration (pm), proliferation (pp) or death (pd). The cells were randomly chosen.
Fig.2
Algorithm used to solve the CA. The algorithm consist in define the geometric area (well plate) and the initial cell population. Then, the cells are randomly placed in order to initiate a selective process for the cells can migrate, proliferate or die. If any of this events is executed a new cell population is generated, if not the cell remain in the same place. This process is repeated iteratively until complete one week of simulation with the aim of obtains a final cell population.
Due to the computational model included random cell movement, proliferation and cell death using a classical algorithm, the cellular dynamics was defined by weighted probabilities derived from experimental data using as the input parameter cell proliferation; therefore, the cell dynamics varies according to the cell culture period. According to this, the cell culture periods assessed in this study are the Lag phase (from day zero to day fourth) in which cells becoming accustomed to the ambient conditions, and the Log phase (from day fourth to one week) in which cells experienced an exponential growth. Therefore, depending on whether cells were just seeded or proliferated exponentially, culture time probabilities differed in percentages in the CA model. The outputs of the computational model are the weighted probabilities, expressed as a percentage, of the number of cells that are migrating, proliferating and dying. The computational analysis was carried out for both P1 and P2. The CA algorithm was performed using FORTRAN 90 (Formula Translating System, New York, USA) and results were visualized in TECPLOT 360 (Tecplot Inc. Bellevue), respectively.
2.2.2Geometrical model: Surface area and cell morphology
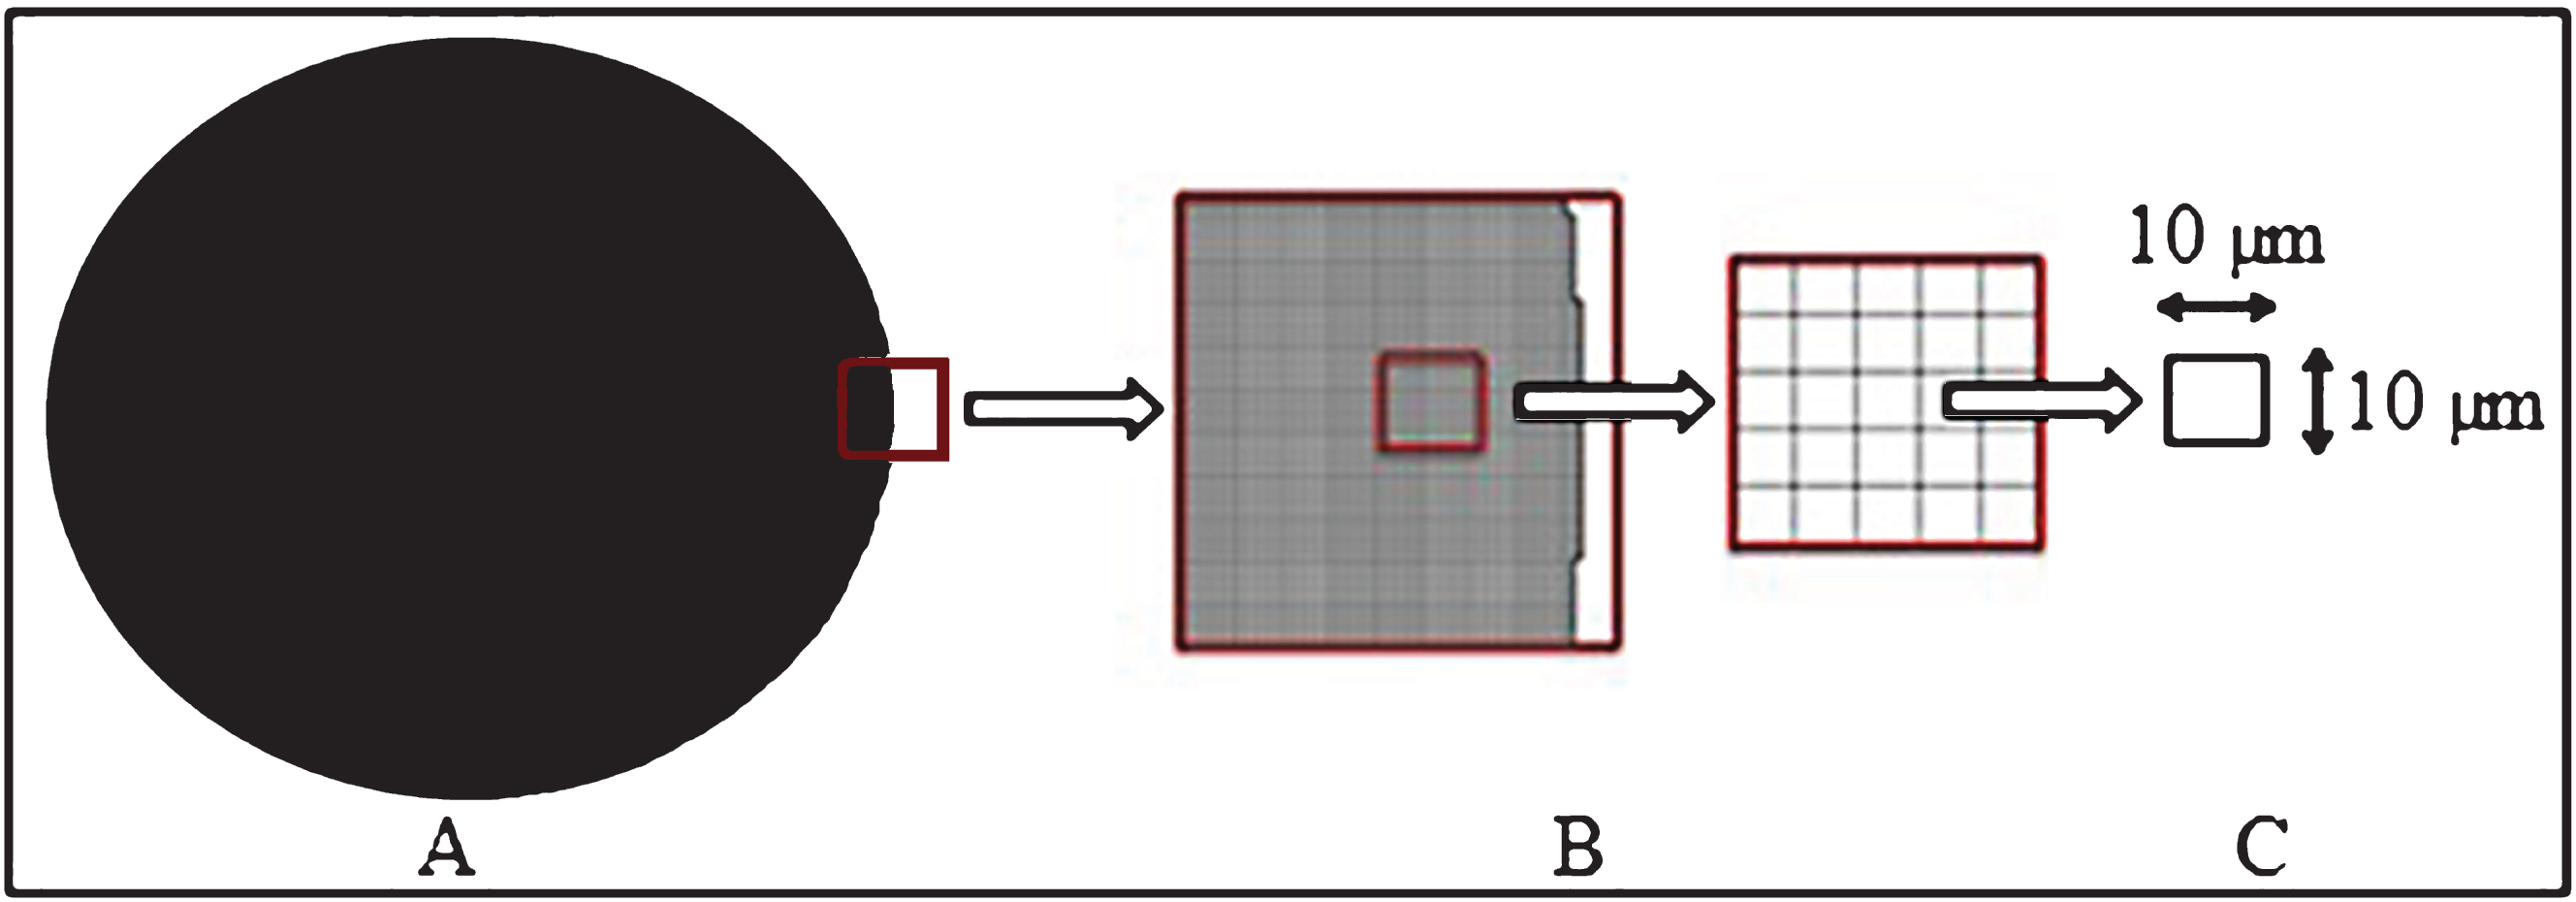
The surface area of 96 well plates was represented as a circle of 0.3 cm2 (Fig. 3A). This area was gridded with a lattice of 10×10μm since it was assumed that a seeded chondrocyte should occupy this specific space according to cell dimensions described in the literature (Fig. 3B) [25]. Cell morphology was assumed as a square inside the 10×10μm grid for its representation in the mesh (Fig. 3C).
Fig.3
Geometrical model. A) A well plate from a 96 cell culture well plate with a superficial area of 0.3 cm2. B) A mesh created with Cubit 10.0 representing the elements where the cells are cultured. C) Mesh zoom showing the area of each cultured cell, called element.
2.2.3Cellular state
According to the computational model, cells could migrate, proliferate or die. We call these cell dynamics events as cellular state. These states differed during Lag or Log phase. We attributed weighted probabilities as distinct percentages for each cellular state in order to fulfill the condition ∑p = 1, where p depends on migration probability (pm), proliferation probability (pp), and death probability (pd), resulting in ∑p = pm + pp + pd = 1. According to Lag or Log phase, different probabilities were weighted for each cellular state.
2.2.4Neighborhood characterization
To implement the CA model it is necessary to define a neighborhood around the element. Neighborhoods delimit the adjoining set of cells and relative position to each of them as a spatial arrangement of elements, where every single participant has an influence on one or more elements. Starting from an initial state of the cell population, cells change their states synchronously at each instant. This change is established via Von Neumann neighborhood system. The probabilistic aspects of the simulation must be considered within its dynamics.
2.2.5Cell migration (pm, md, as)
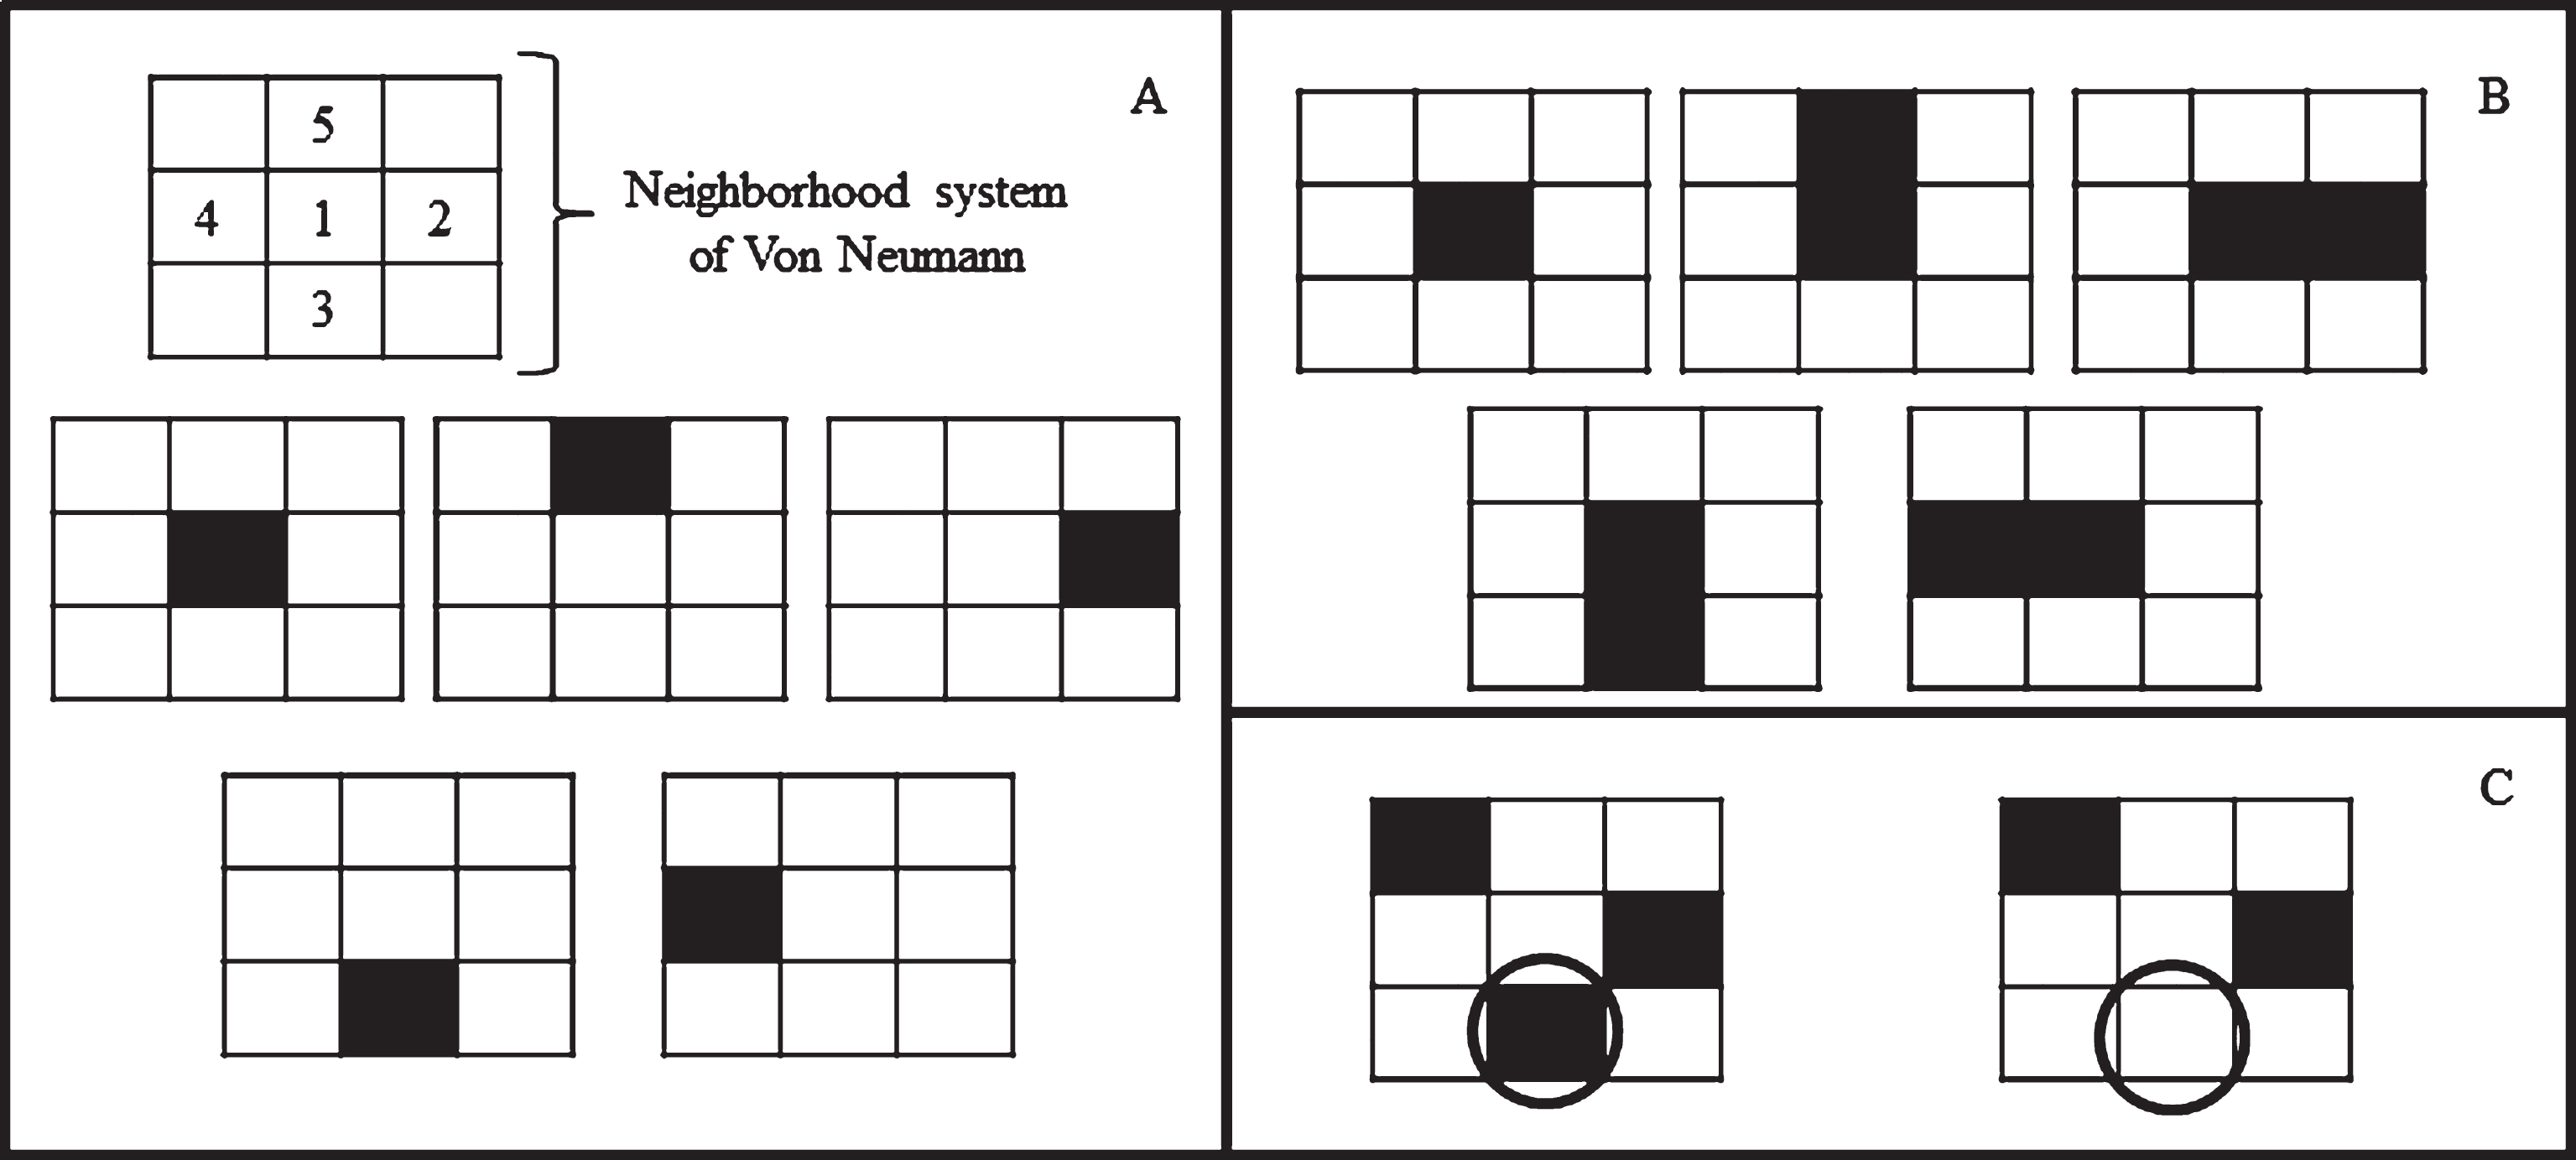
Cell migration was modeled based on random-walk theory [13, 16]. Two parameters were additionally taken into account: cell migration distance (md) and available space (as). In the CA model, md = 10 μm according to the previously described element dimensions [25]. If cell migration occurs, the CA model will consider the possible elements available to be occupied (Fig. 4A). In this case, as = 1, 2, …, 5, since the cell may migrate onto four different elements or stay in the same place. According to previously established weighted probabilities, pm was determined by means of the condition
Fig.4
Cell proliferation, migration and cell death according to random-walk theory. A) Possible migration sites depending on probability and the neighborhood system of Von Neumann. A cell can migrate in all four directions (above, right, below or left) or stay in the same place. Due to optimization of the CA model cells cannot migrate in diagonal. B) Possible daughter cell states after proliferation depending on probability. A cell can proliferate in all four directions (above, right, below or left) or stay in the same place. Due to optimization of the CA model cells cannot proliferate in diagonal. C) Representative sample of cell death depending on probability. A cell can disappear leaving the space available (area in circle).
2.2.6Cell proliferation (pp)
Cell proliferation was also modeled using the random-walk theory [13, 16]. This theory proposes a stochastic process, in which a cell can occupy a particular element according to the cell proliferation probability pp (Fig. 4B). In order to fulfill the requirement
2.2.7Cell Death (pd)
Finally, cell death was modeled based on the remaining weighted percentage depending on Lag or Log phases respectively. If a cell did not migrate or proliferate, it is determined that the cell would die pd = 1 or remain in the same element pd = 0 (Fig. 4C).
3Results
3.1Surface tension
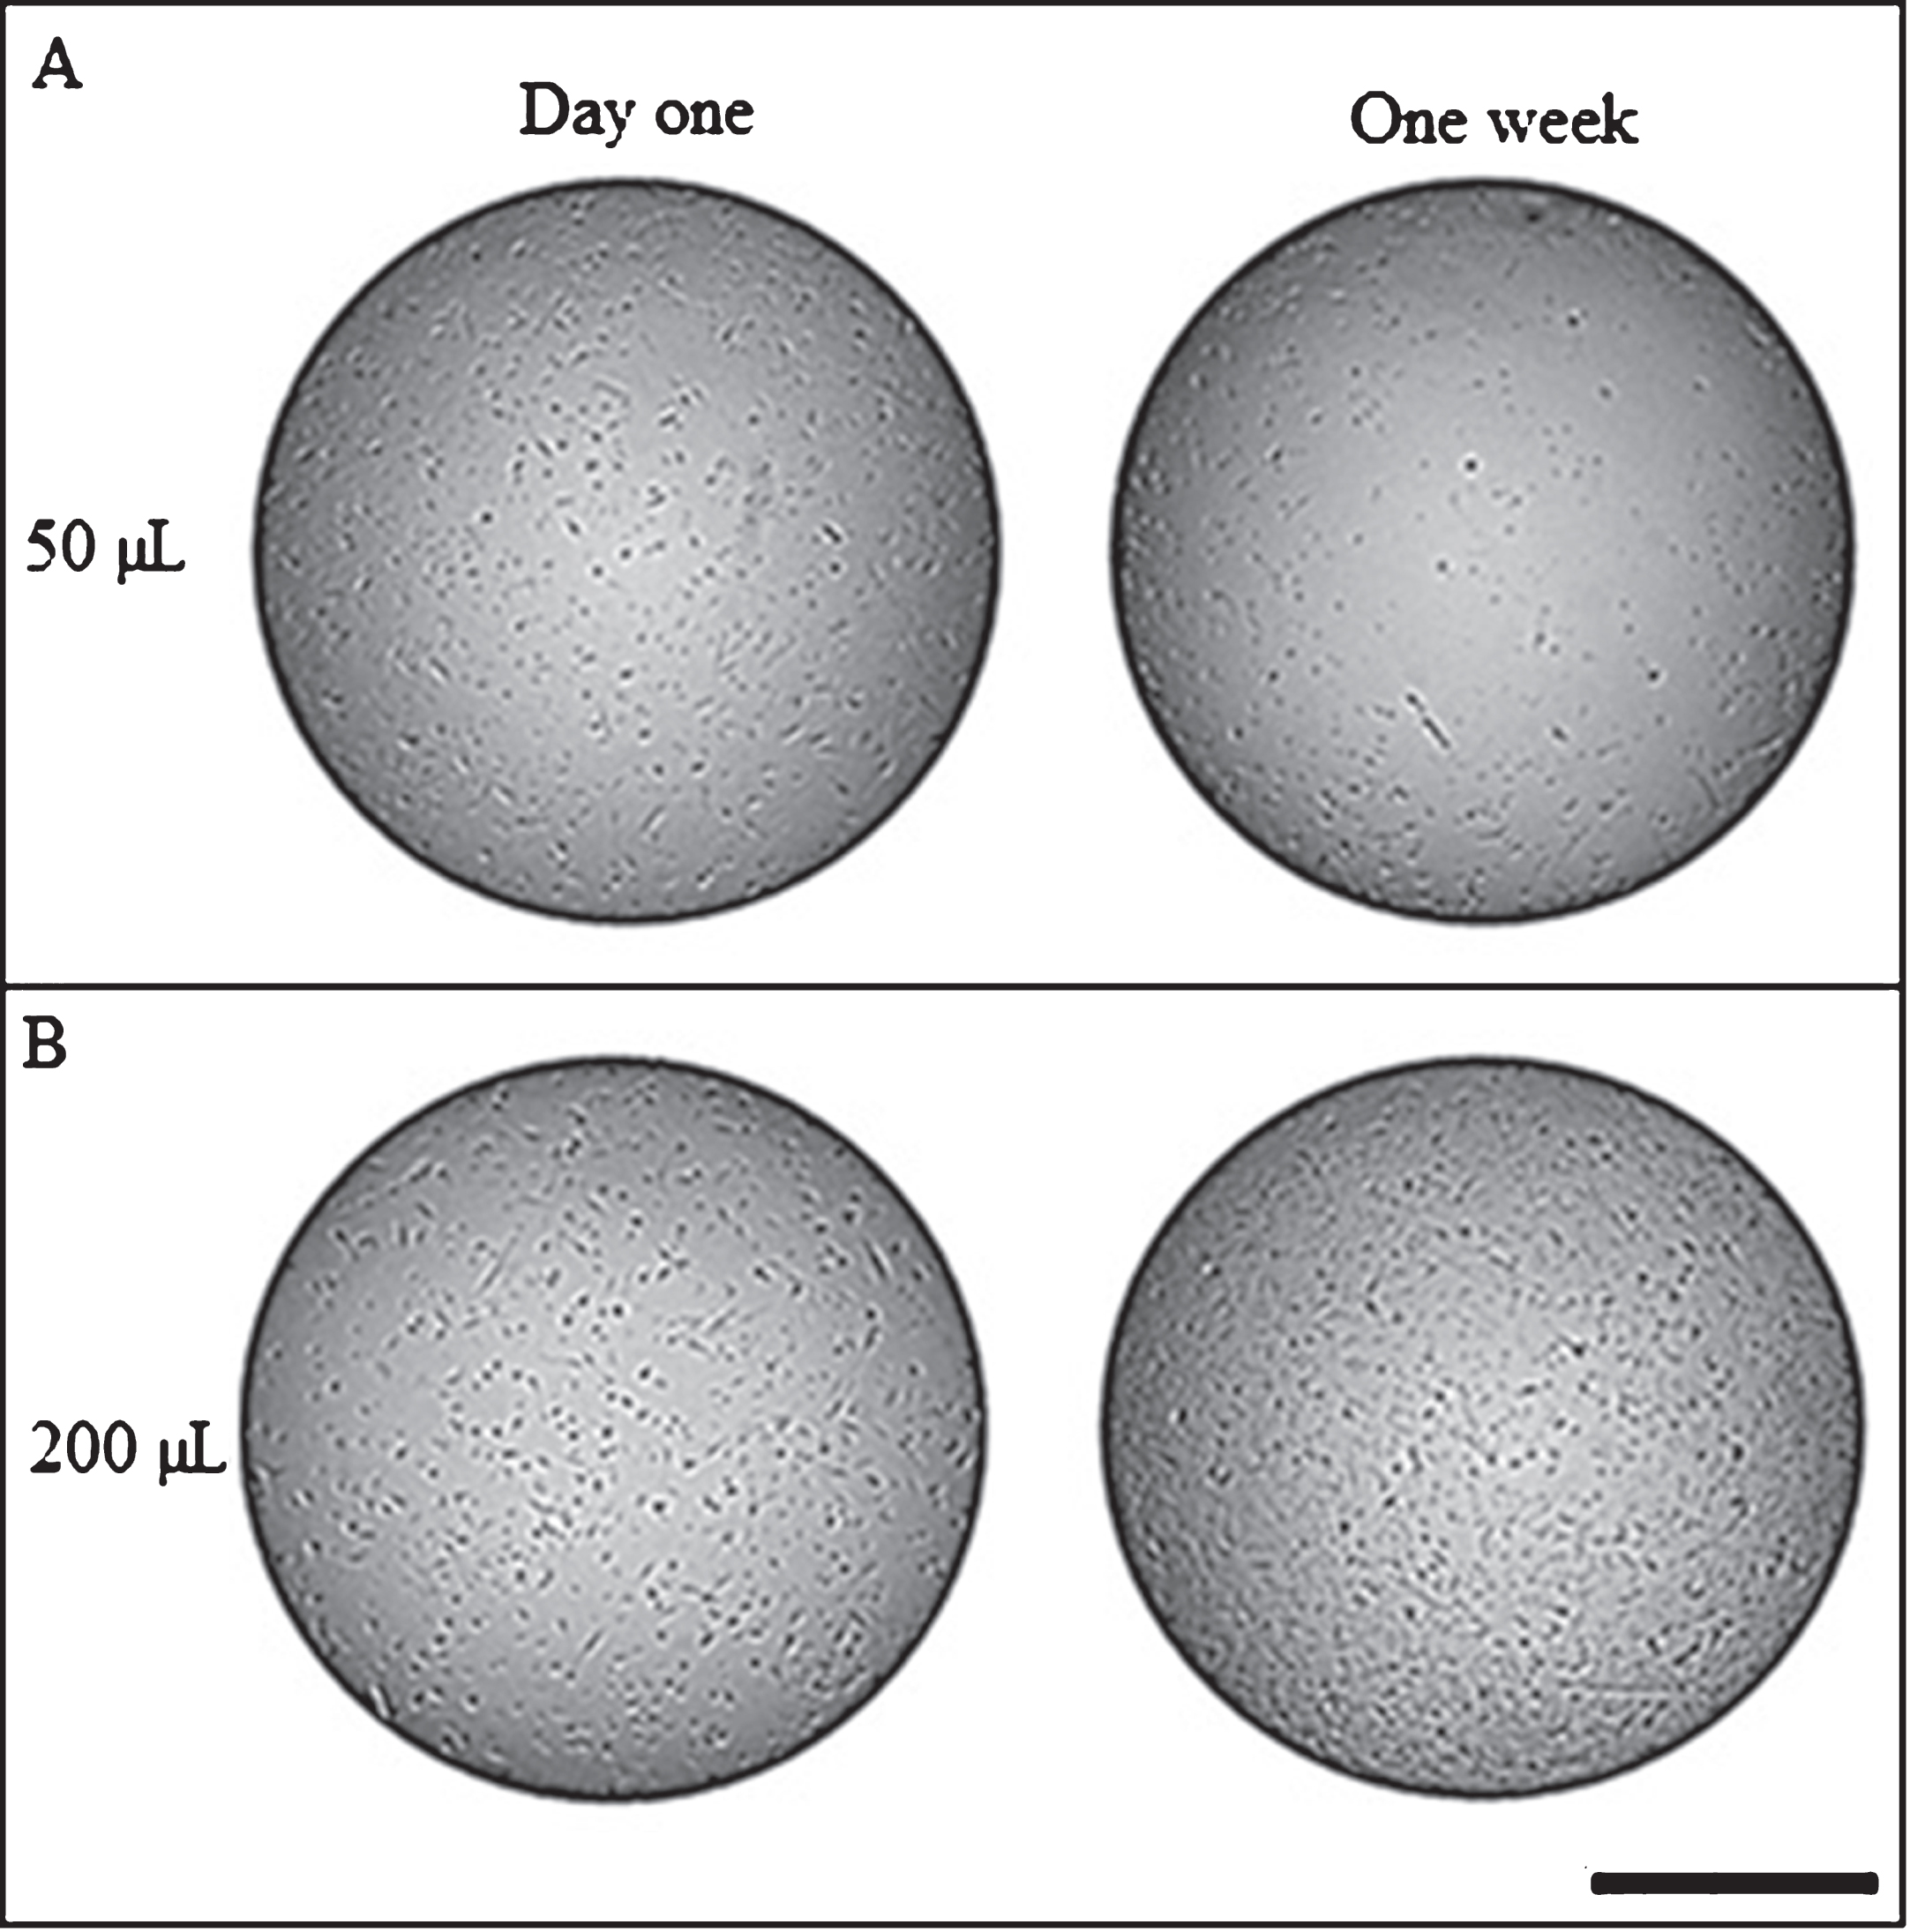
Results of surface tension effect illustrate that culture medium volume had an effect on cell location (Fig. 5). It can be observed that cells at day one of culture have a homogeneous distribution over the well plate surface; however, after one week of culture the cells have a different behavior. For instance, at the lowest volume (50μL) cells tend to localize at the edge of each well in the plate (Fig. 5A); while at greater volumes (200μL), cell distributed homogeneously throughout the surface area of the well plate (Fig. 5B). In this study there was not a quantification of cells that are distributed at the edge of each well in the plate.
Fig.5
Surface tension effects on cell distribution. A) Cell distribution with 50μL of culture media. B) Cell distribution with 200μL of culture media. Scale bar = 500μm. Photograph at 4X magnification.
3.2Cell migration
Experimental results showed random chondrocyte movements over the entire surface of the well plate (Fig. 6 A–C). Moreover, migration by weighted probabilities was derived from remaining computational data (Table 1). Cells cultured at P1 during the Lag phase migrated at a similar percentage compared to cells cultured at P2. On the contrary, cells cultured at P1 during the Log phase decreased migration percentages compared to the Lag phase. Cells cultured at P2 retained a similar migration percentage during the week of culture. The percentages shown in Table 1 represent the number of cells that are dedicated to migration. This means that the remainder percentage, either of the Lag Phase or Log phase, is the value needed to complete the 100% of cultured cells. Thus, the remainder percentage corresponds to the cells that are proliferating or dying. According to the percentages shown in Table 1, cells cultured at P1 tend to decrease their migration activity from 78% to 63%. This behavior indicates that cells are increasing their proliferative activity; therefore, there are fewer spaces for the cell to migrate. On the contrary, cells cultured at P2 tend to maintain their migration activity during Lag and Log phases (from 79% to 78%). It means that the amount of available spaces tend to be the same during the cell culture period.
Fig.6
Cell migration for cell culture passages. Representative sample of cell location. A) Cell location at time zero (8:00 am). B) Cell location after two hours (10:00 am). C) Cell location after four hours (12:00 m). Colored circles allow to evidence cell movement in each time period. Scale bar = 100μm. Photograph at 10X magnification.
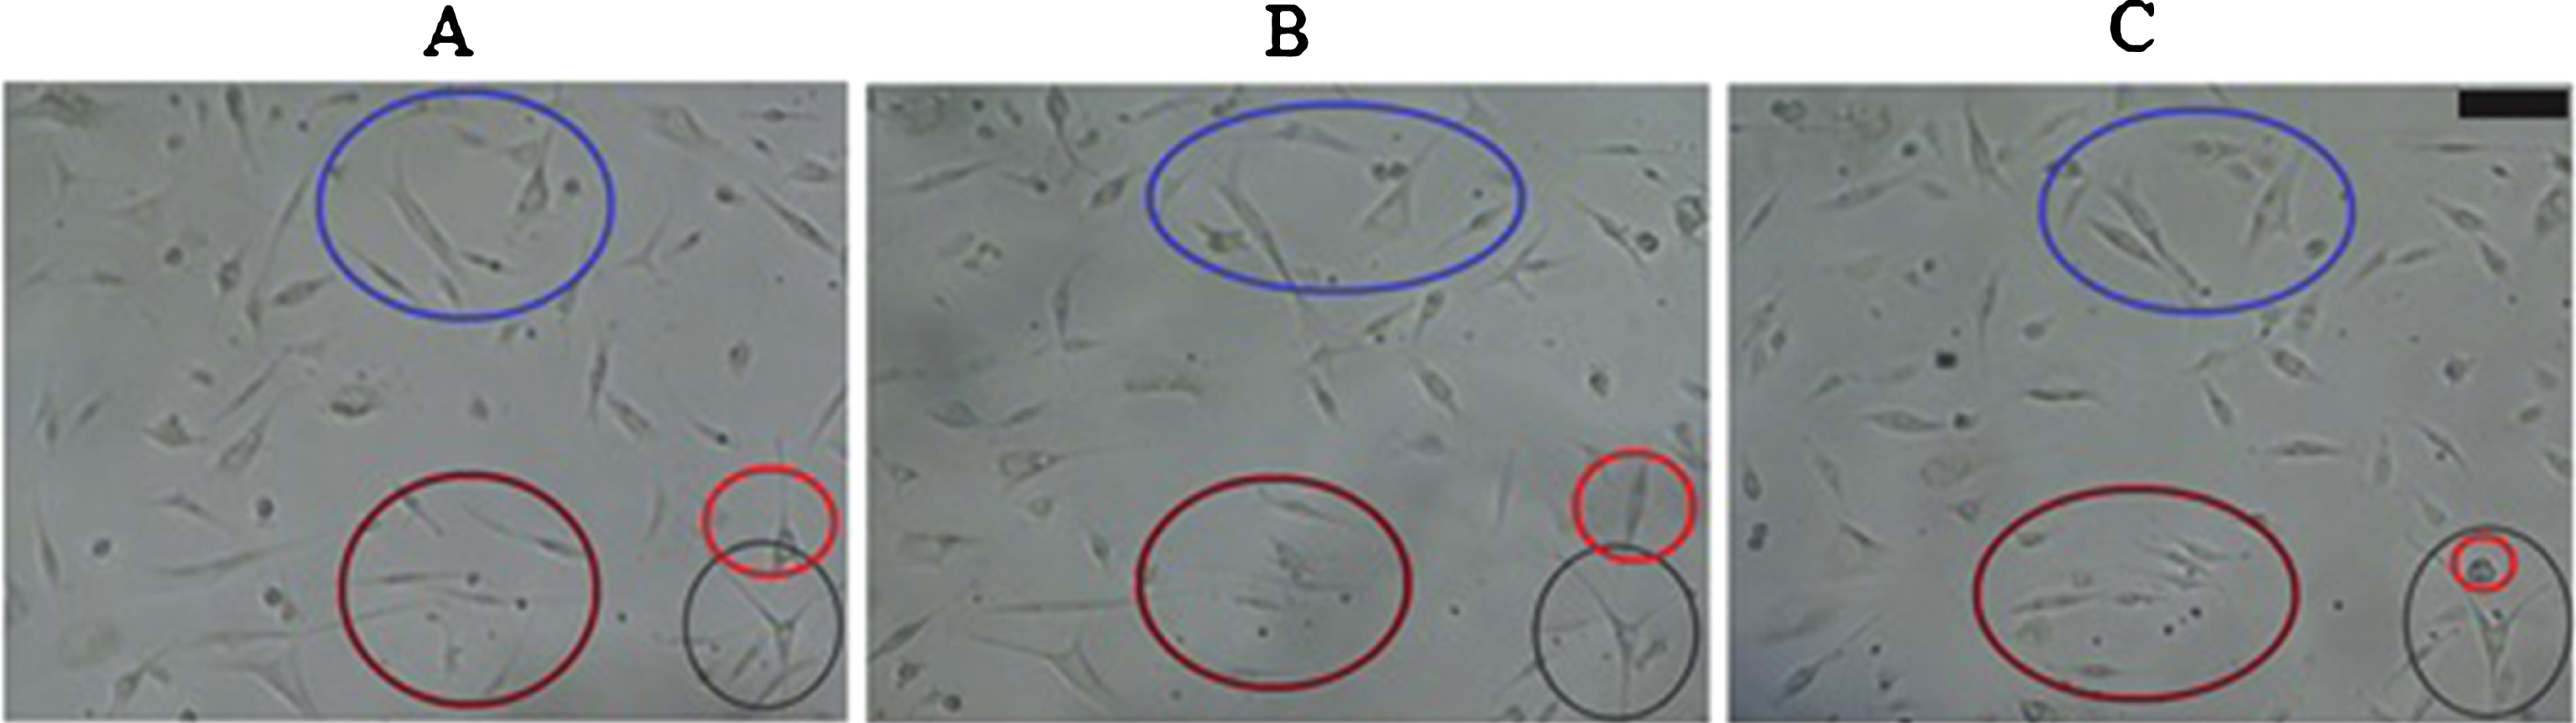
Table 1
Cell migration state. Weighted probability for P1 and P2
| Lag phase | Log phase | ||
| Day zero | Day fourth | ||
| P1 | 78% | 70% | 63% |
| P2 | 79% | 78% | 78% |
3.3Cell proliferation
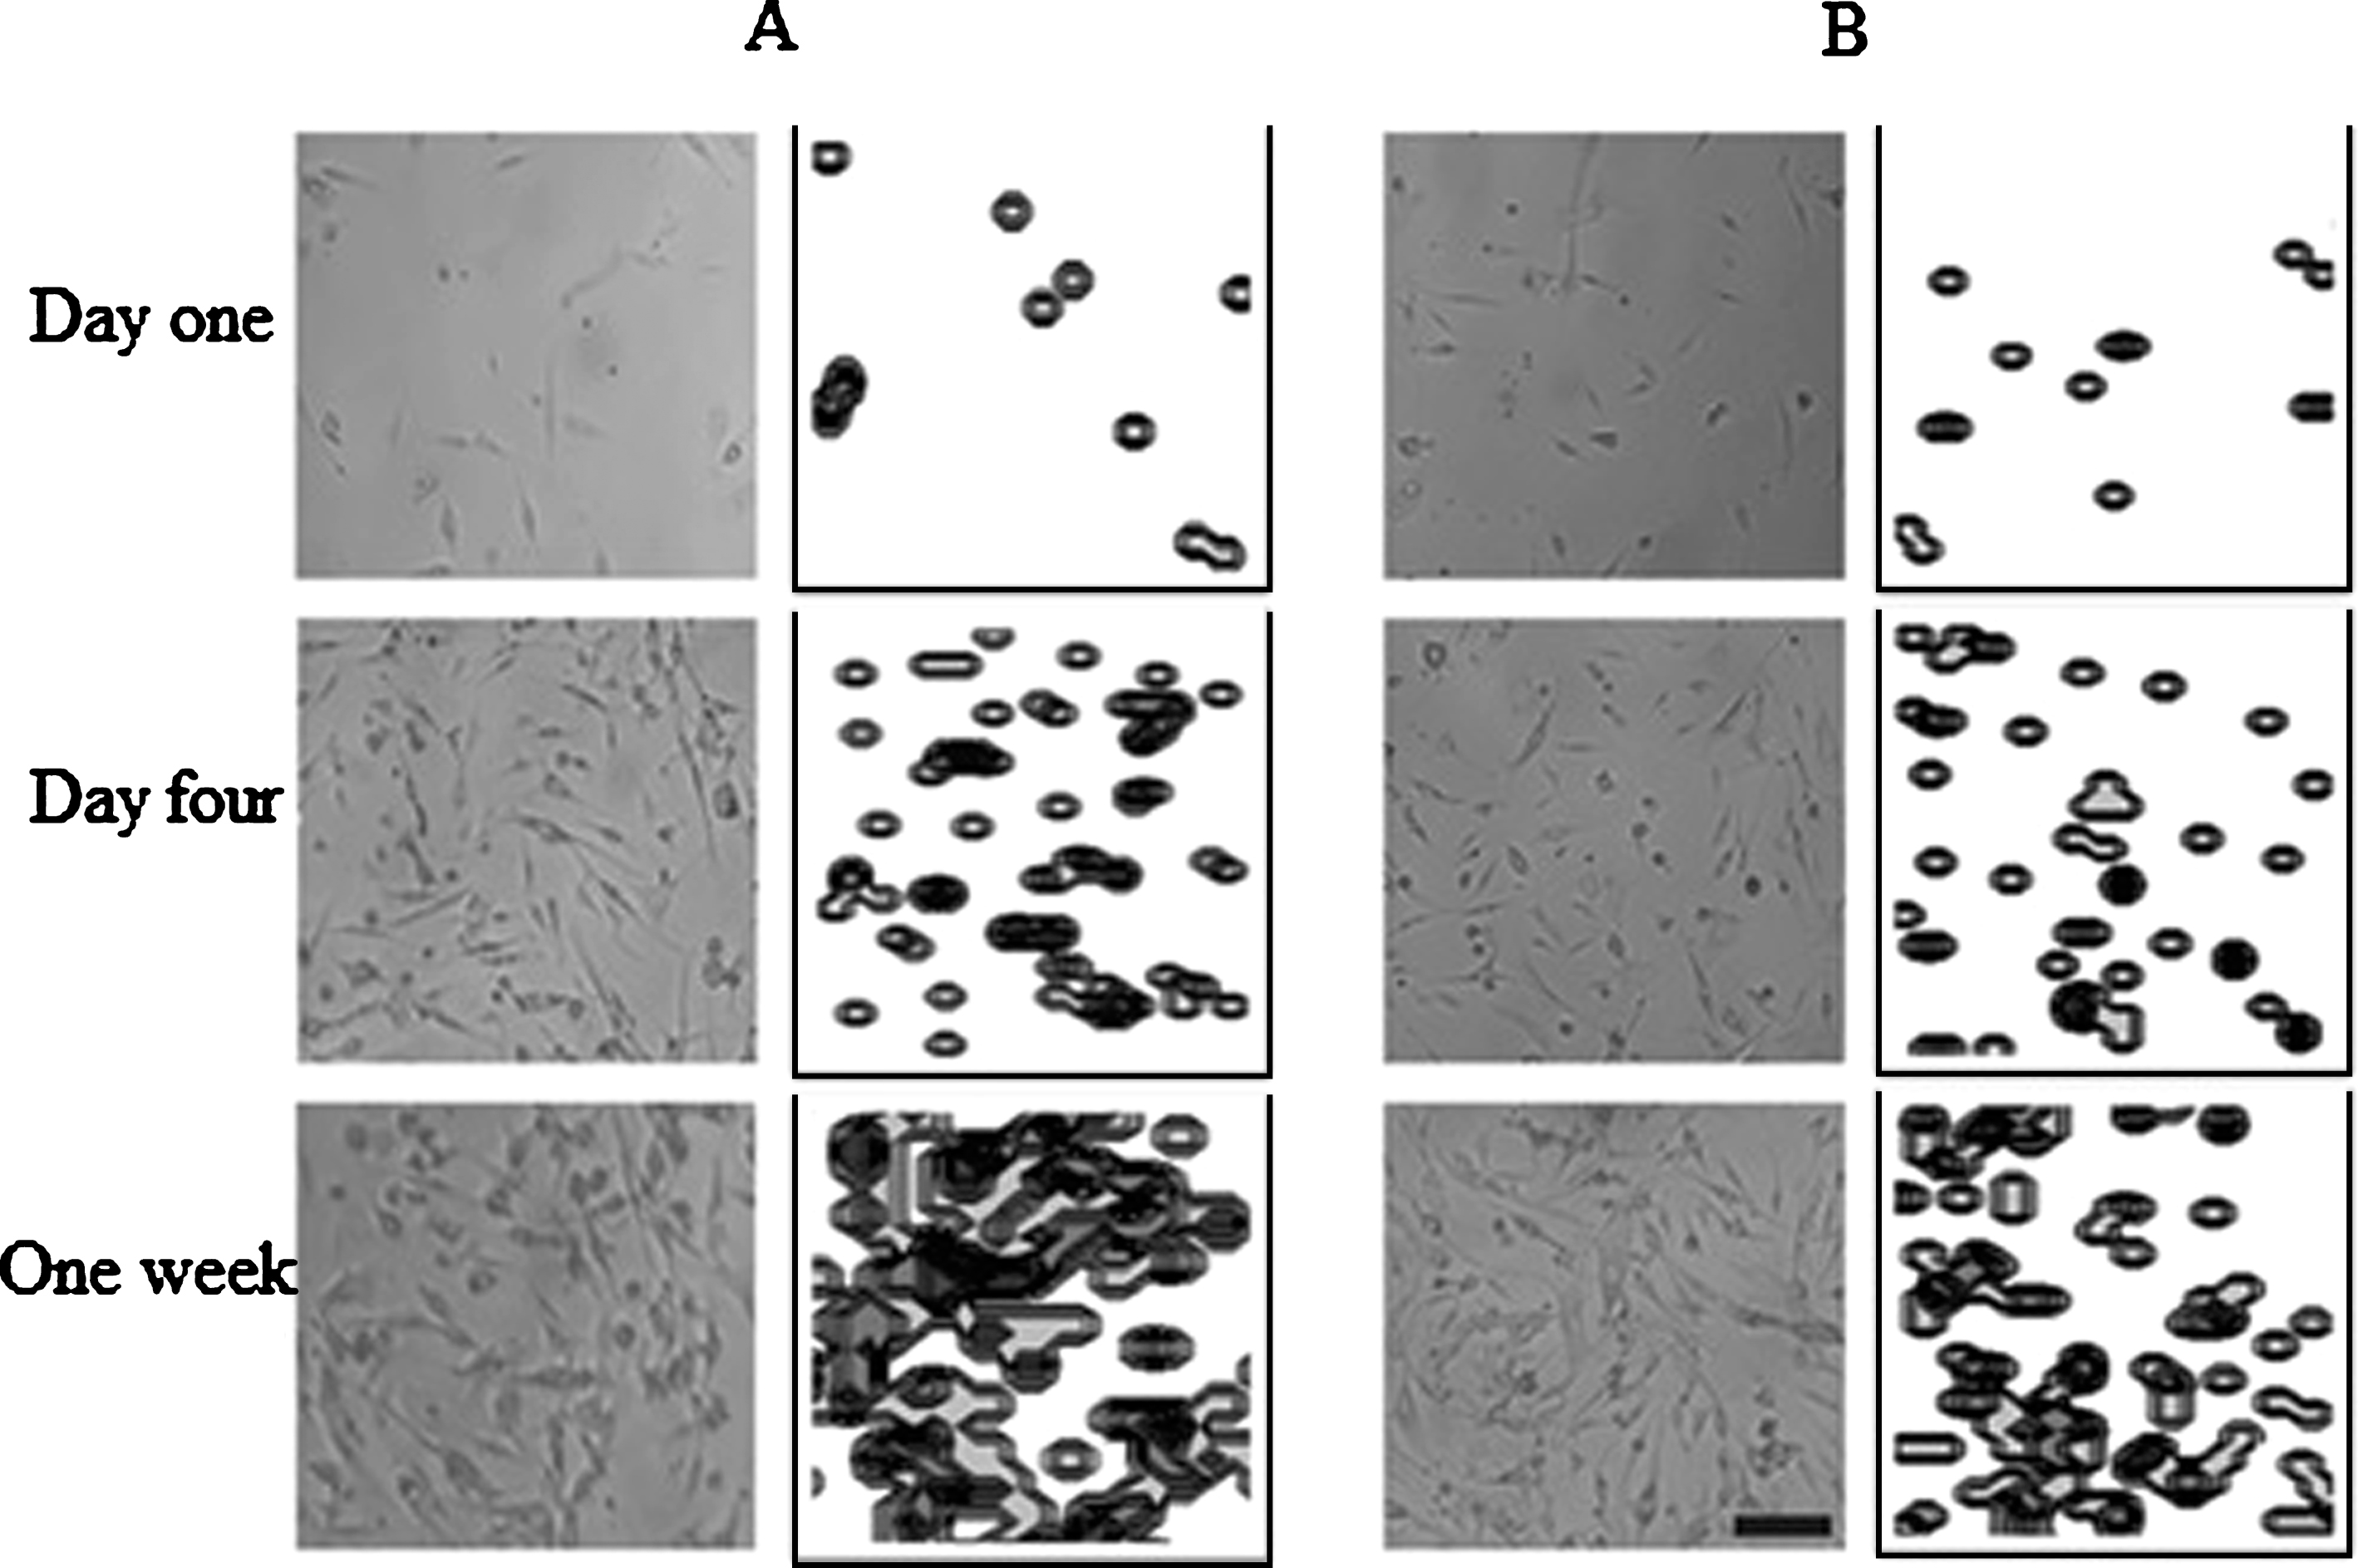
No significant differences were observed for all time points comparing the experimental data with the computational results (Fig. 7). On one hand, one difference between the experimental and computational results were found in cells cultured at P2, especially at day 2 of culture, which shows an increase in cell population; however, at this point, no significant differences were obtained. On the other hand, it is possible to observe the difference in the final cell population of the two cell culture passages. For instance, the final number of cells, for both the experimental and computational data at P1 was about 40.000 cells (Fig. 7A); whereas for cell cultures at P2 the final cell population were approximately 20.000 cells (Fig. 7B). This observation can be corroborated with the Table 2, where it is possible to observe the significant differences between the cell proliferation per day at P1 and P2. In addition, the cell distribution for both the cell culture and the computational model revealed a homogenous allocation (Fig. 8).
Fig.7
Cell proliferation curves for cell culture passages and CA. Representative sample for cell density. A) Cell proliferation for P1 vs CA. B) Cell proliferation for P2 vs CA.
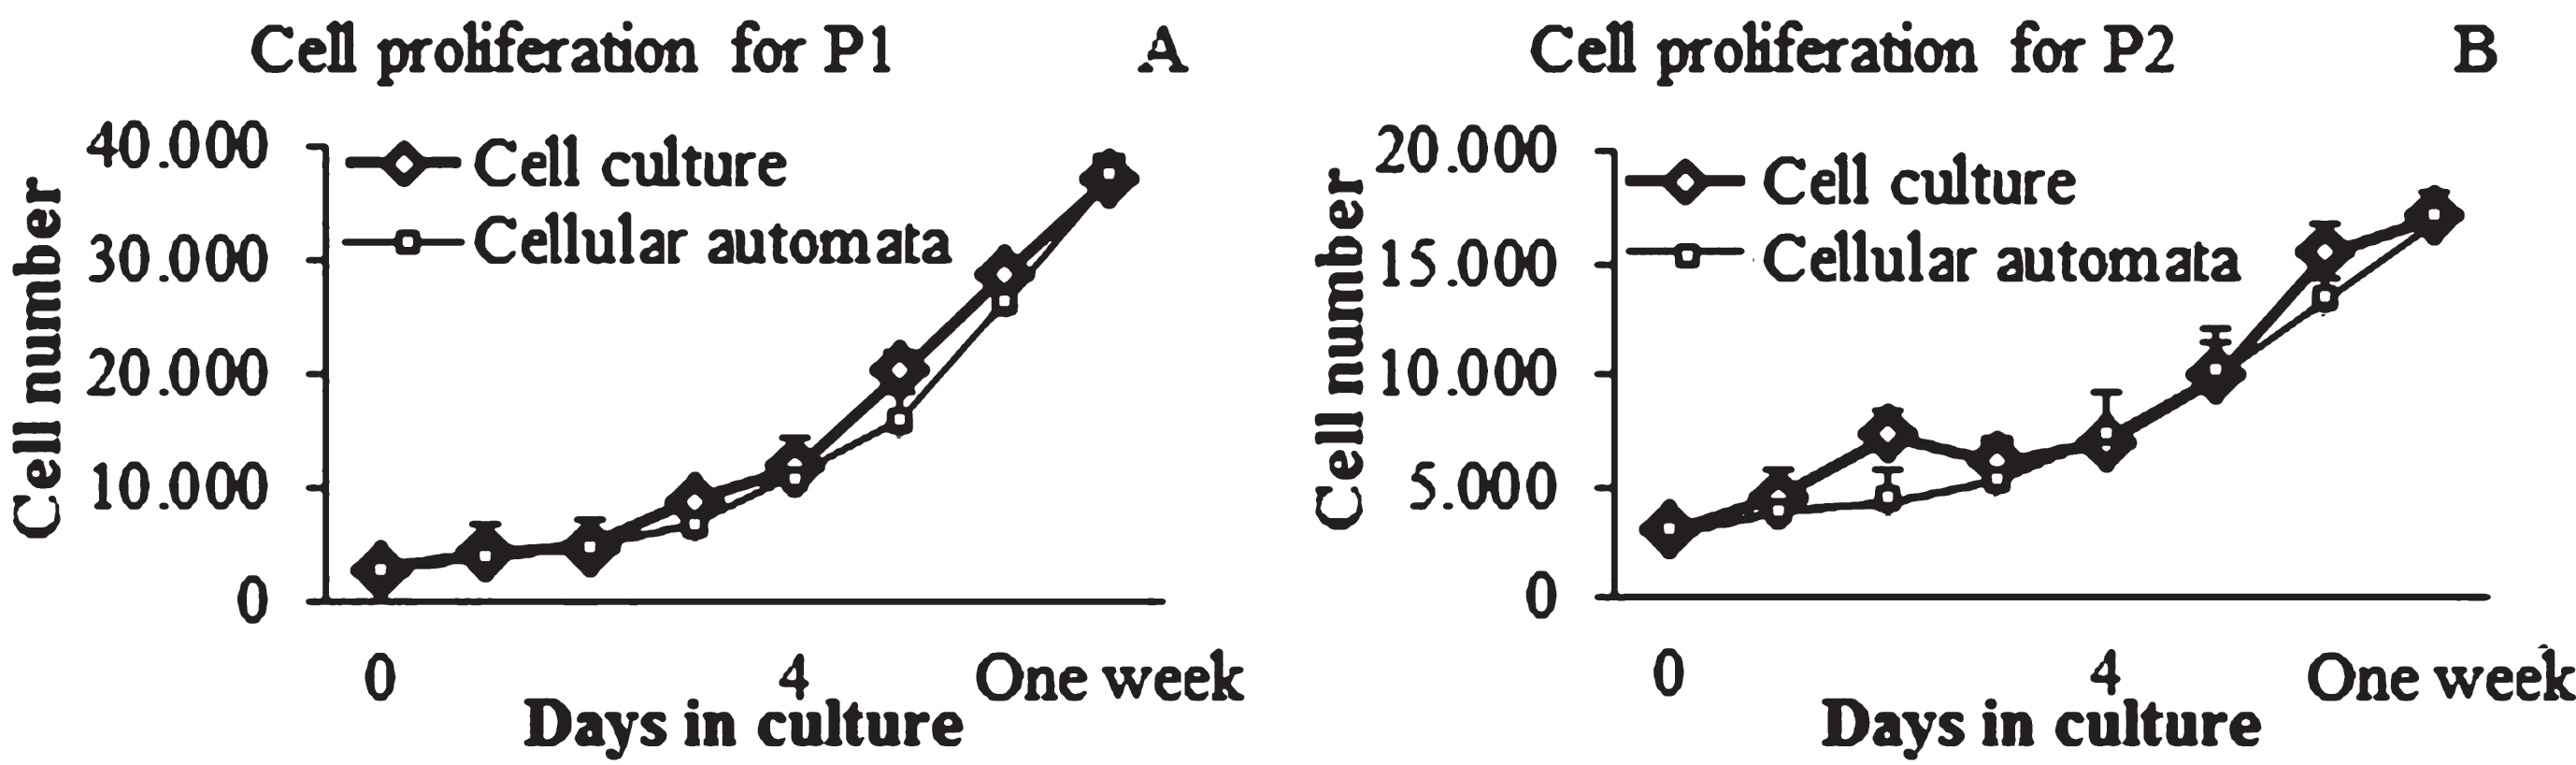
Table 2
Proliferation behavior per hour between P1 and P2
| Lag phase | Log phase | |
| P1 | 93.19 ± 14.67* | 351.70 ± 2.11*** |
| P2 | 38.58 ± 9.23* | 141.2 ± 9.26*** |
Proliferation behavior between chondrocytes culture atP1 and P2 for Lag phase was determined by calculating slopes values between day 0 and day 4 of culture *p = 0.004. For Log phase slope value between day 4 and one week of culture was highly significant ***p = 0.0001.
Fig.8
Cell proliferation comparisons between cell culture and computational model. A) Representative sample of cell distribution at P1. B) Representative sample of cell distribution at P2. Scale bar = 100μm. Photograph at 10X magnification.
Regarding the computational results, the proliferation rate was determined for each time point of cell culture. In this context, from the day zero up to 72 h of culture, similar percentages were observed for cell proliferation. In this time point the CA model predicted a 23% of proliferating cells at P1; while an 18% of the cells proliferated at P2. However, at the end of the culture (one week) cellular state differed with 36% of the cells proliferating at P1, and 21% proliferating at P2. This observation validates the use of this computational approach to accurately predict the cell proliferation of a given population.
3.4Cell death
No significant differences were observed among time points (Fig. 9). Experimental cell death was null on day zero when the cells were seeded. By the fourth day of culture cell death increased to 8.7%, and after one week of culture it was null again. Computational percentage defined a decreasing trend for cell death during culture (Table 3). In the Lag phase both cell cultures at P1 and P2 decrease from 5% to 2%; while in the Log phase both passages have a cell death percentage equal to 1%.
Fig.9
In vitro cell death determination. Cell death was calculated for cells at P2.
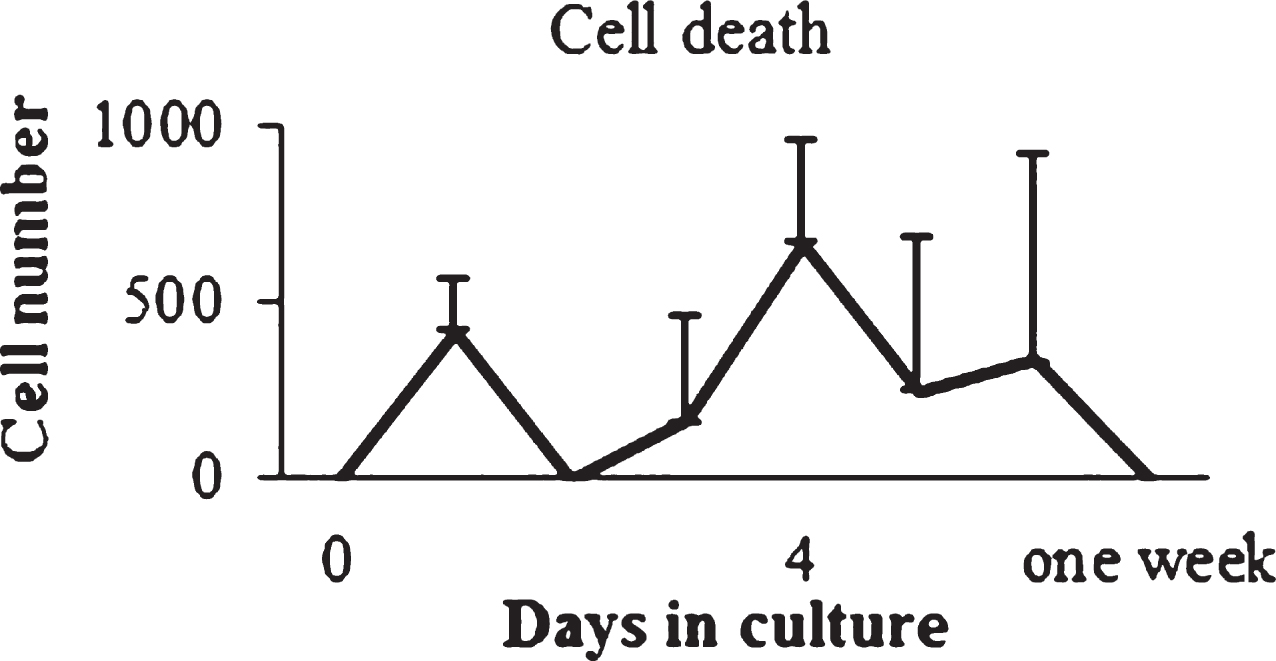
Table 3
Cell death state. Weighted probability for P1 and P2
| Lag Phase | Log phase | ||
| Day zero | Day fourth | ||
| P1 | 5% | 2% | 1% |
| P2 | 5% | 2% | 1% |
4Discussion
The aim of this research was to implement a CA model based on random-walk theory to predict the cell dynamics of chondrocytes: migration, proliferation and cell death. An accurate prediction of cell dynamics was possible thanks to the constant feedback between in vitro procedures, which established the input parameters – that indicate the amount of cells that are proliferating–, and the CA modeling. Accordingly, the cell proliferation allowed to predict the weighted probabilities of the number cells that are migrating, proliferating and dying at different culture times. In this context, the implemented computational approach can be extrapolated to enhance therapeutic techniques such as the ACI, due to the fact that CA can predict the final cell population in a given culture period. Thus, it might be possible to use ACI to approximate the in vitro experimental culture procedures, reducing costs and standardizing procedures [12, 21, 26].
Regarding the cell dynamics, the photographic record showed cell movement into the well plate; however, as a study to quantify the amount of moving cells was not performed, the random movement of the cells was corroborated with [25]. In the CA proposed, a sensitivity analysis of cell migration distance (md) and available space (as) was done in order to elucidate the contact inhibition process to achieve better control of the migration and proliferation process. In this context, if the cells migrate and the neighboring elements are available, there will be a high number of proliferating cells; whereas, if the cells migrate around their original position, the quantity of proliferating cell will decrease. Therefore, md and as are fundamental parameters to determine the number of cells and homogeneous distribution inside the well plate [13]. In fact, it is not possible to compare the in vitro migration with the in vivo behavior, since chondrocytes in articular cartilage are surrounded by a specialized extracellular matrix which generates pressure on the cell and restrict its movement [25]. On the other hand, the geometrical form of the cell due to the movement into the well plate was not studied in this work, as the CA could represent only the state in a point. However, experimental results evidence the formation of typical lamellipodia: external protuberances on the mobile edge of the cell, when cells are migrating over flat surfaces (Fig. 6). This observation is consistent with results obtained by other authors [25]. The appearance of these protuberances (lamellipodia) is caused by the morphological change of the chondrocytes in monolayer cultures. Thus, chondrocytes change its round phenotype and tend to be similar to a fibroblast [27].
In this work was possible to compare cells at two different passages, observing a different cell dynamics. As it was mentioned above, chondrocytes cultured at P1 had a significantly higher proliferation rate compared with cells cultured at P2. This observation is consistent with those reported in the literature indicating that in vitro cultures experience replicative senescence even from P1 [28]. This has an important therapeutic implication, since cell passage or population doubling should be considered when implementing cell therapy [29].
In addition to cell dynamics, in this study was evaluated the surface tension effect on cell distribution. This variable is avoidable, unless cells are seeded at very low culture medium volumes. Additionally, cells cultured in a low culture medium volume, seem to be influenced in the mitotic response of chondrocytes. This observation can be corroborated with Fig. 5A, where it is possible to observe a less populated area in the middle of the well plate after one week of culture. Since surface tension effect was not modeled computationally in this study, to doing this it would be necessary to simulate the case when cells are located at the edge of the well plate. This phenomenon was not taken into account since the aim of this study was focused on normal culture conditions.
Even though more sophisticated models have been devised, such as Cellular Potts Model (CPM) that takes into account a more realistic framework including cellular morphology [30], this level of sophistication was not necessary to evaluate chondrocyte cell dynamics. As it was mentioned above, ACI requires a cellular expansion in a monolayer culture. For this reason, the CA that was implemented in this research works under a 2D environment and efficiently predicts chondrocyte dynamics. However, the methodology carried out in this work to develop the computational model can be extrapolated to perform models and imitate 3D tissue formation. For instance, some researchers have used the random-walk theory to simulate the random movement of cells into 3D models, predicting tissue growth [31, 32]. According to this, each computational model, either 2D or 3D, can use the same methodology and obtain different outcomes. Moreover, in order to validate the computational model, an exclusive experimental design must be implemented in each case. In this context, the present computational model represents an interesting bi-dimensional tool for predicting individual cell behavior in a normal monolayer culture.
5Conclusion
This research evidences that a classical model, hand in hand with an experimental feedback, is sufficient to help predict the chondrocyte cell dynamics. In this context, the computational modeling using a CA is a promising tool that can be used to understand the behavior of chondrocyte culture procedures applied to articular cartilage repair. Moreover, the analysis of in vitro cell behavior is crucial for basic research as well as for quality control in cellular therapy [29]. Therefore, the procedures carried out in this research are suitable to be extrapolated to study cell behavior in treatments such as the ACI, representing new developments in tissue and regenerative engineering research.
Acknowledgments
The authors gratefully thank the research support group from the Republic Bank of Colombia – Foundation for the Promotion of Research and Technology (FPIT), professor Carmen Alicia Cardozo de Martinez and professor Afife Mrad de Osorio at the Institute of Biotechnology, Universidad Nacional de Colombia, for providing the lab space at the Biomimetics laboratory and the reactants to perform the experimental approach of this study.
References
[1] | Cancedda R. , Dozin B. , Giannoni P. , Quarto R. “Tissue engineering and cell therapy of cartilage and bone”, Matrix Biology 22: ((2003) ), 81–91. |
[2] | O’Conor C.J. , Case N. , Guilak F. , “Mechanical regulation of chondrogenesis”, Stem Cell Res Ther 4: ((2013) ), 61. |
[3] | O’Sullivan J., D’Arcy S., Barry F.P., Murphy J.M. and Coleman C.M., “Mesenchymal chondroprogenitor cell origin and therapeutic potential”, Stem Cell Res Ther 2: ((2011) ), 8. |
[4] | Bhosale A.M. and Richardson J.B. , “Articular cartilage: Structure, injuries and review of management”, Br Med Bull 87: ((2008) ), 77–95. |
[5] | Meyer U. , “The History of Tissue Engineering and Regenerative Medicine in Perspective”, in Fundamentals of Tissue Engineering and Regenerative Medicine, Meyer U., Handschel J., Wiesmann H. P. and Meyer T., Eds., ed: Springer Berlin Heidelberg, (2009) , pp, 5–12. |
[6] | Redman S.N. , Oldfield S.F. and Archer C.W. , “Current strategies for articular cartilage repair”, Eur Cell Mater 9: ((2005) ), 23–32; discussion 23–32. |
[7] | Temenoff J.S. and Mikos A.G. , “Review: Tissue engineering for regeneration of articular cartilage”, Biomaterials 21: ((2000) ), 431–440. |
[8] | Farr J. , Mont M.A. , Garland D. , Caldwell J.R. and Zizic T.M. , “Pulsed electrical stimulation in patients with osteoarthritis of the knee: Follow up in 288 patients who had failed non-operative therapy”, Surg Technol Int 15: ((2006) ), 227–233. |
[9] | Selmi T.A. , Verdonk P. , Chambat P. , Dubrana F. , Potel J.F. , Barnouin L. and Neyret P. , “Autologous chondrocyte implantation in a novel alginate-agarose hydrogel: Outcome at two years”, J Bone Joint Surg Br 90: ((2008) ), 597–604. |
[10] | Wang W. , Wang Z. , Zhang G. , Clark C.C. and Brighton C.T. , “Up-regulation of chondrocyte matrix genes and products by electric fields”, Clin Orthop Relat Res ((2004) ), S163–S173. |
[11] | Harris J.D. , Siston R.A. , Pan X. and Flanigan D.C. , Autologous Chondrocyte Implantation 92: ((2010) ). |
[12] | Grad S. , Eglin D. , Alini M. and Stoddart M. J. , “Physical stimulation of chondrogenic cells in vitro: A review”, Clin Orthop Relat Res 469: ((2011) ), 2764–2772. |
[13] | Garijo N. , Manzano R. , Osta R. and Perez M.A. , “Stochastic cellular automata model of cell migration, proliferation and differentiation: Validation with in vitro cultures of muscle satellite cells”, J Theor Biol 314: ((2012) ), 1–9. |
[14] | Pablo A. , Nicolas S. and Guillaume T. , “Stochastic Cellular Automata: Correlations, Decidability and Simulations”, Fundamenta Informaticae 126: ((2013) ), 121–156. |
[15] | Klafter J. and Sokolov I.M. , “Generating functions and applications”, in, First Steps in Random Walks From Tools to Applications 1: ((2011) ), 17–29. |
[16] | Perez M.A. and Prendergast P.J. , “Random-walk models of cell dispersal included in mechanobiological simulations of tissue differentiation”, J Biomech 40: ((2007) ), 2244–2253. |
[17] | Palmari J. , Lafon B. , Martin P.M. and Dussert C. , “Topographical analysis of spatial patterns generated by a cellular automaton model of the proliferation of a cancer cell line in vitro”, Analytical Cellular Pathology 14: ((1997) ), 75–86. |
[18] | Schönfisch B. and Lacoursière C. , “Migration in cellular automata”, Physica D: Nonlinear Phenomena 103: ((1997) ), 537–553. |
[19] | Longo D. , Peirce S.M. , Skalak T.C. , Davidson L. , Marsden M. , Dzamba B. and DeSimone D.W. , “Multicellular computer simulation of morphogenesis: Blastocoel roof thinning and matrix assembly in Xenopus laevis”, Dev Biol 271: ((2004) ), 210–222. |
[20] | Alarcón T. , Byrne H.M. and Maini P.K. , “A cellular automaton model for tumour growth in inhomogeneous environment”, J Theor Biol 225: ((2003) ), 257–274. |
[21] | Simpson M.J. , Merrifield A. , Landman K.A. and Hughes B.D. , “Simulating invasion with cellular automata: Connecting cell-scale and population-scale properties”, Phys Rev E Stat Nonlin Soft Matter Phys 76: ((2007) ), 021918. |
[22] | Kiskowski M.A. , Alber M.S. , Thomas G.L. , Glazier J.A. , Bronstein N.B. , Pu J. and Newman S.A. , “Interplay between activator-inhibitor coupling and cell-matrix adhesion in a cellular automaton model for chondrogenic patterning”, Dev Biol 271: ((2004) ), 372–387. |
[23] | Christley S. , Zhu X. , Newman S.A. and Alber M.S. , “Multiscale agent-based simulation for chondrogenic pattern formation in vitro”, Cybernetics and Systems 38: ((2007) ), 707–727. |
[24] | Karsenty G. , Kronenberg H.M. and Settembre C. , “Genetic control of bone formation”, Annu Rev Cell Dev Biol 25: ((2009) ), 629–648. |
[25] | Morales T.I. , “Chondrocyte moves: Clever strategies?”, Osteoarthritis Cartilage 15: ((2007) ), 861–871. |
[26] | Mallet D.G. , De Pillis L.G. , “A cellular automata model of tumor-immune system interactions”, J Theor Biol 239: ((2006) ), 334–350. |
[27] | Brodkin K.R. , Garcia A.J. and Levenston M.E. , “Chondrocyte phenotypes on different extracellular matrix monolayers”, Biomaterials 25: ((2004) ), 5929–5938. |
[28] | Wagner W. , Horn P. , Castoldi M. , Diehlmann A. , Bork S. , Saffrich R. , Benes V. , Blake J. , Pfister S. , Eckstein V. and Ho A.D. , “Replicative senescence of mesenchymal stem cells: A continuous and organized process”, PLoS One 3: ((2008) ), e2213. |
[29] | Wagner W. , Bork S. , Lepperdinger G. , Joussen S. , Ma N. , Strunk D. and Koch C. , “How to track cellular aging of mesenchymal stromal cells?”, Aging (Albany NY) 2: ((2010) ), 224–230. |
[30] | Marée A.M. , Grieneisen V. and Hogeweg P., “The Cellular Potts Model and Biophysical Properties of Cells, Tissues and Morphogenesis”, in Single-Cell-Based Models in Biology and Medicine, A.A. Anderson, M.J. Chaplain and K. Rejniak, Eds., ed: Birkhäuser Basel, (2007) , pp. 107–136. |
[31] | Chang I. , Gilbert E.S. , Eliashberg N. and Keasling J.D. , “A three-dimensional, stochastic simulation of biofilm growth and transport-related factors that affect structure”, Microbiology 149: ((2003) ), 2859–2871. |
[32] | Cheng G. , Youssef B.B. , Markenscoff P. and Zygourakis K. , “Cell population dynamics modulate the rates of tissue growth processes”, Biophys J 90: ((2006) ), 713–724. |


