
Dynamical modeling of pro- and anti-inflammatory cytokines in the early stage of septic shock
Abstract
A dynamical model of the pathophysiological behaviors of IL18 and IL10 cytokines with their receptors is tested against data for the case of early sepsis. The proposed approach considers the surroundings (organs and bone marrow) and the different subsystems (cells and cyctokines). The interactions between blood cells, cytokines and the surroundings are described via mass balances. Cytokines are adsorbed onto associated receptors at the cell surface. The adsorption is described by the Langmuir model and gives rise to the production of more cytokines and associated receptors inside the cell. The quantities of pro and anti-inflammatory cytokines present in the body are combined to give global information via an inflammation level function which describes the patient’s state. Data for parameter estimation comes from the Sepsis 48 H database. Comparisons between patient data and simulations are presented and are in good agreement. For the IL18/IL10 cytokine pair, 5 key parameters have been found. They are linked to pro-inflammatory IL18 cytokine and show that the early sepsis is driven by components of inflammatory character.
1Introduction
Sepsis is defined as a life-threatening organ dysfunction caused by a dysregulated host response to infection [1]. Septic shock is the most severe form of sepsis in which hypotension persists despite adequate volume resuscitation thus requiring the use of vasopressors. Sepsis deeply perturbs immune homeostasis by inducing a complex response that varies over time, with the concomitant occurrence of both pro- and anti-inflammatory mechanisms. Schematically, the opening tremendous systemic inflammatory response (aka cytokine storm) may lead to multiple organ failure while the anti-inflammation process may lead to delayed immunosuppressed status [2,3]. However, exact chronology of these processes remains unclear. As sepsis represents a major healthcare problem worldwide (e.g, first cause of mortality in Intensive Care Units (ICU) [4]), the World Health Organization (WHO) recognized sepsis as a global health priority by adopting a resolution to improve the prevention, diagnosis and management of this deadly disease [5]. Indeed, despite significant advances in the understanding of the pathophysiology of sepsis, to date, no therapeutic intervention targeting host response has specifically been approved.
Several studies have shown that the first hours after septic shock are decisive in the evolution of the disease and therefore for patient’s care and outcome [6,7]. At this step, the host response is very complex because a tremendous number of mediators, receptors and cells are involved in the whole body, both activators and inhibitors [8], thus the dynamical modeling approach is an interesting solution to better describe early dynamics in septic shock. In particular, mechanistic modelling based on principles of chemical engineering may help to build the complex models necessary to describe the immune system [9–12].
Many dynamical models have appeared in the literature to describe the immune system in the context of sepsis. They are based on ordinary differential equations (ODE) with classical kinetics used in biology such as Michaelis-Menten kinetics, Hill function, inhibitory functions [13–24].
A discussion about reduced and large models for immunology and their help with respect to qualitative and quantitative behavior in order to improve diagnosis and treatment is proposed in Vodovotz et al. [25].
Some reduced models are used to analyze the asymptotic behavior of ODE models with respect to key parameters, such as kinetic constants, and show that, depending on parameter values, different immune system scenarios can be represented, as in Kumar et al. [13].
Numerous models are used to simulate the immune system for better understanding, [14, 16, 17, 19, 22, 24, 26, 27]. The authors have different modeling approaches, but, currently, the principal limitation is the availability and complexity of experimental data for validation.
Some models are used as the foundation for simulations for testing therapy strategies [21, 23, 26, 28–30].
Finally, in Yiu et al. [8], based on the 2006 Clinical Trial of TGN1412, the authors propose an eighteenth-order, linear, time-invariant dynamic system to simulate the behavior of nine interacting cytokines based on data obtained from six healthy volunteers that experienced severe inflammatory response during five days. An identification procedure of 90 parameters is performed from cytokine level measurements. The model reveals plausible cause-and-effect relationships among the cytokines showing how each cytokine induces or inhibits others.
For now, the work to model the immune system is only at its beginning. The complexity of the system and the lack of experimental data are the main barriers to advancement. To our knowledge, no article presents a model tested against transcriptomic data.
Microarray-based expression profiling provides an interesting opportunity to gain knowledge on sepsis. This was done in the case of the study on twenty-eight patients in septic shock, called “Sepsis 48h” and conducted in 2009 by the laboratory LCR SEPSIS HCL and bioMerieux [7]. In this study, a blood sample was taken every 6 hours for 48 hours and a sample was taken after 6 days for some patients. For each sample, a complete genomic study was performed.
By virtue of the “Sepsis 48h” databank, it is therefore possible to build an original model that can be validated experimentally against both genetic expression and cell count.
The objective of this study is to propose a pathophysiological dynamical model capable of describing the evolution of inflammation in case of septic shock based on the “Sepsis 48h” data. The chosen cytokines are IL18 and IL10 as well as their associated receptors IL18 R and IL10RA. This choice is motivated by the simplicity of the production mechanisms of this pair of cytokines with their associated receptors.
In Section 2 we set out the way we selected the training data among the large available dataset. In Section 3 we present the assumptions and the model. In Section 4 we describe parameter estimation based on the “Sepsis 48h” data. Finally, in Section 5 we discuss the estimated model, the results obtained and we also propose a qualitative validation of the model on the basis of the “Sepsis 48h” data.
2Experimental dataset: Sepsis 48h
The “Sepsis 48h” dataset includes clinical characteristics of twenty-eight patients at the onset of septic shock and admitted to two ICUs of a university hospital (see Cazalis et al. [7] for a detailed description of patient characteristics and data treatment). Briefly, a blood sample was taken every 6 hours for 48 hours. The transcribed RNA was extracted from each sample and the gene expressions were measured using microarrays from Affimetrix (GeneChip® Human Genome U133 Plus 2.0). The full data set has not yet been released but data from initial samples and those taken after 24 and 48 hours is available on the GEO DataSets site under accession number GSE57065. So, for each blood sample, data is available in the form of 54675 X-ray fluorescence intensity values. Furthermore, twenty-five control samples have been obtained from healthy volunteers. A statistical comparison of the genetic expressions of samples from healthy and sick patients highlighted 71% of the human genome affected by a septic shock [7].
In addition to this transcriptomic data, a detailed cell count was performed for each sample for the major leukocytes. The main cells of innate immunity were measured: neutrophils, basophils, eosinophils, and monocytes. The main types of lymphocytes were also counted as described in Venet et al. [31].
2.1Biological selection of the probesets
The first step of this work was to select the probesets that were related to cytokines and their receptors from the available dataset. First, a global approach was taken, with the selection of all the probesets that were potentially important in describing the variation of the cytokines and their receptors. The probeset references were translated from the microarray output into standard genetic nomenclature found in the literature. For this purpose, the DAVID database (Database for Annotation, Visualization and Integrated Discovery) tool to convert gene identifiers from one type to another was used [14, 32].
The genes relating to cytokines and their receptors were then selected with keyword filters: “interleukin”; “TNF”; “IFN”; “TGF” leading to a first reduction of the dataset to 329 probesets of interest. Then, the objective being to describe the inflammation mechanistically and without considering intracellular reactions and intermediates, a deeper analysis of these probesets was made. Data which could not be exploited because it was below the microarray detection limit was removed and, where more than one microarray output referred to the same biological entity, only the most intense signal was selected. Proteins which were unrelated to cytokines and their receptors according to the literature were also removed [33]. This allowed selection of 53 probesets related to well-known cytokines and their receptors, all of which are involved in endotoxin tolerance or pathogen recognition.
Here, the strategy is to propose a simplified model based on an immune system of one pair of cytokines with their receptors and the average quantity of leukocytes. It is intended that this be extended in future work. Further consideration of the probesets narrowed down the number of potential cytokines for modelling to 14, each of which has data available for both receptors and cytokine (about 30 probesets): IL1A, IL1B, IL2, IL3, IL4, IL6, IL10, IL11, IL12A, IL13, IL16, IL18, IL24 and IL27. Of these, IL1, IL4, IL6, IL10, IL18 have been strongly associated with sepsis [7, 34–40], with 1L1, IL6 and IL18 being pro-inflammatory and IL4 and IL10 anti-inflammatory. From this set of 5 cytokines, IL18/IL10 was identified as the optimal pair for modelling. This cytokine pair is characterized by two cytokines, one with pro- and the other with anti-inflammatory action.
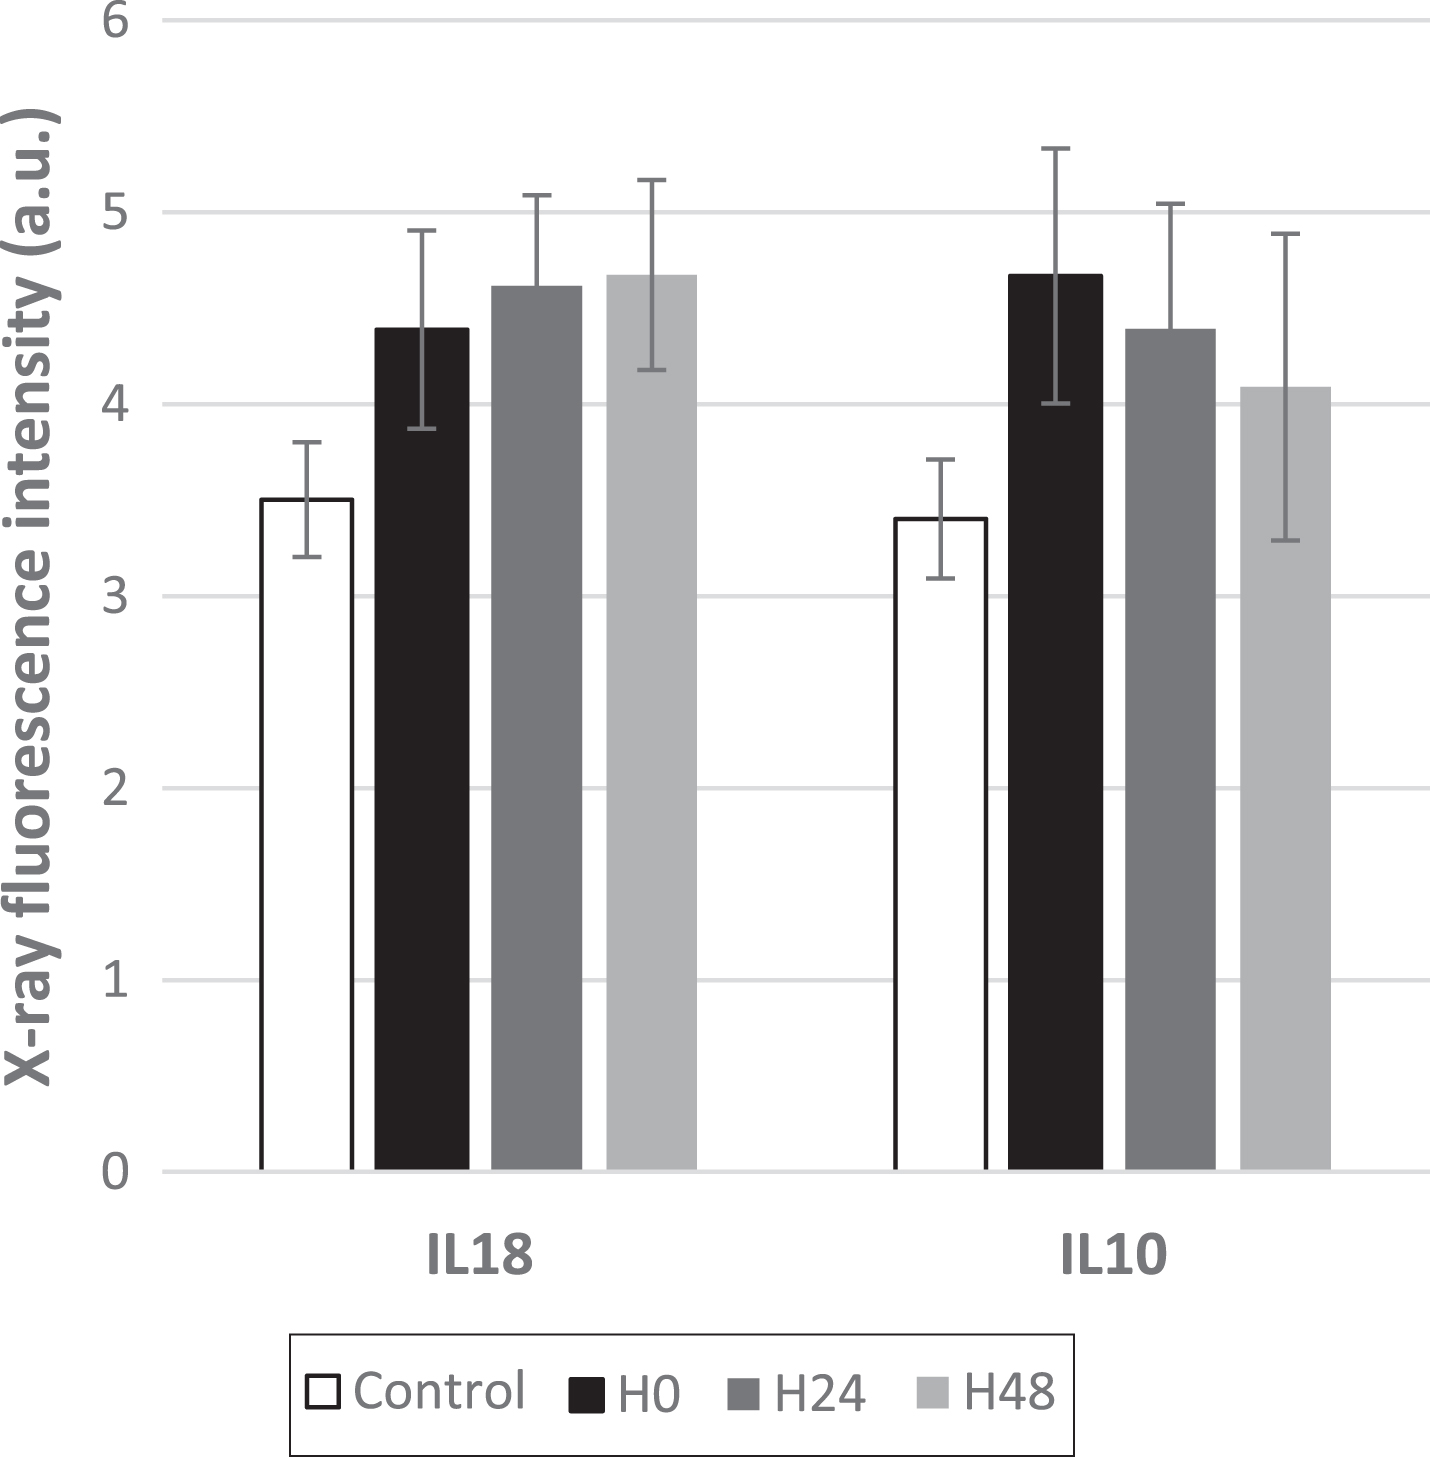
Both IL18 and IL10 cytokines are very often described in the literature dedicated to sepsis [41–43] and Eidt et al. [44] found mortality directly proportional to IL18 plasma levels, which did not occur with other inflammatory mediators whilst Mierzchala-Pasierb et al. [45] found that IL18 can be used to differentiate sepsis and septic shock status better than other biomarkers. IL10 is the anti-inflammatory cytokine. Indeed, the intensities of IL10 and IL18 probesets were strongly detected by the microarrays and significantly increased after septic shock as indicated by t-test (p-value<0.05, results not shown). The mean X-ray fluorescence signal measurements are given in Fig. 1. Moreover, it is well-known that IL10 and IL18 each adsorb onto only one specific receptor [46]. These receptors were constructed from two proteins (denoted IL10RA and IL10RB for IL10 and IL18R1 and IL18RAP for IL18) that were each described by a single probeset.
Fig. 1
Mean X-ray fluorescence signal measured for IL18 and IL10 cytokines at 0, 24 h and 48 h after septic shock. The corresponding signals obtained for the healthy volunteers are also reported as control data. The bars correspond to the standard deviation (n = 28 and 25 for sick and healthy patients, respectively).
As IL10RA is specific to IL10 receptor whilst IL10RB is also engaged by other receptors, the variation of IL10RA is followed. IL18R1 and IL18RAP are both specific receptors of the IL18 cytokine [46]. Here, we considered these two parts as equimolar in the receptor structure. This allowed the quantity of receptors to be monitored using only the limiting probeset. The selected cytokines and their receptors are presented in Table 1 with their corresponding probeset.
Table 1
List of the selected probesets related to the selected cytokines and their receptors
| Cytokine/ Cytokine receptor | Probeset |
| IL10 | 207433_at |
| IL10RA | 204912_at |
| IL10RB | 209575_at |
| IL18 | 206295_at |
| IL18R1 | 206618_at |
| IL18RAP | 207072_at |
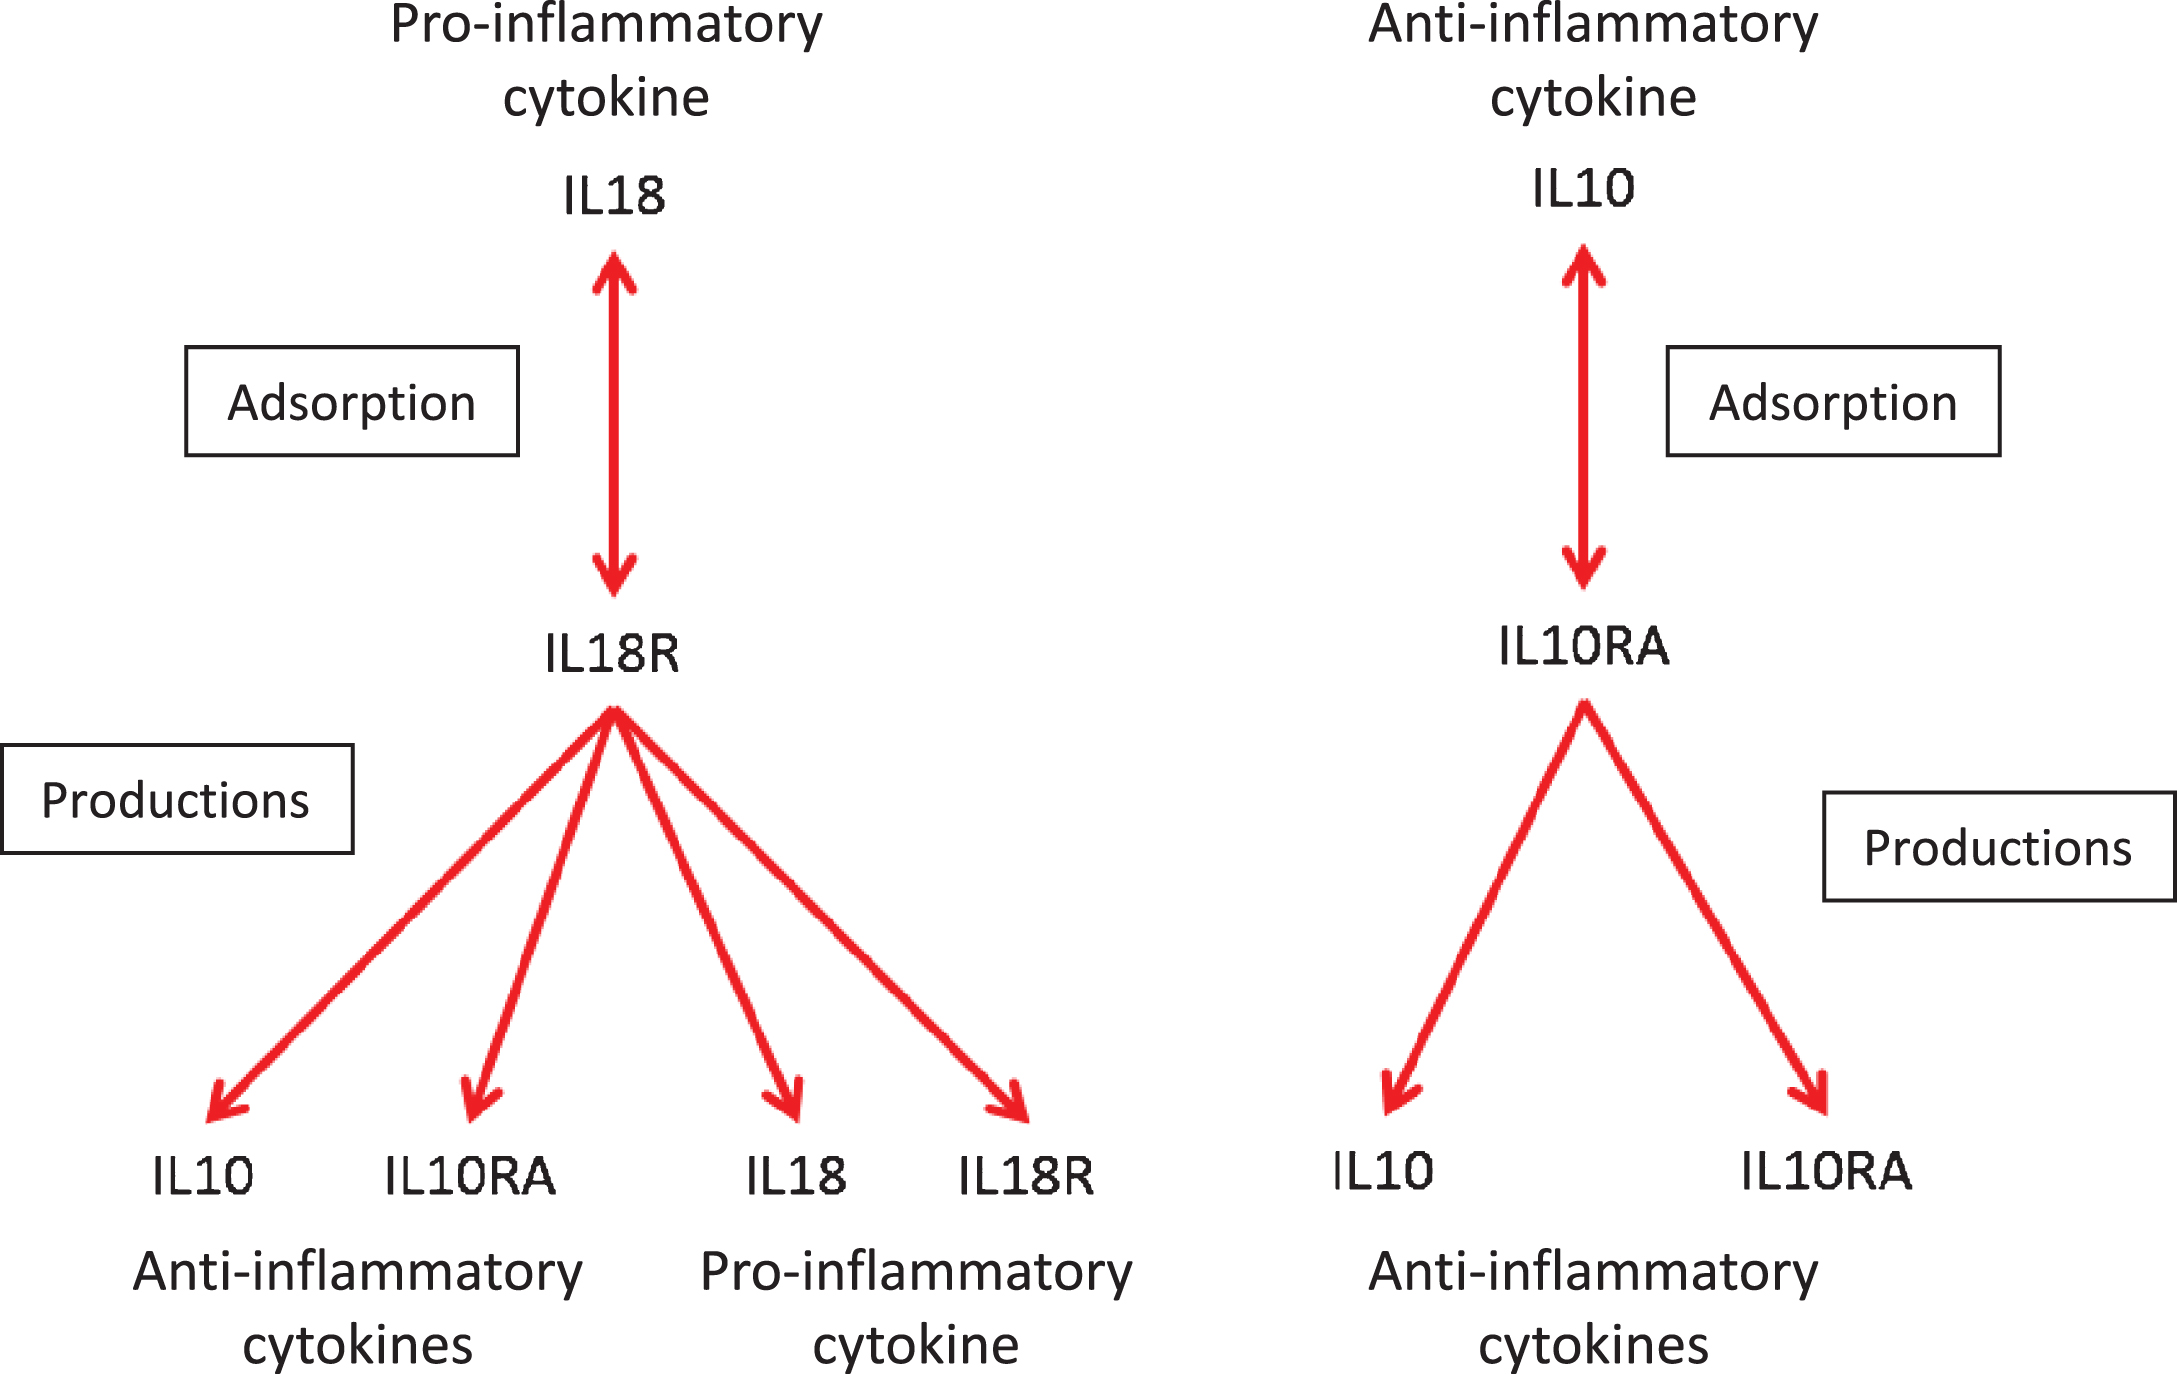
In reality, cytokines such as IL18 and IL10 have pro- or anti- inflammatory actions through complex networks involving feedbacks [42, 47–49]. Here, we are limited to a single cytokine pair. So, prior to the modeling part, the two following assumptions have been made to describe both the adsorption and production mechanisms of IL10 and IL18 cytokines:
i) the cytokines adsorb specifically onto their receptor (IL10RA and IL18 R, respectively) and no interaction occurs with other receptors and
ii) the pro-inflammatory cytokine (IL18) stimulates the production of both pro- and anti-inflammatory species while IL10 only stimulates the production of anti-inflammatory ones (as reported in Fig. 2).
Fig. 2
Schematic representation of adsorption and production mechanisms related to IL18 and IL10 cytokines.
2.2Conversion of X-ray fluorescence data into concentration
In order to be able to apply the model to patient data, it was necessary to convert the X-ray fluorescence intensities into concentrations. Indeed, the material balances were made on species in molar quantities.
However, no calibration curve was available. Indeed, the transcribed RNA cannot be rigorously correlated to the amounts of the expressed proteins: many steps subsequent to the formation of the RNA are necessary before obtaining an effector protein. Correlating the X-ray fluorescence to the concentration is therefore an over-evaluation of the protein concentration in the medium, but is necessary at first.
All the probeset intensities are numerically treated so that they can be compared relative to each other [7]. A calibration curve between X-ray fluorescence intensity and protein concentration can be constructed from measured protein concentrations and the probesets.
During sepsis, protein production is strongly modified: the calibration curve is therefore constructed from control values only. These 22 probesets for healthy individuals make it possible to set maximum ranges of expression values which are correlated with ranges of protein volume concentrations from the literature [50, 51].
To try and improve accuracy, two other widely measured protein concentrations have been added: S100A8 and S100A9 [52]. These S100 alarmin biomarkers are secreted by leukocytes and are involved in various inflammatory diseases. This data was used to create the calibration curve shown in Fig. 3, relating the protein concentration in mol.m-3 to the X-ray fluorescence intensity. Linear regression was used to obtain the following relation:
Fig. 3
Calibration curve for protein concentration from Average X-ray fluorescence values in healthy patients.
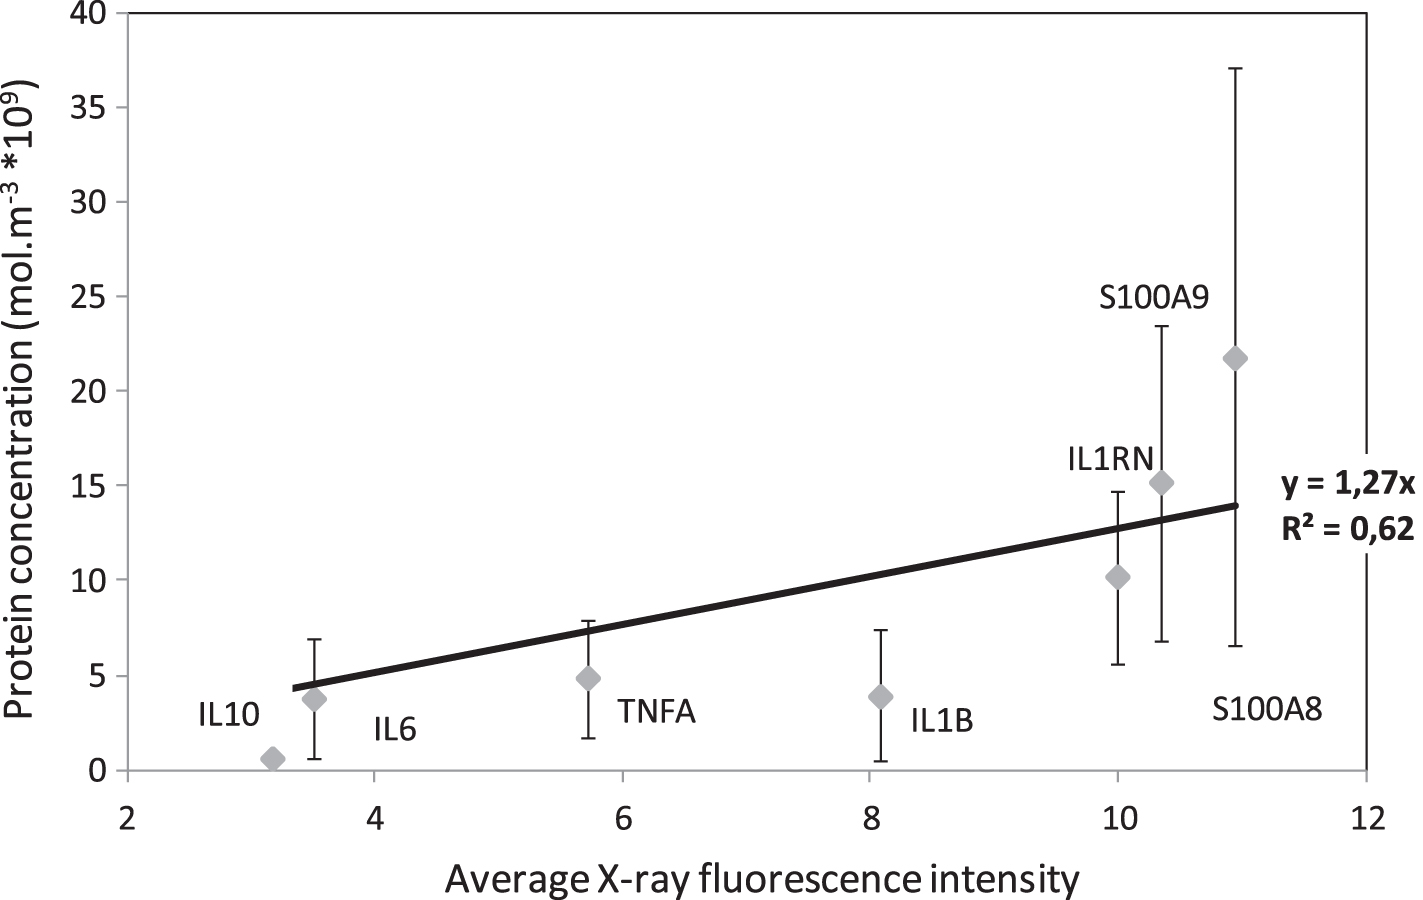
Protein concentration = 1.27x10⁻⁹ X-ray fluorescence intensity
So, finally, the experimental training data, which will be used for parameter estimation, is the concentrations of IL10, IL10 R, IL18, IL18 R and the white blood cell count (leukocytes).
3Modeling
The model is based on chemical reaction engineering principles with the following assumptions:
• The blood system is an open system (mass balances based on fluxes), described with two phases: a fluid phase (blood), and leucocyte cells. It has interactions with surroundings through source terms of cells coming from bone marrow and source terms of cytokines and receptors coming from organs. The blood system is represented in Fig. 4.
• The blood volume is assumed to be constant.
• The cells are uniformly dispersed in the fluid phase and represent average leucocyte cells.
• The receptors are described as being only on the surface of the cells. They are said to be uniformly distributed.
• The adsorbed anti-inflammatory IL10 cytokines (B) on their receptors IL10RA (RB) directly trigger the chemical production of IL10 (B) and IL10RA (RB). The adsorbed pro-inflammatory IL18 cytokines (A) on their receptors IL18 R (RA) trigger the chemical production of all cytokines and receptors. The production kinetics of both cytokines and receptors are assumed to be of order 1 with respect to the adsorbed cytokines.
• The linear driving force model is used to represent the transfer of cytokines from the cell to the blood and the transfer of cytokines from the blood to receptors [53]. This model relates the average adsorbate concentration inside the cell directly with the concentration in the fluid phase.
• The cytokines in the blood are adsorbed on receptors. This adsorption is already described in some existing pharmacokinetic models [24]. Langmuir equilibrium is assumed for the adsorption [54]. So the expressions of the adsorbed concentrations onto the surface of cells are given below (see Nomenclature section for definition of variables):
The inflammation comes from the variation of the cytokines, which can stimulate or inhibit leucocyte production.
3.1Cytokine material balances in the fluid, at the cell/fluid interface and in the cells
In chemical reaction engineering it is usual to construct balances over a defined volume based on conservation of mass. This can be for any individual component or the sum of all the species present. The mass balance takes into account the consumption, production and accumulation of the species under consideration as well as mass flows into and out of the defined volume [55].
The material balances in mol.min-1 for A (pro-inflammatory cytokine IL18) and B (anti-inflammatory cytokine IL10) in the fluid, at the interface of the cells and in the cells, are given in Equations (1)–(6). Equation (1) is for the pro-inflammatory cytokines in the blood volume. They arrive from the cell interior and a source, such as an inflamed organ or mucus, and are transferred to receptors on the cell membrane. There is also a term for cytokine consumption because they have a fixed lifetime. Equations (2) and (3) respectively, are the balances on the cytokine quantities at the cell membrane and inside the cell. The amount of cytokine interior to the cell depends on the mass transfer rate from the cell to the blood volume, the consumption rate due to the fixed lifetime and the production of cytokine due to adsorption onto the cell surface. Equations (4) to (6) represent the anti-inflammatory cytokine behaviour. It is identical to that of the pro-inflammatory cytokine except adsorbed quantities of both pro- and anti- inflammatory cytokines are used to determine the cytokine quantity inside the cell.
(1)
(2)
(3)
(4)
(5)
(6)
Equations (7) and (8) give the mass balances on the cytokine receptors which are found on the outside surface of the cell membrane.
The terms
(7)
(8)
3.2Cell number balances
Equation (9) is the balance on the number of cells in the blood volume with the inflammation function given in Equation (10). This function combines the quantities of pro- and anti- inflammatory cytokines to give a numerical representation of the overall amount of inflammation in the body. This function is chosen with the variable parameter, α, adjusted such that f = 0 for healthy volunteers, with the average IL18 and IL10 concentrations taken as 3.87 and 4.09 nmol.m-3 respectively.
(9)
(10)
This model has the ability to evolve to an alternative homeostatic equilibrium in the case of septic shock as shown in Tallon et al. [56].
4Results and discussion
The estimation procedure was initiated from simulation data reported in the previous work [56]. For the pair of cytokines under consideration, the model has 21 parameters for 45 experimental data points per patient (5 components multiplied by 9 sample times) and there are 19 patients. It is thus important to reduce the number of parameters to avoid over parameterization and, to this end, ten of the parameters (see Table 2) have been fixed at reasonable values. These were chosen by sensitivity analysis of the model, which revealed that, for all patients, variation in the receptor production kinetic constants (
Table 2
Fixed parameters and their values
| Mass transfer coefficients (min) | Death kinetic constants (min) | Kinetic constants for receptor production (min) | ||||
| Parameter |
|
|
|
|
|
|
| Value | 0.001 | 0.001 | 30 | 1470 | 90 | 90 |
11 parameters were estimated from 45 data points using the MATLAB non-linear least squares solver function, lsqnonlin, with the trust-region-reflective algorithm [57]. The algorithm minimizes the objective function based on an input vector of differences between the measured and calculated data. Calculated model results in the form of concentrations were converted into fluorescence for parameter estimation.
Parameter significance levels and confidence limits of the parameter vector, b, were determined from the standard calculation method assuming that errors in the data are normally distributed and bearing in mind the nonlinearity of this model. The lsqnonlin Jacobian output matrix, J, was used to estimate the standard error, s(bi), for parameter, bi, from Equations (11) to (12) with Σ, n and p respectively the sum of the squared errors, the numbers of data points and the number of estimated parameters.
(11)
(12)
(13)
4.1Strategy for parameter estimation
Although 10 parameters have been fixed due to their low variability, 11 parameters (8 physical parameters and 3 source terms) remained to be estimated for a total of 45 data points. First the estimation of all these parameters was performed for each patient. From a global analysis of parameter sensitivity, the three least sensitive parameters were then fixed and a second round of estimation was performed for all patients. Then, three more parameters were fixed and a third, final, estimation was carried out. In this section, we present the results of the different steps of this strategy.
4.1.1First round of estimation: 11 parameters for each patient
The estimated parameters are listed in Tables 3 and 4.
Table 3
List of the estimated parameters
| Langmuir coefficients (m3.mol-1) | Kinetic constants for cytokines production (min) | Proportion of receptors produced or destroyed (-) | Kinetic constant for cell production (min.mol.m-3) | ||||
| KA | KB |
|
|
| k1 | k2 |
|
Table 4
List of the estimated source terms
| Source terms for: | ||
| Pro-inflammatory cytokines (mol.min-1) | Anti-inflammatory cytokines (mol.min-1) | Cells (min-1) |
| SA | SB | Sc |
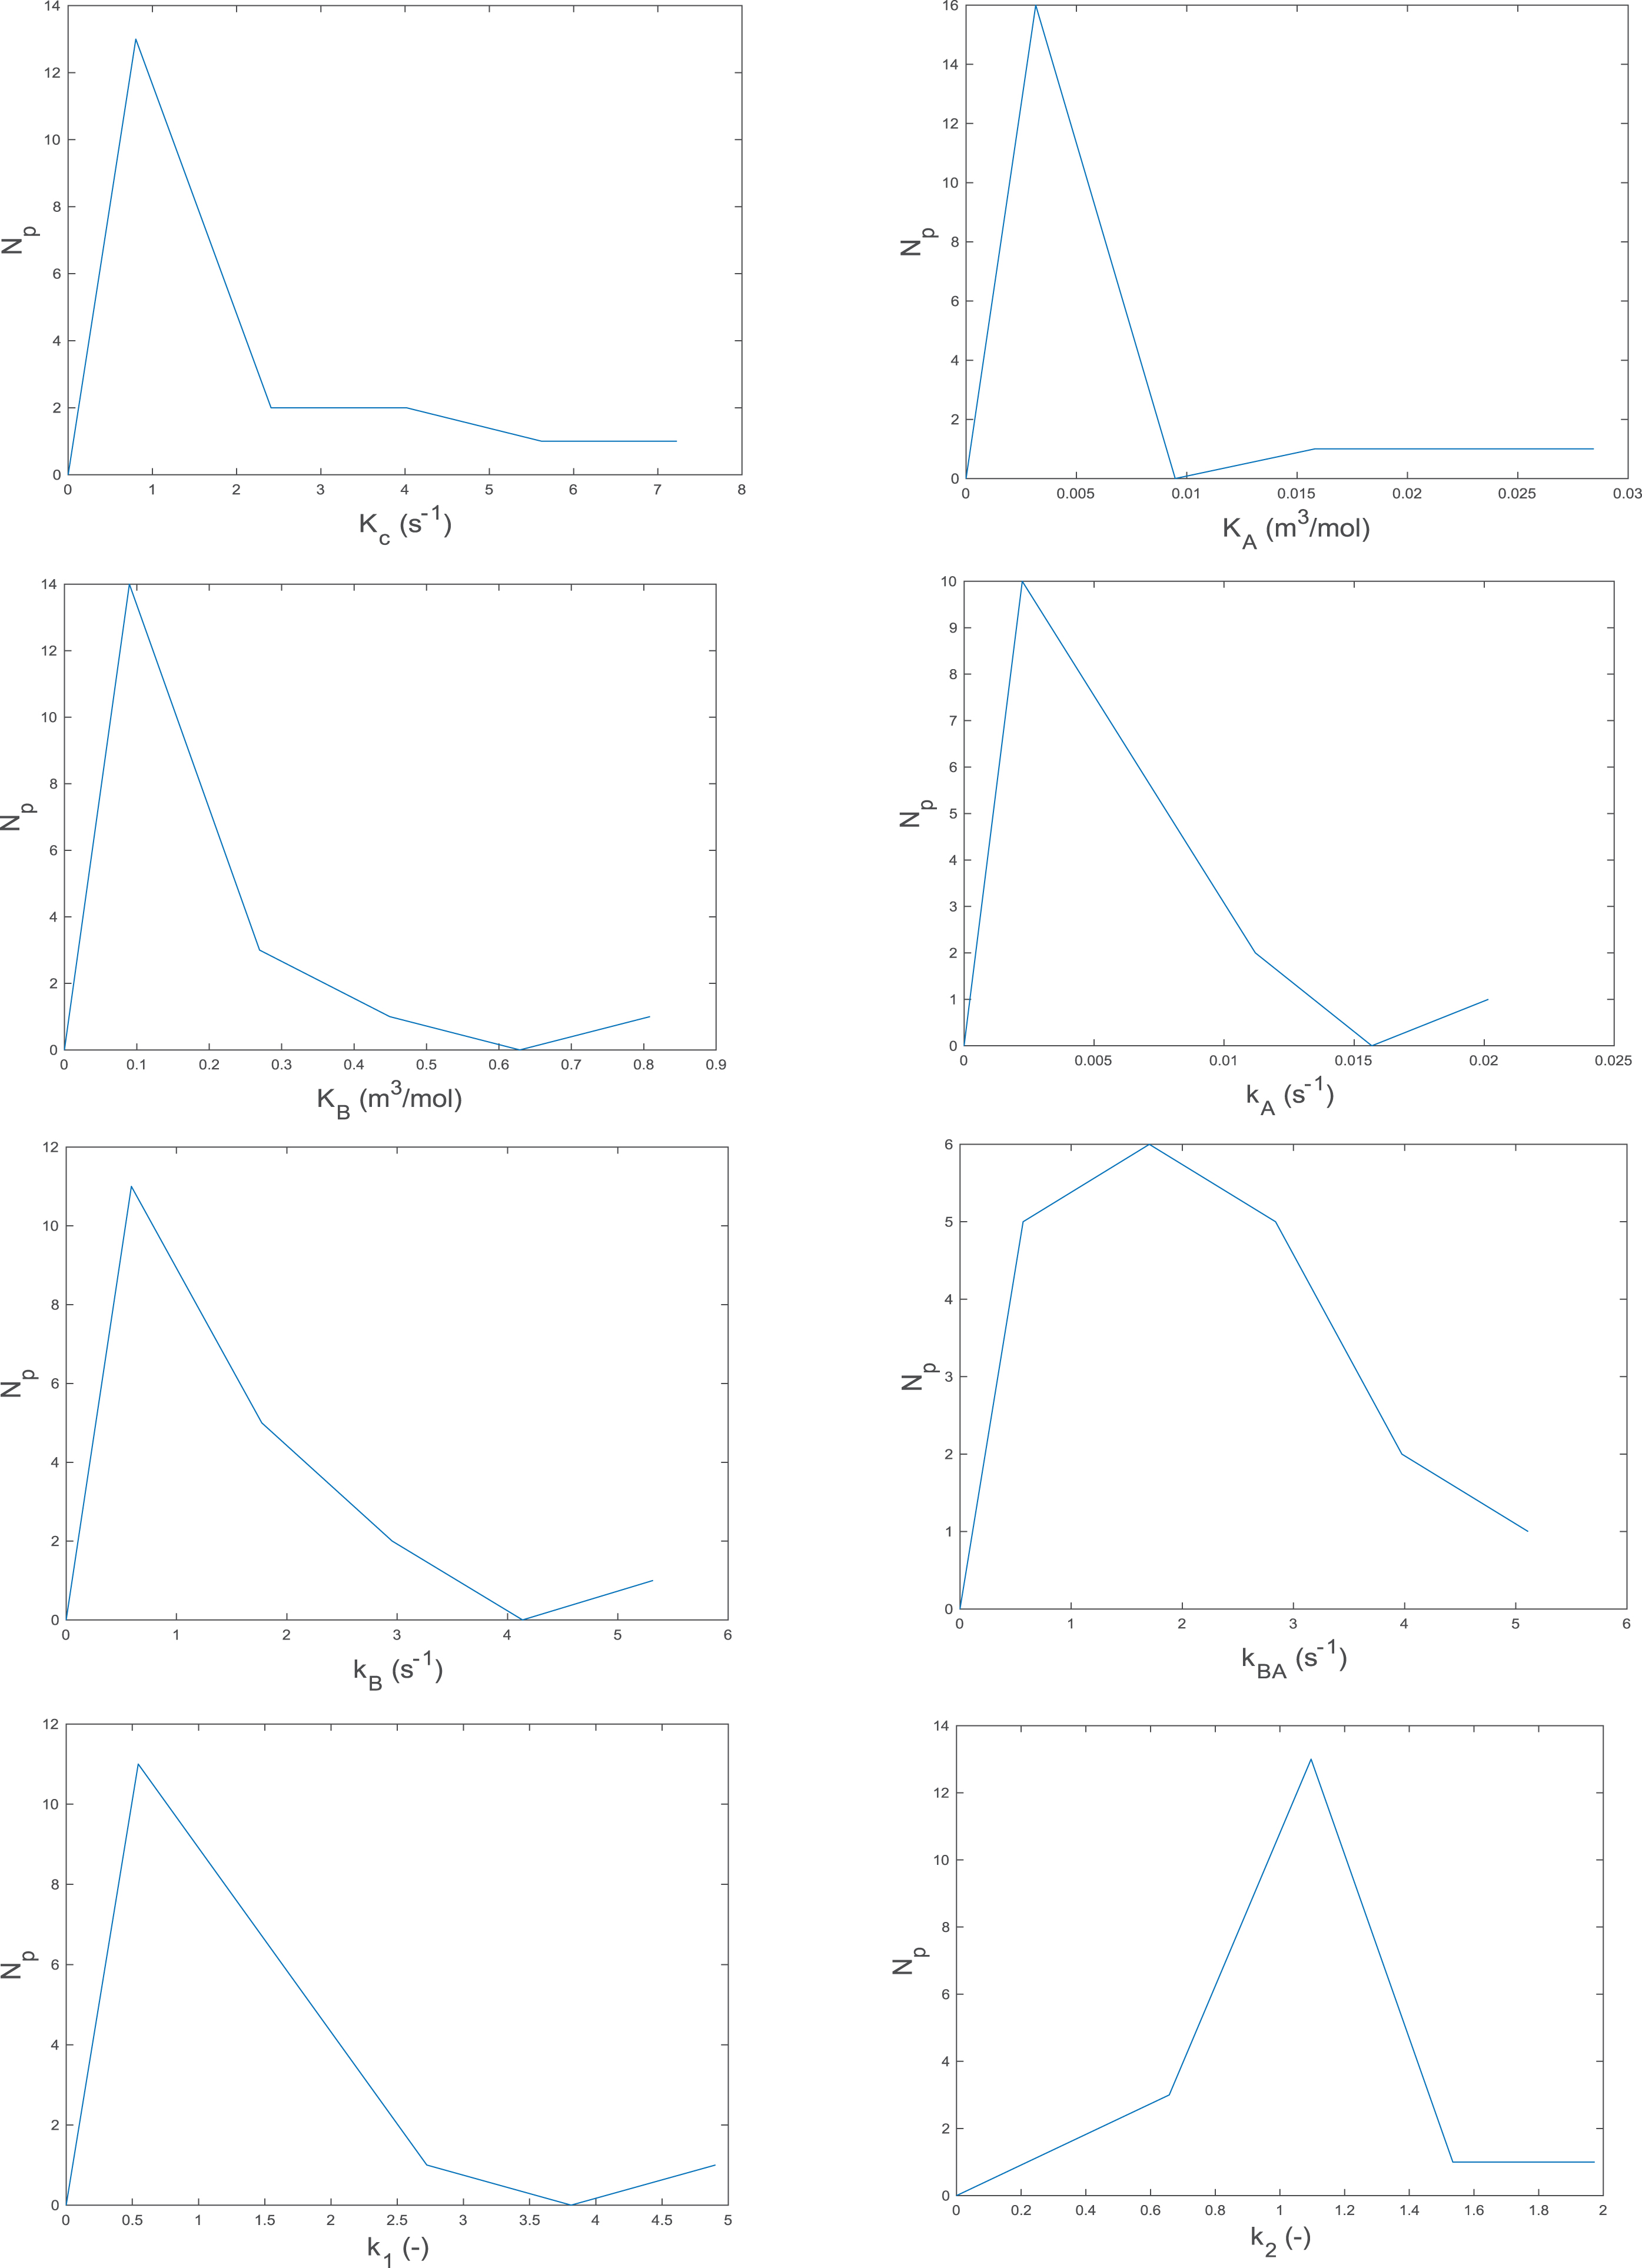
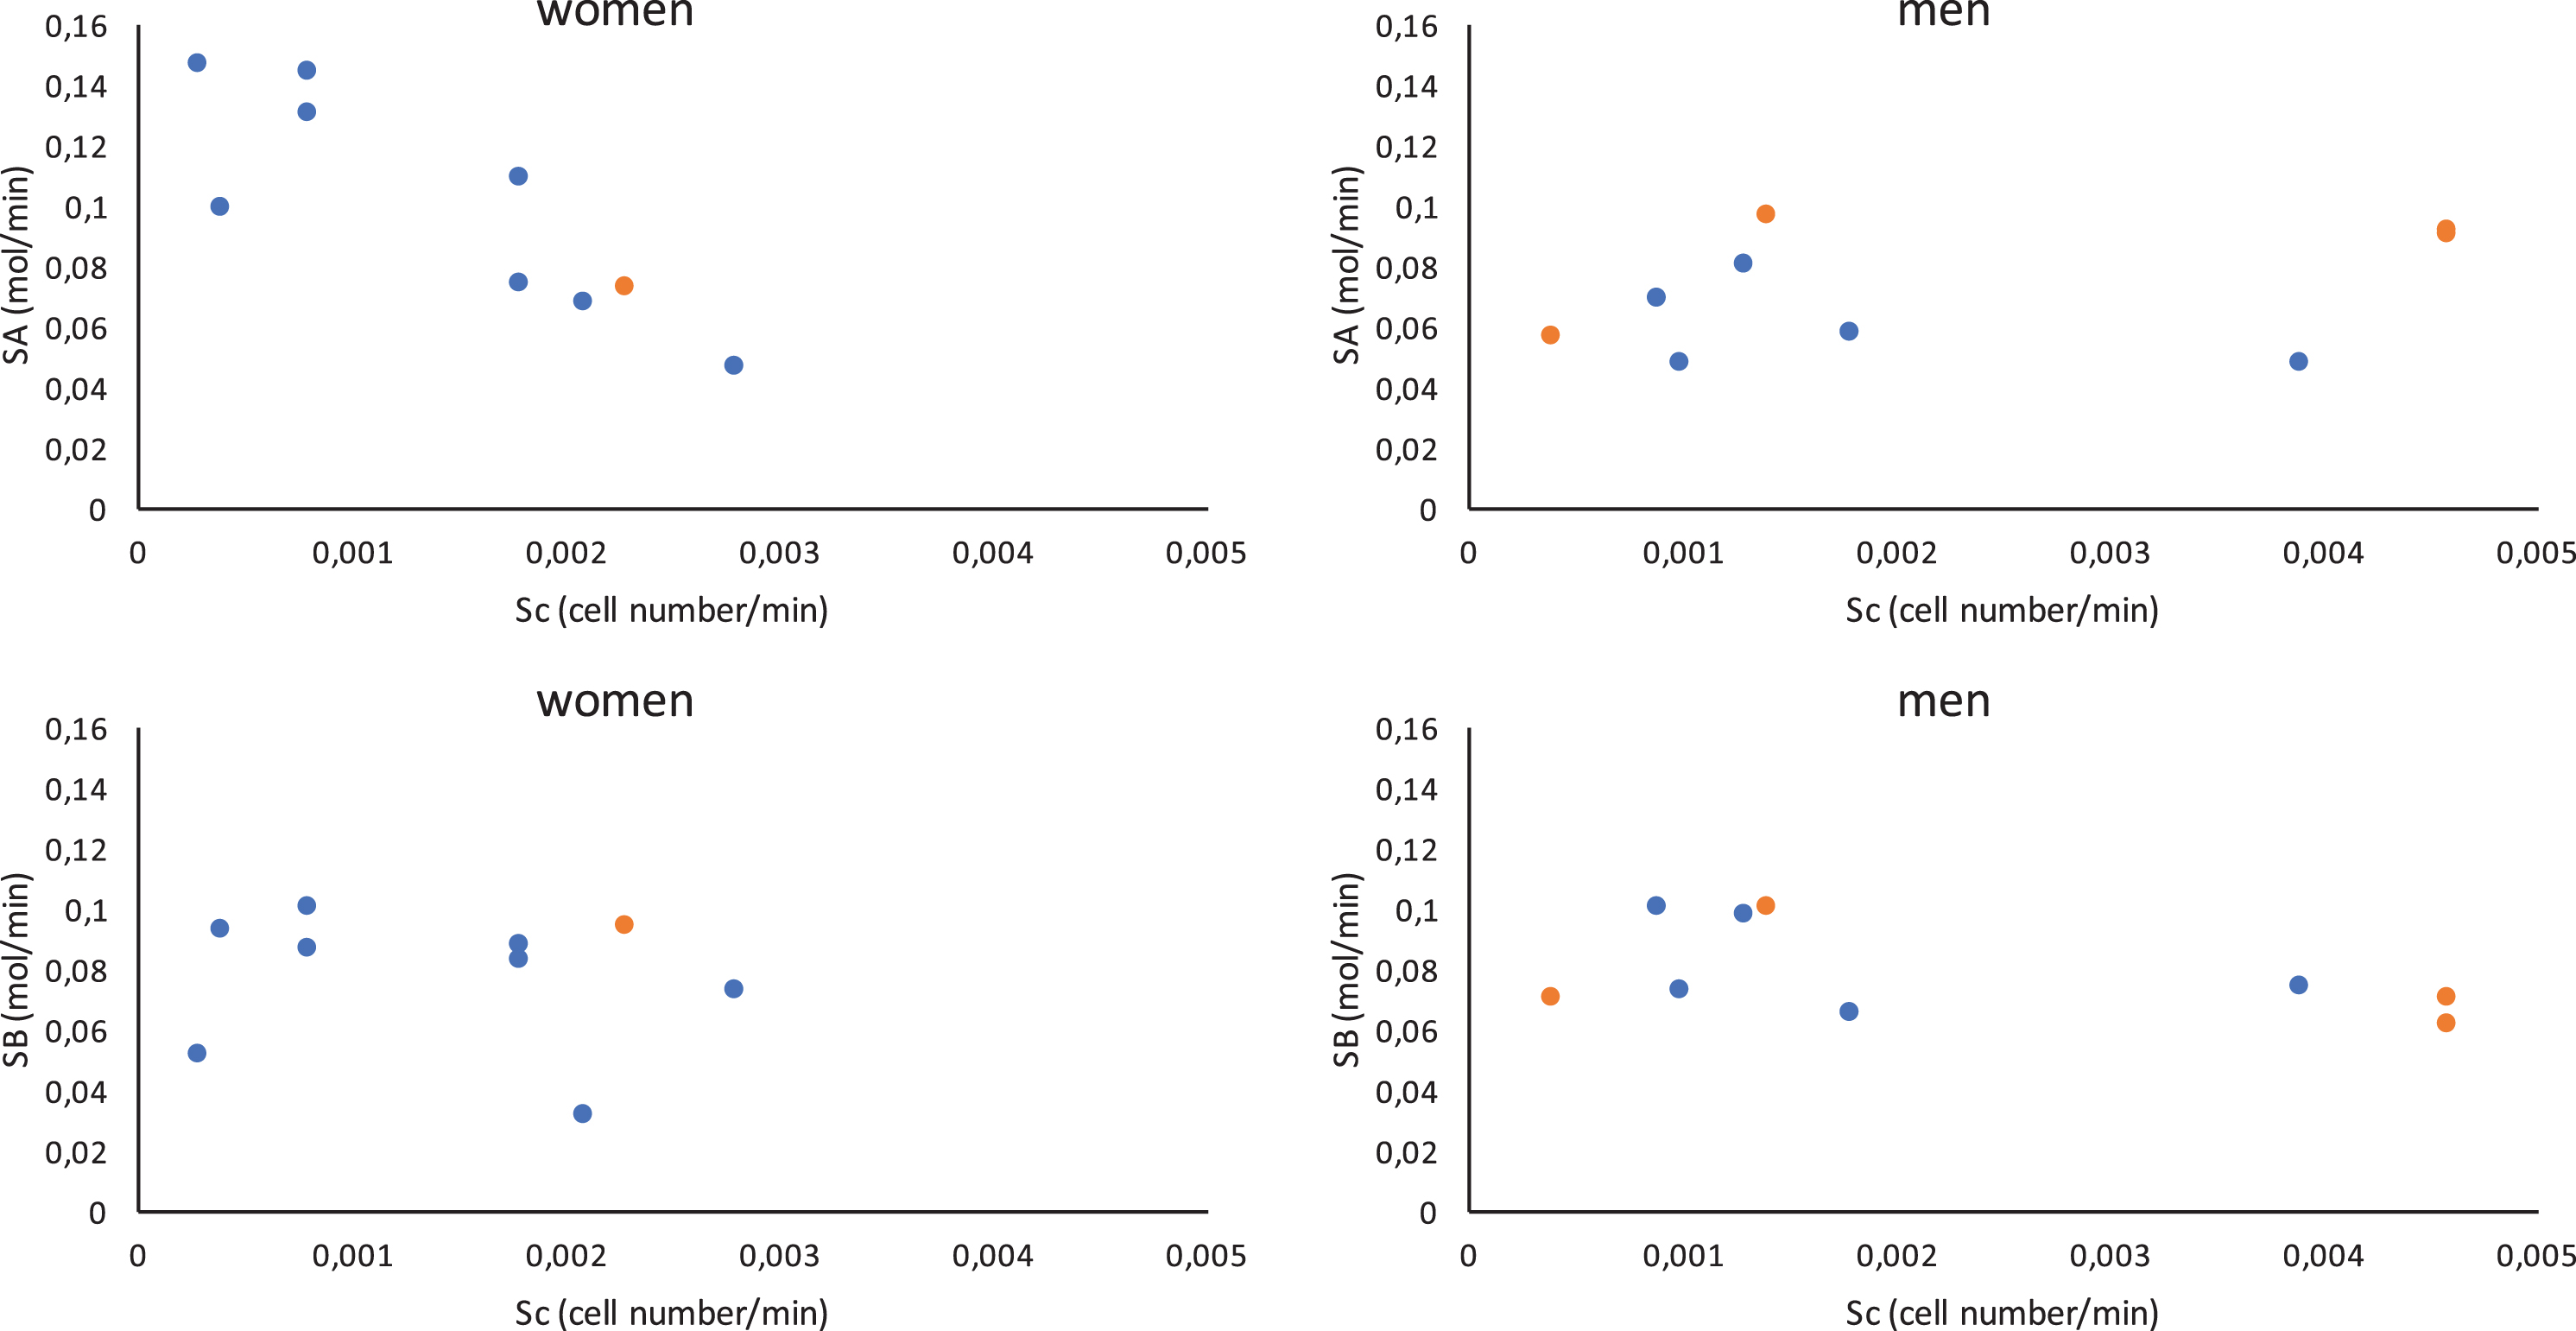
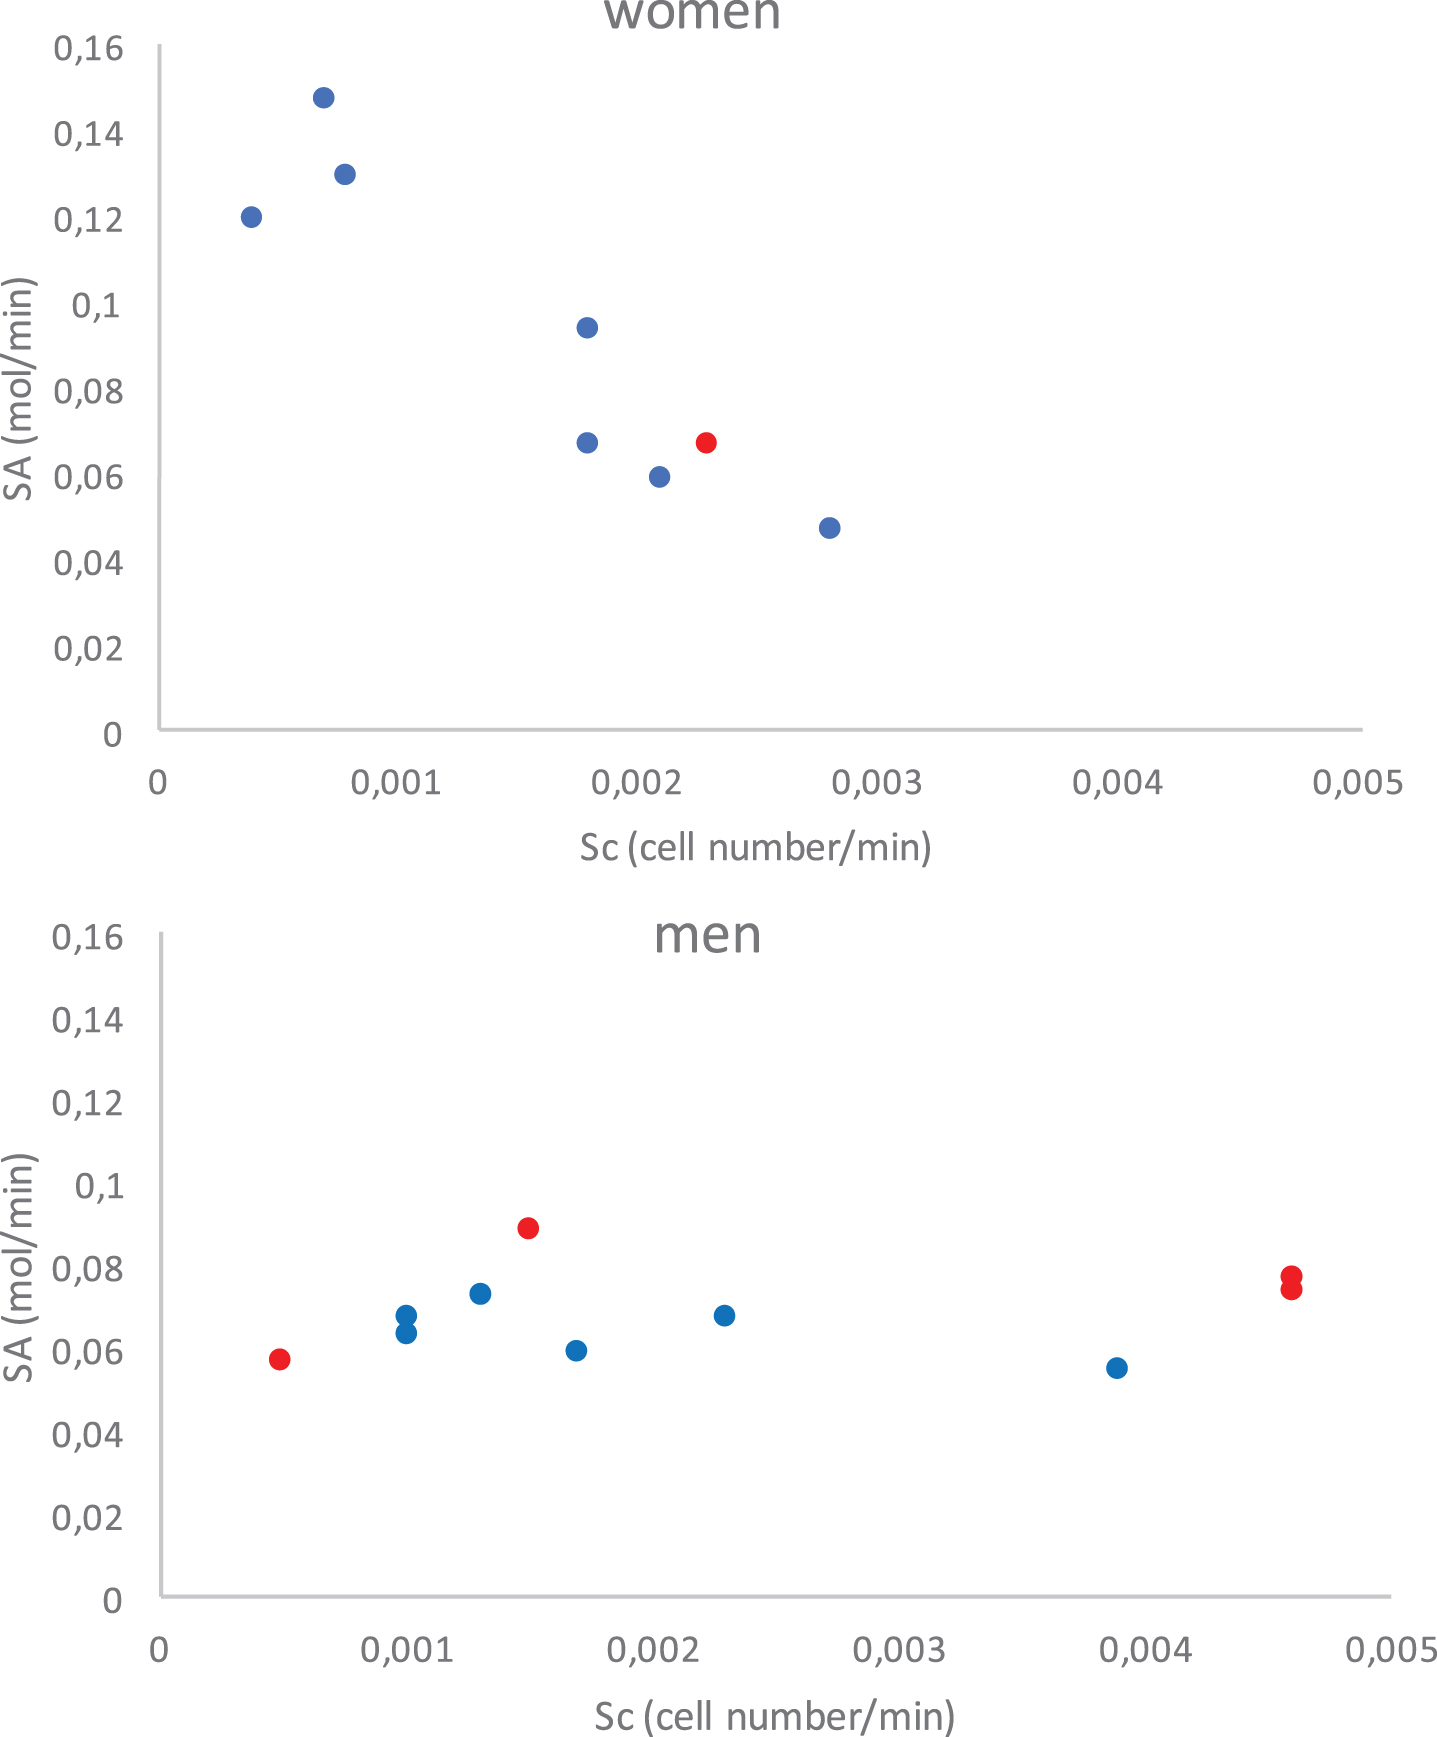
The distributions by number of patients for all the estimated parameters listed in Table 3 are given in Fig. 5. For each parameter, the estimated values for all the patients were collated into 5 sets to smooth the results and highlight the overall trend. Figure 6 gives the estimated values of the cytokine source terms, SA and SB, plotted against the estimated cell source term, Sc. This figure shows that the production of cytokines is more or less independent of the cell source term, except for the pro- inflammatory cytokine source term SA which seems to decrease as the cell source term increases. The bone marrow of women appears to produce fewer cells than that of men. Moreover, Fig. 6 shows that the relative rates of cytokine and cell production do not differ between patients who survive and those who do not.
Fig. 4
Representation of the blood system.
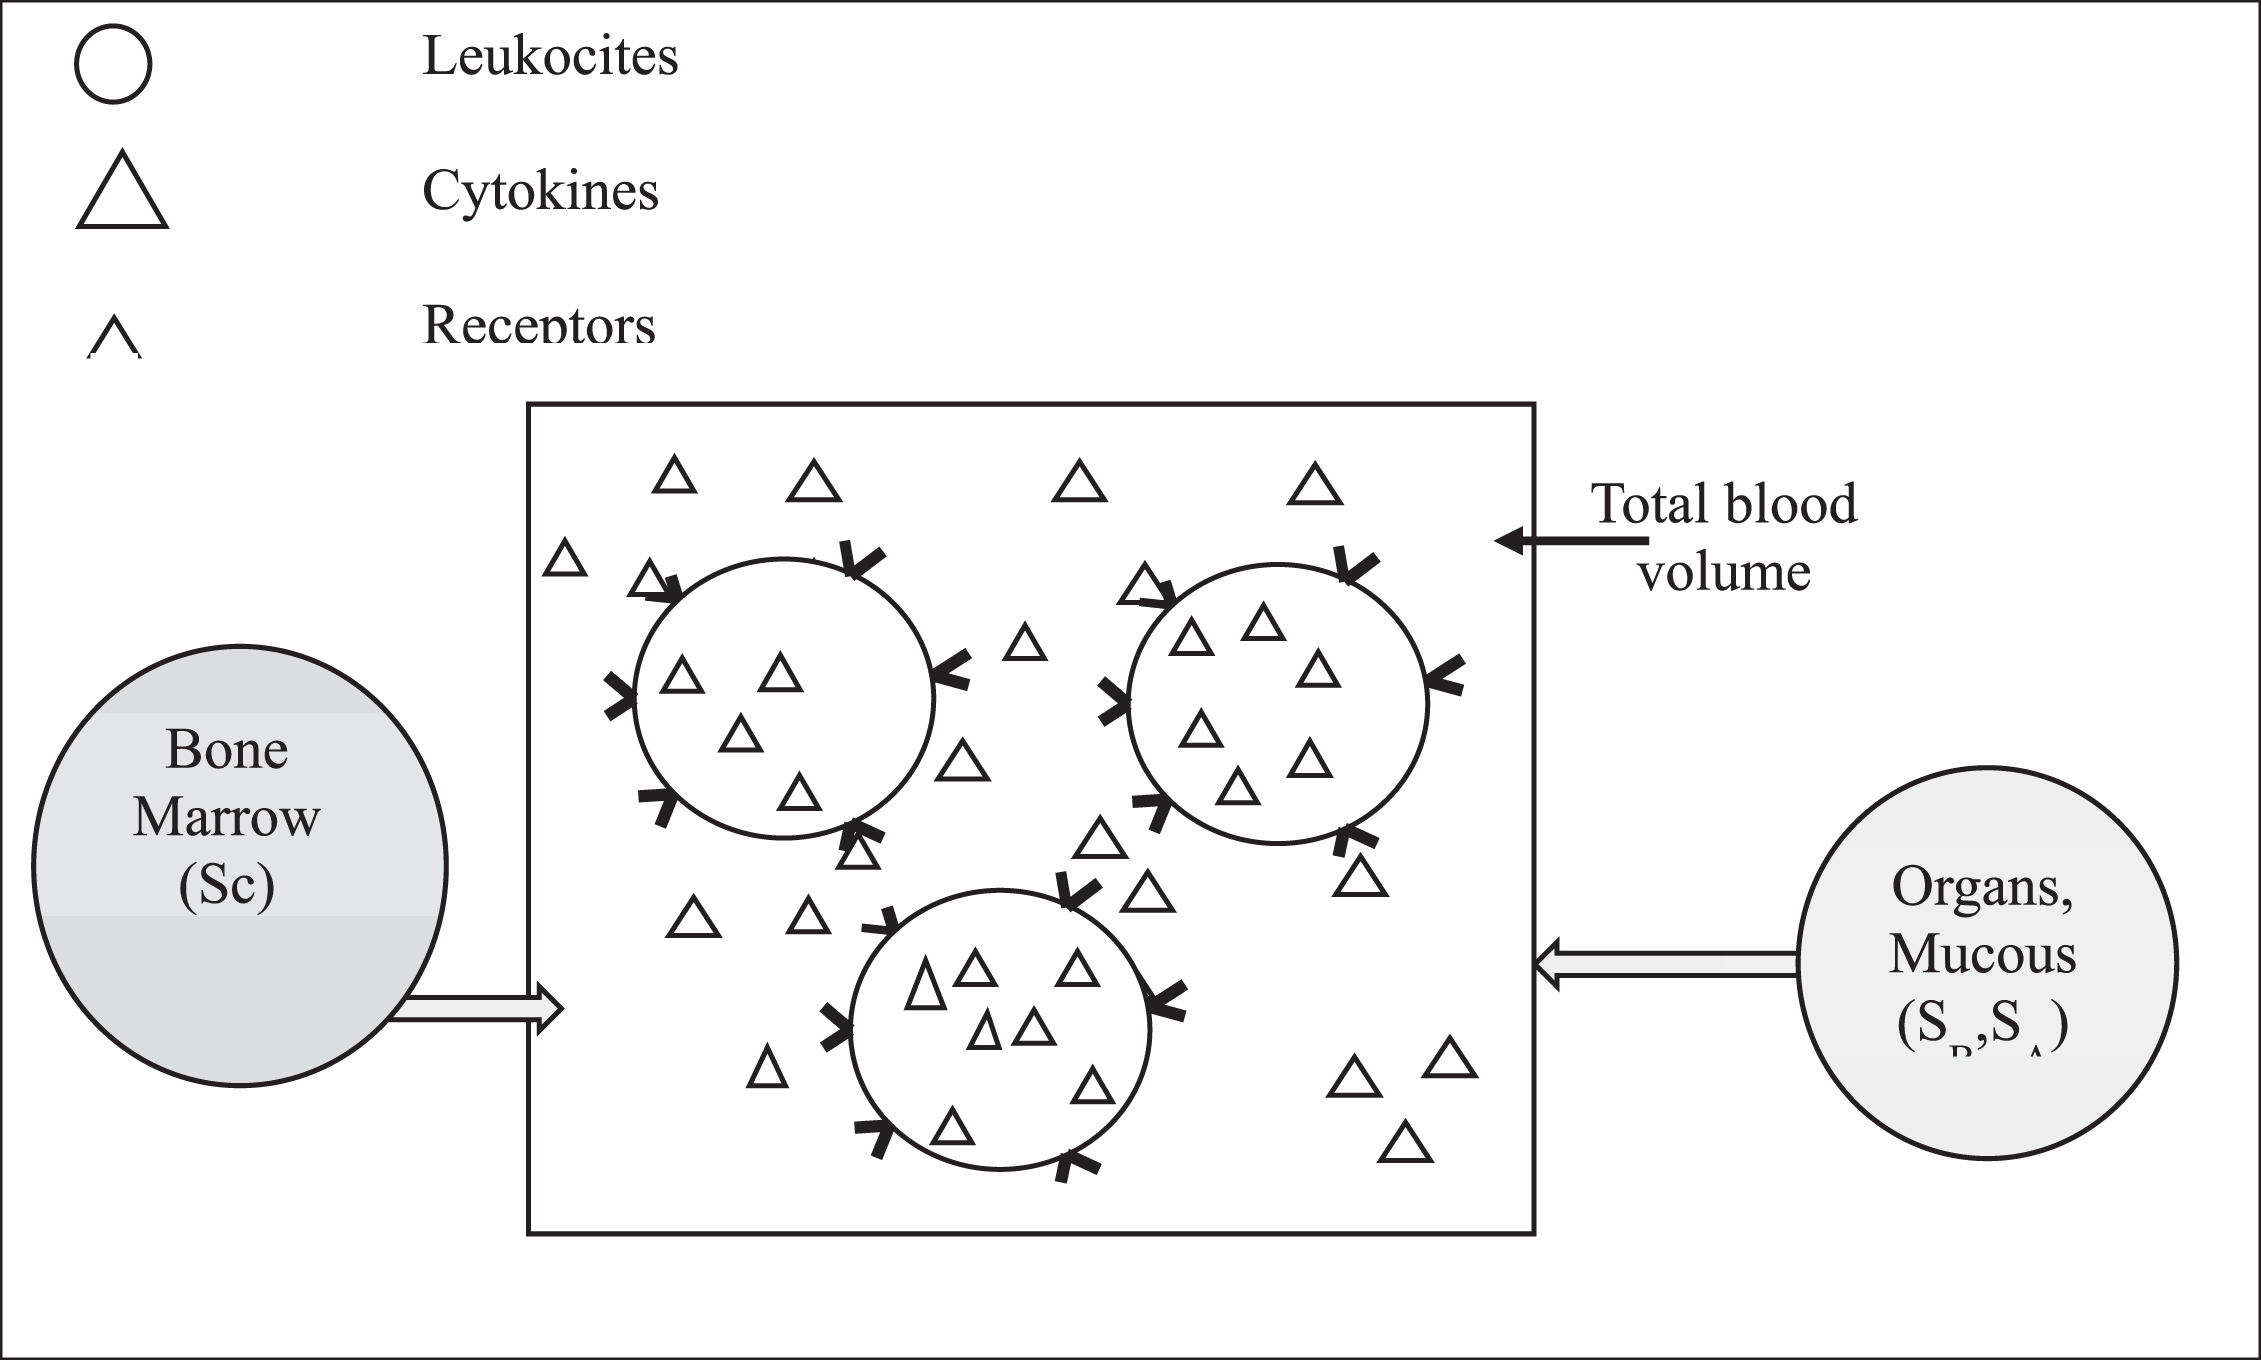
Fig. 5
Estimated parameter distributions by number of patients, Np for KA, KB, kA, kB, kBA, k1, k2, kc.
The mean parameter values (corresponding to the first moment of the distribution) are listed in Table 5 with parameter values and 95% confidence intervals for four patients (3 men and 1 woman including 2 patients who died). The source terms of cytokines and cells are presented in Table 6.
Table 5
Mean parameter values and calculated parameter values for four Patients (1 woman and 3 men) with their 95% confidence intervals (CI)
| Parameters | KA | KB | kA | kB | kBA | k1 | k2 | kc |
| (m3.mol-1) | (m3.mol-1) | (min-1) | (min-1) | (min-1) | (-) | (-) | (min-1) | |
| Total mean value for all patients (n = 19) | 0.0062 | 0.1750 | 0.0055 | 1.3996 | 2.1222 | 1.2328 | 1.0501 | 1.9016 |
| living woman | 0.0132 | 0.8984 | 0.0099 | 1.7205 | 0.2124 | 1.1939 | 0.9978 | 1.1097 |
| CI for living woman | ±0.006 | ±14 | ±0.006 | ±0.55 | ±33 | ±0.047 | ±0.028 | ±2.51 |
| dead man (1) | 0.0018 | 0.0009 | 0.0098 | 0.9778 | 2.4406 | 1.0732 | 1.031 | 0.198 |
| CI for dead man (1) | ±1 10-5 | ±3.2 | ±1 10-5 | ±1169 | ±3412 | ±1 10-5 | ±0.1 | ±7.7 |
| living man | 0.0024 | 0.3862 | 0.0035 | 0.4868 | 2.7062 | 1.3686 | 0.871 | 0.6541 |
| CI for living man | ±0.19 | ±44 | ±0.29 | ±56 | ±273 | ±0.79 | ±0.4 | ±45 |
| dead man (2) | 0.0019 | 0.3086 | 0.004 | 2.05 | 0.0945 | 0.4882 | 1.2208 | 4.1631 |
| CI for dead man (2) | ±1 10-5 | ±0.014 | ±0.0247 | ±51 | ±20 | ±0.19 | ±0.133 | ±248 |
Table 6
Mean source term values and source term values calculated for four Patients (1 woman and 3 men) with their 95% confidence interval (CI)
| Source terms | SA | SB | SC |
| (mol.min-1) | (mol.min-1) | (min-1) | |
| Living woman | 0.14 | 0.10 | 0.0008 |
| CI for Living woman | ±0.07 | ±0.04 | ±0.0002 |
| Dead man (1) | 0.09 | 0.07 | 0.0046 |
| CI for Dead man (1) | ±0.40 | ±0.30 | ±1 10-5 |
| Living man | 0.05 | 0.07 | 0.0010 |
| CI *for Living man | ±0.11 | ±0.12 | ±0.0003 |
| Dead man (2) | 0.10 | 0.10 | 0.0014 |
| CI for Dead man (2) | ±0.03 | ±0.22 | ±0.0001 |
Confidence intervals were calculated for the nonlinear parameters. A wide confidence interval suggests that there is insufficient identifiability structure in the model to determine the parameters from the available measurements. The existence of superfluous parameters in the model may lead to a “rank deficient” condition of the Jacobian matrix (when gradient based methods are used for solution) and/or inflated confidence intervals.
From the results presented in Table 5, it can be seen that the confidence intervals of parameters kB, kBA, kcwere very wide. So, they were considered non-sensitive and were set at the mean value obtained from all patients and given in Table 5. The most sensitive parameter for all patients, without exception, is the source term SC corresponding to the production of the cells by the bone marrow.
4.1.2Second round of estimation: 8 parameters for each patient
The same methodology as in Section 4.1.1 was applied for this new estimation. The distributions of parameters KA, KB, kA, k1, k2by number of patients are presented in Fig. 7. The estimated cytokine source terms, SA and SB, considered relative to the cell source term, Sc, are not given because the results were the same as those shown in Fig. 6. Table 7 gives the mean parameter values and source terms and also the parameter values and source terms for the same four patients as previously with their confidence intervals.
Table 7
Parameter and source term values determined from the whole set of patients (mean values, n = 19 and individually for four patients (1 woman and 3 men) with their 95% confidence interval (CI)
| Parameters | KA | KB | kA | k1 | k2 | SA | SB | SC |
| (m3.mol-1) | (m3.mol-1) | (min-1) | (-) | (-) | (mol.min-1) | (mol.min-1) | (min-1) | |
| Total Mean Value for all patients | 0.0082 | 0.2132 | 0.0085 | 1.4676 | 1.0830 | N/A | N/A | N/A |
| Living woman | 0.0233 | 0.9000 | 0.0170 | 1.197 | 0.989 | 0.135 | 0.100 | 0.0007 |
| CI for Living woman | ±0.008 | ±0.051 | ±0.008 | ±0.031 | ±0.035 | ±0.013 | ±0.03 | ±0.0001 |
| Dead man (1) | 0.0018 | 0.0009 | 0.0098 | 0.9778 | 2.4406 | 1.0732 | 1.031 | 0.198 |
| CI for Dead man (1) | ±3.8 | ±0.018 | ±20 | ±0.25 | ±0.24 | ±0.23 | ±0.22 | ±0.0008 |
| Living man | 0.0020 | 0.4996 | 0.0034 | 1.3274 | 0.9192 | 0.0596 | 0.0760 | 0.0010 |
| CI *for Living man | ±6 | ±6 | ±10 | ±0.55 | ±0.27 | ±0.058 | ±0.13 | ±0.0003 |
| Dead man (2) | 0.0018 | 0.2134 | 0.0038 | 0.5071 | 1.2221 | 0.0888 | 0.0996 | 0.0014 |
| CI for Dead man (2) | ±0 | ±2.9 | ±0.023 | ±0.19 | ±0.12 | ±0.1 | ±0.2 | ±0.0001 |
Since the confidence interval of parameter KBis wide for most of the patients, it was set to the corresponding total mean value given in Table 7. From Fig. 7 and Table 7, it can be seen that the mean value of parameter k2 was close to 1 for most patients. The concentration of the associated receptor (RB) was constant, meaning that the receptor concentration is linked to the formation and death of cells. The variation of the cell number was not accompanied by a proportional change in the number of receptors. So, this parameter was fixed at one for the last estimation. The source term related to the anti-inflammatory components was less sensitive and remained relatively constant for all patients (see Fig. 6). This latter was thus also fixed to 0.0742 mol/min, i.e. the average value calculated across all patients.
Fig. 6
Cytokine source terms, SA and SB, relative to cell source term, Sc. Black dots indicate deceased patients and grey dots represent survivors.
4.1.3Third round of estimation: 5 parameters for each patient
RB and k2 and KB being fixed, 5 parameters remained to be estimated. In the following, the distributions of parameters KA, kA, k1, by number of patients are presented in Fig. 8. Table 8 gives the mean parameter values and source terms and also the parameter values and source terms for the same four patients as previously with their confidence intervals.
Fig. 7
Parameter value distributions by number of patients for KA, KB, kA, k1, k2.
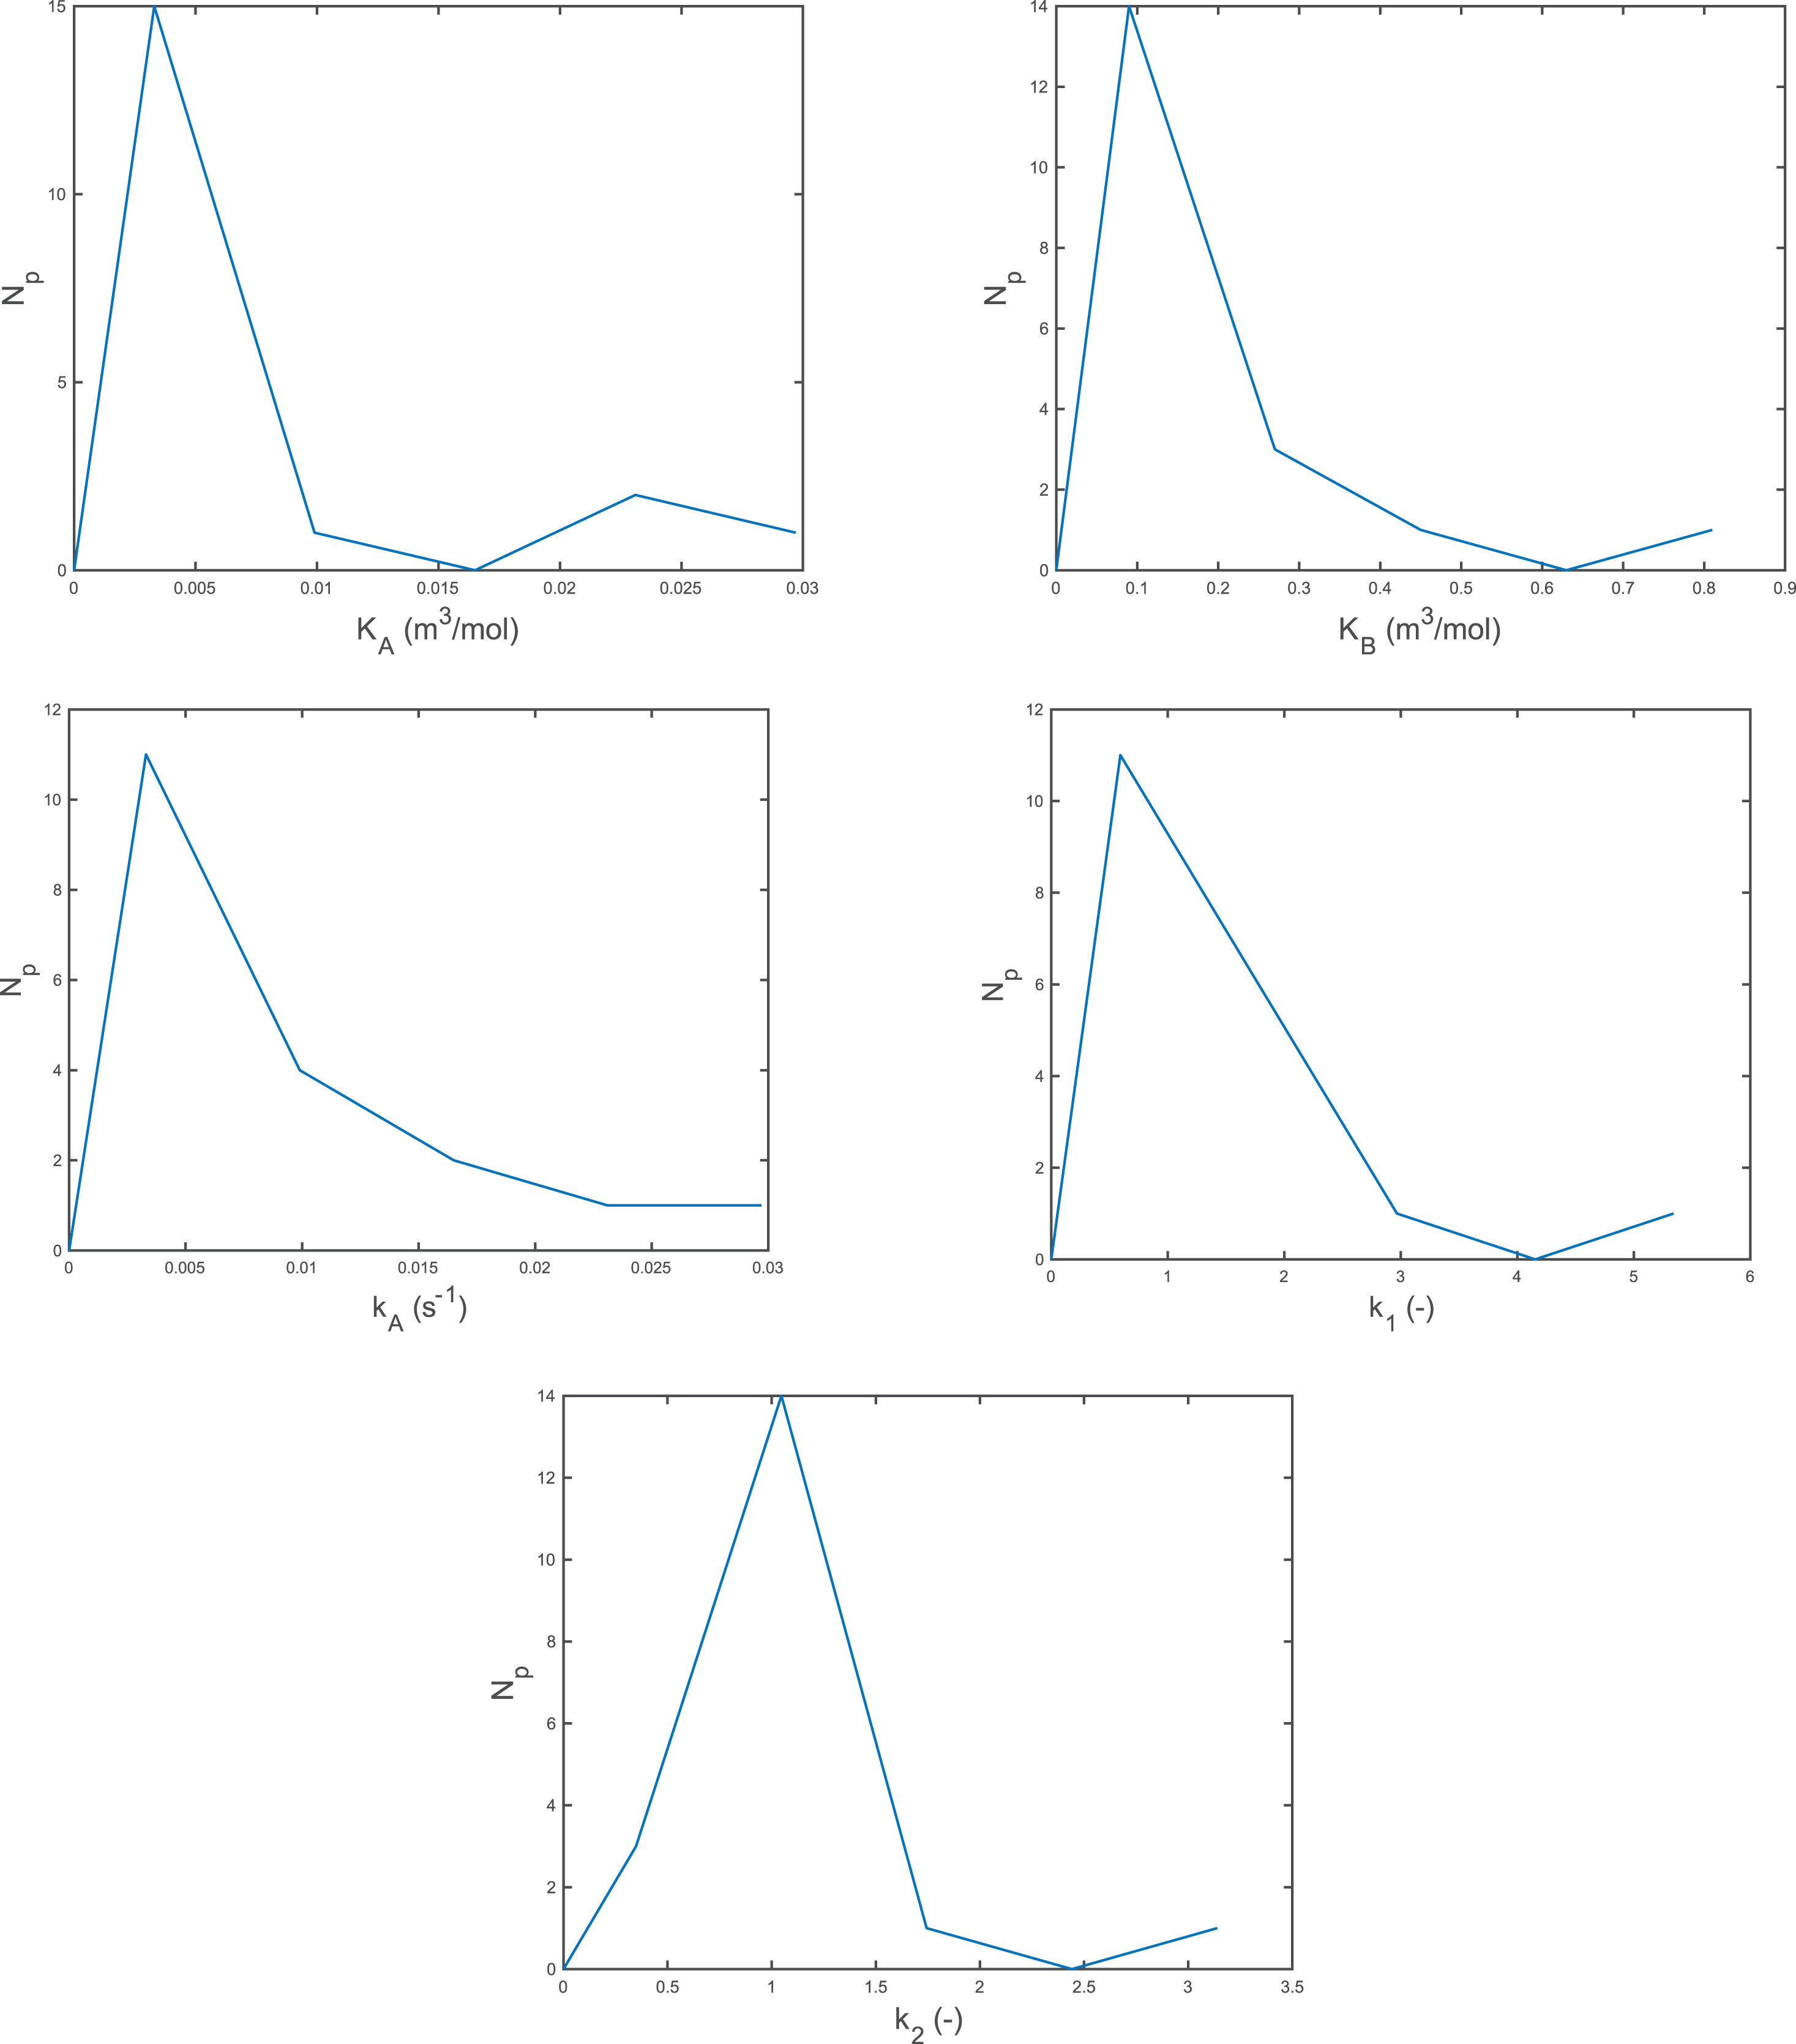
Table 8
Parameter and source term values determined from the whole set of patients (mean values, n = 19) and individually for four patients (1 woman and 3 men) with their 95% confidence interval (CI)
| Parameters | KA (m3.mol-1) | kA (min-1) | k1 (-) | SA (mol.min-1) | SA (mol.min-1) |
| Total Mean Value for all patients | 0.0082 | 0.0085 | 1.4676 | N/A | N/A |
| Living woman | 0.0799 | 0.0368 | 1.1990 | 0.1467 | 0.0007 |
| CI for Living woman | ±0.0064 | ±0.0064 | ±0.0597 | ±0.0150 | ±0.0002 |
| Dead man (1) | 0.0006 | 0.0031 | 1.0686 | 0.0730 | 0.0046 |
| CI for Dead man (1) | ±0.0007 | ±0.0007 | ±0.2963 | ±0.0424 | ±0.0018 |
| Living man | 0.0026 | 0.0039 | 1.3300 | 0.0666 | 0.0010 |
| CI *for Living man | ±0.00001 | ±0.0029 | ±0.3463 | ±0.0212 | ±0.0003 |
| Dead man (2) | 0.0036 | 0.0044 | 0.5492 | 0.0884 | 0.0014 |
| CI for Dead man (2) | ±0.00001 | ±0.0008 | ±0.2530 | ±0.1350 | ±0.0002 |
Figure 8 shows that the parameters of all patients who died are to the left of the distribution, especially for the adsorption of the pro-inflammatory cytokine, IL18, onto its receptor, meaning a very slow adsorption. This slow adsorption could cause a slow cell response to the inflammatory action of the system and therefore lead to bad regulation of this aspect.
Fig. 8
Parameter value distributions by number of patients for KA, kA, k1 and the intervals corresponding to all dead patients.
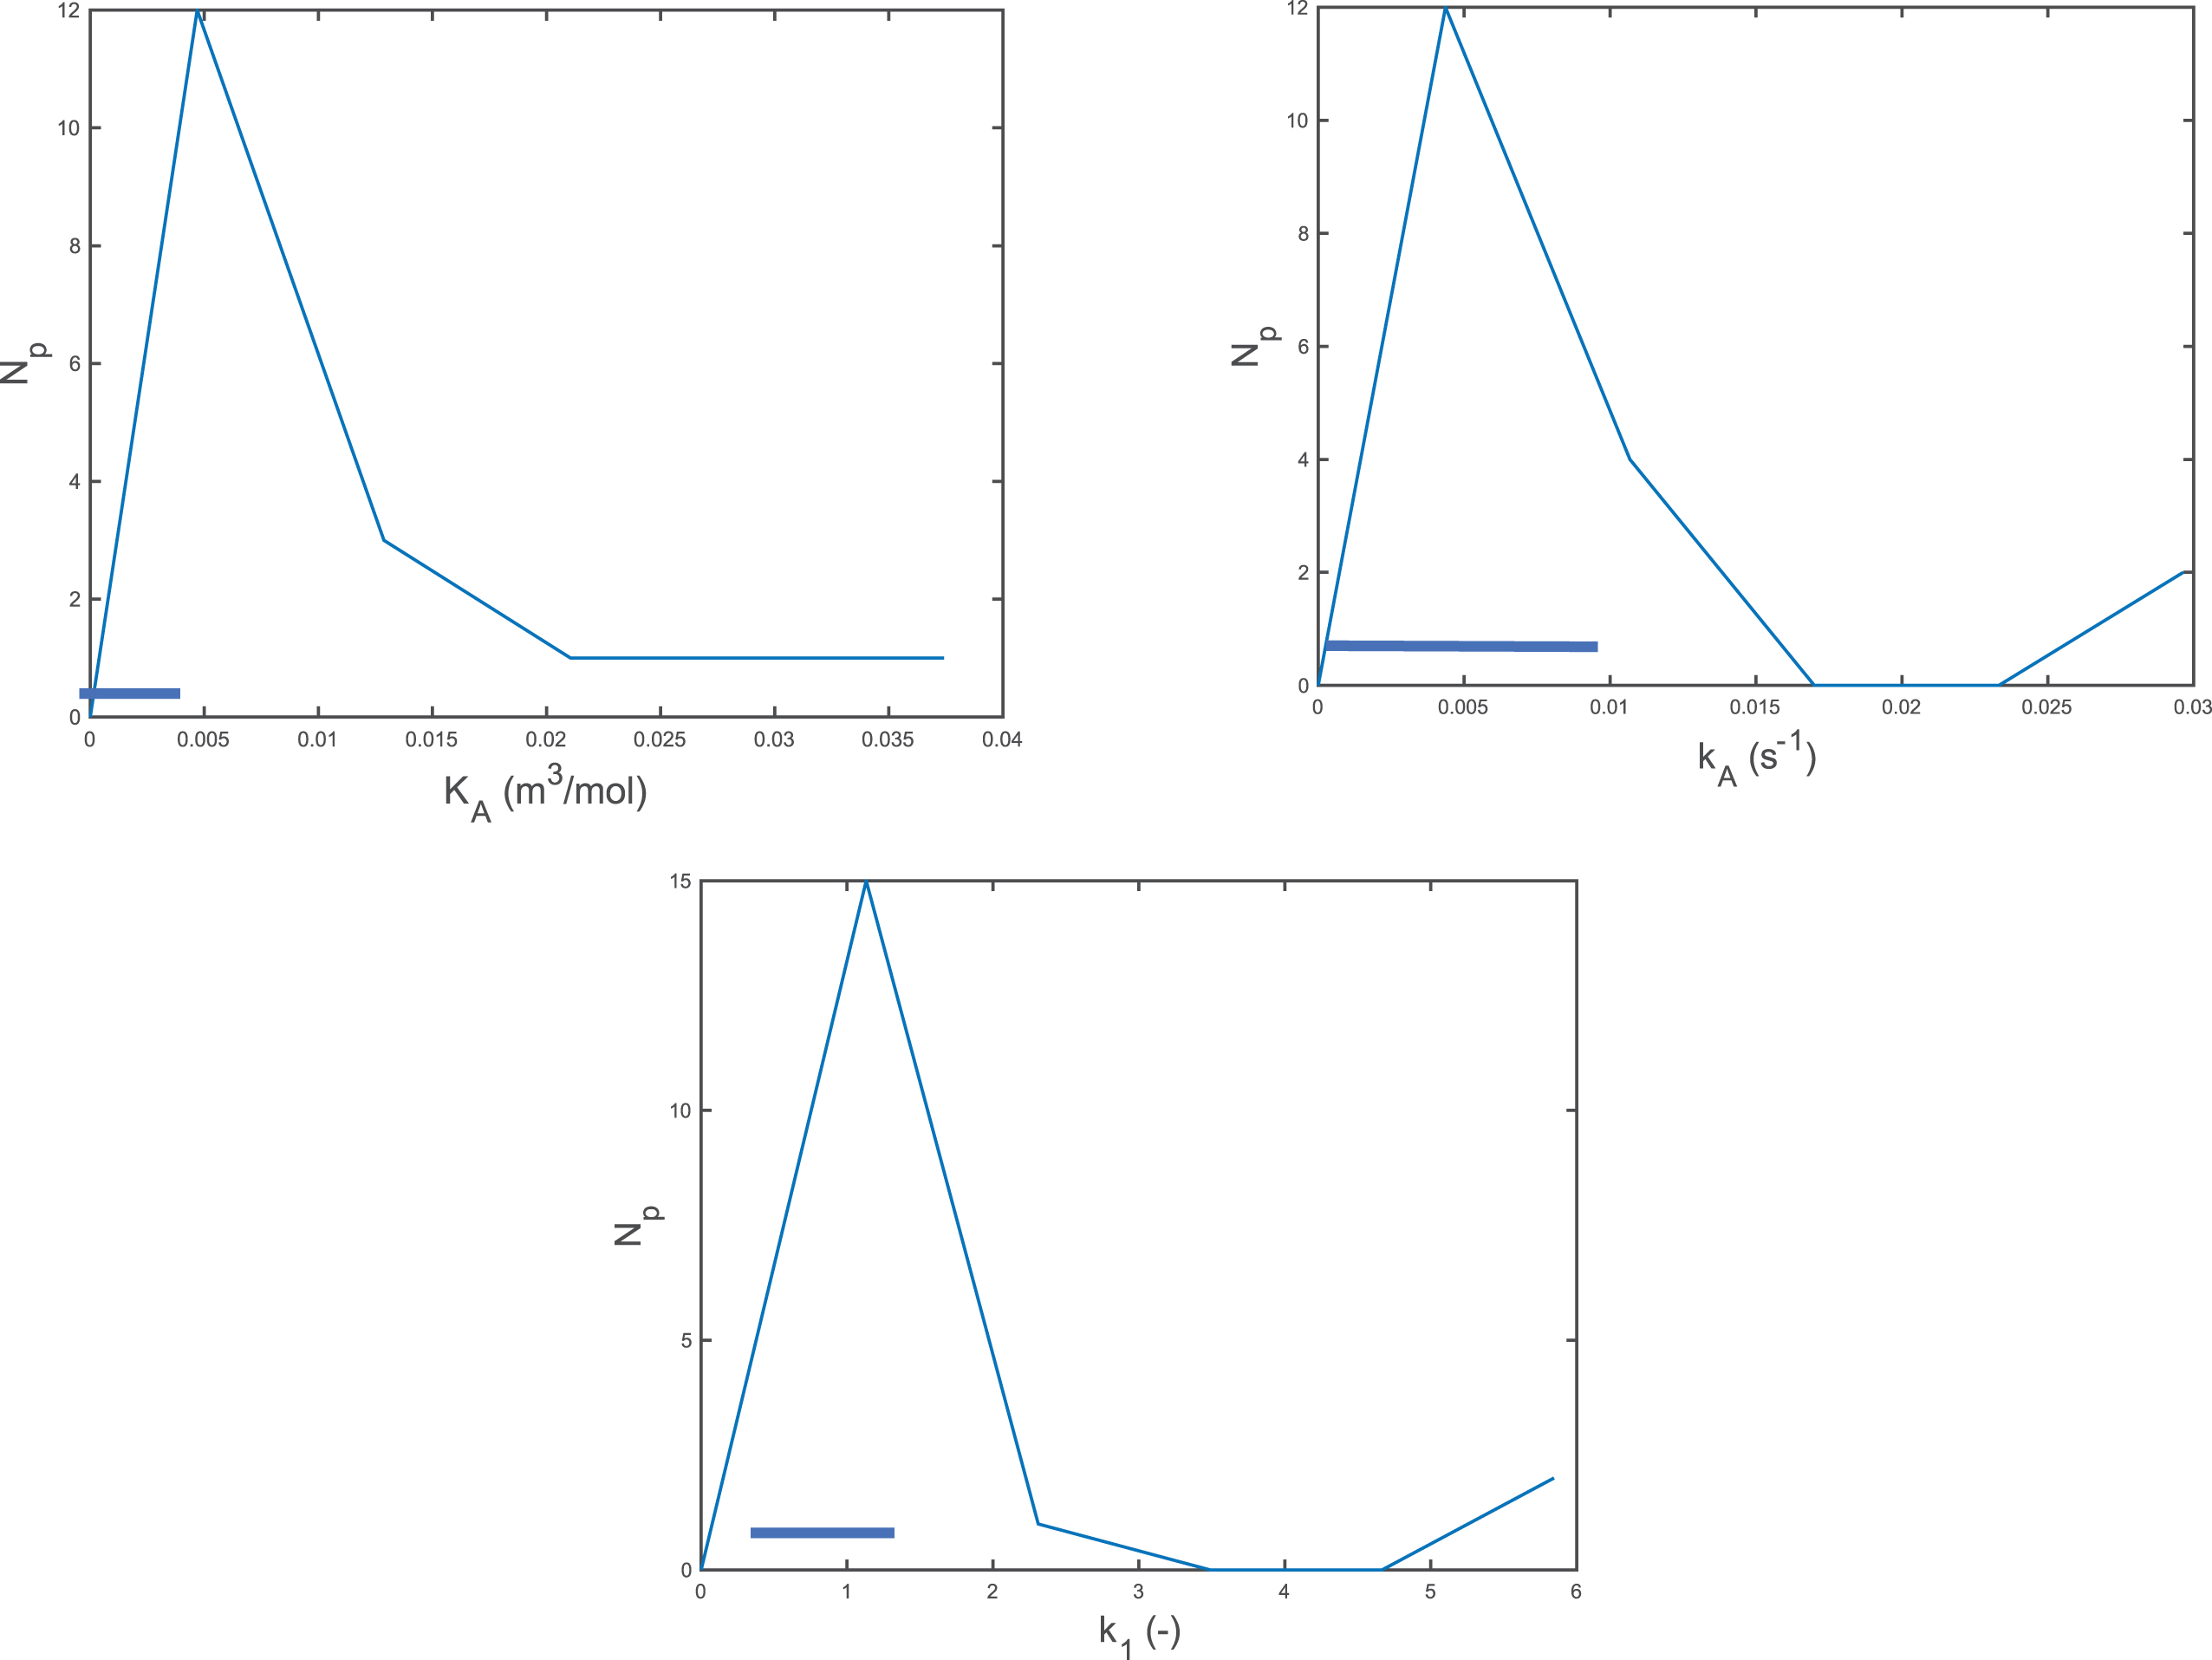
Figure 9 shows the same trends as Fig. 6 with the pro-inflammatory cytokine source term decreasing as the cell source term increases for females and no differentiation between surviving and deceased patients.
Fig. 9
Cytokine source terms, SA and SB, relative to cell source term, Sc. Black dots indicate deceased patients and grey dots represent survivors.
Overall, the parameter values are of the correct order and comparable with other values found in the literature [58].
4.2Model outputs
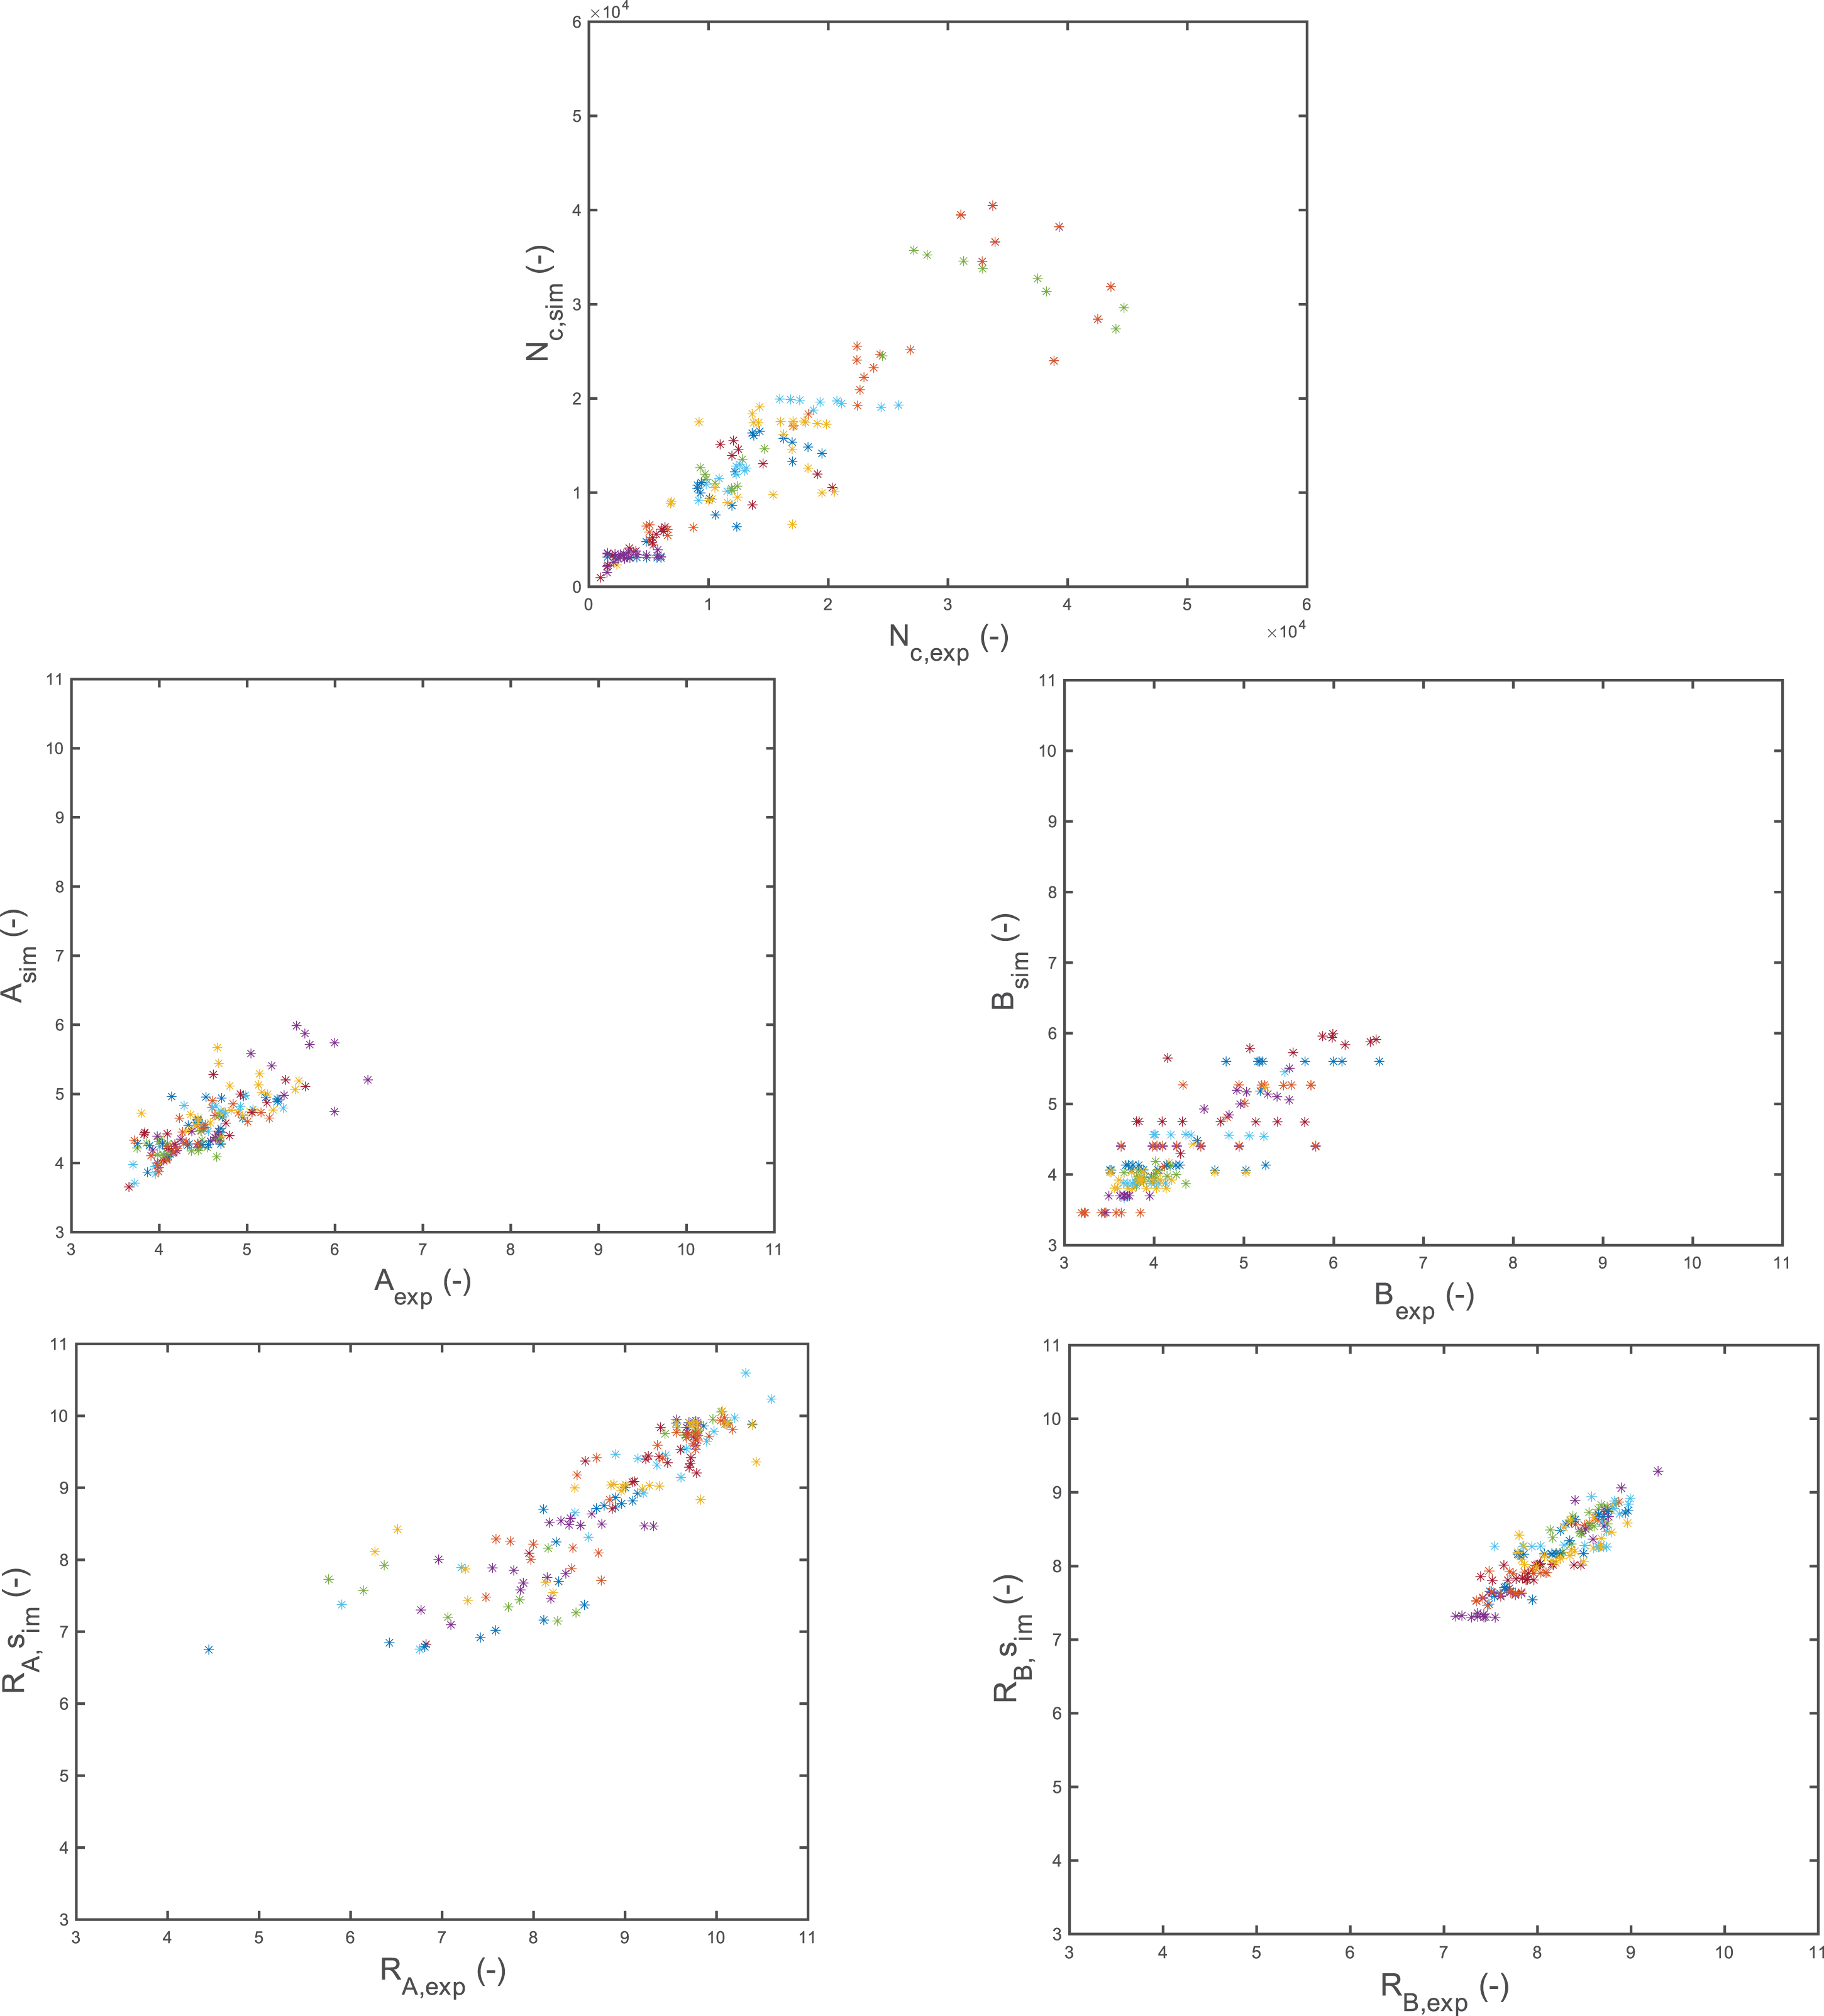
The parity plots in Fig. 10 compare the simulation results directly against the experimental training data described in Section 2: the number of white blood cells (leukocytes), cytokines IL18 and IL10 (A and B) and their receptors. Simulations were performed with the final set of parameters and source terms (from the estimation of 5 parameters for each patient). Cytokine quantities are represented as fluorescence in all the Figures in this section. The parity plots show a good correlation between the calculated and measured data with a Pearsons correlation coefficient of 0.906 for the white blood cells and as follows for the cytokines: 0.715 for IL18, 0.818 for IL10, 0.855 for IL18 receptors and 0.874 for IL10 receptors. The critical value of Pearson’s correlation coefficient above which R indicates a statistically significant correlation is 0.159 at the 95% confidence level for 150 degrees of freedom.
Fig. 10
Parity plots for calculated Nc, A, B, RA, RB fluorescence against measured data (each color corresponds to one patient). Pearsons correlation coefficient values are 0.906 for Nc, 0.715 for A, 0.818 for B, 0.855 for RA and 0.874 for RB.
For the four patients (1 woman and 3 men), Figs. 11–15 give the calculated and measured values of pro-inflammatory cytokine, A, pro-inflammatory cytokine receptor, RA, anti-inflammatory cytokine, B, anti-inflammatory cytokine receptor, RB and cell number respectively for all blood samples.
Fig. 11
Calculated and measured pro-inflammatory cytokine A fluoresence versus time, markers indicate measured data, simulation results are shown as lines.
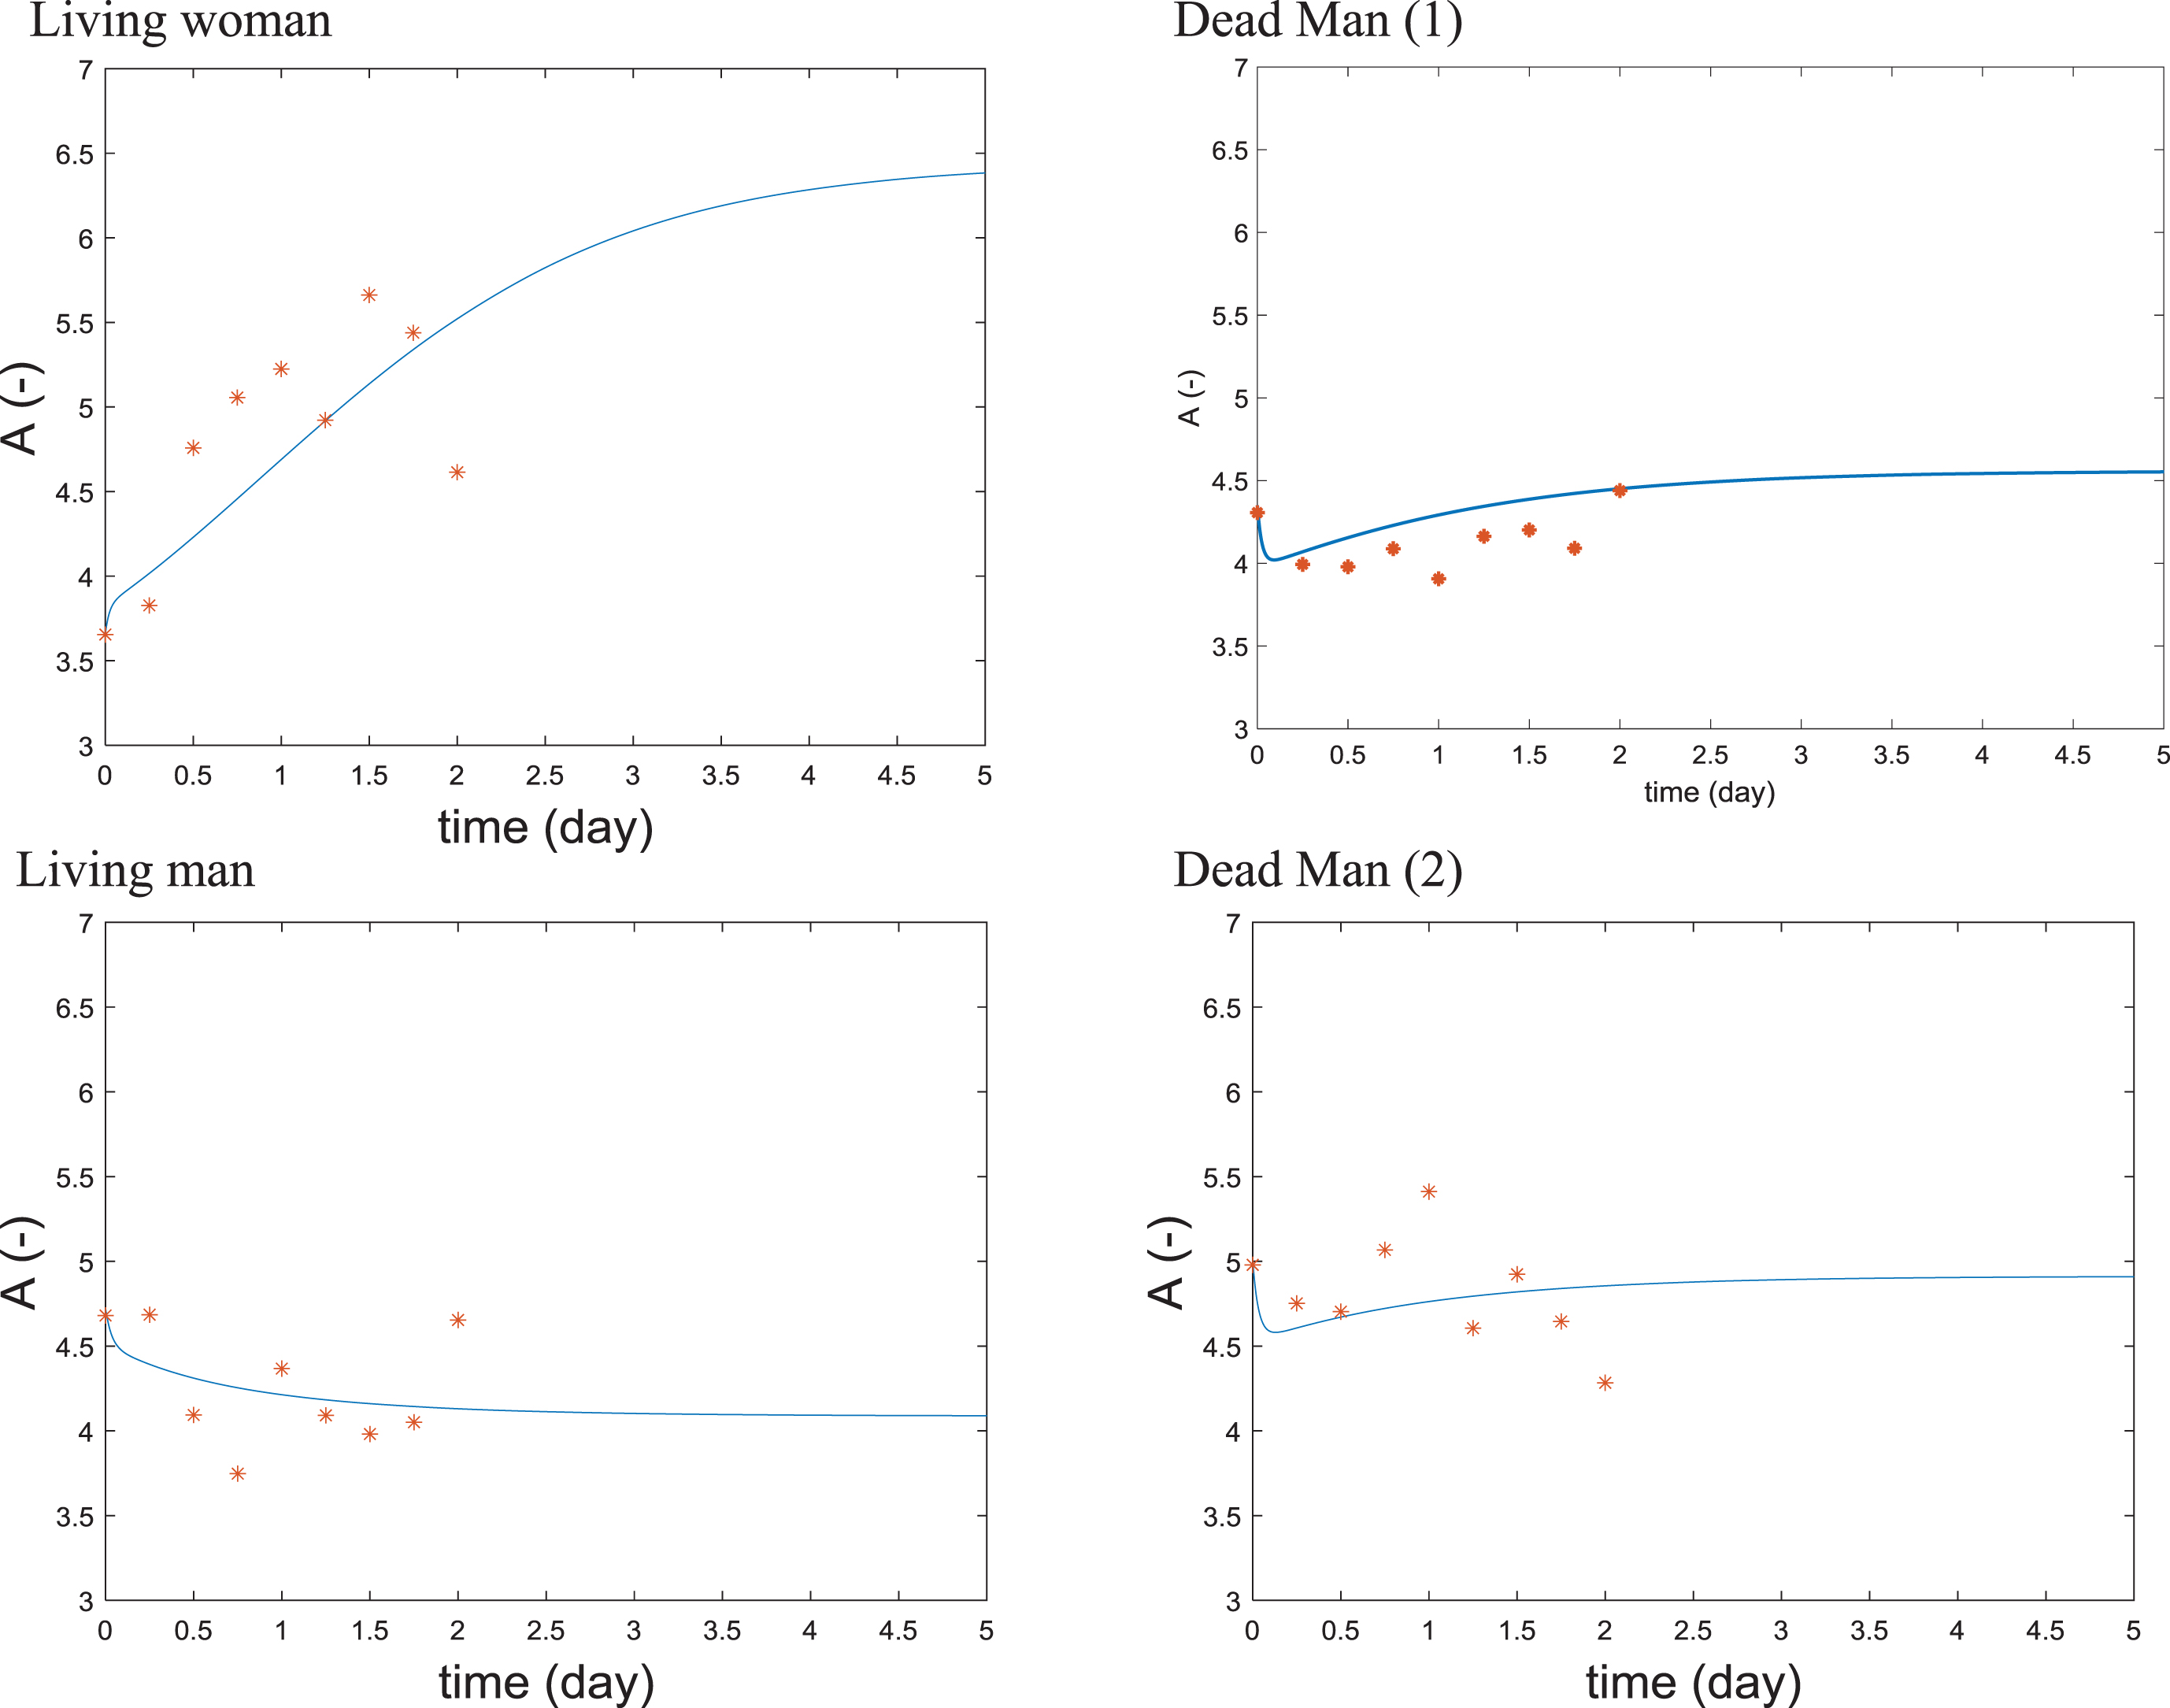
Fig. 12
Calculated and measured recepetor of pro-inflammatory cytokine RA fluoresence versus time, markers indicate measured data, simulation results are shown as lines.
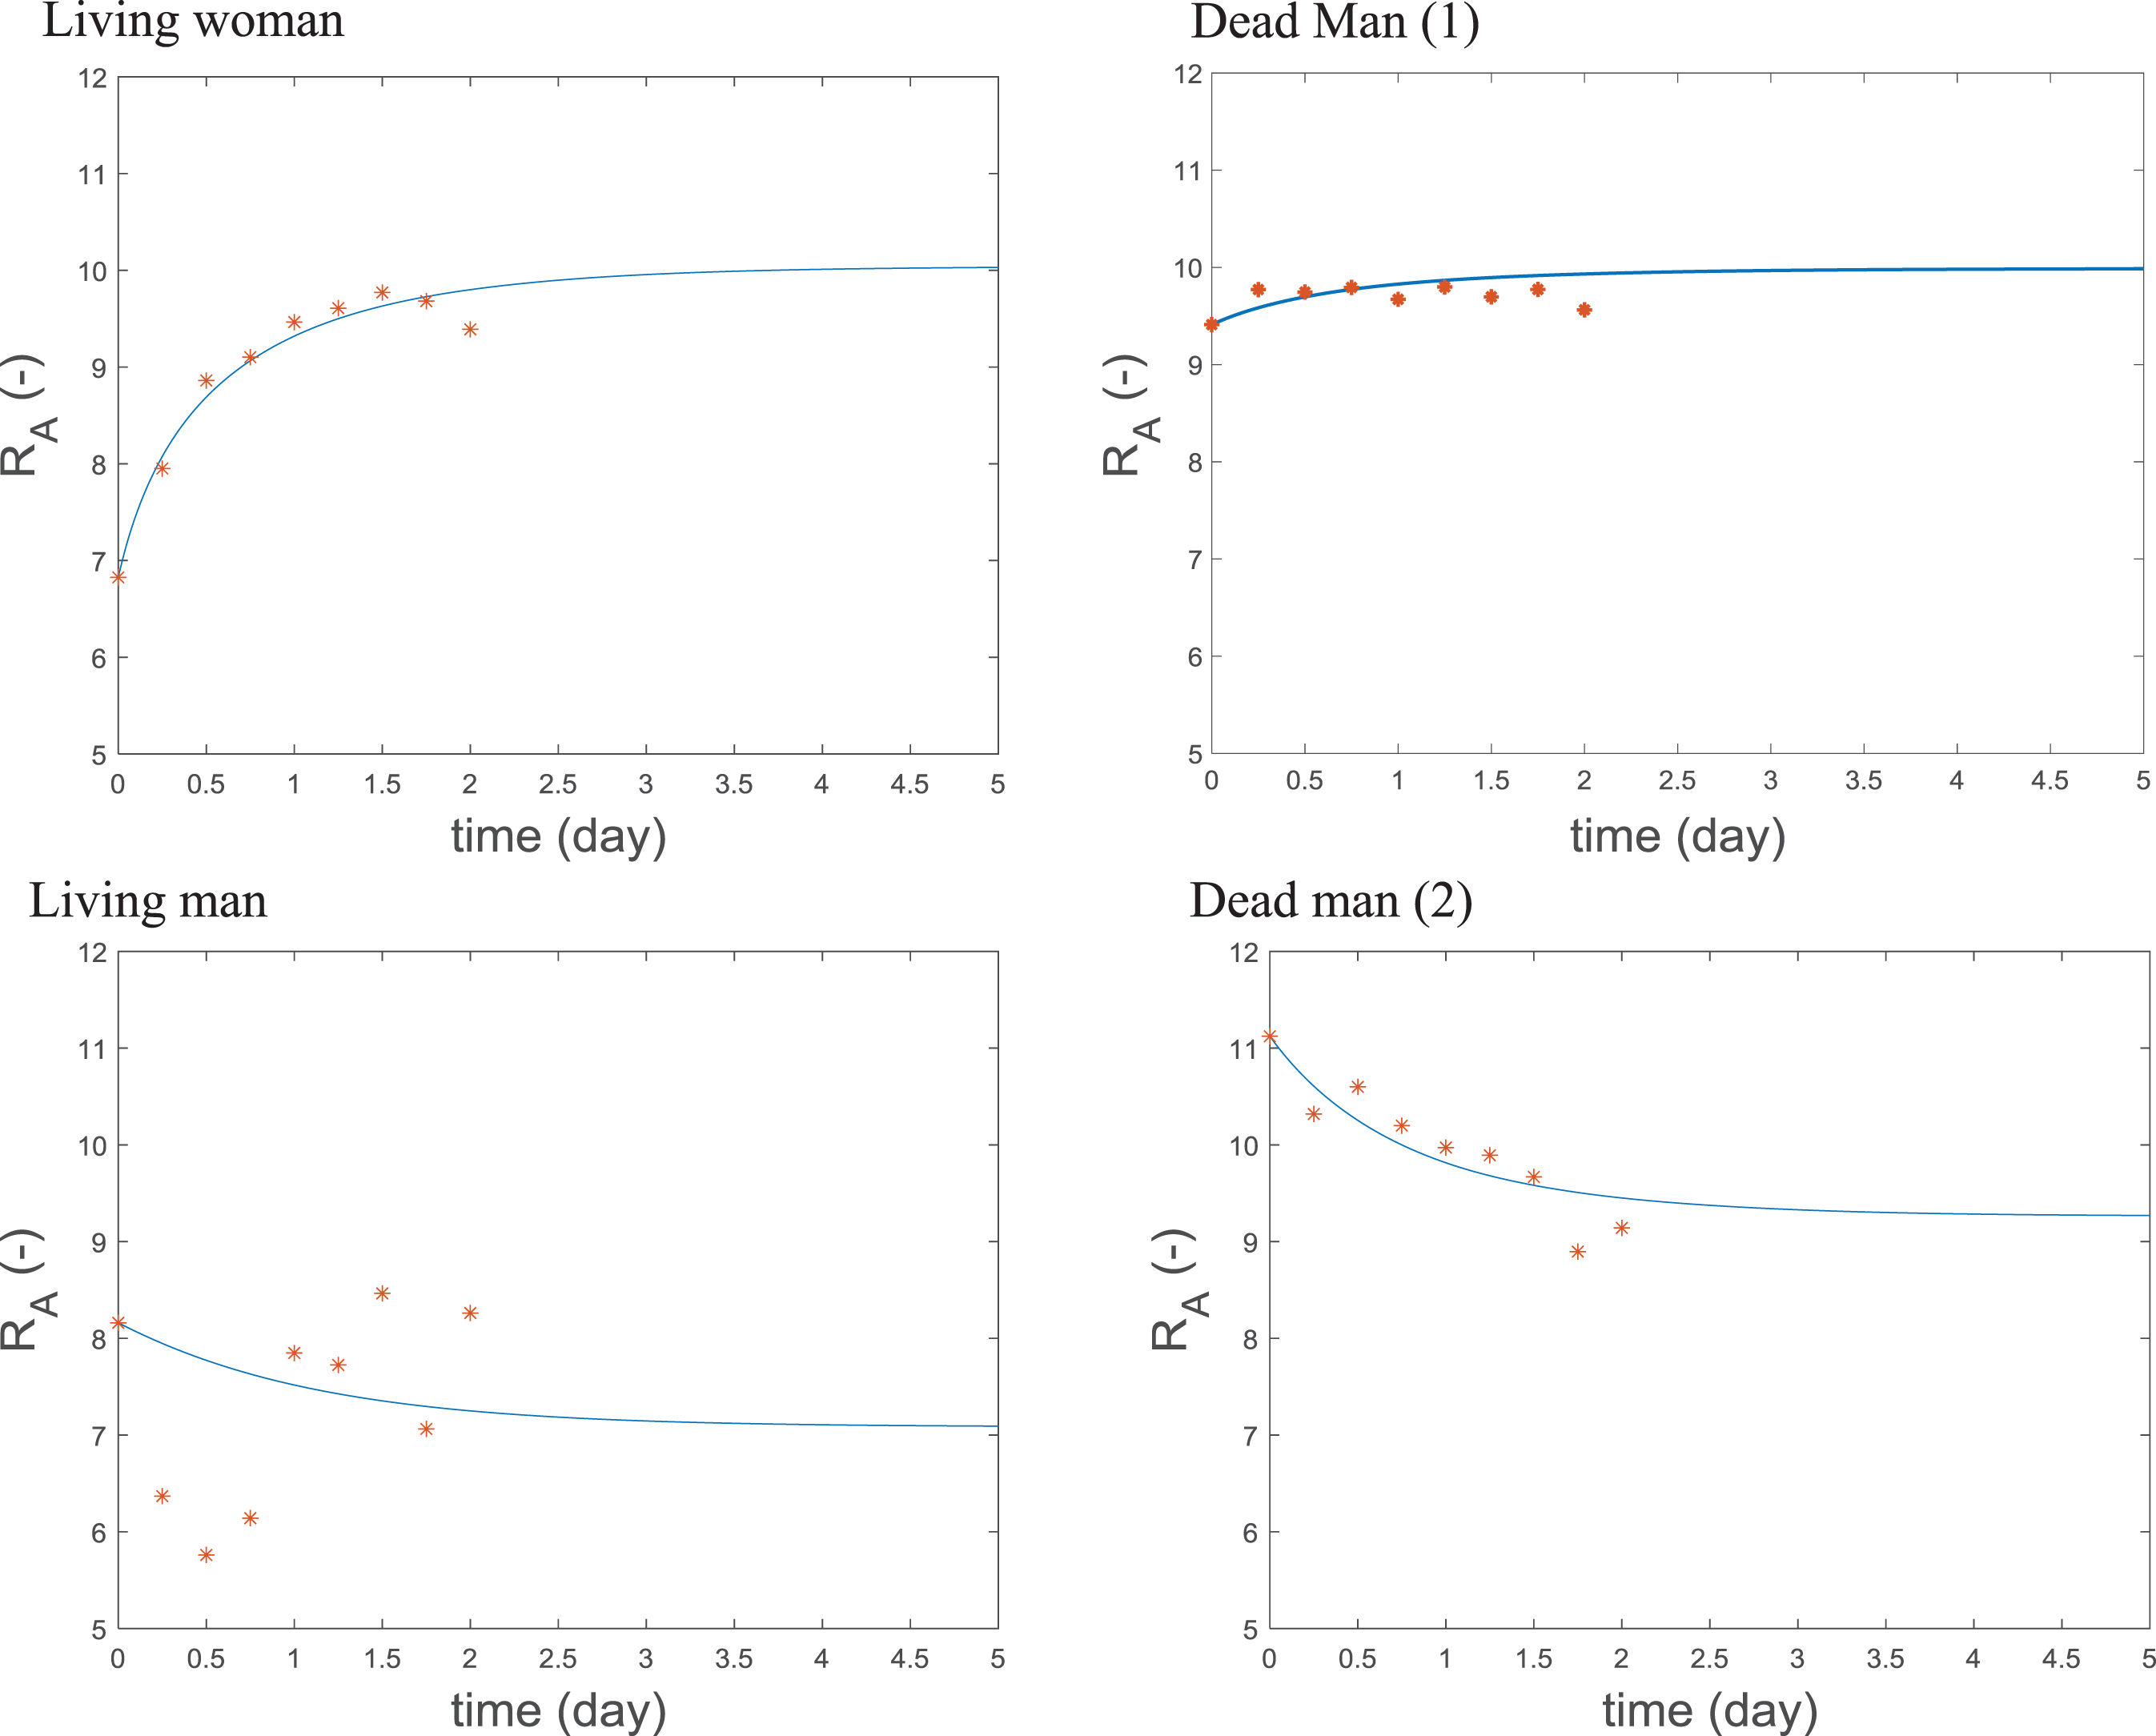
Fig. 13
Calculated and measured anti-inflammatory cytokine B fluoresence versus time, markers indicate measured data, simulation results are shown as lines.
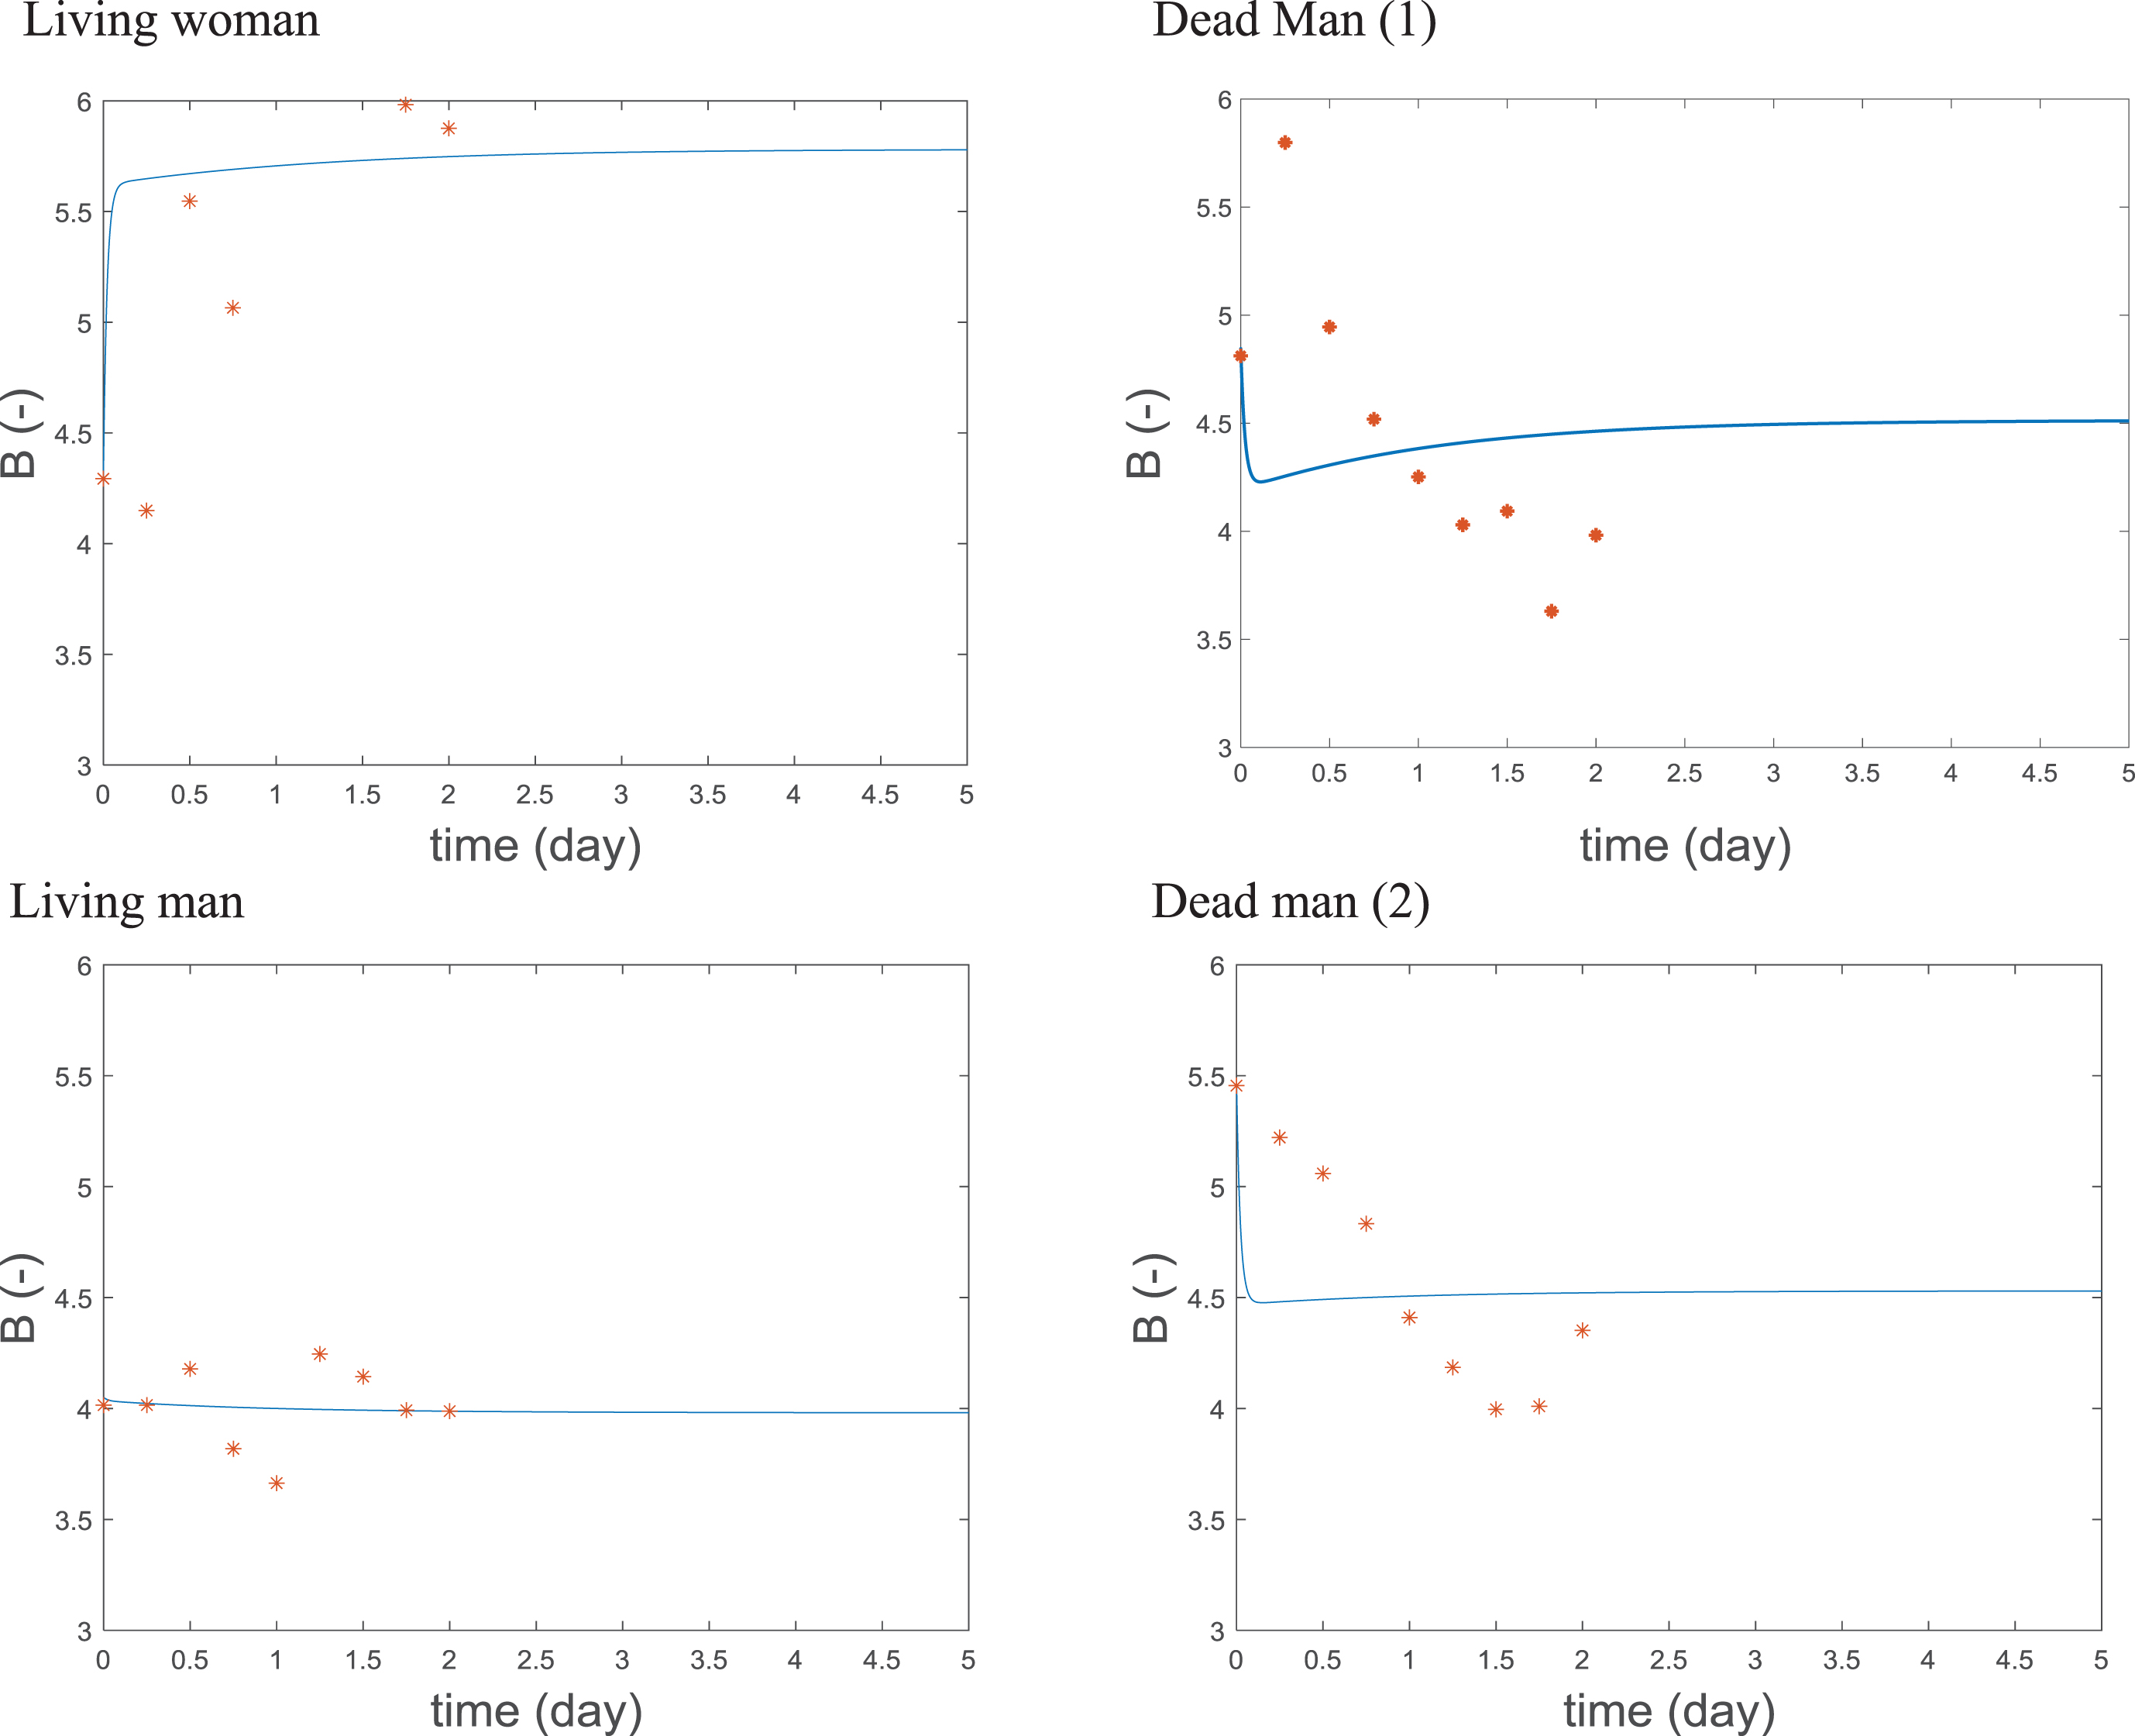
Fig. 14
Calculated and measured receptor of anti-inflammatory cytokine RB fluoresence versus time, markers indicate measured data, simulation results are shown as lines.
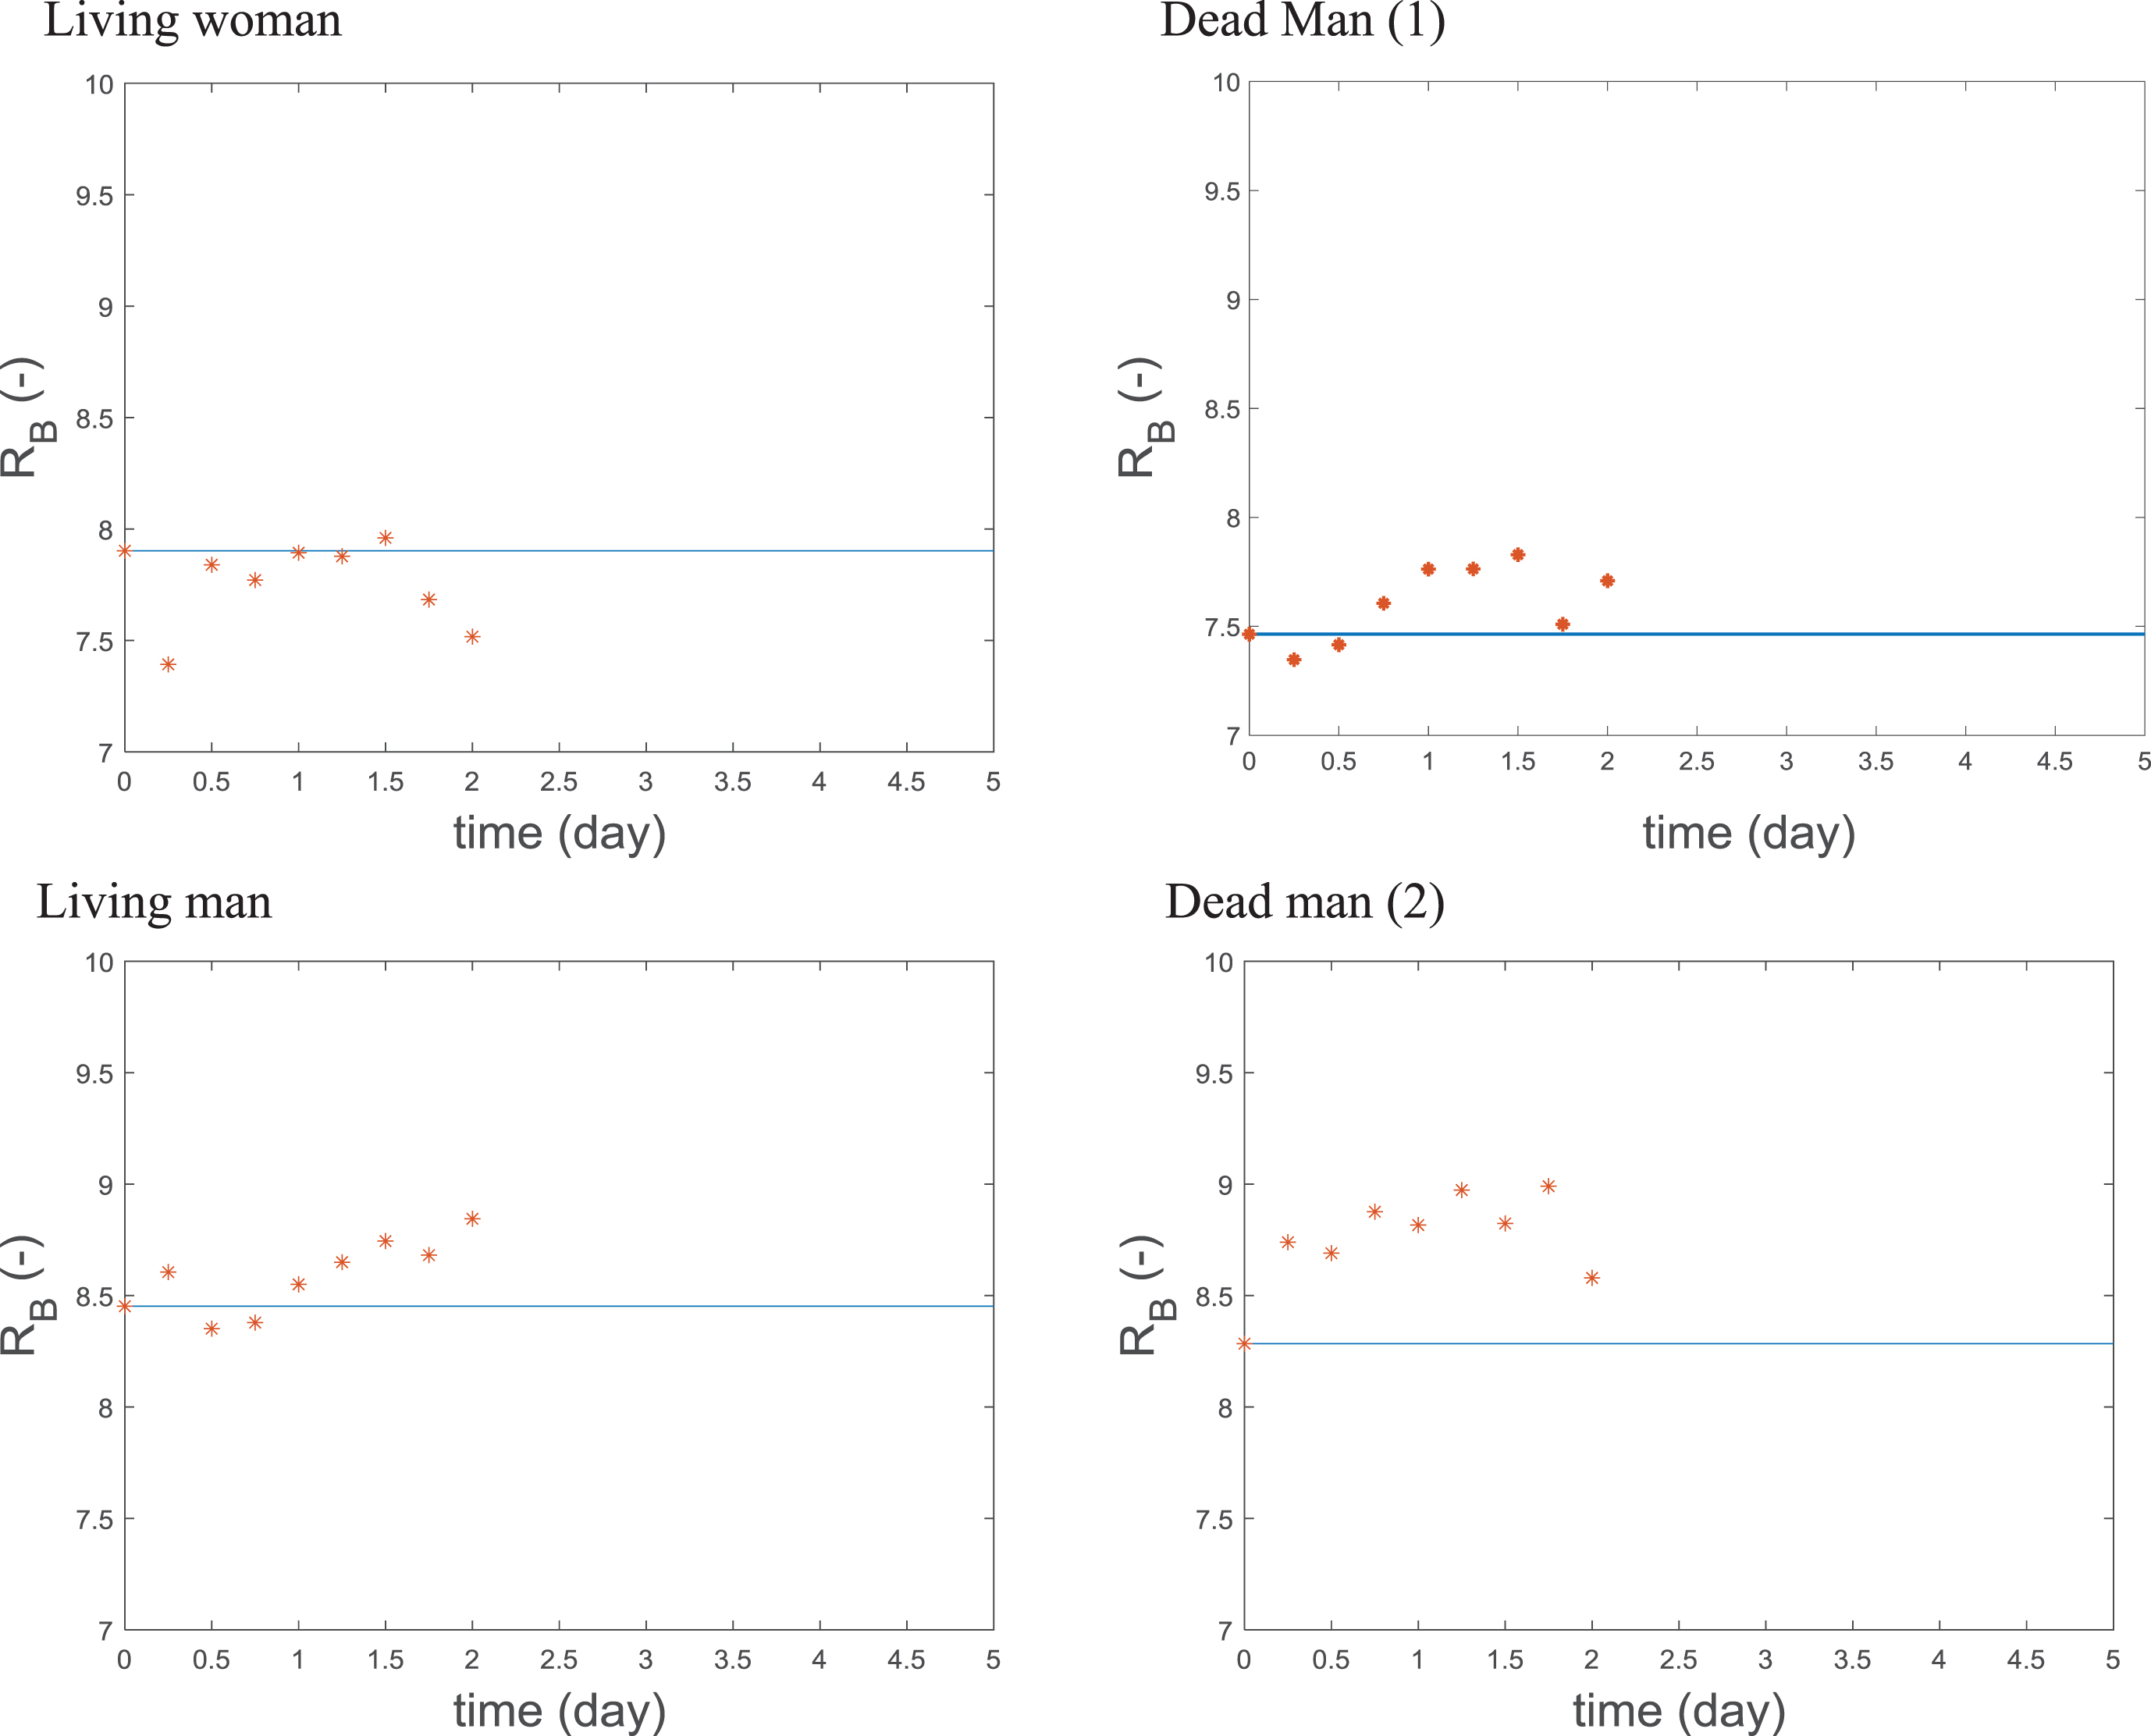
Fig. 15
Calculated and measured cell number Nc versus time, markers indicate measured data, simulation results are shown as lines.
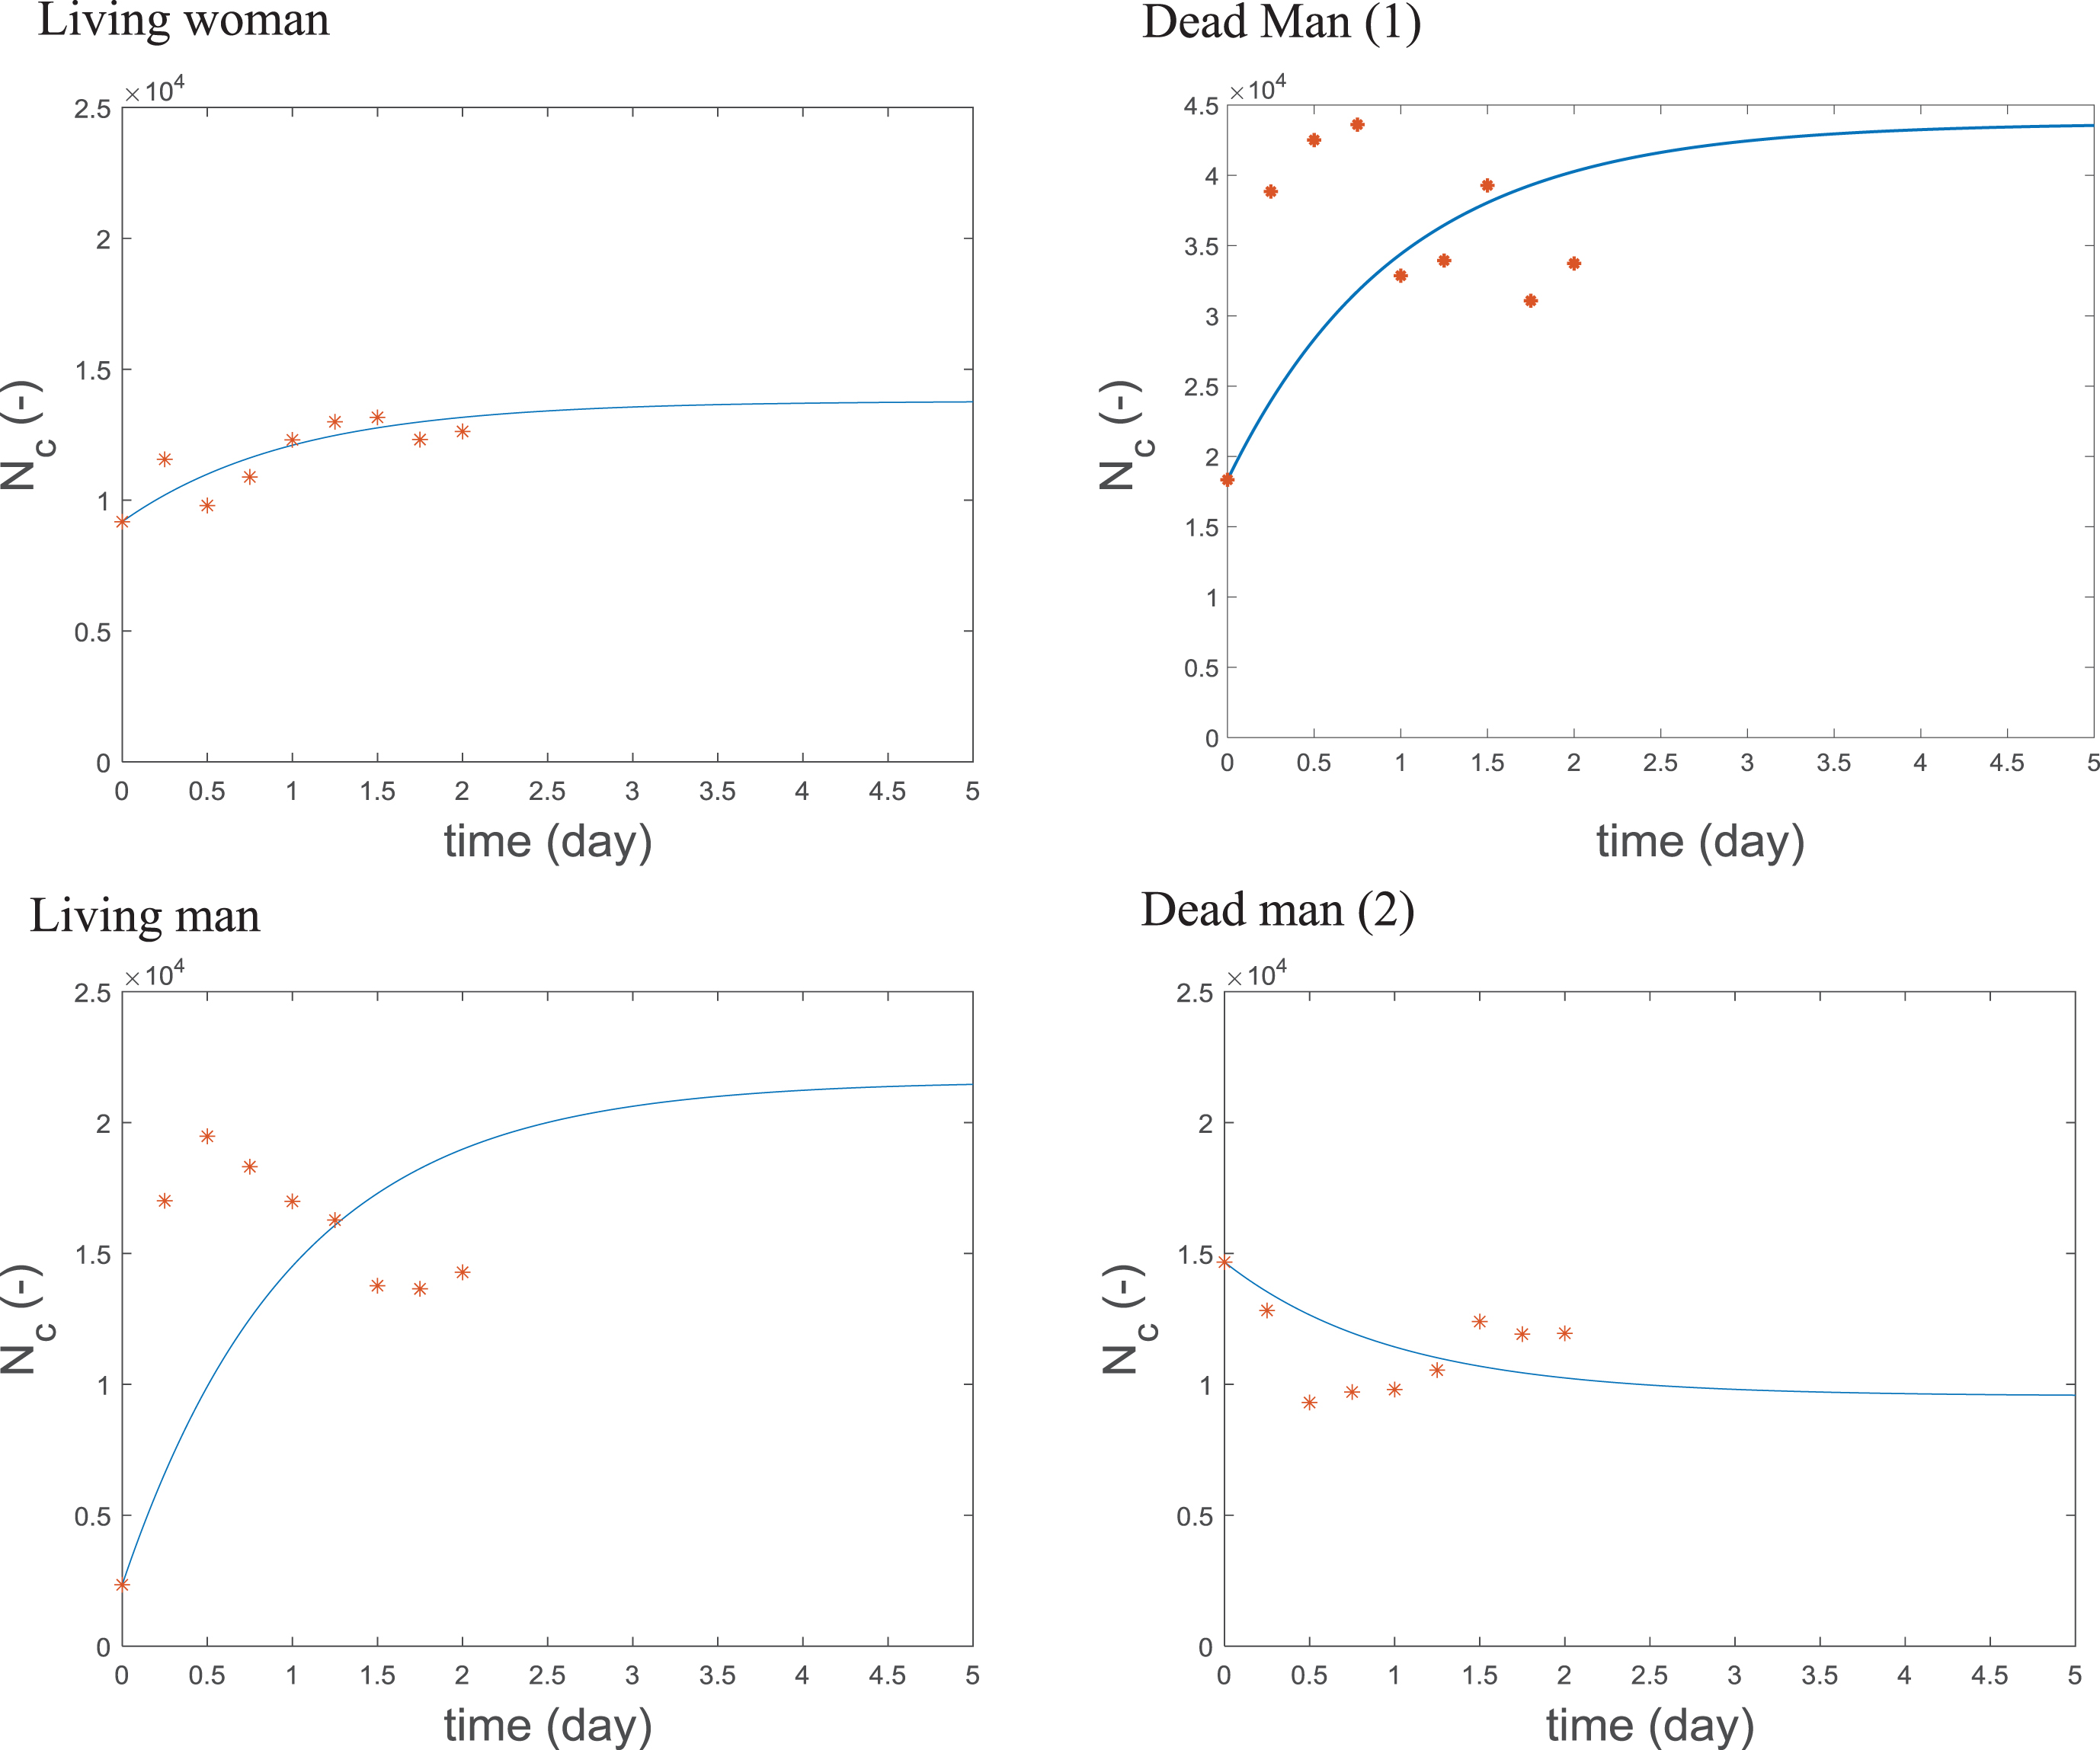
Figure 11 compares the measured and calculated values of fluorescence for IL18, the pro-inflammatory cytokine. In each case, the calculated values follow the trend of the data. However, there is no common trend between the four cases shown. The profile of the curve relating to the woman shows increasing quantities of IL18 which would be expected at the start of sepsis [8], whereas the curves for the men have much less of a gradient. One drawback with the data is that the first measurement is based on the moment the patient arrived in the hospital and not the actual onset of sepsis. So the initial condition for the model is at an unknown time during the sepsis response. Another is that although the treatment is standardized the cause of sepsis is not controlled. Figure 12 shows the results for the pro-inflammatory cytokine receptor. In all cases, except that of the surviving man, the model represents the data well, suggesting that the method of determining receptor concentration from the quantity of cytokine at the cell membrane is a useful one. Figure 13 compares the measured and calculated values of fluorescence for IL10, the anti-inflammatory cytokine. As mentioned earlier, the model was not very sensitive to the parameters for the anti-inflammatory cytokine and here we observe that, despite apparent trends in the data, the model did not pick up this dynamic but rapidly adjusted to a value close to the mean. Figure 14 compares the measured and calculated values of the anti-inflammatory cytokine receptor fluorescence and, here, the receptor of anti-inflammatory cytokine RB does not vary much experimentally and the calculated values were constant. This low variation observed experimentally is almost definitely the reason behind the low-sensitivity of the associated parameters (KB, kB, kBA). Also, the number of data points is quite limited and the timing of the data collection, in the first 48 h of sepsis, is during a period of strong inflammation. This could partially explain why the model was more sensitive to parameters relating to the pro-inflammatory cytokine, IL18, and why the calculated fluorescence for IL18 and its receptor fit the measured data better than those for IL10. Furthermore, in their work to model the response of 9 cytokines to TGN1412 infusion, Yiu et al. [8] demonstrated that IL10 concentrations have a small but rapid response to IFN-γ stimulus and, in their model of cytokine dynamics during a cytokine storm in mice, Waito et al. [27] showed that IL10 concentrations depend on at least six pro-inflammatory cytokines. So, as more data becomes available and more cytokines are included in the reaction network, calculation of the anti-inflammatory response should improve.
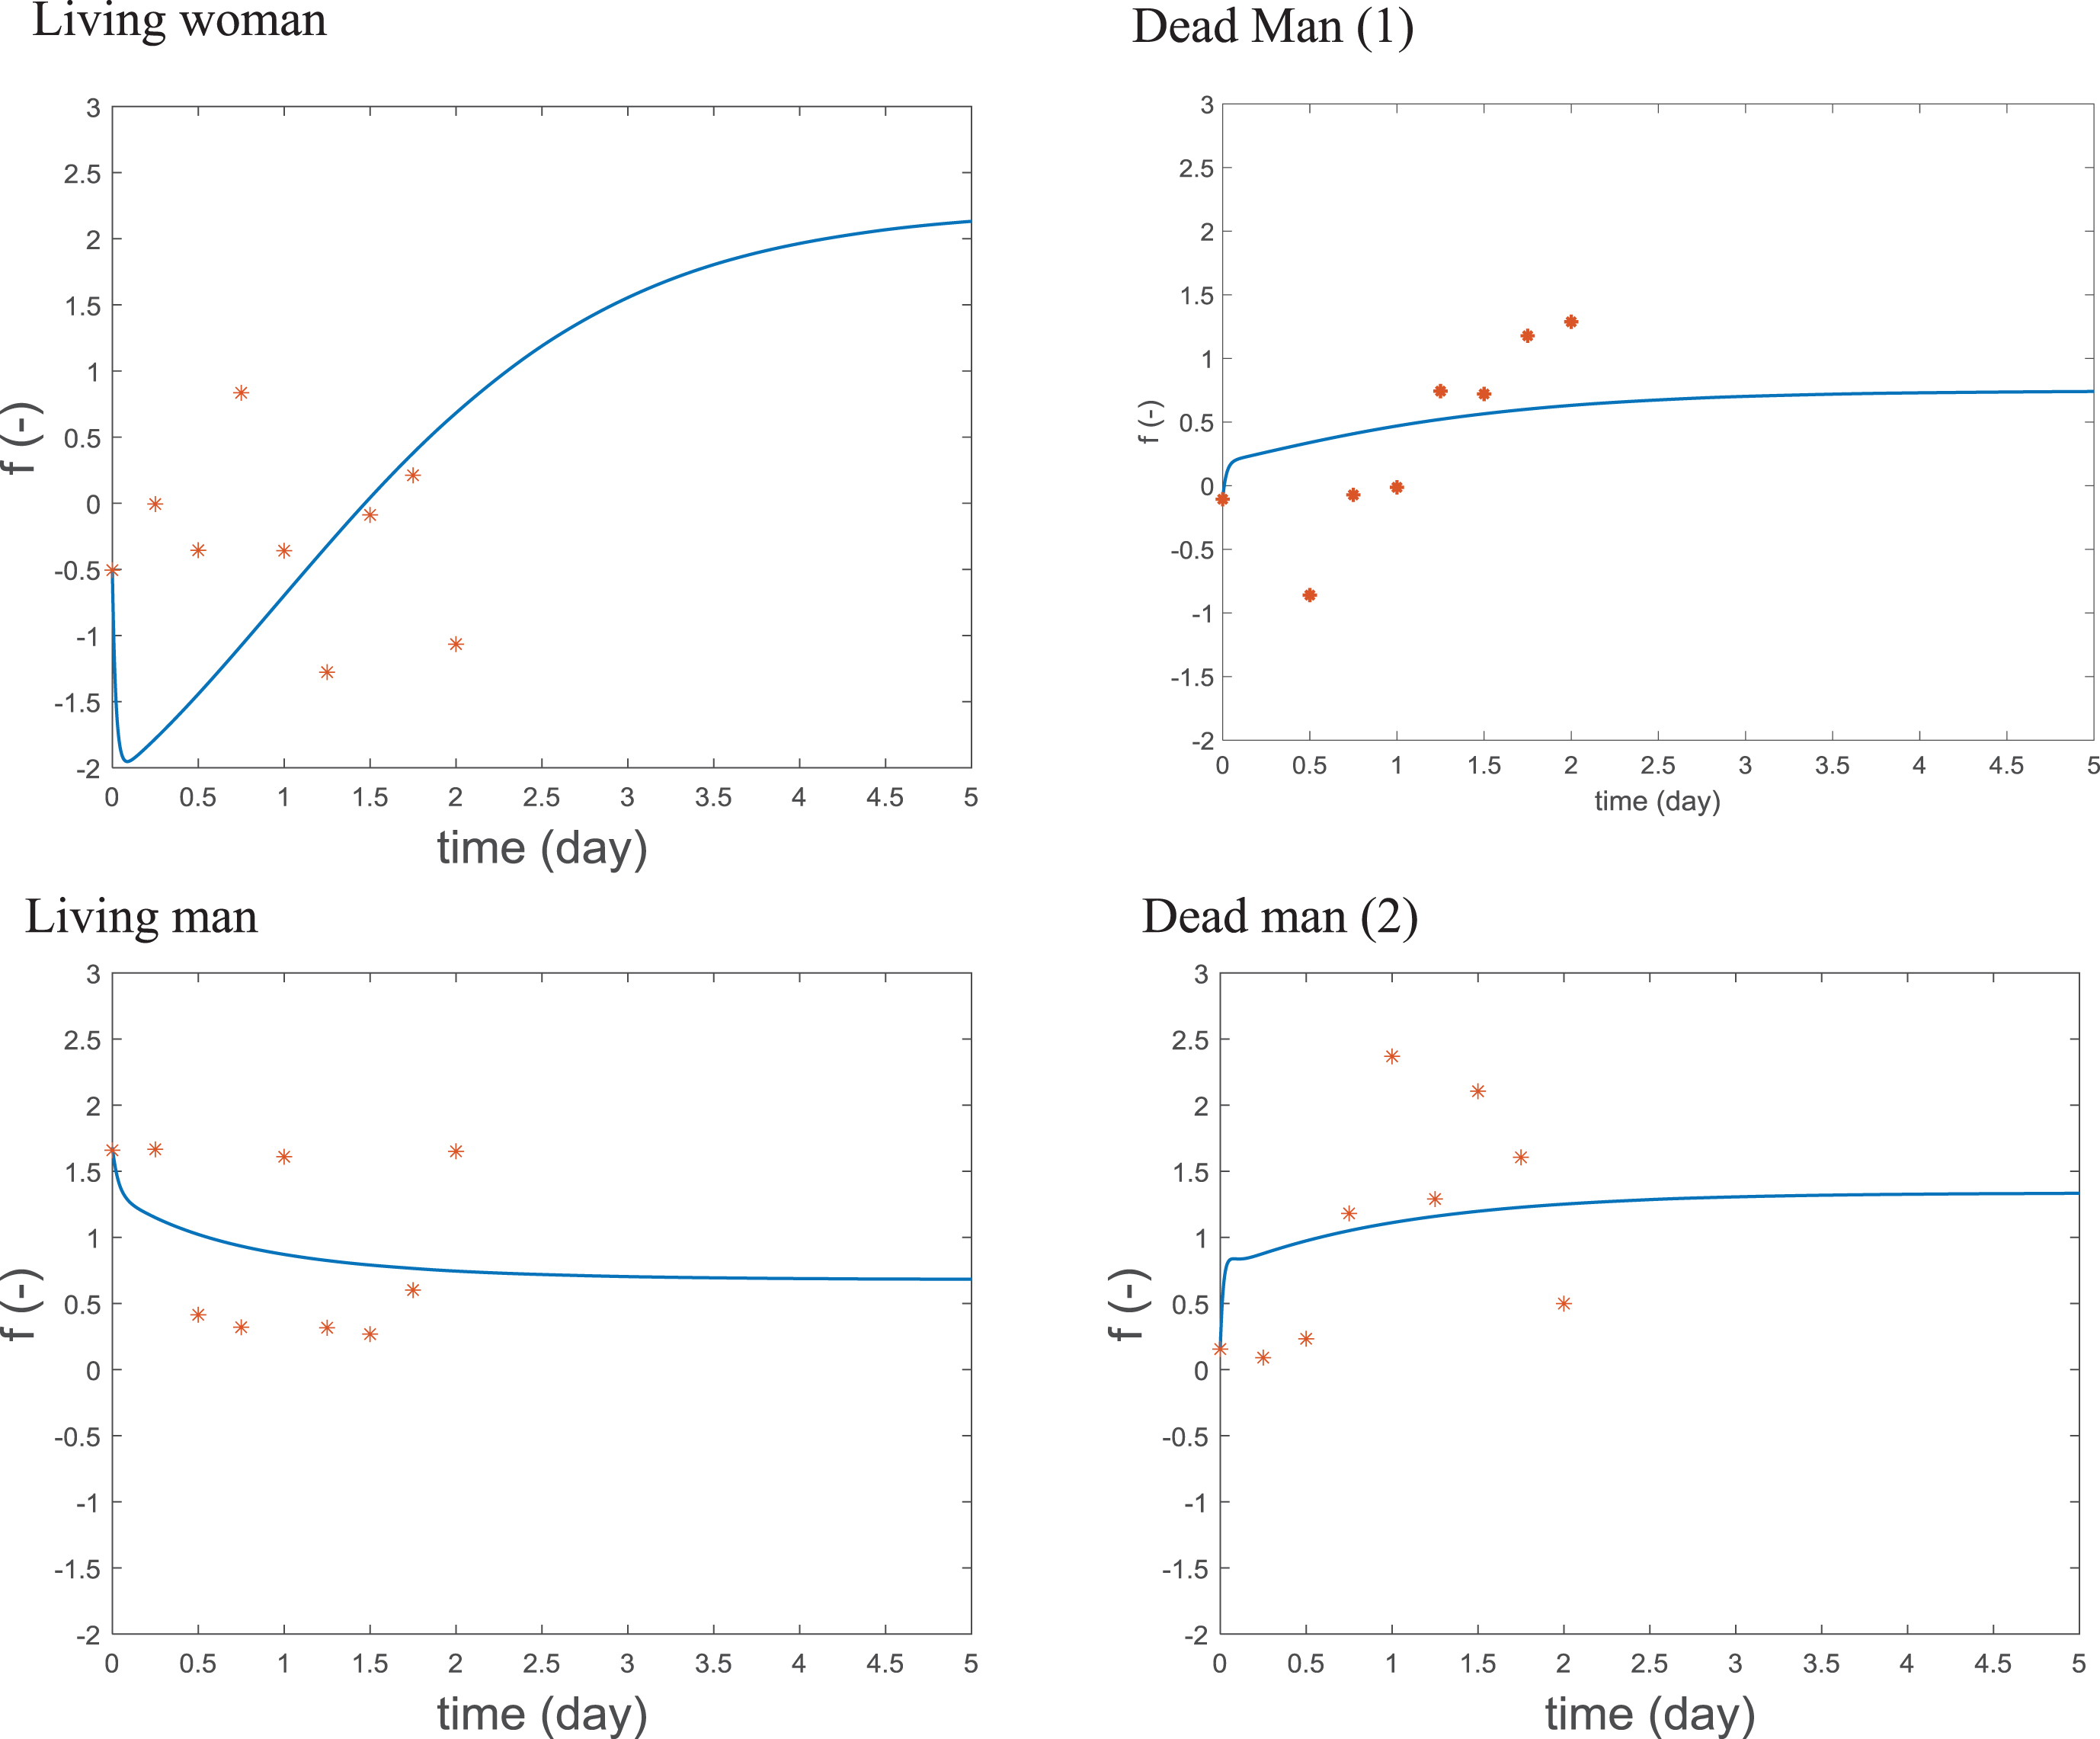
Figure 15 shows that the model gives a good prediction of the variation of the number of leukocyte cells, particularly for the woman in this case. This depends on the parameters: kd, which fixes the cell lifetime, Sc, which determines the quantity of leukocytes entering the blood volume and f, the inflammation function. Figure 16 shows the calculated and measured inflammation level function f versus time for the four patients. This inflammation level doesn’t provide any general information about the inflammatory state of the patient but only describes the amounts of A (pro-inflammatory cytokine IL18) and B (anti-inflammatory cytokine IL10) cytokine pair. The experimental data is dispersed making its interpretation difficult. The simulation showed increasing inflammation in all cases except for the surviving man and a greater increase in the inflammatory level of the women relative to the men. In fact, the curve for the woman is highly reminiscent of those used by Hotchkiss et al. [3] to describe the host inflammatory response in their competing theories of the host immune response in sepsis, with a rapid initial increase in inflammation over the first two days which then plateaus before decreasing.
Fig. 16
calculated and measured inflammation level function f versus time, markers indicate measured data, simulation results are shown as lines.
5Conclusion
A dynamical model describing the physico-chemical phenomena involved in homeostasis and sepsis, has been proposed in Tallon et al. [56]. This dynamical model of the blood system considers interactions between cells and cytokines, with its surroundings (organs, bone marrow) and introduces the inflammatory level impact on homeostasis via the function f. Data for the cytokine pair IL18 and IL10 from the sepsis 48 H data base has been chosen to validate this model. Since the model contains 21 parameters, 10 parameters (kinetic constants and source terms) have been fixed and the others have been estimated in three stages. All estimated kinetic constant values are distributed with respect to the number of patients. Finally, the more sensitive parameters are those related to pro-inflammatory cytokines and cells. By the parity diagram, the model shows a good agreement between the experimental and simulated data. At the beginning of sepsis, the simulated patient response seems to be driven by the inflammatory actors. The estimated adsorption coefficient of the pro-inflammatory cytokine, IL18, on its associated receptor, IL18 R, is consistently below the mean value of its distribution and, is particularly low in the non-surviving patients, hinting that this could be a key aspect in the dysregulation of the immune system in sepsis and would be interesting to study with a larger data set. This work has permitted us to confront a preliminary model, based on chemical reaction engineering principles, against a set of data taken from real patients during the first 48 h of sepsis. The use of mass balances means the model is quantifiable and the future perspective of this work is to scale from a single pair to a network of cytokines.
Nomenclature
| A, B (molm-3) | Concentration in the blood of cyt. A, B resp. | Ac, Bc (molm-3) | Concentration in the cell of cyt. A, B resp. |
| Aads, Bads (molm-3) | Concentration of adsorbed cyt. A, B resp. | Aint, Bint (molm-3) | Concentration at the interface of cyt. A, B resp. |
| f (molm-3) | the inflammation level function | ||
|
| Production kinetic constant of cyt. A, B in the cell from adsorbed cyt. A, B resp. | KA, KB (m3mol-1) | Langmuir coefficients |
| kBA
| Production kinetic constant of cyt. B in the cell from adsorbed cyt. A |
| Mass transfer coefficient between blood and cell for cyt. A, B resp. |
|
| death constants of cyt. A, and of cells resp. |
| mass transfer coefficient between blood and interface for cyt. A, B resp. |
| kRA, kRB
| Production kinetic constant of rec. A from adsorbed cyt. A, of rec. B from adsorbed cyt. B resp. | Production kinetic constant of rec. B from adsorbed cyt. A | |
|
| Production kinetic constant of rec. B from adsorbed cyt. A | kc
| Adjustment parameter |
| k1, k2 (m3) | Proportion of rec. A, B resp. produced or destroyed induced by the variation of the cell number | ||
| Nc (m-3ofblood) | number of cells in the blood | RA, RB (molm-3) | Concentration on the cell of rec. A, B resp. |
| SA, SB (molmin-1) | source terms of cytokine A, B respectively |
| source terms of cells from the bone marrow |
| Vc(m3) | volume of cells | Vl (m3) | volume of the blood |
| α (-) | Ratio A/B for healthy patient | V1c(m3) | volume of one cell |
References
[1] | Singer M. , Deutschman C.S. , Seymour C.W. , Shankar-Hari M. , Annane D. , Bauer M. , Bellomo R. , Bernard G.R. , Chiche J.-D. , Coopersmith C.M. , Hotchkiss R.S. , Levy M.M. , Marshall J.C. , Martin G.S. , Opal S.M. , Rubenfeld G.D. , van der Poll T. , Vincent J.-L. and Angus D.C. , The Third International Consensus Definitions for Sepsis and Septic Shock (Sepsis-3), JAMA 315: (8) ((2016) ), 801. |
[2] | Delano M.J. and Ward P.A. , The immune system’s role in sepsis progression, resolution, and long-term outcome, Immunological Reviews 274: (1) ((2016) ), 330–353. |
[3] | Hotchkiss R.S. , Monneret G. and Payen D. , Sepsis-induced immunosuppression from cellular dysfunctions to immunotherapy, Nature Rev. Immunol. 13: ((2013) ), 862–874. |
[4] | Sakr Y. , Jaschinski U. , Wittebole X. , Szakmany T. , Lipman J. , Ñamendys-Silva S.A. , Martin-Loeches I. , Leone M. , Lupu M.-N. , Vincent J.-L. , and ICON Investigators, Sepsis in Intensive Care Unit Patients: Worldwide Data From the Intensive Care over Nations Audit, Open Forum Infectious Diseases 5: (12) ((2018) ). |
[5] | Reinhart K. , Daniels R. , Kissoon N. , Machado F.R. , Schachter R.D. and Finfer S. , Recognizing Sepsis as a Global Health Priority — A WHO Resolution, New England Journal of Medicine 377: (5) ((2017) ), 414–417. |
[6] | Calvano S.E. , Xiao W. , Richards D.R. , Felciano R.M. , Baker H.V. , Cho R.J. , Chen R.O. , Brownstein B.H. , Cobb J.P. , Tschoeke S.K. , Miller-Graziano C. , Moldawer L.L. , Mindrinos M.N. , Davis R.W. , Tompkins R.G. and Lowry S.F. , and Inflammation and Host Response to Injury Large Scale Collaborative Research Program, A network-based analysis of systemic inflammation in humans, Nature 437: (7061) ((2005) ), 1032–1037. |
[7] | Cazalis M.-A. , Lepape A. , Venet F. , Frager F. , Mougin B. , Vallin H. , Paye M. , Pachot A. and Monneret G. , Early and dynamic changes in gene expression in septic shock patients: a genome-wide approach, Intensive Care Med Exp. 2: ((2014) ), 20. |
[8] | Yiu H.H. , Graham A.L. and Stengel R.F. , Dynamics of a cytokine storm, PLoS ONE 7: ((2012) ), e45027. |
[9] | Rao R.T. , Scherholz M.L. , Hartmanshenn C. , Bae S.-A. and Androulakis I.P. , On the analysis of complex biological supply chains: From Process Systems Engineering to Quantitative Systems Pharmacology, Comput Chem Eng. 107: ((2017) ), 100–110. |
[10] | Foteinou P.T. , Yang E. and Androulakis I.P. , Networks, biology and systems engineering: a case study in inflammation, Comput Chem Eng. 33: ((2009) ), 2028–2041. |
[11] | Aris R. , Mathematicalmodeling: a chemical engineer’s perspective, Academic Press, San Diego, (1999) . |
[12] | Levenspiel O. , Chemical reaction engineering, Wiley India, New Delhi, (2007) . |
[13] | Kumar R. , Clermont G. , Vodovotz Y. and Chow C.C. , The dynamics of acute inflammation, J. Theor. Biol. 230: ((2004) ), 145–155. |
[14] | Reynolds A. , Rubin J. , Clermont G. , Day J. , Vodovotz Y. and Bard Ermentrout G. , A reduced mathematical model of the acute inflammatory response: I. Derivation of model and analysis of anti-inflammation, J. Theor. Biol. 242: ((2006) ), 220–236. |
[15] | Day J. , Rubin J. , Vodovotz Y. , Chow C.C. , Reynolds A. and Clermont G. , A reduced mathematical model of the acute inflammatory response II. Capturing scenarios of repeated endotoxin administration, J. Theor. Biol. 242: ((2006) ), 237–256. |
[16] | Scheff J.D. , Calvano S.E. , Lowry S.F. and Androulakis I.P. , Modeling the influence of circadian rhythms on the acute inflammatory response, J. Theor. Biol. 264: ((2010) ), 1068–1076. |
[17] | Shi Z. , Wu C.-H.J. , Ben-Arieh D. and Simpson S.Q. , Mathematical Model of Innate and Adaptive Immunity of Sepsis: A Modeling and Simulation Study of Infectious Disease, Biomed Res Int. 2015: ((2015) ), 504259. |
[18] | Klett H. , Rodriguez-Fernandez M. , Dineen S. , Leon L.R. , Timmer J. and Doyle F.J. , Modeling the inflammatory response in the hypothalamus ensuing heat stroke: iterative cycle of model calibration, identifiability analysis, experimental design and data collection, Math Biosci. 260: ((2015) ), 35–46. |
[19] | Malek H. , Ebadzadeh M.M. , Safabakhsh R. , Razavi A. and Zaringhalam J. , Dynamics of the HPA axis and inflammatory cytokines: Insights from mathematical modeling, Comput. Biol. Med. 67: ((2015) ), 1–12. |
[20] | Wang X. , Yu W. and Zheng L. , The dynamics of NF-κB pathway regulated by circadian clock, Math Biosci. 260: ((2015) ), 47–53. |
[21] | Malkin A.D. , Sheehan R.P. , Mathew S. , Federspiel W.J. , Redl H. and Clermont G. , A Neutrophil Phenotype Model for Extracorporeal Treatment of Sepsis, PLoS Comput. Biol. 11: ((2015) ), e1004314. |
[22] | Ma W. , Trusina A. , El-Samad H. , Lim W.A. and Tang C. , Defining network topologies that can achieve biochemical adaptation, Cell 138: ((2009) ), 760–773. |
[23] | Clermont G. , Rubin J. and Day J. , Using nonlinear model predictive control to find optimal therapeutic strategies to modulate inflammation, Mathematical Biosciences and Engineering 7: ((2010) ), 739–763. |
[24] | Androulakis I.P. , Mavroudis P.D. , Corbett S.A. and Calvano S.E. , Circadian characteristics of permissive and suppressive effects of cortisol and their role in homeostasis and the acute inflammatory response, Mathematical Biosciences 260: ((2015) ), 54–64. |
[25] | Vodovotz Y. , Xia A. , Read E.L. , Bassaganya-Riera J. , Hafler D.A. , Sontag E. , Wang J. , Tsang J.S. , Day J.D. , Kleinstein S.H. , Butte A.J. , Altman M.C. , Hammond R. and Sealfon S.C. , Solving Immunology?, Trends Immunol. 38: ((2017) ), 116–127. |
[26] | Zhao G. , Gueyffier F. , Monneret G. , Chen F. and Li F. , Mathematical modeling of septic shock: an innovative tool for assessing therapeutic hypotheses, SN Applied Sciences 1: ((2019) ), 717. |
[27] | Waito M. , Walsh S.R. , Rasiuk A. , Bridle B.W. and Willms A. , A mathematical model of cutokine dynamics during a cytokine storm, Mathematical and Computational Approches in Advancing Modern Science and Engineering, Springer International Publishing, Switzerland, 2016. |
[28] | Clermont G. , Bartels J. , Kumar R. , Constantine G. , Vodovotz Y. and Chow C. , In silico design of clinical trials: a method coming of age, Crit. Care Med. 32: ((2004) ), 2061–2070. |
[29] | Foteinou P.T. , Calvano S.E. , Lowry S.F. and Androulakis I.P. , Modeling endotoxin-induced systemic inflammation using an indirect response approach, Math Biosci. 217: ((2009) ), 27–42. |
[30] | Bara O. , Djouadi S.M. , Day J.D. and Lenhart S. , Immune therapeutic strategies using optimal controls with L1 and L2 type objectives, Math Biosci. 290: ((2017) ), 9–21. |
[31] | Venet F. , Davin F. , Guignant C. , Larue A. , Cazalis M.A. , Darbon R. , Allombert C. , Mougin B. , Malcus C. , Poitevin-Later F. , Lepape A. and Monneret G. , Early assessment of leukocyte alterations at diagnosis of septic shock, Shock 34: (4) ((2010) ), 358–63. |
[32] | Yang Q. , Berthiaume F. and Androulakis I.P. , A quantitative model of thermal injury-induced acute inflammation, Math Biosci. 229: ((2011) ), 135–148. |
[33] | Genecards®: The Human Gene Database, https://www.genecards.org, consulted on 19/12/2019. |
[34] | Cai G. , Kastelein R.A. and Hunter C.A. , IL-10 enhances NK proliferation, cytotoxicity and production of IFN-γ when combined with IL-18, Eur. J. Immunol. 29: ((1999) ), 2658–2665. |
[35] | Grobmeyer S. , Lin E. , Lowry S.F. , Rivadeneira D.E. , Potter S. , Barie P.S. and Nathan C.F. , Elevation of IL-18 in Human sepsis, J. Clin. Immunol. 20: (3) ((2000) ), 212–215. |
[36] | Mommsen P. , Frink M. , Pape H.C. , van Griensven M. , Probst C. , Gaulke P. , Krettek C. and Hildebranb F. , Elevated systemic IL-18 and neopterin levels are associated with posttraumatic complications among patients wit hmultiple injuries: a prospective cohort study, Injury 40: (5) ((2009) ), 528–534. |
[37] | Fan S.-L. , Miller N.S. , Lee J. and Remick D.G. , Diagnosing sepsis- The role of laboratory medecine, Clin. Chim. Acta 460: ((2016) ), 203–210. |
[38] | Lanziotti V.S. , Povoa P. , Soares M. , Silva J.R. , Barbosa A.P. and Salluh J.I. , Use of biomarkers in pediatric sepsis: literature review, Rev. Bras. Ter. Intensiva 28: (4) ((2016) ), 472–482. |
[39] | Dekker A.-B.E. , Krihnen P. and Schipper I.B. , Predictive value of cytokines for developing complications after polytrauma, World J. Crit. Care Med. 5: (3) ((2016) ), 187–200. |
[40] | Vanden Berge T. and Hoste E. , Paving the way for precision medecin v2.0 in intensive care by profiling necroinflammation in biofluids, Cell Death Differ 26: ((2019) ), 83–98. |
[41] | Chaudhry H. , Zhou J. , Zhong Y. , Ali M.M. , McGuire F. , Nagarkatti P.S. and Nagarkatti M. , Role of cytokines as a double-edged sword in sepsis, In Vivo 27: ((2013) ), 669–684. |
[42] | Wawroki S. , Druszczynska M. , Kowalewicz-Kulbat M. and Rudnica W. , Interleukin 18 (IL-18) as a target for immune intervention, Acta Biochimica Polonica 63: (1) ((2016) ), 59–63. |
[43] | Danielski L.G. , Giustina A.D. , Bonfante S. , Barichello T. and Petronilho F. , The NLRP3 Inlfammasome and its role in sepsis, Inflammation (2019), doi: 10.1007/s10753-019-01124-9. [Epub ahead of print] |
[44] | Eidt M.V. , Nunes F.B. , Pedrazza L. , Caeran G. , Pellegrin G. , Melo D.A.S. , Possuelo L. , Jost R.T. , Dias H.B. , Donadio M.V.F. and Oliveira J.R. , Biochemical and inflammatory aspects in patients with severe sepsis and septic shock: The predictive role of IL-18 in mortality, Clin. Chim. Acta 453: ((2016) ), 100–106. |
[45] | Mierzchala-Pasierb M. , Krzystek-Korpacka M. , Lesnik P. , Adamik B. , Placzkowska S. , Serek P. , Gamian A. and Lipinska-Gediga M. , Interleukin-18 serum levels in sepsis: Correlation with disease severity and inflammatory markers, Cytokine 120: ((2019) ), 22–27. |
[46] | Ogata H. , Goto S. , Sato K. , Fujibuchi W. , Bono H. and Kanehisa M. , KEGG: Kyoto Encyclopedia of Genes and Genomes, Nucleic Acids Res. 27: ((1999) ), 29–34. |
[47] | Lee J.H. , Cho D.H. and Park H.J. , IL-18 and cutaneous inflammatory diseases, Int. J. Mol. Sci. 16: (12) ((2015) ), 29357–29369. |
[48] | Smith D.E. , The biological paths of IL-1 family members IL-18 and IL-33, J. Leuko. Biol. 89: ((2011) ), 383–392. |
[49] | Saraiva M. , Vieira P. and O’Garra A. , Biology and therapeutic potential of interleukin-10, J. Exp. Med. (2019), doi:10.1084/jem.20190418 |
[50] | Kleiner G. , Marcuzzi A. , Zanin V. , Monasta L. and Zauli G. , Cytokine Levels in the Serum of Healthy Subjects, Mediators of Inflammation 2013: ((2013) ), 1–6. |
[51] | Sekiyama K.D. , Yoshiba M. and Thomson A.W. , Circulating proinflammatory cytokines (IL-1 beta, TNF-alpha, and IL-6) and IL-1 receptor antagonist (IL-1Ra) in fulminant hepatic failure and acute hepatitis, Clin. Exp. Immunol. 98: ((1994) ), 71–77. |
[52] | Cotoi O.S. , Dunér P. , Ko N. , Hedblad B. , Nilsson J. , Björkbacka H. and Schiopu A. , Plasma S100A8/A9 correlates with blood neutrophil counts, traditional risk factors, and cardiovascular disease in middle-aged healthy individuals, Arterioscler. Thromb. Vasc. Biol. 34: ((2014) ), 202–210. |
[53] | Bird R.B. , Stewart W.E. and Lightfoot E.N. , Transport Phenomena, John Wiley & Sons, New York, (1960) . |
[54] | Langmuir I. , The adsorption of gases on plane surfaces of glass, mica, and platinum, Journal of the American Chemical Society 40: ((1918) ), 1361–1403. |
[55] | Levenspiel O. , Chemical Reaction Engineering, JohnWiley & Sons, New York, (1972) . |
[56] | Tallon J. , Couenne F. , Bordes C. , Tayakout-Fayolle M. , Venet F. , Monneret G. , Nony P. and Gueyffier F. , Immune system modelling in case of a septic shock, in: Computer Aided Chemical Engineering, Elsevier, 2019, pp. 1093–1098. |
[57] | Copyright 1990–2015 The MathWorks, Inc, MATLAB version 9.3.0.713579 (R2017b). Natick, Massachusetts, (2017). |
[58] | Nagaraja S. , Wallqvist A. , Reifman J. , Mitrophanov A.Y. , Computational approach to characterize causative factors and molecular indicators of chronic wound inflammation, Immunol. 192: ((2014) ), 1824–1834 |


