
A review on ergonomics evaluations of virtual reality
Abstract
BACKGROUND:
Virtual reality (VR) is a combination of technologies that allow the user to interact with a computer-simulated environment with the experience of immersion, interactivity, and imagination. However, ergonomic problems related to virtual reality have adverse effects on the health and experience of users, which restrict the application of virtual reality technology.
OBJECTIVE:
The paper aims to provide an overview of the ergonomics evaluation of VR for further development of software and hardware of VR.
METHODS:
This paper describes and discusses the ergonomics issues involved in the software and hardware of VR from three aspects: visual, physiological, and cognitive. The paper also summarizes the research methods and evaluation metrics.
RESULTS:
Many attempts have been made to study ergonomics issues of VR, mainly including pressure, muscle fatigue, thermal comfort, visual fatigue, and motion sickness. Ergonomics studies are very valuable for research related to virtual reality. There is a summary table that lists the main evaluation metrics and methods.
CONCLUSIONS:
According to current research, this review gives three recommendations for further research on VR, which will be helpful for further human-centered research and design work within the VR industry.
1Introduction
Based on the development of computer technology, virtual reality combines electronic information technology and simulation technology to generate a digital environment that is highly similar to the real environment in terms of vision, hearing, and touch. The user interacts with the objects in the digital environment with the necessary equipment to produce an immersive experience. Virtual reality technology has three basic characteristics: Immersion, Interaction, and Imagination [1]. These three basic features are referred to as the 3I features of virtual reality.
With the development of productivity and the continuous progress of technology, the demand for virtual reality technology is increasingly strong in various industries. VR technology is now widely used in national defense and military, education and training, games and entertainment, healthcare, industrial manufacturing, and other fields. 5 G, as a new generation of broadband mobile communication technology with high speed, low latency, and large connectivity, is a network infrastructure to realize the interconnection of people, machines, and things. The complexity of the emerging 5 G architecture will provide a lot of opportunities for practitioners and open up exciting new prospects for research [2]. With the development of 5 G, the future application of VR will be much broader. Nowadays, virtual reality is considered one of the major technological trends to advance the digitization of all areas of human life [3].
However, the user experience of virtual reality is not perfect due to technical limitations. The virtual reality products themselves suffer from excessive equipment weight, high local pressure, thermal discomfort, visual fatigue, motion sickness, etc., which make people reluctant to wear the headset for a long time. These problems not only adversely affect the health and use of users but also limit the application of virtual reality technology and its implementation to the public. Therefore, with the increasingly competitive VR industry environment, it is important to carry out ergonomics research for virtual reality. This paper reviews the ergonomic research related to VR hardware and software and aims to assist with human-centered VR research and productdevelopment.
2The importance of ergonomics research for virtual reality
According to the definition given by IEA (International Ergonomics Association) in 2000 [4], “ Ergonomics (or human factors) is the scientific discipline concerned with the understanding of interactions among humans and other elements of a system, and the profession that applies theory, principles, data, and methods to design to optimize human well-being and overall system performance.” Virtual reality technology building an immersive environment will be a proper solution for improving workplace ergonomics [5, 6].
Virtual reality technology has attracted a lot of attention from ergonomists. As early as 1998, Stanney concluded that research on human factors in virtual reality related to human performance efficiency, health and safety issues, and social impact, and pointed out that virtual reality should fully consider human factors [7]. The side effects and subsequent impact of participating in virtual environments (VE), the appropriateness of the VR hardware and software interfaces, and the understanding of factors that determine participant performance are main topics for ergonomic studies of VR recently [8]. In this paper, we review the ergonomic research on hardware and software of VR from three aspects, including Physical ergonomics, Visual ergonomics, and Cognitive ergonomics, and summarize the ergonomic issues, methods, indices, and future trends. This systematic review will be helpful for the further human-centered design within the VR industry, and it can improve the popularity of VR.
3Ergonomics issues for virtual reality
3.1System composition of VR
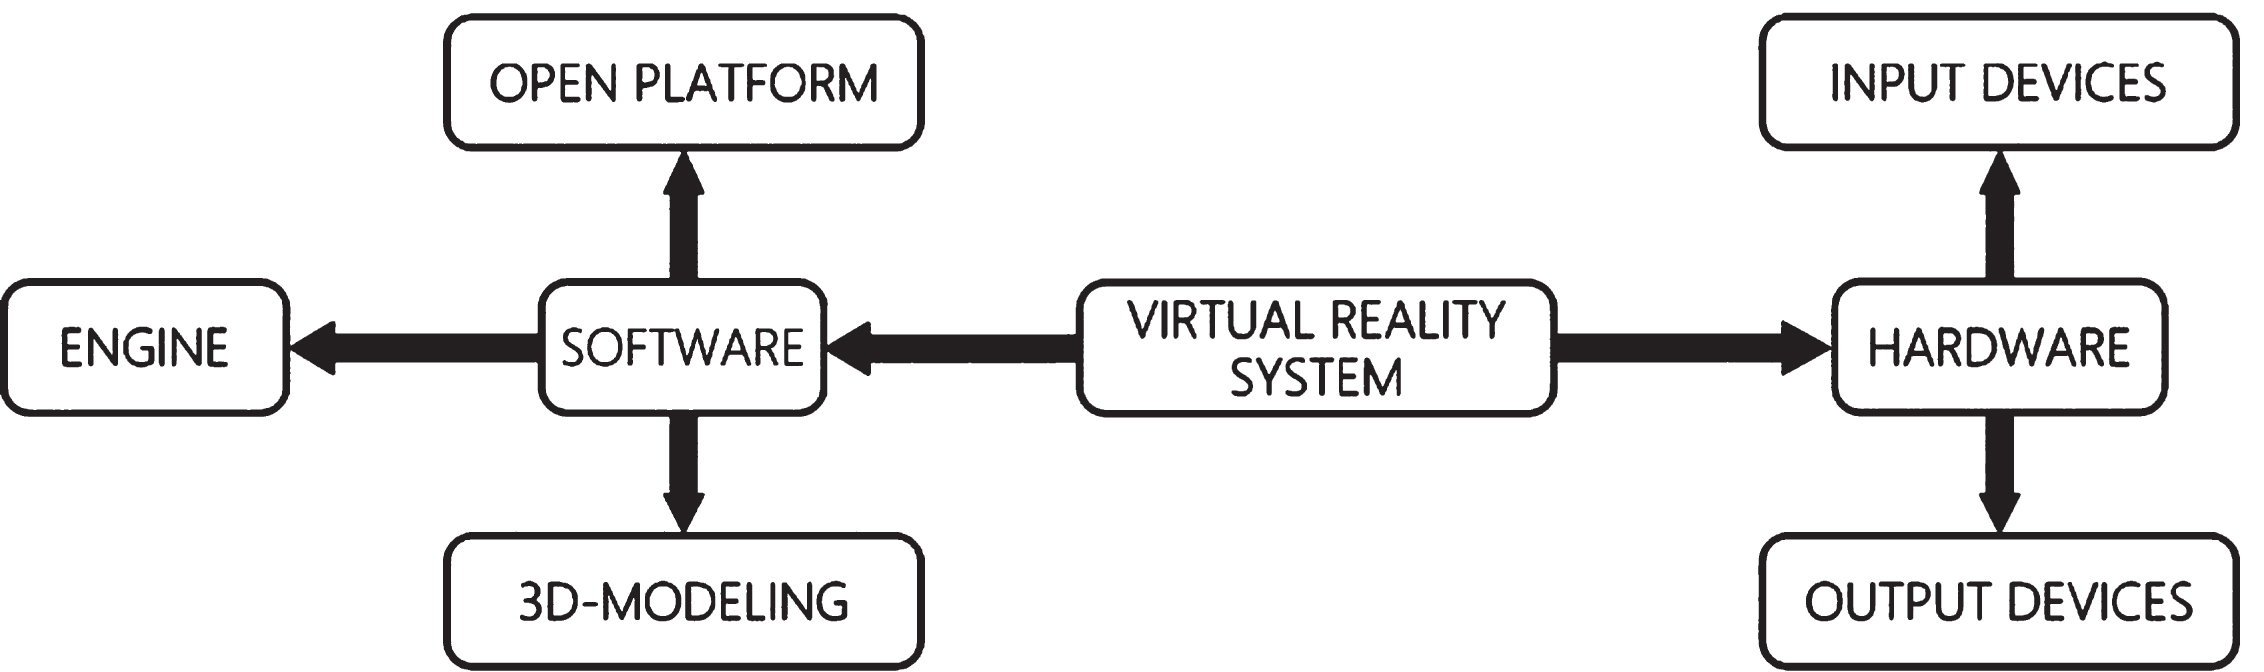
Virtual reality systems are designed to create an interactive virtual environment and include both hardware and software components. Hardware can be divided into input and output devices. The software mainly includes 3D modeling software, virtual reality open platform and virtual reality engine (Fig. 1).
Fig. 1
Classification of virtual reality systems.
3.1.1Hardware components
Virtual reality system hardware components include input devices and output devices. Input devices mainly include data gloves, joysticks, and motion trackers. Output devices are used to present the VR environment to the user and provide feedback, including visual, auditory, and haptic displays [9]. Output devices mainly include virtual reality head-mounted display (HMD), cave (Cave Automatic Virtual Environment), VR glasses, and headphones. Compared with the traditional HMD, Virtual Reality All-in-one Headset is loaded with an independent processor to make the system wireless. Ahn et al. [10] suggested that future virtual reality devices should consider multi-user virtual reality environments and wireless connectivity issues. They believed that wireless and contactless virtual reality devices were the future trends of VR technology.
3.1.2Software components
Virtual reality system software mainly consists of 3D modeling software, a virtual reality open platform, and an engine. Virtual reality modeling based on 2D drawing software. 3DS Max®, AutoCAD®, Softimage 3D®, and Maya® are examples of commercially available commonly used 3D modeling software. The VR Open Platform has an accessible Virtual Reality Software Development Kit (VR SDK). Oculus provides a constantly updated SDK to create prototypes and engage the public in the application development process. And the engine is the universal development and creation tool for virtual reality. Examples of mainstream VR engines are Unreal Engine 4®, Unity 3D®, Cry ENGINE®, and VR Platform®.
3.2Ergonomics issues related to hardware factors
HMD is considered to be the most popular virtual reality device [11]. It is based on a real-time motion tracking system that presents the virtual world in the user’s field of view. Therefore, the human factors issues related to VR hardware factors discussed here are mainly for HMD, focusing on both physical ergonomics and visual ergonomics.
3.2.1Physical ergonomics
3.2.1.1. Pressure. The weight, weight distribution, and wearing style of different HMDs can bring different pressure on the facial bearing point, thus affecting the overall subjective discomfort of the user [12]. Research on HMD pressure has focused on both physical load and contact pressure.
Neck joint torque is an important evaluation index of body load, significantly influenced by weight and center of mass, and increases with HMD mass [13]. The minimum position of the center of mass of the neck joint torque varies with the test posture and the recommended range of the center of mass is determined according to the posture. Weight and center of gravity position have a significant effect on the subjective perception of body load level [14]. LeClair et al. [15] mentioned that the maximum acceptable mass of a helmet is about 1000 g, so the maximum mass of a head-mounted display should not exceed 1000 g.
Contact pressure is mainly generated from seven major areas of the head and face contacting with the HMD, including the bridge of the nose, cheekbones, eyebrows, forehead, temporal bone, top of the head, and back of the head [16]. Head-facial contact pressure is more sensitive to the position of the center of gravity of the HMD. An HMD with a forward center of gravity produced significantly higher nasal contact pressure and overall discomfort than the one with a backward center of gravity [17]. Studies have shown that the overall and nasal subjective discomfort was closely related to the nasal contact pressure, and the ear was the most sensitive to the discomfort for the design with the center of gravity on the ear [17]. Lee et al. [18] found that virtual reality headsets with different shapes of curves in contact with the facial region exerted different levels of pressure on the nose. Yan et al. [19] investigated the relationship between the weight of the virtual reality headset and the subjective head discomfort and pressure load, and they concluded that the lighter weight can make users feel better. At the same time, the integrated headset is more comfortable than the soft band one.
3.2.1.2. Muscle fatigue. Fatigue is mostly associated with muscle activity [20]. Eye movement is a natural habit and muscle fatigue rarely occurs, so visual fatigue is inherently different from the usual muscle fatigue, which is related to the activity of the central nervous system [21]. Therefore, this paper discusses the HMD visual fatigue study separately from the HMD muscle fatigue study.
The weight of the HMD itself can cause fatigue. The added weight on the helmet can make the center of gravity of the head and helmet move forward. At the same time, it can also increase the inertia of the neck [22]. According to the analysis of the Surface EMG, during each training, the fatigue level of the last few hours is significantly higher than that of the first few hours after wearing HMD [22].
Different target positions in virtual reality interaction can also affect musculoskeletal load and task performance [23]. Redundant vertical target positions should be avoided in VR interaction to reduce musculoskeletal discomfort and injury risk. Nichols [24] indicated that long-time experiments should be conducted to effectively assess muscle fatigue problems.
In addition, during the interaction, free gesture movements of the upper limbs without arm support and prolonged static postures can lead to shoulder discomfort and fatigue [25]. Repetitive and continuous arm posture during interactions can also lead to shoulder muscle fatigue [26].
3.2.1.3. Thermal comfort. The thermal comfort of HMD is important. Previous studies have demonstrated that wearing headgear in warm conditions can lead to subjective thermal disorders (STD) [27, 28]. HMD insulates the head area and can cause thermal discomfort, which in turn reduces the user’s wearing intention [29]. The thermal comfort of the user’s head plays a crucial role in overall personal comfort. Based on the surface area, part of the body heat is dissipated through the head [30, 31]. In addition, virtual reality headsets generate a lot of heat during operation, which means that the user will feel hotter than wearing other headgear (such as a helmet) [32].
Infrared thermography (IRT) has attracted growing attention nowadays in physiological studies because of its great potential to quantify surface temperature distribution easily and non-invasively and generate corresponding thermal images [31, 33, 34]. Dotti et al. [31, 33, 34] compared the application of miniature data loggers and infrared thermography (IRT) in human comfort research. Wang et al. [35] studied the thermal characteristics and subjective thermal discomfort of virtual reality headsets. They measured microclimate temperature and relative humidity using miniature data loggers, and the temperature distribution between the user’s face and the contact point of the headset using an infrared thermal imaging camera. The study found that subjective thermal discomfort was positively correlated with usage time, microclimate temperature, relative humidity, and display coverage area. They suggested that the design of HMD should consider reducing the display coverage area of the user’s face, especially the area with a high sweating rate.
3.2.2Visual ergonomics
The immersion that users obtain in VR environments depends largely on their visual experience. As a result, the research of visual ergonomics of virtual reality is particularly important. Latency refers to the difference between the time required for a virtual reality device to respond to a behavioral signal input by the user and the time for a VR device to present the signal. In September of 2020, IEEE (Institute of Electrical and Electronics Engineering) developed an HMD standard to reduce virtual reality diseases. It mentioned that the latency of virtual reality can affect user immersion and cause inconvenience, which put forward new requirements for HMD hardware. Latency should be as low as possible, 20 ms or even less in latency will be acceptable [36]. Frame rate is the number of frames per second that the image is refreshed, and low frame rates can cause flicker. Since flickering and low frame rates may cause symptoms such as headaches, eye fatigue, and seizures to sensitive users, the frame rate in VR content must be synchronized with the refresh rate of the VR HMD. It is recommended that the minimum frame rate be no less than 30 fps (frames per second) for images, 60 fps fo r graphics, and 90 fps for interactive content. And the higher the pixels per inch (PPI) of the VR image resolution is, the clearer the content shown on the screen will be.
The visual ergonomics problems caused by VR are mainly reflected in two aspects of visual fatigue and motion sickness.
3.2.2.1. Visual fatigue. HMD can cause visual fatigue [36]. Sheedy et al. [37] classified eye strain symptoms into external and internal symptoms based on location. The main external symptoms are burning, irritation, tearing, and dryness. These symptoms are caused by a variety of factors, such as eyelid opening, staring, upward gazing, reading small print, and flickering at the front and bottom of the eye. Internal symptoms are mainly pain, tension, and headache.
Analyzing the reasons for visual fatigue caused by HMD, Peli [38] suggested that it was caused by the mismatch between the convergence distance of the eyes and the focal length. Yano et al. [39] proposed that when viewing stereoscopic images, the difference between the demands of conditioning and convergence can place a lot of stress on the visual system, leading to eye fatigue and measurable changes in visual function. Bando et al. [40] observed that experiments in the VR environment were more prone to visual fatigue than experiments in the LCD environment, mainly due to image distortion or crosstalk in the stereoscopic viewing and the proximity between the source of illumination and the eyes.
3.2.2.2. Visually induced motion sickness. Visually induced motion sickness (VIMS) may occur during or after exposure to a virtual environment, causing discomfort to the user, characterized by symptoms such as nausea, headache, and disorientation [41]. VIMS is the main obstacle to be overcome in virtual reality. It is estimated that about 30–80% of people will experience some degree of illness when using virtual reality [42]. Therefore, this section will focus on VIMS in a virtual environment.
Previous theories suggest that motion sickness stems from the body’s response mechanism to food poisoning - when toxins are detected in food, the brain triggers a perceptual disorder that forces the body to vomit up the toxic food. Of course, such claims are difficult to substantiate, and current general theories focus mainly on the confusion of visual-motion signals. The main causes of motion sickness include conflicts between visual information and limb movement information, conflicts in visual vergence regulation, excessive binocular parallax, and discontinuous changes in parallax [43]. Sensory conflict theory posits that motion sickness occurs when sensory signals, particularly signals related to self-motion, from the various sensory systems (e.g. visual system, vestibular system, proprioceptors) are either in conflict with one another or else strongly violate expectations based on previous experience [44]. Therefore, conflict reduction is essential to avoid motion sickness [45]. In order to reduce motion sickness, Mizukoshi et al. [45] developed a scaling method for master-slave remote control systems based on the gaze motion of the head towards or away from the object.
VIMS is affected by individual factors [46]. These factors include age (younger individuals more susceptible than older individuals), sex (females more susceptible than males), and personality factors (individuals low in extraversion, high in neuroticism, and/or high in anxiety all being more susceptible) [41, 47].
Many of the factors that induce motion sickness are related to VR simulator hardware and displays [44]. Studies on HMD hardware-related factors leading to motion sickness mainly include display device types (screen, monitor, and helmet display) [48–50], the field of view (FoV) [51, 52], time delay [53], frame rate [54] and flickering [55]. Field of view refers to the size of the area that the user can observe. A small FoV indicates a narrow viewing area and the user must move the screen frequently. While small FoV is characterized by reduced image immersion and visual cognition, large FoV can lead to screen distortion, causing users to feel dizzy oruncomfortable [56].
VR latency can distract users, affecting their comfort and the intensity of motion sickness [57]. Lee et al. used the Delphi methodology to evaluate the effect of HMD on motion sickness and found that latency was the most critical consideration for the helmet display comfort experience [56]. The accumulation of flicker triggers motion sickness in the user.
The evaluation of VIMS is mainly divided into the subjective evaluation and objective evaluation. Subjective evaluation is essentially a study of the opinions of the majority of the subject group and can directly reflect user feelings. The commonly used questionnaire for evaluating motion sickness is the Simulator Sickness Questionnaire (SSQ) proposed by Kennedy in 1993 [41]. The SSQ assesses motion sickness by a total score based on three factors: nausea, oculomotor, and disorientation.
The SSQ has been widely used to measure signs and symptoms associated with military virtual reality simulators [41, 58]. However, some items in the SSQ have little correlation with the measurement of motion sickness in virtual reality environments [59]. The SSQ has been continuously improved in recent years, Kim et al. [60] argued that some items in the SSQ are not relevant to symptoms in VR environments and proposed the Virtual Reality Sickness Questionnaire (VRSQ). The VRSQ is composed of two parts: eye discomfort and orientation disorder, which excludes nausea, as nausea has a small effect on motion sickness in the VR environment.
Subjective assessment is convenient and widely used. However, it is subject to individual influence and can only obtain rough changes. In contrast, objective assessment has the advantages of less measurement error and direct measurement of human body response. But it also has limitations of device use and unintuitive data. Therefore, researchers often use the method of combining subjective evaluation with objective measurement.
Postural instability has been identified as a key predictor of motion sickness [61]. The measurement of postural instability includes two types of methods: the center of gravity judgment method and the path judgment method. In the method of determining the center of gravity, the force plate can be used to test the instability of the body’s posture when standing [62]. Changes in the center of pressure position in the Anterior-Posterior (AP) and Medial-Lateral (ML) axes are recorded at a frequency of 50 Hz. The effects of the visual task and the motion sickness state are mainly concentrated in the anterior-posterior axis. In the path judgment method, a magnetic sensor is used to record the subject’s posture data and fix it to the center of the participant’s back [63], collecting the path data on the X and Y axes at a frequency of 120 Hz. The temporal complexity of pose instability is studied using sample entropy and normalized path length, and the size of pose instability is studied using elliptical area and path length.
Other objective physiological data such as electrooculogram (EEG), electrocardiogram (ECG), electroencephalogram (EOG), galvanic skin response (GSR) and photoplethysmogram (PPG), blood pressure (BP), heart rate (HR), pulse rate, blink rate can also be used as objective assessment indicators of motion sickness [43, 64, 65].
3.3Ergonomics issues related to software factors
The software content of virtual reality has little impact on the physical ergonomic aspects and will not be discussed here. The perceptual issues and visual fatigue continue and even extend while using HMDs with near-eye displays embedded [66]. Therefore, the ergonomics issues related to software factors are mainly discussed in two dimensions: visual ergonomics and cognitive ergonomics.
3.3.1Visual ergonomics
3.3.1.1. Visual fatigue: VR content can also affect visual comfort and cause visual fatigue. Choy et al. [67] demonstrated that participants viewing stereoscopic 3D (S3D) with a virtual reality device exhibited higher SSQ scores than participants using other devices. Kooi and Toet [68] investigated the effect of binocular image defects on the visual fatigue of the stereo vision system. They found that almost all binocular image asymmetries severely reduced visual comfort.
3.3.1.2. VIMS: In addition to individual differences and HMD hardware factors, factors that may cause motion sickness are sound and content [69]. Therefore, the occurrence of virtual reality-induced motion sickness is correlated with software content design. IEEE Standard [36] stated that unnatural and abrupt virtual camera movements and asynchronous behaviors that do not match the visual experience of VR content can cause user dizziness and discomfort, and suggests that the frame rate in VR content must be synchronized with the refresh rate of the HMD. And in the case of VR content with high image complexity, users are forced to recognize a large amount of visual information, which may also lead to VR sickness. Therefore, dynamic scenes are prone to cause motion sickness symptoms, resulting in users quitting the evaluation [70], while few significant discomforts are reported in staticscenes [71].
Keshavarz and Hecht [72] found that pleasant sounds in a simulator environment can reduce motion sickness, especially when the pleasant sounds make participants feel relaxed. However, the direction of the sound should be determined by the user’s head position, and mismatches between the sound source and the actual audio playback can also lead to virtual reality illness [36].
3.3.2Cognitive ergonomics
Cognitive ergonomics research for virtual reality software is focused on two aspects: task performance and cognitive load.
3.3.2.1. Task performance. Virtual reality environments can have an impact on users’ task performance. Rizzuto et al. [73] evaluated the performance of the pointing task in real and virtual environments and found that the target error in the virtual condition was significantly larger than that in the real condition. To compare walking in virtual reality and the real world, various aspects were studied, including types of systems such as video displays and helmet displays, 3D spatial recognition, speed recognition, environments such as space stations or buildings. Several scholars [74, 75] have compared navigation tasks in HMD and desktop environments, including the number of captures, distance traveled, and average speed. The experiments showed that, in general, people were more satisfied and intuitive with HMD, but performed better on the desktop environment for most tasks.
Task performance is closely related to access to information in the virtual environment. Lee et al. [76] investigated the influence of text information on the cognitive processing of visual information in HMD by obtaining user evaluations from three dimensions: contrast sensitivity, sentence length, and text size. They proposed that in a virtual reality environment, text size of 96 pixels or more, a background contrast sensitivity of 75% to 50%, and an effective sentence length ratio of 33.3% to 50% were used to ensure the readability of text information. Lambooij et al. [77] also conducted a user study to determine the visual discomfort associated with 3D stereoscopic displays compared to 2D displays and suggested that participants with a moderate binocular condition experienced more visual discomfort and showed decreased performance in reading tasks. By studying the effects of color mode (dark or light mode), peripheral illumination, and virtual illumination on reading text, Erickson et al. [78] found that using light mode under bright virtual illumination facilitates the legibility of text to the user, but switching to dark mode was beneficial when lowering the virtual illumination. They believed that this was partially due to a color bleeding effect that occurs when a light-colored letter was presented on a dark background, where the light from the letter partially illuminates neighboring background pixels and results in a letter that appears slightly larger [79].
3.3.2.2. Cognitive load. A particular challenge of virtual reality is the potential overload of visual input, which creates an unnecessary cognitive load [80]. Rhiu et al. [81] verified that users felt a higher workload when using the HMD while walking and driving. In particular, the scores of mental demand and frustration were significantly different between the two systems, as users felt dizzy or mentally stressed when participating in the experiment. Chang et al. [82] designed a driving system with embedded Stroop tasks. Stroop task had been used to assess cognitive processing and selective attention abilities, which asked an individual to distinguish whether a certain word’s meaning and visual color match [82]. They found that the average response time when users answered Stroop trials in the FSD (flat-screen displays) condition was shorter than that in the HMD condition. This indicated that HMDs might have caught more of the users’ attention for virtual driving, which led to their delayed responses to the Stroop trials. In terms of gender differences, they found that men outperformed women in virtual driving, especially at longer driving distances. They speculated that the reason for this may be that females have a higher cognitive load in virtual driving. Female users had a significantly lower average minimum oxygen saturation and a greater decrease in oxygen saturation during the use of the system. The virtual driving system generated more mental work for women, which resulted in greater oxygen consumption [82].
4Summary of the evaluation methods for the above ergonomic issues
Facing the ergonomic evaluation of virtual reality, there are different evaluation indexes and methods for different problems, which are summarized in Table 1.
Table 1
Metrics and methods for ergonomic evaluation related to virtual reality
| Content | Researcher | Index | Method |
| Pressure | Chang et al. [16] | Subjective discomfort evaluation | Subjective discomfort scoring using a visual analog scale for the overall 3D glasses, nose, and posterior edge of the ear |
| Contact pressure value | Nasal pressure testing with FSR thin-film sensors | ||
| Song et al. [83] | Subjective comfort evaluation | Evaluation of subjective comfort using Borg’s CR-10 scale | |
| Contact pressure value | Acquisition of objective pressure values at the test site using FSR thin-film sensors | ||
| Muscle fatigue Thermal comfort | Chihara et al. [13] | Neck joint torque | The position of the center of mass of the minimum neck joint moment varies with the test posture |
| Theis et al. [84] | Electromyographic signal | Electromyography | |
| Wang et al. [35] | Subjective discomfort evaluation | At 10, 20, 30 and 45 minutes users evaluate the degree of thermal discomfort with a score of “0” for no thermal discomfort and “10” for extreme thermal discomfort | |
| Microclimate temperature (MT) and microclimate humidity (MHR) | Microclimate temperature and relative humidity were measured using a miniature data logger | ||
| Temperature distribution | The temperature distribution between the user’s face and the contact point of the headset was measured using an infrared thermal imaging camera | ||
| Visual fatigue | Lambooij et al. [85] | Subjective questionnaire evaluation | Ask subjects to express the degree of discomfort after viewing or Complete some specially designed questionnaires |
| Wang et al. [86] | ECG indicators | Find the changing pattern of visual fatigue by time-domain analysis and frequency domain analysis of ECG signal | |
| Kim et al. [87] | Eye movement indicators | The common eye movement indicators used to analyze visual fatigue include blink duration, gaze duration, etc. | |
| Bang et al. [88] | EEG indicators | EEG indicators include power spectrum in different frequency bands, the center of gravity frequency, and fatigue factor | |
| Wan et al. [89] | SSQ and optometry data | It included a main experimental phase and a control phase. Each phase consisted of four questionnaires, four optometric tests, three HMD use | |
| Hirota et al. [90] | Binocular fusion maintenance, subjective visual score | Binocular fusion maintenance (BFM) measurements using a binocular open window Shack-Hartmann wavefront aberrometer with LCD louvers | |
| VIMS | Kinsella et al. [63] | Postural instability | Center judgment method and path judgment method. The ellipse area is used to describe the size of the area where the pose wobble occurs, and the path length provides information about the overall number of pose wobbles and represents the actual length of the motion |
| Theis et al. [84] | Subjective Halo Scale | SSQ Subjective Scale | |
| Kim et al. [91] | Virtual Reality Disease Prediction (VRSP) | Perceptual motion features are extracted independently for each rotation axis. Such as the user’s head angular velocity (ωvest), visual angular velocity (ωvis), and perceptual angular velocity (ωper) to model the interaction between the user’s motion and the vestibular system | |
| Park et al. [92] | Subjective Halo Scale | VRSQ subjective scale | |
| Chung et al. [93] | EEG signals | Predicting motion sickness with EEG and deep learning can achieve 82.83% accuracy on the dataset | |
| Jia et al. [43] | Objective physiological signals | Results from a VR-based vehicle driving simulator experiment suggest that the relationship between blood pressure, pulse rate, blink rate, and VIMS could be a candidate for the assessment of VIMS | |
| Effectiveness | Sebok et al. [94] | Radiation status awareness | Correctness in determining the radiation level at three locations in multiple reactor hall pictures |
| Kinsella et al. [63] | Accuracy and time to hit | Accuracy was calculated by the number of hits in the trials. Hit times were calculated by adding up the time between the announcement of the target and the hit each time, plus three seconds for each miss in each set of trials | |
| Theis et al. [84] | Time to complete the task | Participants perform different maintenance tasks and record the time to complete them | |
| Mustonen et al. [95] | Vigilance tasks | The amount of time participants took to react when the square morphed into the target shape | |
| Schega, et al. [96] | Visual cognitive performance | Reaction time, error rate, the time cost of switching between monitors | |
| Shi et al. [97] | Eye-tracking function | Task performance correlates with gaze tracking functions, including gaze movement and pupil dilation |
5Conclusion
In this paper, we summarized the ergonomics research of virtual reality and introduced subjective and objective evaluation methods for related issues. Based on the above review, we consider that there are three trends in future research:
(1) First and foremost, we should enhance the development of VR hardware.
From the various human-caused problems listed in the text, it can be found that problems concerning VR hardware are serious problems that limit the development of the virtual reality industry and affect the user experience, and emphasis should be placed on enhancing the development technology of the virtual reality headset hardware system. Methods such as reducing latency and flicker and increasing display resolution can effectively reduce VR-related diseases.
(2) We should refine design guidelines for VR software content.
Virtual reality-related illnesses often prevent users from experiencing virtual reality-designed content for long periods. In terms of improving user experience from VR software, we believe that VR content developers should consider not only the design of the content, but also whether the user will feel any discomfort due to unsuitable VR content, such as the speed of scene switching and the dynamic effect of the interface. In the future, we can refine the design guidelines of VR software content through in-depth research.
(3) We should establish the design model based on human factors and a comprehensive evaluation system for head-up display.
By clarifying the mapping relationship between the design parameters of product modeling characteristics and human factors evaluation indicators, we can provide a theoretical basis and data support for the improved design of products. In the future, we can consider customizing HMD according to personal conditions such as head circumference to reduce the current local pressure and light leakage caused by improper size. Combining subjective evaluation by experts and statistical analysis of data, a comprehensive evaluation index system for human factors of the headset is gradually constructed to form a complete set of subjective and objective evaluation methods.
Ethical approval
Not applicable.
Informed consent
Not applicable.
Conflict of interest
The authors declare that the research was conducted in the absence of any commercial or financial relationships that could be construed as a potential conflict of interest.
Acknowledgments
The authors thank the editors and the reviewers for their helpful suggestions on earlier versions of this manuscript.
Funding
This study was partly supported by the National Natural Science Foundation of China (No. 51905175), the second Batch of 2020 MOE of PRC Industry-University Collaborative Education Program (Program No. 202101042012, Kingfar-CES “Human Factors and Ergonomics” Program), Shanghai Pujiang Talent Program (No. 2019PJC021), the Shanghai Soft Science Key Project (No. 21692196800) and the Smart Travel Art Design Innovation Laboratory (No.20212679).
References
[1] | Berg LP , Vance JM . Industry use of virtual reality in product design and manufacturing: a survey. Virtual Real-London. (2017) ;21: :1–17. |
[2] | Roche EM , Townes LW . Millimeter Wave “5G” Wireless Networks to Drive New Research Agenda. Journal of Information Technology Case & Application Research. (2018) :1–9. |
[3] | Koivisto J , Hamari J . The rise of motivational information systems: A review of gamification research. Int J Inform Manage. 2019. |
[4] | IEA. What is ergonomics vol. 2021;2020. |
[5] | Leskovský R , Kučera E , Haffner O , Matišák J , Stark E . A Contribution to Workplace Ergonomics Evaluation Using Multimedia Tools and Virtual Reality. 2019 Federated Conference on Computer Science and Information Systems. 2019. |
[6] | Arlati S , Spoladore D , Mottura S , Zangiacomi A , Ferrigno G , Sacchetti R , et al. Analysis for the design of a novel integrated framework for the return to work of wheelchair users. Work. (2019) ;61: :603–25. |
[7] | Stanney K , Mourant M , Ronald R , et al. Human factors issues in virtual environments: A review of. .. Presence: Teleoperators & Virtual Environments. (1998) ;7: :327. |
[8] | Wilson JR . Virtual environments applications and applied ergonomics. Appl Ergon. (1999) ;30: :3–9. |
[9] | Yang Q , Zhong S . A Review of Foreign Countries on the Development and Evolution Trends of Virtual Reality Technology. Journal of Dialectics of Nature. (2021) ;43: :97–106. |
[10] | Jinsoo A , Young K , Ronny K . Virtual Reality-Wireless Local Area Network: Wireless Connection-Oriented Virtual Reality Architecture for Next-Generation Virtual Reality Devices. Applied Sciences. (2018) ;8: :43. |
[11] | Bowman DA , Datey A , Ryu YS , Farooq U , Vasnaik O . Empirical Comparison of Human Behavior and Performance with Different Display Devices for Virtual Environments. Human Factors & Ergonomics Society Annual Meeting Proceedings. (1996) ;46: :2134–8. |
[12] | Zhuang J , Yue L , Jia Y , Huang Y . User Discomfort Evaluation Research on the Weight and Wearing Mode of Head-Wearable Device. Springer, Cham;. (2018) ; pp. 98–110. |
[13] | Chihara T , Seo A . Evaluation of physical workload affected by mass and center of mass of head-mounted display. Appl Ergon. (2018) ;68: :204–12. |
[14] | Ito K , Tada M , Ujike H , Hyodo K . Effects of Weight and Balance of Head Mounted Display on Physical Load: Virtual, Augmented and Mixed Reality. Multimodal Interaction; 2019. |
[15] | LeClair B , O’Connor PJ , Podrucky S , Lievers WB . Measuring the mass and center of gravity of helmet systems for underground workers. Int J Ind Ergonom. (2018) ;64: :23–30. |
[16] | Chang J , Jung K , Kim W , Moon SK , Freivalds A , Simpson TW , et al. Effects of weight balance on a 3D TV shutter type glasses: Subjective discomfort and physical contact load on the nose. Int J Ind Ergonom. (2014) ;44: :801–9. |
[17] | Chang J , Jung K , Kim W , Moon SK , Freivalds A , Simpson TW , et al. Effects of weight balance on a 3D TV shutter type glasses: Subjective discomfort and physical contact load on the nose. Int J Ind Ergonom. (2014) ;44: :801–9. |
[18] | Lee W , Kim J , Molenbroek JMF , Goossens RHM , You H . Estimation of Facial Contact Pressure Based on Finite Element Analysis. Cham: Springer International Publishing; (2019) ; pp. 657–67. |
[19] | Yan Y , Ke C , Yu X , Song Y , Liu Y . The Effects of Weight on Comfort of Virtual Reality Devices: Advances in Ergonomics in Design; (2019) . pp. 239–48. |
[20] | Stokes MJ , Cooper RG , Edwards RH . Normal muscle strength and fatigability in patients with effort syndromes. BMJ. (1988) ;297: (6655):1014–7. |
[21] | Tam WJ , Speranza F , Yano S , Shimono K , Ono H . Stereoscopic 3D-TV: visual comfort. IEEE Trans Broadcast. (2011) ;57: (2):335–46. |
[22] | Gallagher HL , Caldwell E , Albery CB . Neck Muscle Fatigue Resulting from Prolonged Wear of Weighted Helmets. General Dynamics Advanced Information Systems. (2008) . pp. 1–33. |
[23] | Penumudi SA , Kuppam VA , Kim JH , Hwang J . The effects of target location on musculoskeletal load, task performance, and subjective discomfort during virtual reality interactions. Appl Ergon. (2020) ;84: :103010. |
[24] | Nichols S . Physical ergonomics of virtual environment use. Appl Ergon. (1999) ;30: :79–90. |
[25] | Afshin S , Charles P , Georges D , Pascal M , Van B . Shoulder Kinematics and Spatial Pattern of Trapezius Electromyographic Activity in Real and Virtual Environments. Plos One. (2015) ;10: :e116211. |
[26] | Ram S , Mahadevan A , Rahmat-Khah H , Turini G , Young JG . Effect of Control-Display Gain and Mapping and Use of Armrests on Accuracy in Temporally Limited Touchless Gestural Steering Tasks. Proceedings of the Human Factors & Ergonomics Society Annual Meeting. (2017) ;61: :380–4. |
[27] | Nakamura M , Yoda T , Yasuhara S , Saito Y , Kasuga M , Nagashima K , et al. The regional difference in temperature related sensations. Neurosci Res. (2007) ;58: :S108. |
[28] | Papadakaki M , Tzamalouka G , Orsi C , Kritikos A , Morandi A , Gnardellis C , et al. Barriers and facilitators of helmet use in a Greek sample of motorcycle riders: Which evidence? Transportation Research Part F: Traffic Psychology and Behaviour. (2013) ;18: :189–98. |
[29] | Bogerd CP , Aerts J , Annaheim S , Bröde P , de Bruyne G , Flouris AD , et al. A review on ergonomics of headgear: Thermal effects. Int J Ind Ergonom. (2015) ;45: :1–12. |
[30] | Arens E , Zhang H , Huizenga C . Partial- and whole-body thermal sensation and comfort— Part II: Non-uniform environmental conditions. J Therm Biol. (2006) ;31: :60–6. |
[31] | Pang TY , Subic A , Takla M . A comparative experimental study of the thermal properties of cricket helmets. Int J Ind Ergonom. (2013) ;43: :161–9. |
[32] | Costello PJ , Rd J , Costello P . Health and Safety Issues associated with Virtual Reality - A Review of Current Literature. AGOCG Technical Report Series. (1997) ;371–5. |
[33] | Rogalski A . Recent progress in infrared detector technologies. Infrared Phys Techn. (2011) ;54: :136–54. |
[34] | Dotti F , Ferri A , Moncalero M , Colonna M . Thermo-physiological comfort of soft-shell back protectors under controlled environmental conditions. Appl Ergon. (2016) ;56: :144–52. |
[35] | Wang Z , He R , Chen K . Thermal comfort and virtual reality headsets. Appl Ergon. (2020) ;85: :103066. |
[36] | IEEE Standard for Head-Mounted Display (HMD)-Based Virtual Reality (VR) Sickness Reduction Technology Standard Activities Board 2020. |
[37] | Sheedy JE , Hayes J , Engle J . Is all Asthenopia the Same? Optometry & Vision Science. (2003) ;80: :732–9. |
[38] | Peli E . Real vision & virtual reality. Optics and Photonics News. (1995) ;6: :28–34. |
[39] | Yano S , Emoto M , Mitsuhashi T . Two factors in visual fatigue caused by stereoscopic HDTV images. Displays. (2004) ;25: :141–50. |
[40] | Bando T , Iijima A , Yano S . Visual fatigue caused by stereoscopic images and the search for the requirement to prevent them: A review. Displays. (2012) ;33: :76–83. |
[41] | Kolasinski EM . Simulator Sickness in Virtual Environments. Army Research Institue for the Behavioral & Social. US Army Research Institute for the Behavioral and Social Sciences 1995. |
[42] | Rebenitsch LOC . Review on cybersickness inapplications and visual displays. Virtual Real. (2016) ;2: :101–25. |
[43] | Jia R . Preliminary Study on Visually Induced Motion Sickness Evaluation in Virtual Reality. College of Computer Science of Chongqing University, China 2017. |
[44] | Allen B , Hanley T , Rokers B , Green CS . Visual 3D motion acuity predicts discomfort in 3D stereoscopic environments. Entertainment Computing. (2016) ;13: :1–9. |
[45] | Mizukoshi Y , Hashimoto K , Takanishi A , Iwata H , Matsuzawa T . A Low Cognitive Load and Reduced Motion Sickness Inducing Zoom Method Based on Typical Gaze Movement for Master-Slave Teleoperation Systems with HMD. IEEE/SICE International Symposium on System Integration (SII);. (2020) ;2020. |
[46] | Wiederhold BK , Bouchard S . Advances in Virtual Reality and Anxiety Disorders. Series in Anxiety & Related Disorders. New York: Springer. 2014. |
[47] | Wilding JM , Meddis R . A note on personality correlates of motion sickness. Brit J Psychol. (2011) ;63: :619–20. |
[48] | Kim K , Rosenthal MZ , Zielinski DJ , Brady R . Effects of virtual environment platforms on emotional responses. Comput Meth Prog Bio. (2014) ;113: :882–93. |
[49] | Keshavarz B , Hecht H , Zschutschke L . Intra-visual conflict in visually induced motion sickness. Displays.. (2011) ;32: :181–8. |
[50] | Vlad R , Nahorna O , Ladret P , Guerin A . The influence of the visualization task on the Simulator Sickness symptoms - a comparative SSQ study on 3DTV and 3D immersive glasses. 3dtv-conference: the True Vision-capture; IEEE. (2013) . pp. 1–4. |
[51] | van Emmerik ML , de Vries SC , Bos JE . Internal and external fields of view affect cybersickness. Displays. (2011) ;32: :169–74. |
[52] | Fernan De SAS , Feiner SK . Combating VR sickness through subtle dynamic field-of-view modification. IEEE Symposium on 3D User Interfaces (3DUI); (2016) . pp.201–10. |
[53] | Davis S , Nesbitt K , Nalivaiko E . A systematic review of cybersickness. In Proceedings of the conference on interactive entertainment, Newcastle. (2014) . pp. 1–9. |
[54] | Renkewitz H , Alexander T . Perceptual Issues of Augmented and Virtual Environments. perceptual issues of augmented & virtual environments. FGAN-FKIE, Wachtberg 2007. |
[55] | Rebenitsch LR . Cybersickness prioritization and modeling. Dissertations & Theses - Gradworks. Computer Science, Michigan State University 2015. |
[56] | Lee D , Chang B , Park J . Evaluating the Comfort Experience of a Head-Mounted Display with the Delphi Methodology. Internet Comput 2020. |
[57] | Watanabe K , Takahashi M . Head-synced Drone Control for Reducing Virtual Reality Sickness. Journal of Intelligent and Robotic Systems. (2019) ;97: :733–44. |
[58] | Angelo G , Solimini . Are There Side Effects to Watching 3D Movies? A Prospective Crossover Observational Study on Visually Induced Motion Sickness. Plos One. (2013) ;8. |
[59] | Drexler J. Identification of system design features that affect sickness in virtual environments: University of Central Florida.; 2006. |
[60] | Kim HK , Park J , Choi Y , Choe M . Virtual reality sickness questionnaire (VRSQ): Motion sickness measurement index in a virtual reality environment. Appl Ergon. (2018) ;69: :66–73. |
[61] | Chardonnet J ., Ali Mirzaei Mohammad , Frédéric Merienne . Visually Induced Motion Sickness Estimation and Prediction in Virtual Reality using Frequency Components Analysis of Postural Sway Signal. ICAT-EGVE. (2015) . 2015 Oct. |
[62] | J M , M D , A ST . The virtual reality head-mounted display Oculus Rift induces motion sickness and is sexist in its effects (2017) ;3: :889–901. |
[63] | Kinsella A , Beadle S , Wilson M , Smart LJ , Muth E . Measuring User Experience With Postural Sway and Performance in a Head-Mounted Display. Proceedings of the Human Factors & Ergonomics Society Annual Meeting. (2017) ;61: :2062–6. |
[64] | Cheng S , Wang J , Zhang L , Wei Q . Motion Imagery-BCI Based on EEG and Eye Movement Data Fusion. Ieee T Neur Sys Reh. (2020) ;PP:1. |
[65] | Cheng S , Fan J , Dey AK . Smooth Gaze: a framework for recovering tasks across devices using eye tracking. Pers Ubiquit Comput. (2018) ;22: :489–501. |
[66] | Bruder G , Pusch A , Steinicke F . Analyzing effects of geometric rendering parameters on size and distance estimation in on-axis stereographics. ACM. (2012) :111. |
[67] | Choy SM , Cheng E , Wilkinson RH , Burnett I , Austin MW . Quality of Experience Comparison of Stereoscopic 3D Videos in Different Projection Devices: Flat Screen, Panoramic Screen and Virtual Reality Headset. Ieee Access. (2021) ;99: :1–1. |
[68] | Kooi FL , Toet A . Visual comfort of binocular and 3D displays. Displays. (2004) ;25: :99–108. |
[69] | Widyanti A , Hafizhah HN . The influence of personality, sound, and content difficulty on virtual reality sickness. Virtual Real-London. (2021) :1–7. |
[70] | Ihemedu-Steinke QC , Rangelova S , Weber M , Erbach R , Meixner G , Marsden N . Simulation Sickness Related to Virtual Reality Driving Simulation. International Conference on Virtual; (2017) . PP:521–32. |
[71] | Torkashvand G , Li M , Vink P . Concept evaluation of a new aircraft passenger privacy bubble using virtual prototyping: A Human-Centered Design framework. Work. (2021) ;68: (s1):S231-S238. |
[72] | Keshavarz B , Hecht H . Pleasant music as a countermeasure against visually induced motion sickness. Appl Ergon. (2014) ;45: :521–7. |
[73] | Rizzuto MA , Sonne M , Vignais N , Keir PJ . Evaluation of a virtual reality head mounted display as a tool for posture assessment in digital human modelling software. Appl Ergon. (2019) ;79: :1–8. |
[74] | Aoki H , Oman CM , Buckland DA , Natapoff A . Desktop-VR system for preflight 3D navigation training. Acta Astronaut. (2008) ;63: :841–7. |
[75] | Bliss JP , Tidwell PD , Guest MA . The Effectiveness of Virtual Reality for Administering Spatial Navigation Training to Firefighters. Human Factors & Ergonomics Society Annual Meeting Proceedings. (1997) ;6: :73–86. |
[76] | Lee SJ , Kim JH , Son HJ , Kwon SC , Lee SH . A Study of Human Factor for Virtual Reality Text Information Implementation on Head Mounted-Display. (2017) Jan. |
[77] | Lambooij M , Fortuin M , Ijsselsteijn W , Evans B , Heynderickx I . Measuring visual fatique and visual discomfort associated with 3-D displays. J Soc Inf Display. (2010) ;18: :931–43. |
[78] | Erickson A , Kim K , Bruder G , Welch GF . Effects of Dark Mode Graphics on Visual Acuity and Fatigue with Virtual Reality Head-Mounted Displays. 2020 IEEE Conference on Virtual Reality and 3D User Interfaces (VR); 2020. |
[79] | Funt BV , Drew MS , Ho J . Color constancy from mutual reflection. Int J Comput Vision. (1991) ;6: :5–24. |
[80] | Makransky G , Terkildsen TS , Mayer RE . Adding immersive virtual reality to a science lab simulation causes more presence but less learning. Learn Instr. (2017) :225–36. |
[81] | Rhiu I , Kim YM , Kim W , Yun MH . The evaluation of user experience of a human walking and a driving simulation in the virtual reality. Int J Ind Ergonom. (2020) ;79: :103002. |
[82] | Chang C , Li M , Yeh S , Chen Y , Rizzo A . Examining the Effects of HMDs/FSDs and Gender Differences on Cognitive Processing Ability and User Experience of the Stroop Task-Embedded Virtual Reality Driving System (STEVRDS). Ieee Access. (2020) ;8: :69566–78. |
[83] | Song Y , Liu Y , Yan Y . The Effects of Center of Mass on Comfort of Soft Belts Virtual Reality Devices: Advances in Ergonomics in Design; (2018) ; pp.312–21. |
[84] | Theis S , Alexander T , Wille M , Others. Considering Ergonomic Aspects of Head-Mounted Displays for Applications in Industrial Manufacturing. International Conference on Digital Human Modeling & Applications in Health; (2013) . pp. 282–91. |
[85] | MLA B , WAI A , IHB C . Visual discomfort of 3D TV: Assessment methods and modeling. Displays. (2011) ;32: :209–18. |
[86] | Wang D , Yang X , Kang Y , Hu H . Evaluation and Modeling of Visual Fatigue in 3D Display Based on ECG. Journal of System Simulation. (2019) ;31: (2):212. |
[87] | Kim D , Choi S , Park S , Sohn K . Stereoscopic visual fatigue measurement based on fusional response curve and eye-blinks. Digital Signal Processing (DSP), 17th International Conference on; (2011) Aug. |
[88] | Bang J , Heo H , Choi JS , Park K . Assessment of Eye Fatigue Caused by 3D Displays Based on Multimodal Measurements. Sensors-Basel. (2014) ;14: :16467–85. |
[89] | Wang Y , Zhai G , Chen S , Min X , Song X . Assessment of eye fatigue caused by head-mounted displays using eye-tracking. Biomed Eng Online. (2019) ;18: :111. |
[90] | Hirota M , Kanda H , Endo T , Miyoshi T , Miyagawa S , Hirohara Y , et al. Comparison of visual fatigue caused by head-mounted display for virtual reality and two-dimensional display using objective and subjective evaluation. Ergonomics. (2019) ;62: :759–66. |
[91] | Kim J , Kim W , Ahn S , Kim J , Lee S . Virtual Reality Sickness Predictor: Analysis of visual-vestibular conflict and VR contents: IEEE; (2018) . pp. 1–6. |
[92] | Yong C , Park , Namyi , Gu , Chi-Yeon , Lim , et al. The effect of Vaccinium uliginosum extract on tablet computer-induced asthenopia: randomized placebo-controlled study. Bmc Complem Altern M. (2016) ;16: (1), 1–9. |
[93] | Liao CY , Tai SK , Chen RC , Hendry . Using EEG and Deep Learning to Predict Motion Sickness Under Wearing a Virtual Reality Device. Ieee Access. (2020) ;PP:1. |
[94] | Sebok A , Nystad E , Droivoldsmo A . Improving safety and human performance in maintenance and outage planning through virtual reality-based training systems. IEEE. (2002) :8–14. |
[95] | Mustonen T , Berg M , Kaistinen J , Kawai T , H Kkinen J . Visual task performance using a monocular see-through head-mounted display (HMD) while walking. Journal of Experimental Psychology Applied. (2013) ;19: :333–44. |
[96] | L S , D H , S E . Differential effects of head-mounted displays on visual performance. Ergonomics, Taylor & Francis. (2014) ;1: :1–11. |
[97] | Shi Y , Du J , Zhu Q . The impact of engineering information format on task performance: Gaze scanning pattern analysis. Adv Eng Inform. (2020) ;46: :101167. |


