
Towards optimized breast cancer 3D spheroid mono- and co-culture models for pharmacological research and screening
Abstract
BACKGROUND:
Reproducibility and physiological relevance are essential features for test systems used in preclinical cancer drug development. In this context, 3D cell culture models like spheroids or organoids have recently become attractive due to their potential of mimicking native biology. Further, to increase screening throughput and effectiveness, full automation of sample preparation and data analysis is important.
OBJECTIVE:
This work addressed methodological factors of spheroid cell culturing that are of particular relevance for reproducibility and physiological significance in studies investigating metabolic effects of drug treatment, including media composition, extracellular matrix, addition of stromal cells, and the quality of contrast-based readouts.
METHODS:
Using standardized and enriched media as well as additional basal membrane extract, spheroids were made from MCF10A human breast epithelial cells and MDA-MB-231 human breast cancer cells. In addition, co-culture spheroids of MDA-MB-231 with CCD-1137Sk human fibroblast cells were prepared. Samples were compared in terms of metabolic behaviour. Spheroid analysis employed SpheroidSizer software, confocal microscopy, and Western blotting.
RESULTS:
Media composition, supportive additives and the co-culture situation can massively alter the growth and metabolic behaviour of spheroids. In particular, spheroid integrity was affected by the presence of extracellular matrix components and upon long-term culturing. Due to drug- or culture-induced spheroid disintegration, automated spheroid size analysis data needed careful evaluation.
CONCLUSION:
Media composition, extracellular matrix, addition of stromal cells, and automated readouts are important parameters for standardized spheroid-based drug screening approaches. Contrast-based spheroid size analyses in automated high-throughput screenings need special attention, since spheroid-disaggregation or proliferation of surrounding cells may sophisticate the readouts.
1Introduction
Reproducibility and physiological relevance are particularly important for successful preclinical cancer drug development and the basis of efficient clinical trials for drug launches. Unfortunately, the number of approvals per drug entering phase-I clinical studies continuously decreased from 17% between 1995 and 2000 [1] to 5% in 2013. In that year, 409 drugs were approved while 7,872 were entering clinical studies. Presumably, owing to enhanced efforts in early stages of drug development, e.g. by augmented usage of biomarkers in drug target screenings, the success rate was recently increasing again, reaching 13.8% in 2015 with 733 approvals out of 5,315 clinical candidates [2]. However, the average cost and time for the development of a novel marketable oncologic drug have still been rising recently to 757 million USD and 7.3 years (range 5.8–15.2 years), respectively [3]. These numbers show the high potential for improvements in drug development pipelines. In addition, reproducibility and comparability would also be desirable in basic and applied research. However, highly specialized methods are often used in research studies, thus, creating issues in comparing their outcomes.
In 1973, the MDA-MB-231 cell line was derived from a triple-negative female breast cancer patient upon metastatic relapse that had followed mastectomy four years earlier. These cells exhibit a moderate doubling time compared to other breast cancer cell lines [4] and since then their culturing has been performed using several different media compositions without a clear standardization. Originally, Leibovitz L15 medium with 15% fetal calf serum (FCS), insulin, glutathione and gentamicin was used for cultivating MDA-MB-231 cells at 37°C in air [4]. While the usage of 5% CO2 has become a standard, media composition is still diverse including alterations in FCS concentration (10–20%), supplementation with insulin (0–10 μg/mL), glutamine (0–2 mM) and antibiotics (carbenicillin, gentamicin, amphotericin, penicillin, streptomycin). Also, the basal media have changed from Leibovitz L-15 to more common variants like DMEM or RPMI1640 [5–9]. However, also their composition can be variable from supplier to supplier as they might contain additional amino acids, including L-glutamine [10, 11]. Finally, there is an acknowledged variability in the added serum, which in MDA-MB-231 cultures is mostly FCS. This could easily influence cellular behavior [4], since serum contains crucial factors altering proliferation [12], differentiation [13], and attachment [14] of cells. As complex natural compounds, sera display an intrinsic variance [15].
Co-culturing of different cell lines affects the availability of signals and factors and therefore influences cell survival and differentiation [16]. It has been known since the 1960 s [17], that cell-cell interactions can alter cell cultures in vitro. Thus, to better recapitulate the physiological situation in cell culture models, co-cultures have always been a desirable experimental approach. However, mono-cultures are more easy to standardize and therefore more widely used to evaluate, for example, proliferative effects [18], drug sensitivity of a tissue entity [19], or the metastatic potential of cancer cells [20]. Conversely, co-culturing can reveal important cell-cell communication, leading to unexpected cellular responses compared to controls with single cell types [21]. For example, co-cultures of osteoblasts with peripheral blood mononuclear cells led to segregation of extracellular matrix components which allowed to replace growth factor supplementation for bone regeneration [22]. In co-cultures of fibroblasts and cancer cells, targeting the tumor microenvironment instead of the cancer cells alone led to improved treatment results [23]. This suggests that also cancer-associated fibroblasts which support tumor cells by providing metabolites and altering the tissue composition [24–26], should be considered as drug targets.
While 2D cell culture models were preferred for decades due to their easy and cheap preparation, 3D cell culture models have lately experienced rising interest since they promise to better mimic the physiological conditions [27]. In particular, in 3D cultures, the access of nutrients and oxygen [28], cellular interactions [29], mechanistic support [30], and the permeability of drugs [31–33] are more similar to that in tumors than in classical 2D cultures. Therefore, these aspects profit from investigations in three dimensions [34].
Due to their sensitivity against mechanical stress, spheroid cultures are often hard to cultivate for long time periods [35]. Also, they typically exhibit disseminating or dissociated cells not contained within the core spheroid [36]. This is strongly dependent on the method used to develop the 3D structure of the cultures [37]. Finally, three-dimensional cell culture in general has two major drawbacks: it is more time consuming and expensive compared to 2D cultivation [38]. For this reason, operative automation is desired. Depending on the size of enterprise, this involves cell culture handling, drug treatment, data acquisition, and segmentation-based data evaluation. While data quality is increasing continuously, automated 3D readouts based on 2D data achieved with widefield microscopy can lead to erroneous data interpretation. For example, the calculation of spheroid size based on simple image thresholding might overlook effects of cellular dissemination and spheroid disintegration [39–41].
2Materials and methods
2.1Cell culture
MDA-MB-231 human breast cancer cells were passaged in MDA-MB-231 medium (MDA-M) consisting of Dulbecco’s Modified Eagle Medium (Capricorn, DMEM-HPA, Lot# CP18-2096) supplemented with 10% fetal bovine serum (Capricorn, FBS-12B, Lot# CP16-1422), 1% Minimum Essential Medium Nonessential Amino Acids (Capricorn, NEAA-B, Lot# CP17-1726) and 1% penicillin/streptomycin (Capricorn, PS-B, Lot# CP18-2207). CCD-1137Sk human foreskin fibroblasts were passaged in IMDM containing Iscove’s Modified Dulbecco’s Medium (Capricorn, IMDM-A, Lot# CP18-2245) supplemented with 10% FBS-12B and 1% PS-B. MCF10A media (MCF-M) consisted of Dulbecco’s Modified Eagle’s Medium/Nutrient Mixture F-12 Ham (Sigma-Aldrich, D8062-500 mL, Lot# RNBG3907) supplemented with 5% horse serum (Gibco, Gibco HI Horse Serum, #26050088), 20 ng/mL epidermal growth factor (Miltenyi, EGF, #130.093.825), 500 ng/mL hydrocortisone (Sigma, H-0888, Lot# 86H04185), 100 ng/mL Cholera Toxin (Sigma, C8052-0.5MG, Lot# 116M4078), 10 μg/mL Insulin (SAFC, 91077C-1G, Lot# 16A145-C) and 1% PS-B. All cell lines were passaged at 80% confluency and seeded with 1×10⁶ cells per T75 flask for MDA-MB-231 and CCD-1137Sk, and with 5×10⁶ cells for MCF10A. Spheroid formation was achieved using 96-well spheroid microplates (Corning, Ref 4520, Lot# 04618014) through adding the appropriate number of cells and centrifugation for 6 min at 500 rcf. If needed, 2.5% of basement membrane extract (BME/Cultrex, PathClear No. 3432-005-01, Lot# 41651B18) were added directly after the cells before centrifugation. For each data point, 12 replicates were made.
2.2Brightfield microscopy and spheroid size evaluation
Brightfield pictures for spheroid size estimation were captured with an Axiovert 25 (Zeiss, objective CP-ACHROMAT, 5x/0.12Ph0). For further processing, the images were exported in TIFF format and analyzed with MATLAB using the SpheroidSizer software [41].
2.3Immunostainings and confocal microscopy
Cell Cultures were fixed for 30 min in 4% paraformaldehyde (PFA) in phosphate-buffered saline (PBS). After permeabilization with 0.4% Triton-X100 in deionized water, the samples were blocked with 3% bovine serum albumin fraction V (BSA) in deionized water. Primary antibody incubation was performed over night at 4°C. After washing with PBS, secondary antibodies together with dyes were applied for 2 h at room temperature. Dyes used were 2-(4-Amidinophenyl)-6-indolecarbamidine dihydrochloride (DAPI/Roche, 10236276001, Lot# 28114320) at 1:1000 dilution and wheat germ agglutinin was diluted 1:500 (WGA/Biotium, CF488A, # 29022). Primary antibodies were used against PTEN (Proteintech, AB9260, Lot# 2; 1:100), LC3 (CellSignalling, 3868 S, Lot# 11; 1:200), MCT4 (SantaCruz Biotechnology, sc-376140, Lot# D3018; 1:400), KI67 (Merck, AB9260, Lot# 3094997; 1:500). Secondary antibodies goat anti-Mouse alexa fluor 488 (Invitrogen, A11001, Lot# 1834337) and goat anti-Rabbit 647 (Invitrogen, A21246, Lot# 55002A) were diluted 1:1000. Confocal microscopy was performed with an inverted Leica SP8 (Leica Microsystems) equipped with HC PL APO 20×/0.75 IMM CORR and HC PL APO CS2 63×/1.2 W CORR objectives. The visualization was achieved with the Leica LAS-X 3.3.0 software suite and the image capturing was set to 1024×1024 pixels resolution with 3 times frame average and a pinhole of 1 airy units. Z-step size in 3D stacks was 1 μm. All images used for direct comparison were taken at the same day with identical settings of laser, gain and pinhole. For the quantification of specific signals, the overall intensity divided by the total area was normalized on the supplement-rich MCF-M without added BME while seeding.
2.4Western blotting
Protein extraction was achieved with 1 h incubation of trypsinated cells in lysis buffer (50 mM Tris-HCl, 150 mM NaCl, 1% NP-40 (AppliChem, A1694) with 10% glycerol, 1 mM EDTA, 1 mM EGTA, 1x protease inhibitor cocktail (Roche, #88665) and 0.5 mM PMSF (AppliChem, A0999) on ice), before heating to 99°C for 7 min after addition of Laemmli buffer. The amount of protein was measured with a BCA assay (ThermoScientific, 23225, Lot# SI256196) and 30 μg of each probe were subjected to a 10% SDS-PAGE followed by Western blot analysis. The used primary antibodies were specific for light-chain 3 (1:1000/LC3/rabbit anti-LC3B mAb/Cell Signaling, #3868 S, Lot# 11) or Glyceraldehyde-3-phosphate dehydrogenase (1:10000/GAPDH/mouse anti-GAPDH mAb/Thermo Fisher, MA5-15738). Secondary antibodies were diluted 1:10000 and goat anti-rabbit IgG (H+L) HRP (Jackson Immuno Research, 111035003) together with goat anti-Mouse IgG (H+L) HRP (Thermo Fisher, #32430) were utilized. Gels were developed with Western Bright Chemilumineszenz Substrat Sirius (Biozym, 541020, Lot# 180829), pictures captured with a G:Box (Syngene, model Chemi XX6) and evaluated using ImageJ software (v1.48v). Biological triplicates were made and each data point was technically analyzed three times.
2.5Statistics
For statistics, GraphPad Prism 7 was used applying one-way ANOVA and multiple comparison based on the raw data. Normal distribution and homoscedasticity were tested using Kruskal-Wallis and F-test, respectively. All graphs show mean values and standard deviation. Significance was as indicated (*p < 0.05, ****p < 0.0001).
3Results
To evaluate the effect of different media on the spheroid growth of highly metastatic MDA-MB-231 breast cancer cells and non-tumorigenic MCF10A breast gland epithelial cells, media tests were performed with each cell line. These tests included incubation in poorly or richly supplemented MDA-M and MCF-M media, respectively, and in the absence or presence of BME extracellular matrix compound. Brightfield microscopy revealed large differences in all culture conditions. First, MDA-MB-231 spheroids were generally larger and more compact than those made of MCF10A cells (Fig. 1A and C). This was particularly true in the presence of BME, where MDA-MB-231 spheroids were perfectly round and solid (Fig. 1A), while MCF10A cultures formed core spheroids with numerous satellite spheroids around (Fig. 1C). In the absence of BME, spheroids of both cell lines were considerably smaller and the cultures showed numerous disseminated cells. Furthermore, both cell lines displayed the best growth in richly supplemented MCF-M (Fig. 1B and D; Table 1). This data suggests that there is a synergistic effect of ECM components and metabolically relevant supplements on spheroid compactness and growth.
Fig.1
Supplements of media and extracellular matrix components massively alter compactness and growth of breast cancer and epithelial spheroid cultures. MDA-MB-231 breast cancer and MCF10A breast epithelial cells were cultured in ultra-low attachment plates for up to 9 DIV using either rich media designed for MCF10A cells (MCF-M) or poor media for MDA-MB-231 cells (MDA-M) and in the absence or presence of BME. (A) and (C), brightfield micrographs of MDA-MB-231 (A) or MCF10A (C) after 9 DIV. Scale bars, 200 μm. (B) and (D), quantitative analysis of spheroid-areas. Depicted are mean areas±SD as a function of DIV. For each data point, at least 12 spheroids were analysed.
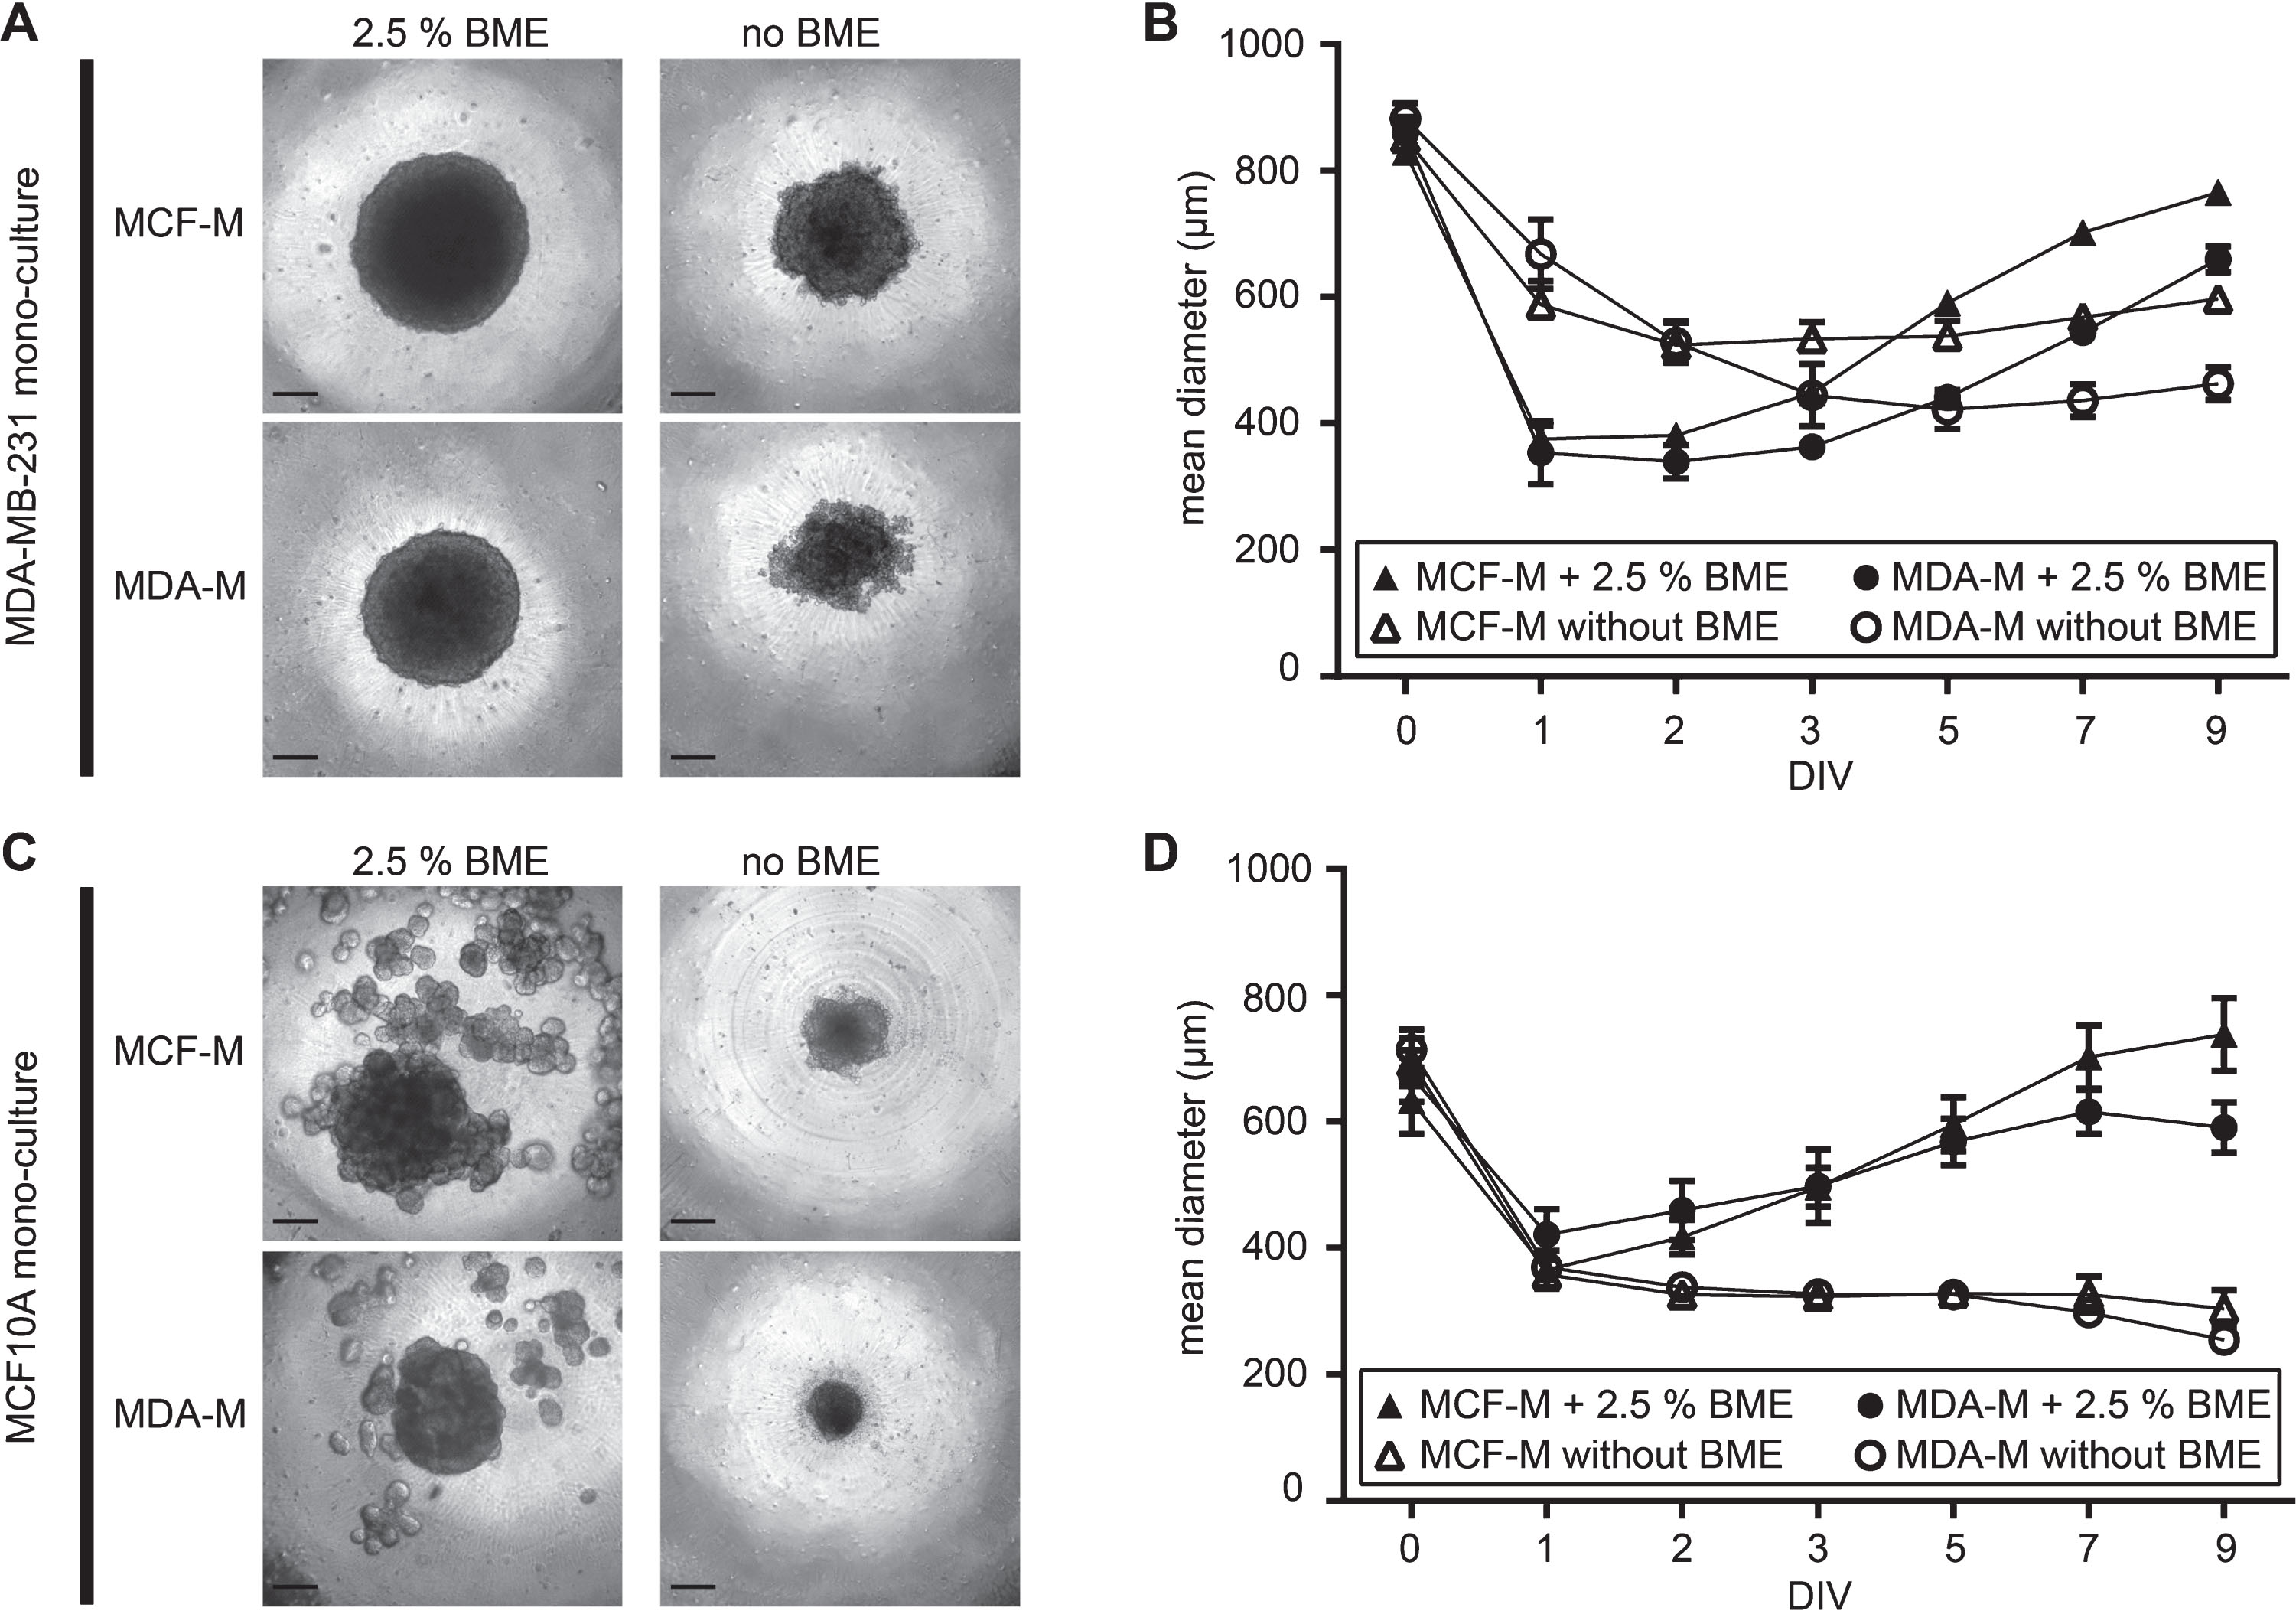
Table 1
Comparison of mean diameters in 3D spheroid cultures at 9 DIV
| MCF10A | ||||
| MCF-M + BME | MCF-M | MDA-M + BME | MDA-M | |
| 738.6±58.0 μm | 303.8±29.4 μm | 590.1±40.7 μm | 254.8±11.2 μm | |
| MCF-M + BME | **** | **** | **** | |
| 738.6±58.0 μm | ||||
| MCF-M | **** | **** | **** | |
| 303.8±29.4 μm | ||||
| MDA-M + BME | **** | **** | **** | |
| 590.1±40.7 μm | ||||
| MDA-M | **** | **** | **** | |
| 254.8±11.2 μm | ||||
| MDA-MB-231 | ||||
| MCF-M + BME | MCF-M | MDA-M + BME | MDA-M | |
| 768.4±15.4 μm | 596.7±20.4 μm | 659.9±19.9 μm | 462.5±26.3 μm | |
| MCF-M + BME | **** | **** | **** | |
| 768.4±15.4 μm | ||||
| MCF-M | **** | **** | **** | |
| 596.7±20.4 μm | ||||
| MDA-M + BME | **** | **** | **** | |
| 659.9±19.9 μm | ||||
| MDA-M | **** | **** | **** | |
| 462.5±26.3 μm | ||||
Spheroid diameters are mentioned in the corresponding condition cell, P-values upon comparison between different culture conditions are shown in crossing fields.
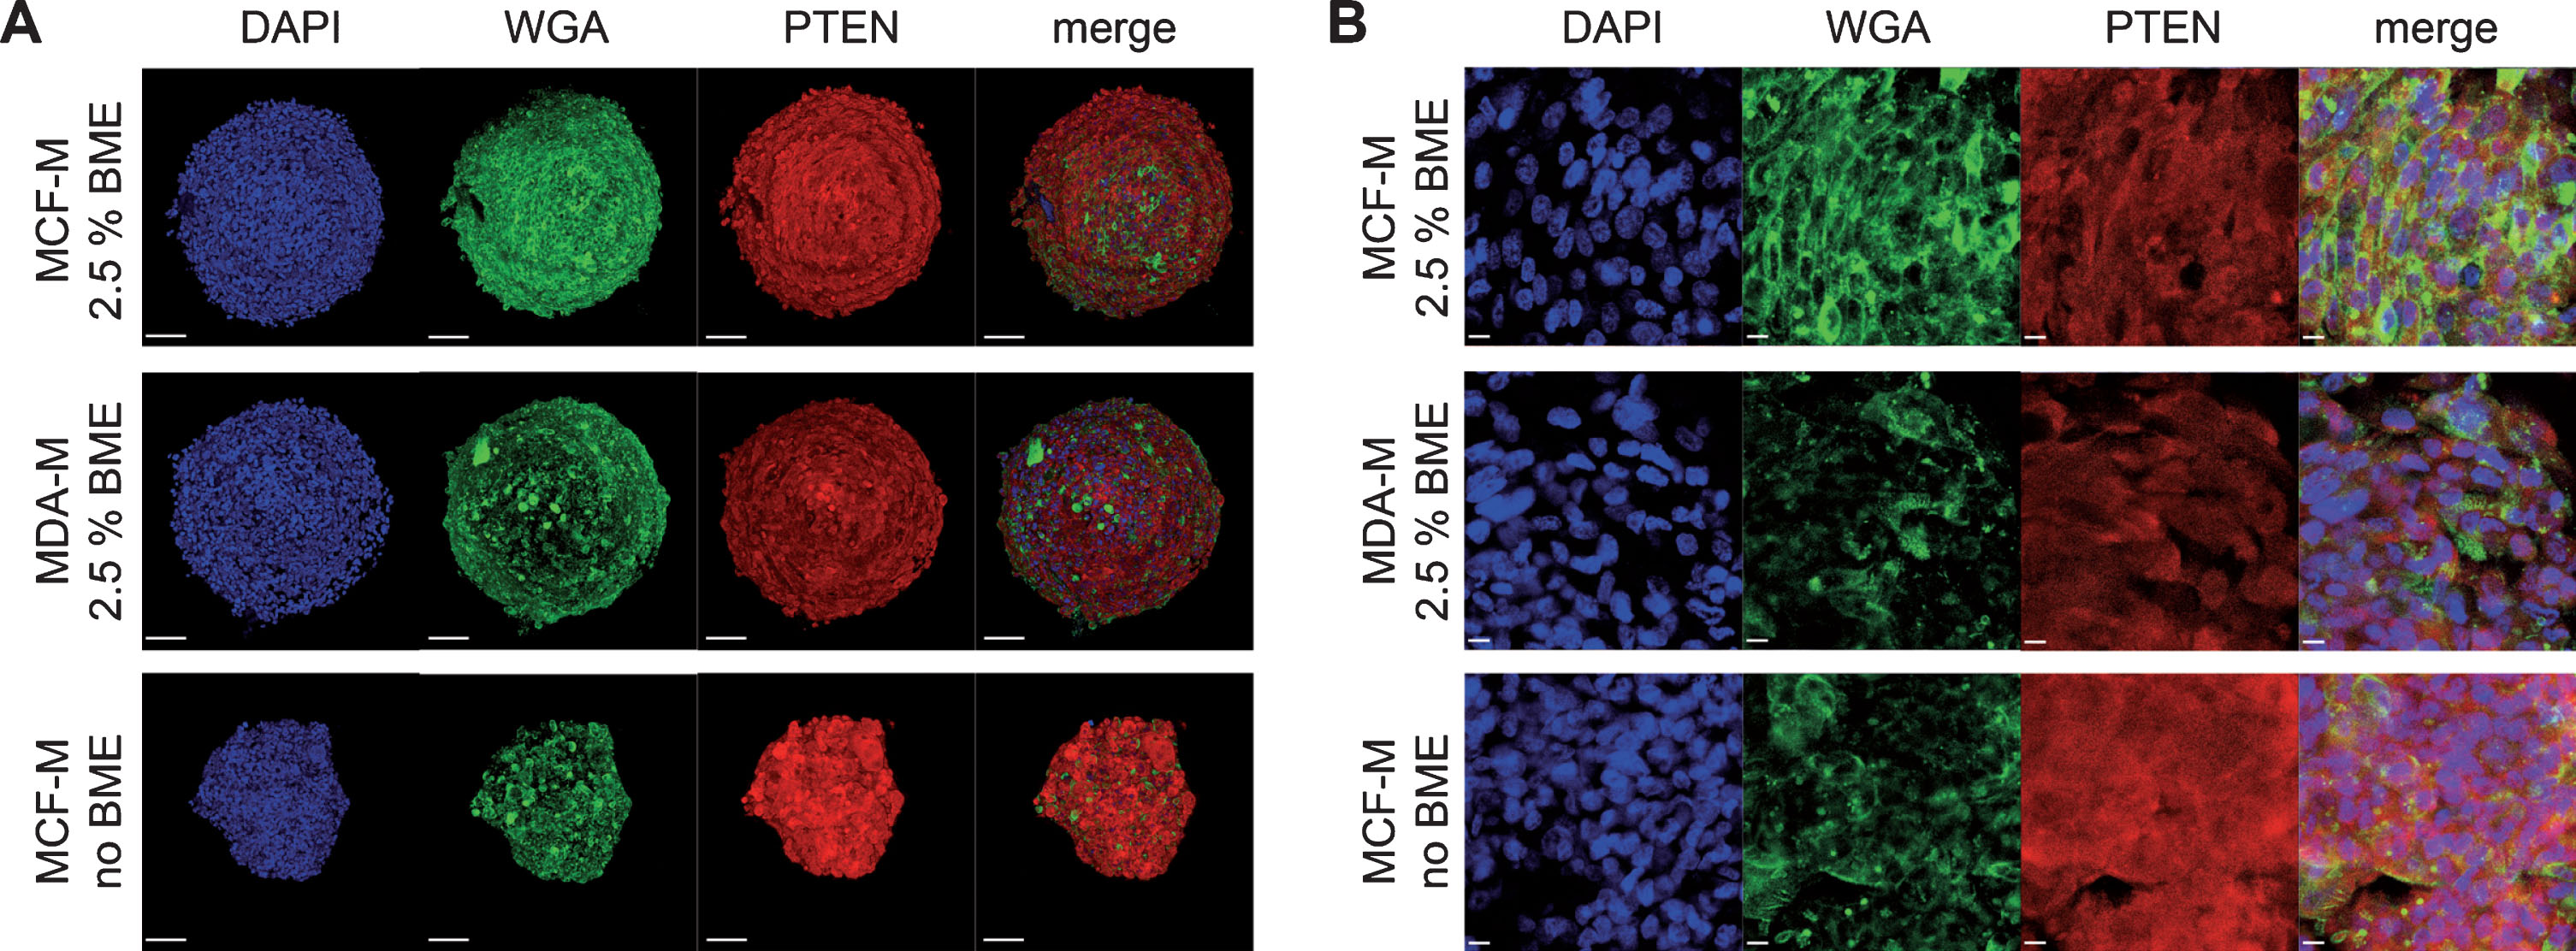
To address the effects of media composition on spheroid growth from a metabolic point of view, MDA-MB-231 spheroids cultured under these different conditions were stained for the marker protein Phosphatase and Tensin Homolog (PTEN). This protein is a negative regulator of the phosphoinositide 3-kinase Akt (PI3K/Akt) signaling pathway and, thus, usually correlating inversely with cellular activity [42]. As expected, immunofluorescence staining of spheroids cultured nine days in vitro (9 DIV) showed different PTEN gene expression levels depending on media composition and presence of BME within the culture (Fig. 2). Quantitative analysis of PTEN fluorescence signal intensity per area revealed the highest values in spheroids cultured in MCF-M without BME. Upon normalization of this data point to 100%, PTEN immunofluorescence signal intensities from cultures in MDA-M or MCF-M with BME reached significantly lower numbers, more precisely 37.2% ±4.4% (mean±SD) or 42.0% ±8.1% (mean±SD), respectively. In summary, these data suggest that in MDA-MB-231 spheroids PTEN expression is positively and negatively affected by metabolically active supplements and by BME, respectively.
Fig.2
Addition of BME strongly alters PTEN expression level in MDA-MB-231 spheroids. MDA-MB-231 cells were cultured in ultra-low attachment plates for 9 DIV using either rich media designed for MCF10A cells (MCF-M) or poor media for MDA-MB-231 cells (MDA-M) and in the absence or presence of BME. Then, whole mount spheroid staining was done using DAPI, WGA, and anti-PTEN antibodies to label nuclei (blue), cell membranes (green), and PTEN protein (red). Spheroids were then imaged using confocal microscopy. Panels depict maximum-z projections (A) or single optical slices (B) from samples as indicated.
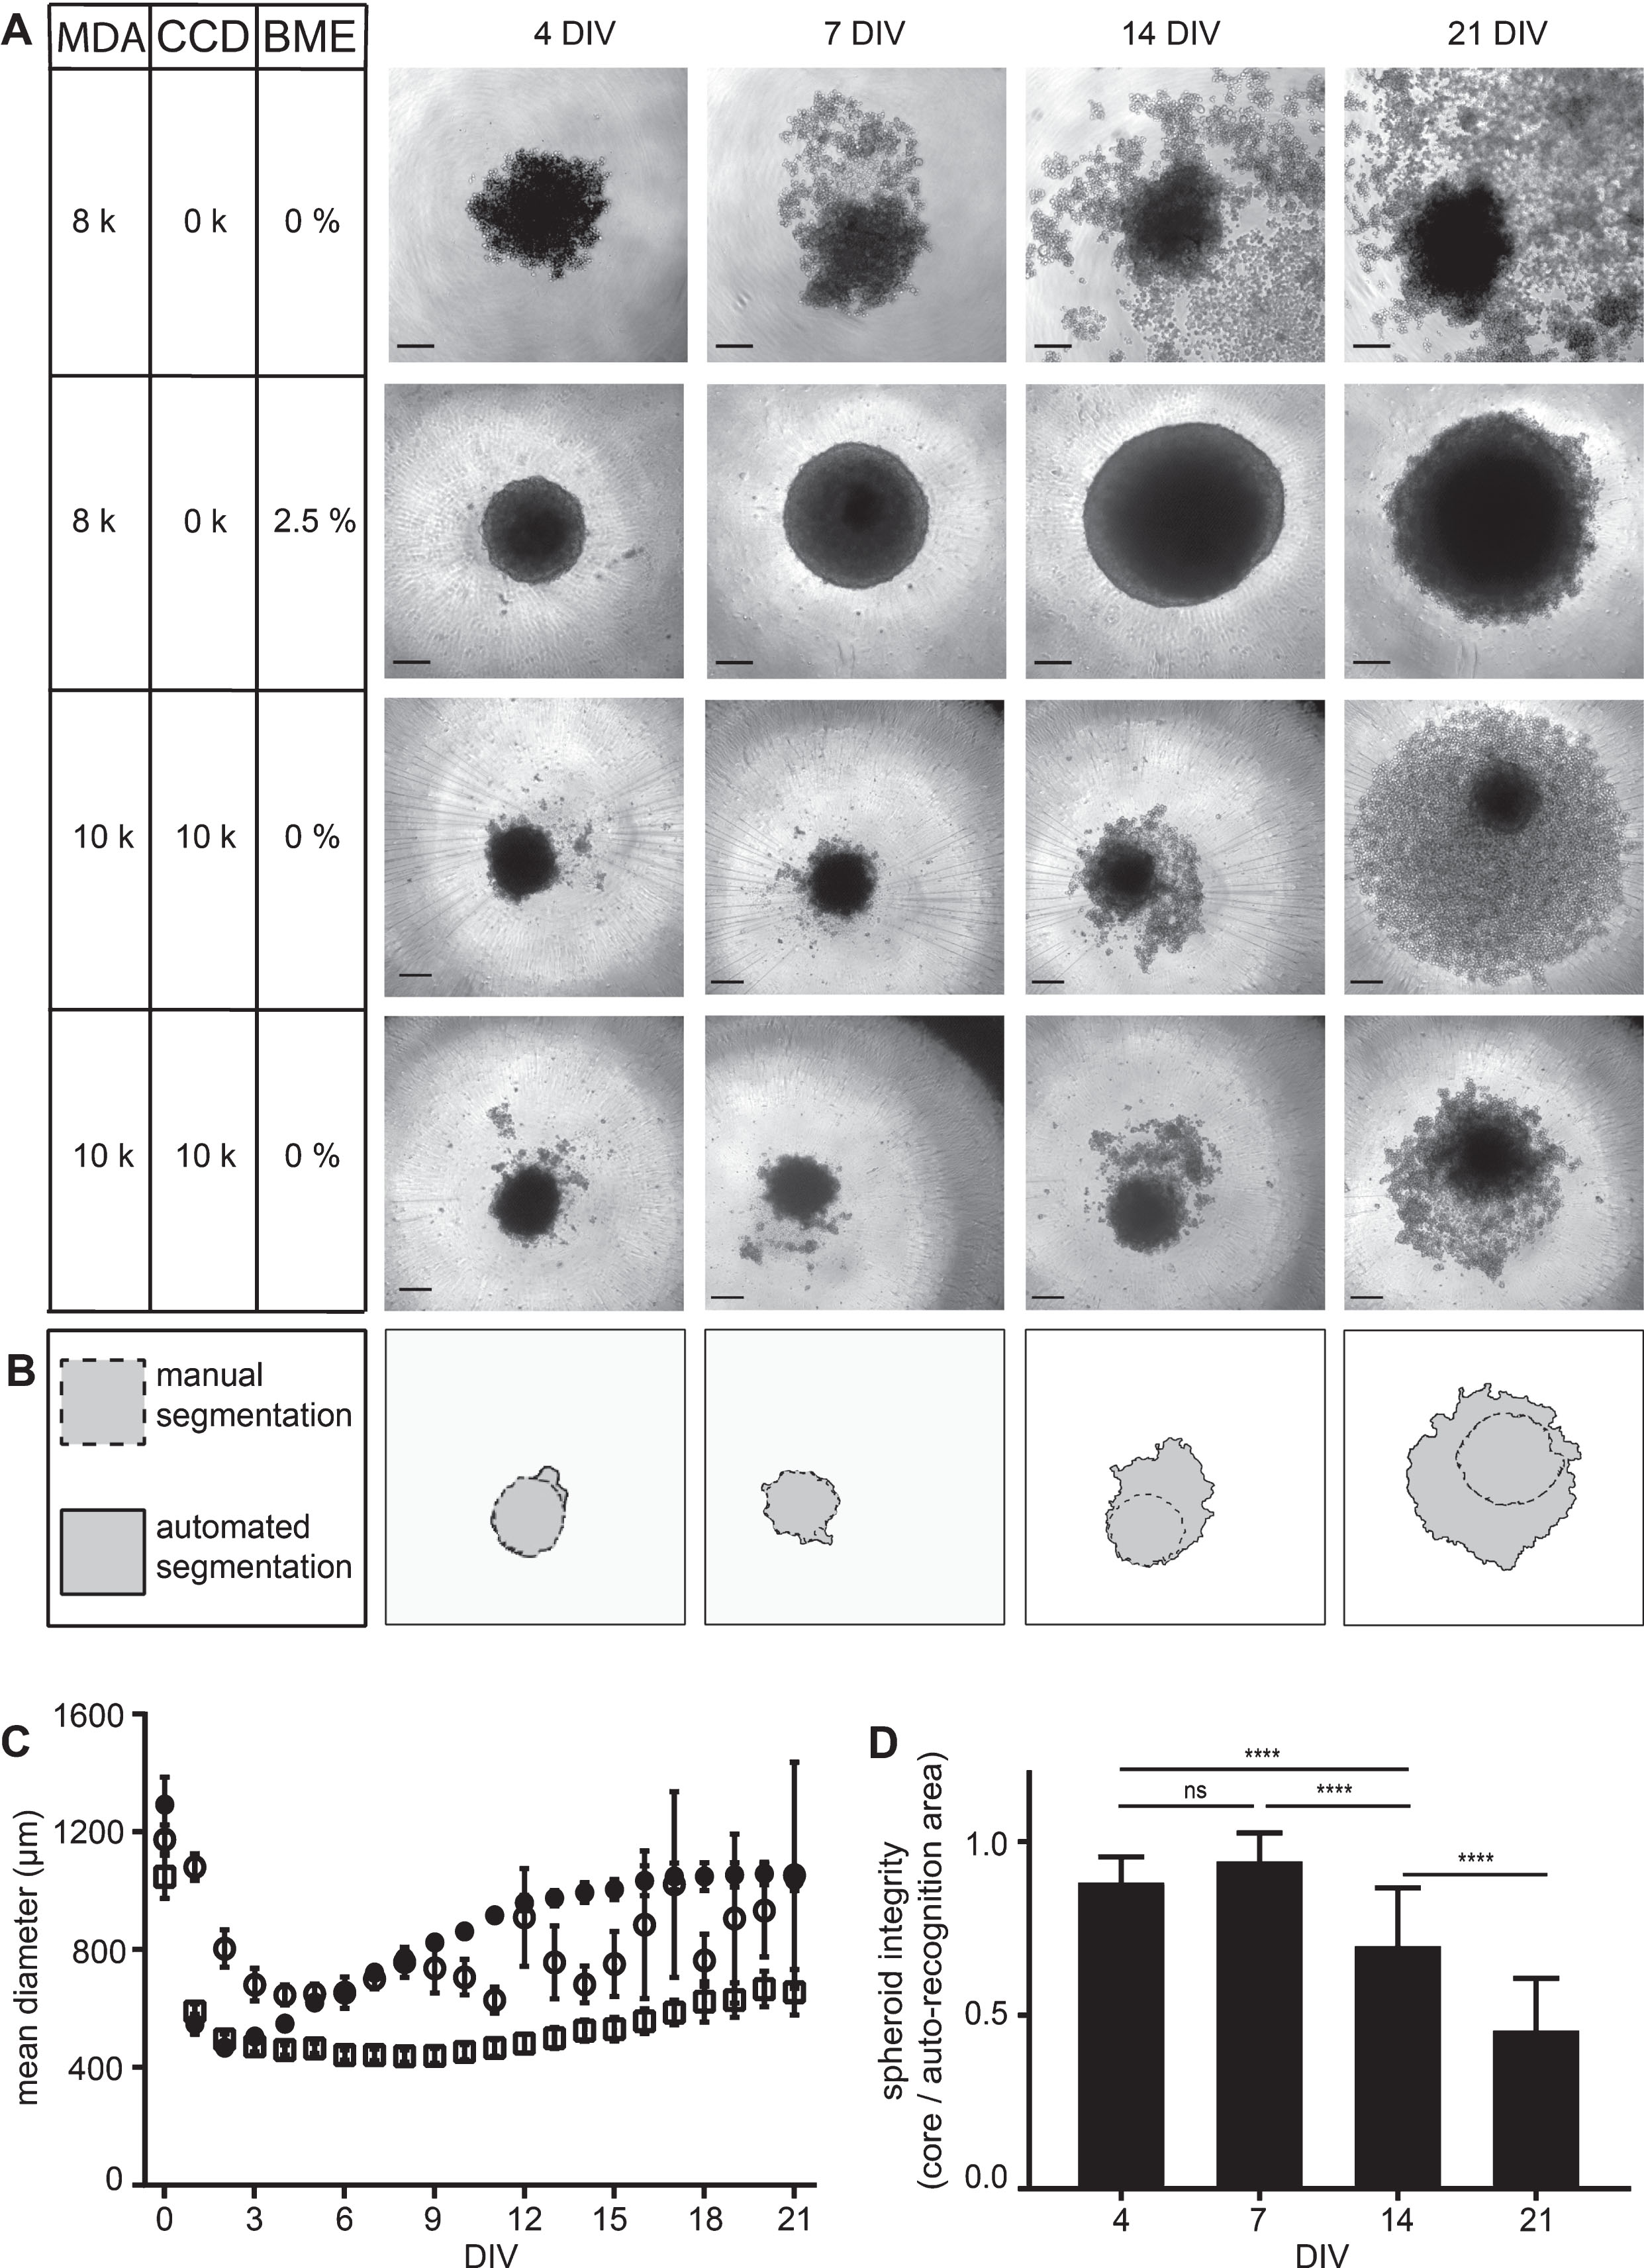
To further deepen the insights into the role of extracellular matrix components on MDA-MB-231 spheroid compactness and to assess the possibility to co-culture these cells with fibroblasts, we next performed comparative assays of MDA-MB-231 mono-cultures and co-cultures with fibroblasts in the presence or absence of BME. To find an experimental paradigm that allows quantitative comparisons, we first looked for seeding densities delivering approximately equal spheroid areas right after the condensation and just before the linear growth phase, i.e. at 4 DIV. From 125 to 16,000 seeded cells per well were tested. Notably, for all used cell densities, co-cultures of MDA-MB-231 cells with fibroblasts were smaller than corresponding MDA-MB-231 mono-cultures using the same amounts of MDA-MB-231 cells. This revealed an ideal seeding density of 8,000 cells per well in mono-cultures and 10,000 cells per type for co-cultures of MDA-MB-231 and CCD-1137Sk (thus, a total of 20,000 cells). A detailed view on spheroids after 4, 7, 14, and 21 DIV revealed clear differences in long-term cultivation (Fig. 3A). While MDA-MB-231 mono-cultures supplemented with BME generated firm and stable spheroids with consistent growth for at least two weeks (Fig. 3A and C), MDA-MB-231 plus fibroblast co-cultures also supported spheroid formation in the absence of BME (Fig. 3A), but albeit the higher initial seeding density, the co-culture spheroids were growing more slowly and into significantly smaller cores (Fig. 3C) with many surrounding disseminating cells (Fig. 3A). In the absence of BME, mono-culture spheroids were fragile and also showed many disseminating or dissociated cells (Fig. 3A). As a consequence of the observed dissemination or dissociation effects, automated spheroid area recognition based on the contrast of brightfield pictures indicated larger spheroid areas compared to manual segmentation in these two conditions (see Fig. 3B for an example of co-culture analysis). This difference between core spheroid and surrounding dissociated cells increased as a function of DIV. Thus, the spheroid integrity defined as manually segmented core spheroid area divided by automatically segmented area significantly decreased over time, especially for co-cultures (Fig. 3D) and mono-cultures in the absence of BME (data not shown).
Fig.3
MDA-MB-231 spheroid integrity is preserved in the presence of BME and partially also achieved by co-culturing with CCD-1137Sk fibroblasts. MDA-MB-231 breast cancer cells were either cultured alone in ultra-low attachment plates for up to 21 DIV using MDA-M in the absence or presence of BME or in co-culture with CCD-1137Sk human fibroblasts in the absence of BME. (A) Brightfield micrographs of spheroids at 4, 7, 14, and 21 DIV under culture conditions as indicated with cell lines MDA-MB-231 (MDA) and CCD-1137Sk (CCD) supplemented with basal membrane extract (BME). For co-cultures, two data sets are shown to illustrate the variability in spheroid disintegration. Scale bars, 200 μm. (B) Difference between automated (solid outline) and manual segmentation (dashed outline) using SpheroidSizer as illustrated on the lower panels in (A). (C) Quantiative analysis of spheroid diameters as a function of DIV. Depicted are mean values±SD. For each data point, at least 12 spheroids were analysed. (D) Quotient of manually versus automatically segmented spheroid areas as a measure of spheroid integrity. Depicted are mean values±SD. For each data point, at least 40 spheroids were analysed.
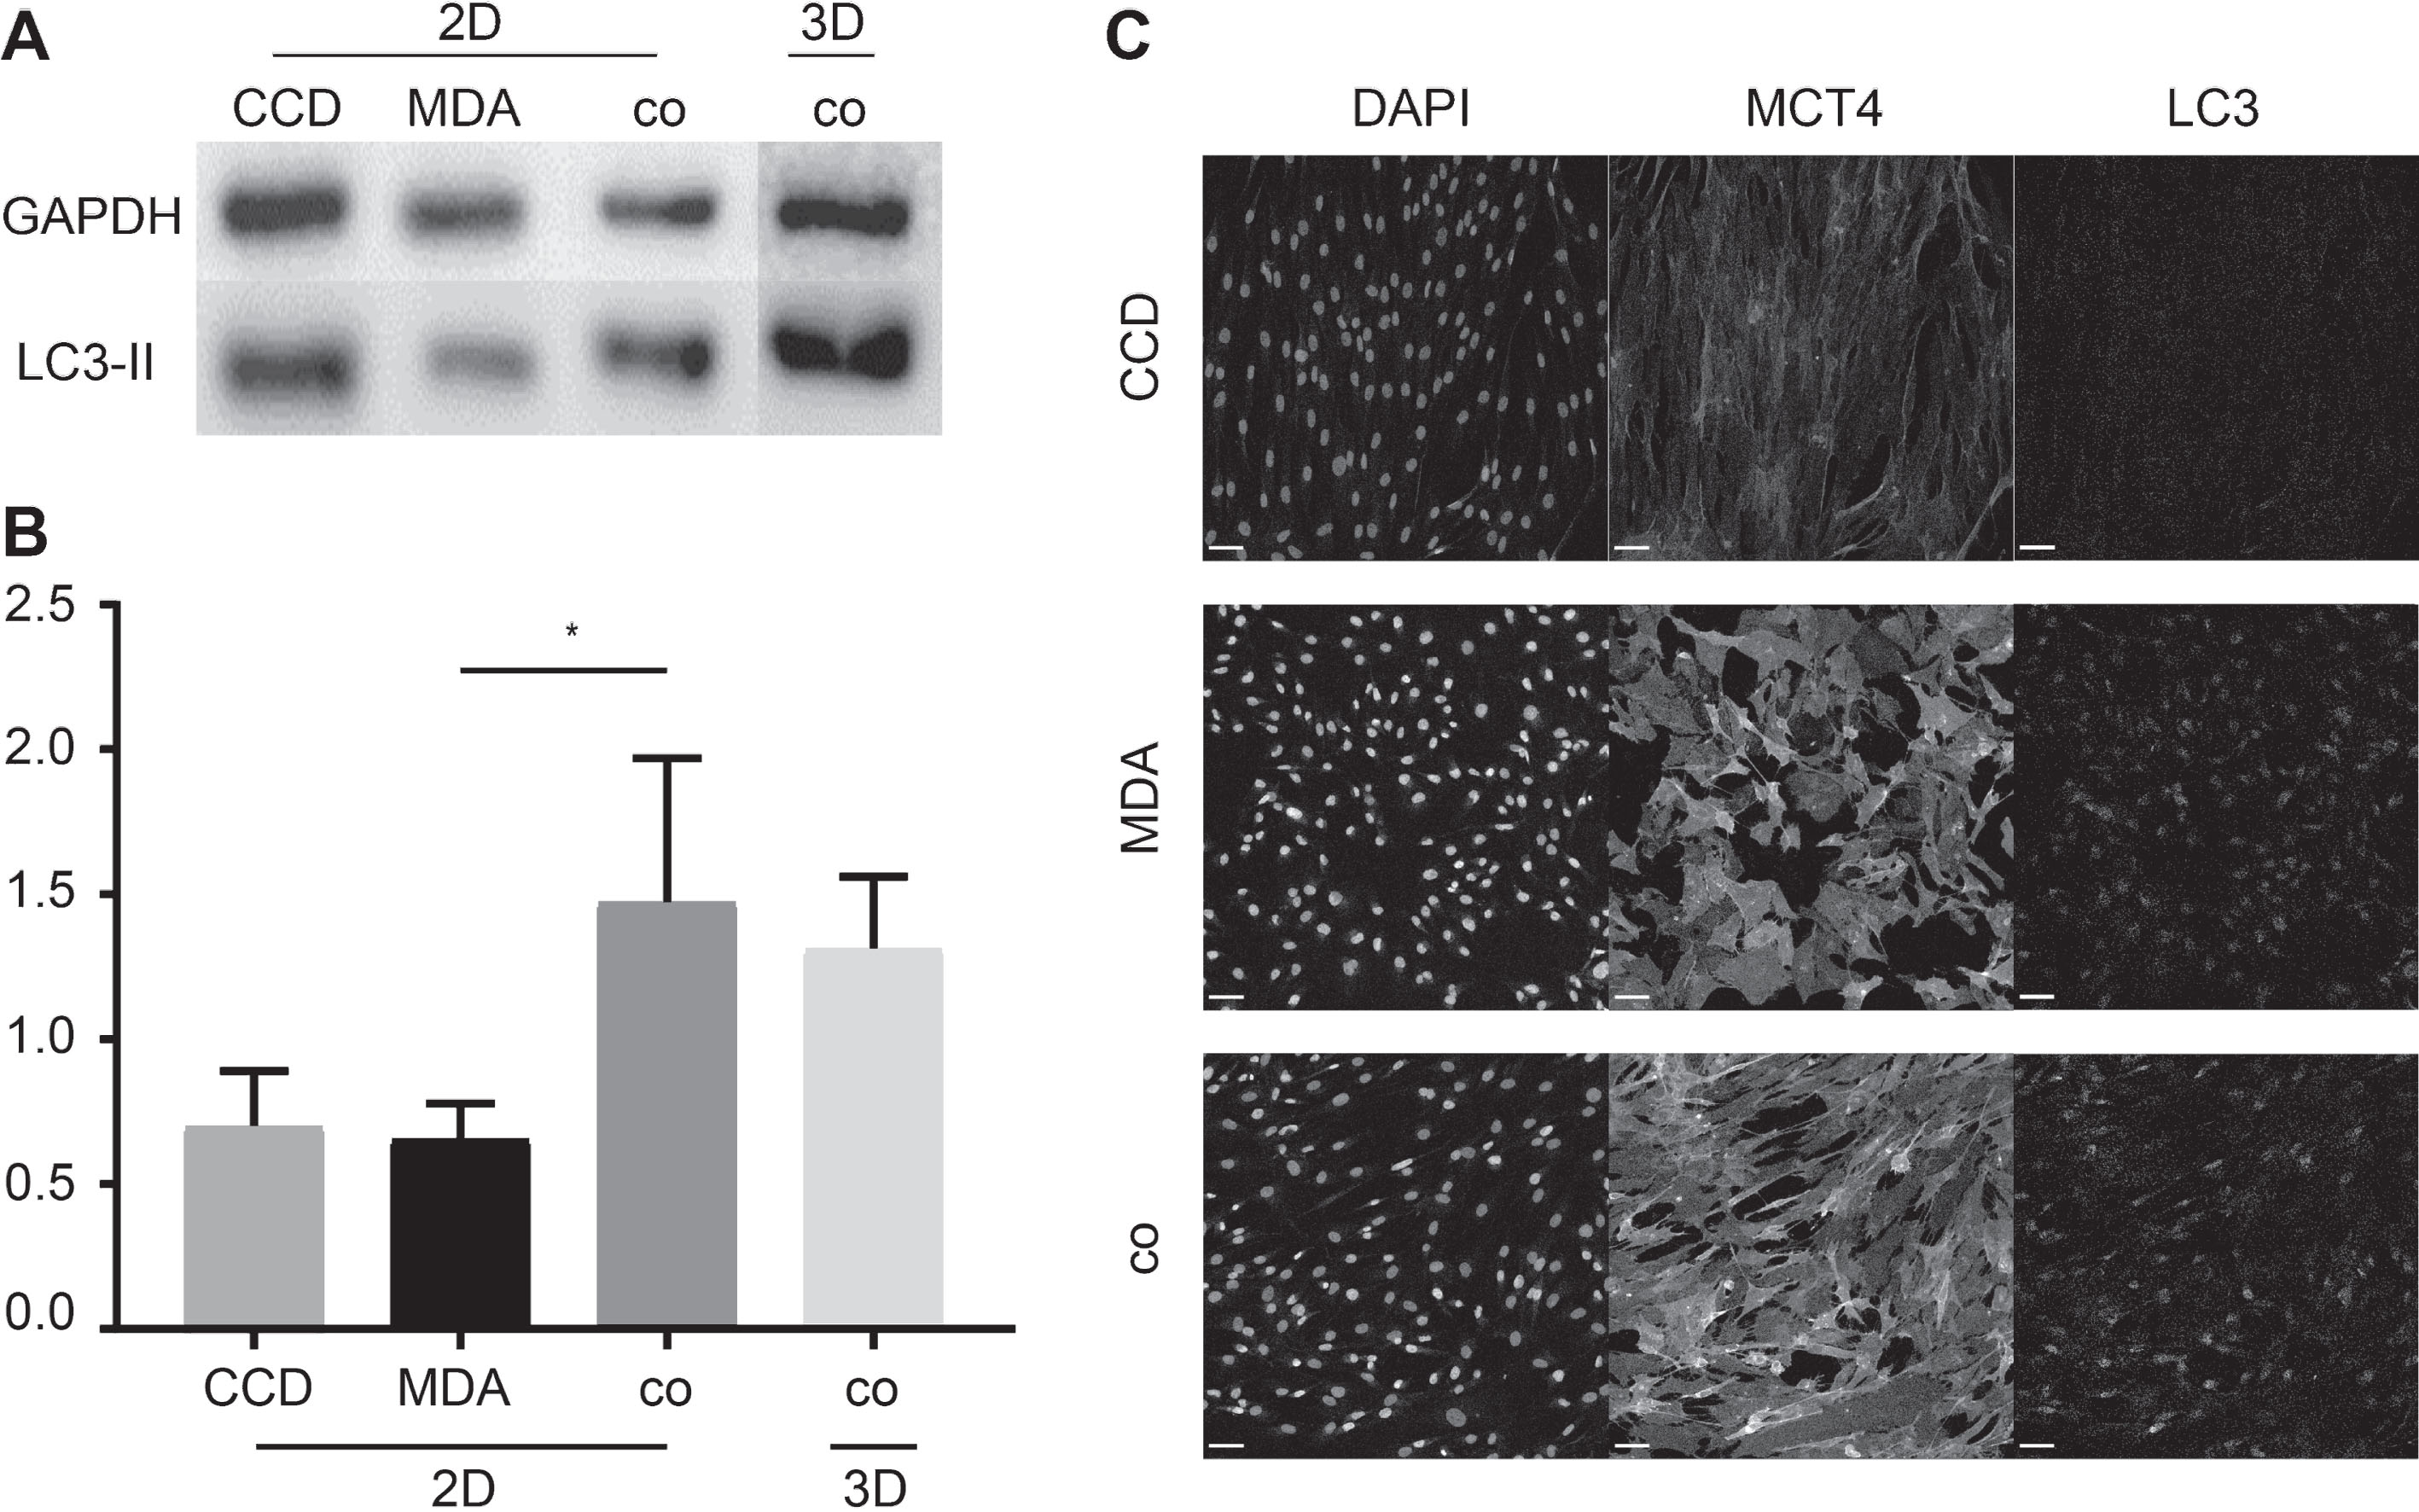
To investigate, whether co-culturing also affected metabolic characteristics, we compared the autophagic activity in MDA-MB-231 mono-cultures to that of MDA-MB-231 plus fibroblast co-cultures. Upon normalization to the loading control GAPDH, Western blot analysis of MDA-MB-231 and CCD-1137Sk in 2D mono- and co-cultures yielded altered LC3-II bands (Fig. 4A). LC3-II is a principal active component in cells that undergo autophagy [44]. This finding was confirmed by quantitative analysis, where MDA-MB-231 cells and fibroblasts in mono-culture resulted in ratios of 0.66±0.02 and 0.72±0.01 respectively, whereas co-cultivation of these cell types resulted in ratios of 1.47±0,05 in 2D and 1.31±0.03 in 3D spheroid cultures (Fig. 4A and B). Immunofluorescence staining of LC3 and a marker of enhanced lactate shuttling, i.e. MCT4, corroborated the Western blot data. Fluorescence micrographs from the co-culture model showed the highest LC3 and MCT4 signals, followed by cancer cells in mono-culture and fibroblasts (Fig. 4C) with relative signal intensities of 60.4±6.9% (MDA-MB-231) or 40.8±4.4% (fibroblasts) for LC3 and 68.4±6.7% (MDA-MB-231) or 24.2±3.2% (fibroblasts) for MCT4.
Fig.4
Co-cultures of MDA-MB-231 and CCD-1137Sk cells exhibit higher levels of LC3-II and MCT4 expression. MDA-MB-231 breast cancer cells and CCD-1137 fibroblasts were either cultured alone as adherent cultures (2D) or co-cultured in 2D (2D) or in ultra-low attachment plates (3D) for 4 DIV. Then, cells were analysed by Western blot (A-B) or immunofluorescence (C). (A) Representative Western blot bands upon staining against LC3-II or GAPDH. (B) Quantitative analysis of LC3-II band intensities upon normalization to GAPDH. Depicted are mean + SD. At least 3 experimental replicates were made. (C) Confocal images of representative 2D regions stained for nuclei (DAPI), MCT4, and LC3. Scale bars, 100 μm.
4Discussion
Tissue-specific cell culture models are crucial for phenotypic drug screenings. In this context, co-culturing cancer cells with stromal cells can increase the physiological relevance of such models, e.g. to achieve different cellular sub-populations that may affect proliferation rates or drug resistance within the whole culture [45, 46]. Furthermore, 3D cultures are often considered to better mimic the physiological conditions [47]. Here, we addressed aspects that can help to avoid unwanted heterogeneity of data between different experimental 3D cell culture paradigms. This showed that media composition, supportive additives, the co-culture situation, and post-processing data analysis are critical features in the setup of 3D cancer cell models.
First, we focused on the establishment of breast-tissue specific 3D spheroid models made of, either, the human breast cancer cell line MDA-MB-231 [5] or the non-tumorigenic breast epithelial cell line MCF10A [48]. Identification of a media composition that would be useful for both cell lines would have allowed to co-culture these cells and, thus, to test cell-type specific activities of drugs or other treatments. With respect to spheroid integrity and size, this showed a strong dependency of both cell types on the presence of BME, whereas the supplementation with insulin and metabolism-stimulating factors present in the MCF-M appeared to be less critical but only led to subtle size differences. This suggests, that co-cultures between MDA-MB-231 and MCF10A cells should be possible upon addition of BME, perhaps because this adds important growth stimuli or due to its delivery of extracellular matrix components.
To differentiate between these two options, we continued to culture MDA-MB-231 cells either as mono-cultures using different media compositions and tested their metabolic activity or co-cultured them with fibroblasts that should be capable of supplying extracellular matrix. With respect to the first approach, the data pointed to a negative correlation between the expression of PTEN and the richness of the tested media. Given that PTEN is a known down-regulator of Akt/mammalian target of rapamycin (Akt/mTOR) signaling pathway, which, in turn, is linked to active metabolism, these results appeared counter-intuitive at first sight. However, they might suggest that strong activating external signals could lead to negative feedback mechanisms, e.g. via USP11, which is known to antagonize Akt/mTOR signaling by upregulation of PTEN [49]. This could improve homeostasis and prevent a tissue from consuming its nutrient stock within a short time [50]. Indeed, previous work showed that PTEN expression can be high in early stages of cancer tissue, while in later stages a down-regulation of PTEN compared to PI3K leads to over-activation of the Akt/mTOR pathway supporting tumor growth and metastasis [51]. For the present study, the most important conclusion from these results was the confirmation, that it is crucial to check common media compositions with respect to their effects on metabolic activity before co-culturing different cell lines.
The second point, i.e. the role of extracellular matrix for the formation and growth of MDA-MB-231 spheroids, was investigated using co-cultures with CCD-1137Sk fibroblasts. This yielded mixed results. On the one hand, in the absence of BME, the formation of spheroids was superior in co-cultures of MDA-MB-231 and fibroblasts when compared to MDA-MB-231 mono-cultures. On the other hand, fibroblast co-cultures could not compensate for the lack of BME with respect to speed of formation, roundness, growth, and long-term integrity of spheroids. Indeed, in the absence of BME, co-culture spheroids took longer to condense, grew less and disintegrated more rapidly over time than BME-treated MDA-MB-231 mono-cultures did. This strongly suggests that BME, besides its supply of extracellular matrix components, also delivers further, yet undefined, factors that are beneficial for spheroid morphology. Notably, MDA-MB-231 plus fibroblast co-cultures were smaller than MDA-MB-231 mono-cultures using the same amounts of MDA-MB-231 cells. Indeed, at 4 DIV, co-culture spheroids using 10,000 fibroblasts plus 10,000 MDA-MB-231 cells were just roughly the same size as mono-cultures prepared from only 8,000 MDA-MB-231 cells. Since at this early time point, major effects on cell proliferation might not be expected, there are currently three potential scenarios to explain this observation. First, the co-culture could have led to death of MDA-MB-231 cells, but we could not find signs of many dead cells at 4 DIV. Second, it could be that MDA-MB-231 cells were hindered by the fibroblast cells to integrate into the spheroid culture, but also for this option we have no indication. Finally, fibroblasts might have led to a higher compaction of MDA-MB-231 cells. To get further insights into these questions, a future study might aim at counting cells per type.
Considering the aforementioned uncertainties with co-cultures, one might argue that it is preferable to use MDA-MB-231 mono-cultures for future drug screening studies. However, although spheroid integrity is certainly an important feature for the ease of data extraction (see below), cellular signaling between different cell types might also be of importance for gauging potential drug efficacy in situ. For example, increasing evidence suggests that there is a metabolic interplay between cancer and stroma cells in tumors [52] that might serve as a target for metabolism-specific drugs [53]. One line of research in this field proposes that cellular signaling in tumors can lead to an anabolic switch in stromal fibroblasts, which would result in the production of lactate and its potential export to feed neighboring anabolic cancer cells [54]. This knowledge was recently harnessed for drug-induced metabolic tuning to drive the tumor into a critical energy-depleted state, in which it is more susceptible to low doses of classical chemotherapeutic treatments [55]. Thus, such combination therapies could exploit tumor-specific metabolic alterations for an enhanced therapeutic efficacy and reduced negative side effects by chemotherapeutics. However, in vitro test systems can apparently only mirror such complex interaction if the associating cell types are available. Thus, albeit the aforementioned limitations of cancer-cell-fibroblast co-cultures, these can be necessary for the analysis of such combinatorial effects. Indeed, our experiments showing differential levels of LC3-II, a marker of autophagic activity, and of MCT4, a marker of lactate shuttling, in MDA-MB-231 plus fibroblast co-cultures compared to mono-cultures supported this point.
Finally, as for many other studies, also the presented data on spheroid morphology clearly showed gross differences in spheroid integrity, both, over time as well as when comparing different culture modalities. Therefore, we strongly suggest to consider spheroid integrity as an indicator for spheroid-based data analysis. One way of dealing with the issue of disaggregation and unmet readout quality could be the implementation of random manually analyzed spot tests of core spheroid segmentations. If the integrity drops below a defined threshold value, this would indicate that fully automated analysis using e.g. SpheroidSizer software or other comparable contrast-based algorithms needs to be critically re-evaluated.
Funding
This work was funded by the German Federal Ministry of Research (BMBF) as part of the Innovation Partnership M2Aind (03FH8I01IA) within the framework “Starke Fachhochschulen – Impuls für die Region” (FH-Impuls). At no point in the study did the funding agencies influence the design of the study, the collection, analysis, or interpretation of data, nor the writing of the manuscript.
Author contributions
FK did the experiments and wrote the paper under the supervision of RR and MH that both participated in the studies through help at planning and interpretation of the investigations.
Conflicts of interest
The authors declare no conflict of interest.
Acknowledgments
We thank Richard Schneider and Julia Meier-Hubberten of Merck KGaA, Darmstadt, Germany, for providing the cell line MDA-MB-231 and for many fruitful discussions.
References
[1] | Gilbert J , Henske P , Singh A . Rbuilding Big Pharma’s Business Model: The blockbuster business model that underpinned Big Pharma’s success is now irreparably broken. The industry needs a new approach. In Vivo The Business & Medicine Report. (2003) ;2003. |
[2] | Wong CH , Siah KW , Lo AW . Estimation of clinical trial success rates and related parameters. Biostatistics. (2019) ;20: :273–86. doi: 10.1093/biostatistics/kxx069 |
[3] | Prasad V , Mailankody S . Research and development spending to bring a single cancer drug to market and revenues after approval. JAMA Intern Med. (2017) ;177: :1569–75. doi: 10.1001/jamainternmed.2017.3601 |
[4] | Brinkley BR , Beall PT , Wible LJ , Mace ML , Turner DS , Cailleau RM . Variations in cell form and cytoskeleton in human breast carcinoma cells in vitro . Cancer Res. (1980) ;40: :3118–29. |
[5] | Cailleau R , Young R , Olivé M , Reeves WJ . Breast tumor cell lines from pleural effusions. J Natl Cancer Inst. (1974) ;53: :661–74. doi: 10.1093/jnci/53.3.661 |
[6] | Pozo-Guisado E , Alvarez-Barrientos A , Mulero-Navarro S , Santiago-Josefat B , Fernandez-Salguero PM . The antiproliferative activity of resveratrol results in apoptosis in MCF-7 but not in MDA-MB-231 human breast cancer cells: Cell-specific alteration of the cell cycle. Biochemical Pharmacology. (2002) ;64: :1375–86. doi: 10.1016/s0006-2952(02)01296-0 |
[7] | Hjortoe GM , Petersen LC , Albrektsen T , Sorensen BB , Norby PL , Mandal SK , et al. Tissue factor-factor VIIa-specific up-regulation of IL-8 expression in MDA-MB-231 cells is mediated by PAR-2 and results in increased cell migration. Blood. (2004) ;103: :3029–37. doi: 10.1182/blood-2003-10-3417 |
[8] | Pillé J-Y , Denoyelle C , Varet J , Bertrand J-R , Soria J , Opolon P , et al. Anti-RhoA and anti-RhoC siRNAs inhibit the proliferation and invasiveness of MDA-MB-231 breast cancer cells in vitro and in vivo. Mol Ther. (2005) ;11: :267–74. doi: 10.1016/j.ymthe.2004.08.029 |
[9] | Viola M , Brüggemann K , Karousou E , Caon I , Caravà E , Vigetti D , et al. MDA-MB-231 breast cancer cell viability, motility and matrix adhesion are regulated by a complex interplay of heparan sulfate, chondroitin-/dermatan sulfate and hyaluronan biosynthesis. Glycoconj J. (2017) ;34: :411–20. doi: 10.1007/s10719-016-9735-6 |
[10] | ATCC American Type Culture Collection. Thawing, Propagating, and Cryopreserving Protocol; NCI-PBCF-HTB26 (MDA-MB-231) Breast Adenocarcinoma March 1, 2012. 1st ed. Manassas, VA20110. |
[11] | Cell Biolabs Inc. Product Data Sheet, MDA-MB-231/GFP Cell Line 2009. 1st ed. San Diego, CA 92126. |
[12] | Rozengurt E . Growth factors and cell proliferation. Current Opinion in Cell Biology. (1992) ;4: :161–5. doi: 10.1016/0955-0674(92)90027-A |
[13] | Schuldiner M , Yanuka O , Itskovitz-Eldor J , Melton DA , Benvenisty N . Effects of eight growth factors on the differentiation of cells derived from human embryonic stem cells. Proc Natl Acad Sci U S A. (2000) ;97: :11307–12. doi: 10.1073/pnas.97.21.11307 |
[14] | Barnes D . Assay of cell attachment and spreading factors. Journal of Tissue Culture Methods. (1986) :69–74. |
[15] | Baker M . Reproducibility: Respect your cells! Nature. (2016) ;537: :433–5. doi: 10.1038/537433a |
[16] | Ehret F , Vogler S , Kempermann G . A co-culture model of the hippocampal neurogenic niche reveals differential effects of astrocytes, endothelial cells and pericytes on proliferation and differentiation of adult murine precursor cells. Stem Cell Res. (2015) ;15: :514–21. doi: 10.1016/j.scr.2015.09.010 |
[17] | Slavkin HC , Beierle J , Bavetta LA . Odontogenesis: Cell-cell interactions in vitro. Nature. (1968) :269–70. |
[18] | Noreen A , Rehman A , Aftab S , Shakoori AR . Antiproliferative effect of oxidative stress induced by tellurite in breast carcinoma cells. J Cancer Res Pract. (2019) :68–75. doi: 10.4103/JCRP.JCRP_5_19 |
[19] | Hafner M , Heiser LM , Williams EH , Niepel M , Wang NJ , Korkola JE , et al. Quantification of sensitivity and resistance of breast cancer cell lines to anti-cancer drugs using GR metrics. Sci Data. (2017) ;4: :170166. doi: 10.1038/sdata.2017.166 |
[20] | Liu Y-L , Chou C-K , Kim M , Vasisht R , Kuo Y-A , Ang P , et al. Assessing metastatic potential of breast cancer cells based on EGFR dynamics. Sci Rep. (2019) ;9: :3395. doi: 10.1038/s41598-018-37625-0 |
[21] | Picon-Ruiz M , Pan C , Drews-Elger K , Jang K , Besser AH , Zhao D , et al. Interactions between adipocytes and breast cancer cells stimulate cytokine production and drive Src/Sox2/miR-302b-mediated malignant progression. Cancer Res. (2016) ;76: :491–504. doi: 10.1158/0008-5472.CAN-15-0927 |
[22] | Hammerl A , Diaz Cano CE , De-Juan-Pardo EM , van Griensven M , Poh PSP . A growth factor-free co-culture system of osteoblasts and peripheral blood mononuclear cells for the evaluation of the osteogenesis potential of melt-electrowritten polycaprolactone scaffolds. Int J Mol Sci. (2019) . doi: 10.3390/ijms20051068 |
[23] | Valkenburg KC , Groot AE de , Pienta KJ . Targeting the tumour stroma to improve cancer therapy. Nat Rev Clin Oncol. (2018) ;15: :366–81. doi: 10.1038/s41571-018-0007-1 |
[24] | Martinez-Outschoorn UE , Pavlides S , Whitaker-Menezes D , Daumer KM , Milliman JN , Chiavarina B , et al. Tumor cells induce the cancer associated fibroblast phenotype via caveolin-1 degradation: Implications for breast cancer and DCIS therapy with autophagy inhibitors. Cell Cycle. (2010) ;9: :2423–33. doi: 10.4161/cc.9.12.12048 |
[25] | Wilde L , Roche M , Domingo-Vidal M , Tanson K , Philp N , Curry J , Martinez-Outschoorn U . Metabolic coupling and the Reverse Warburg Effect in cancer: Implications for novel biomarker and anticancer agent development. Semin Oncol. (2017) ;44: :198–203. doi: 10.1053/j.seminoncol.2017.10.004 |
[26] | Pavlides S , Vera I , Gandara R , Sneddon S , Pestell RG , Mercier I , et al. Warburg meets autophagy: Cancer-associated fibroblasts accelerate tumor growth and metastasis via oxidative stress, mitophagy, and aerobic glycolysis. Antioxid Redox Signal. (2012) ;16: :1264–84. doi: 10.1089/ars.2011.4243 |
[27] | Kapałczyńska M , Kolenda T , Przybyła W , Zajączkowska M , Teresiak A , Filas V , et al. 2D and 3D cell cultures - a comparison of different types of cancer cell cultures. Arch Med Sci. (2018) ;14: :910–9. doi: 10.5114/aoms.2016.63743 |
[28] | Breslin S , O’Driscoll L . Three-dimensional cell culture: The missing link in drug discovery. Drug Discov Today. (2013) ;18: :240–9. doi: 10.1016/j.drudis.2012.10.003 |
[29] | Bissell MJ , Rizki A , Mian IS . Tissue architecture: The ultimate regulator of breast epithelial function. Current Opinion in Cell Biology. (2003) ;15: :753–62. doi: 10.1016/j.ceb.2003.10.016 |
[30] | Mason BN , Starchenko A , Williams RM , Bonassar LJ , Reinhart-King CA . Tuning three-dimensional collagen matrix stiffness independently of collagen concentration modulates endothelial cell behavior. Acta Biomater. (2013) ;9: :4635–44. doi: 10.1016/j.actbio.2012.08.007 |
[31] | LaBonia GJ , Lockwood SY , Heller AA , Spence DM , Hummon AB . Drug penetration and metabolism in 3D cell cultures treated in a 3D printed fluidic device: Assessment of irinotecan via MALDI imaging mass spectrometry. Proteomics. (2016) ;16: :1814–21. doi: 10.1002/pmic.201500524 |
[32] | Liu X , Weaver EM , Hummon AB . Evaluation of therapeutics in three-dimensional cell culture systems by MALDI imaging mass spectrometry. Anal Chem. (2013) ;85: :6295–302. doi: 10.1021/ac400519c |
[33] | Graf BW , Boppart SA . Imaging and analysis of three-dimensional cell culture models. Methods Mol Biol. (2010) ;591: :211–27. doi: 10.1007/978-1-60761-404-3_13 |
[34] | Griffith LG , Swartz MA . Capturing complex 3D tissue physiology in vitro. Nat Rev Mol Cell Biol. (2006) ;7: :211–24. doi: 10.1038/nrm1858 |
[35] | Lin R-Z , Lin R-Z , Chang H-Y . Recent advances in three-dimensional multicellular spheroid culture for biomedical research. Biotechnol J. (2008) ;3: :1172–84. doi: 10.1002/biot.200700228 |
[36] | Hsiao AY , Tung Y-C , Kuo C-H , Mosadegh B , Bedenis R , Pienta KJ , Takayama S . Micro-ring structures stabilize microdroplets to enable long term spheroid culture in 384 hanging drop array plates. Biomed Microdevices. (2012) ;14: :313–23. doi: 10.1007/s10544-011-9608-5 |
[37] | Hongisto V , Jernström S , Fey V , Mpindi J-P , Kleivi Sahlberg K , Kallioniemi O , Perälä M . High-throughput 3D screening reveals differences in drug sensitivities between culture models of JIMT1 breast cancer cells. PLoS ONE. (2013) ;8: :e77232. doi: 10.1371/journal.pone.0077232 |
[38] | Kim JB , Stein R , O’Hare MJ . Three-dimensional in vitro tissue culture models of breast cancer–a review. Breast Cancer Res Treat. (2004) ;85: :281–91. doi: 10.1023/B:BREA.0000025418.88785.2b |
[39] | Härmä V , Schukov H-P , Happonen A , Ahonen I , Virtanen J , Siitari H , et al. Quantification of dynamic morphological drug responses in 3D organotypic cell cultures by automated image analysis. PLoS One. (2014) ;9: :e96426. doi: 10.1371/journal.pone.0096426 |
[40] | Boutin ME , Voss TC , Titus SA , Cruz-Gutierrez K , Michael S , Ferrer M . A high-throughput imaging and nuclear segmentation analysis protocol for cleared 3D culture models. Sci Rep. (2018) ;8: :11135. doi: 10.1038/s41598-018-29169-0 |
[41] | Chen W , Wong C , Vosburgh E , Levine AJ , Foran DJ , Xu EY . High-throughput image analysis of tumor spheroids: A user-friendly software application to measure the size of spheroids automatically and accurately. J Vis Ex. (2014) . doi: 10.3791/51639 |
[42] | Maehama T , Dixon JE . The tumor suppressor, PTEN/MMAC1, dephosphorylates the lipid second messenger, phosphatidylinositol 3,4,5-trisphosphate. J Biol Chem. (1998) ;273: :13375–8. doi: 10.1074/jbc.273.22.13375 |
[43] | Rustamov V , Keller F , Klicks J , Hafner M , Rudolf R . Bone sialoprotein shows enhanced expression in early, high-proliferation stages of three-dimensional spheroid cell cultures of breast cancer cell line MDA-MB-231. Front Oncol. (2019) ;9: :36. doi: 10.3389/fonc.2019.00036 |
[44] | Kabeya Y , Mizushima N , Ueno T , Yamamoto A , Kirisako T , Noda T , et al. LC3, a mammalian homologue of yeast Apg8p, is localized in autophagosome membranes after processing. EMBO J. (2000) ;19: :5720–8. doi: 10.1093/emboj/19.21.5720 |
[45] | Burguera EF , Bitar M , Bruinink A . Novel in vitro co-culture methodology to investigate heterotypic cell-cell interactions. eCM. (2010) ;19: :166–79. doi: 10.22203/eCM.v019a17 |
[46] | Yamaguchi Y , Kudoh J , Yoshida T , Shimizu N . In vitro co-culture systems for studying molecular basis of cellular interaction between Aire-expressing medullary thymic epithelial cells and fresh thymocytes. Biol Open. (2014) ;3: :1071–82. doi: 10.1242/bio.201410173 |
[47] | Langhans SA . Three-dimensional in vitro cell culture models in drug discovery and drug repositioning. Front Pharmacol. (2018) ;9: :6. doi: 10.3389/fphar.2018.00006 |
[48] | Soule HD , Maloney TM , Wolman SR , Peterson WD , Brenz R , McGrath CM , et al. Isolation and characterization of a spontaneously immortalized human breast epithelial cell line, MCF-10. Cancer Res. (1990) ;50: :6075–86. |
[49] | Park MK , Yao Y , Xia W , Setijono SR , Kim JH , Vila IK , et al. PTEN self-regulates through USP11 via the PI3K-FOXO pathway to stabilize tumor suppression. Nat Commun. (2019) ;10: :636. doi: 10.1038/s41467-019-08481-x |
[50] | Edinger AL . Controlling cell growth and survival through regulated nutrient transporter expression. Biochem J. (2007) ;406: :1–12. doi: 10.1042/BJ20070490 |
[51] | Zeleniak AE , Huang W , Fishel ML , Hill R . PTEN-dependent stabilization of MTSS1 inhibits metastatic phenotype in pancreatic ductal adenocarcinoma. Neoplasia. (2018) ;20: :12–24. doi: 10.1016/j.neo.2017.10.004 |
[52] | Denton AE , Roberts EW , Fearon DT . Stromal cells in the tumor microenvironment. Adv Exp Med Biol. (2018) ;1060: :99–114. doi: 10.1007/978-3-319-78127-3_6 |
[53] | Fu Y , Liu S , Yin S , Niu W , Xiong W , Tan M , et al. The reverse Warburg effect is likely to be an Achilles’ heel of cancer that can be exploited for cancer therapy. Oncotarget. (2017) ;8: :57813–25. doi: 10.18632/oncotarget.18175 |
[54] | Martinez-Outschoorn UE , Pavlides S , Howell A , Pestell RG , Tanowitz HB , Sotgia F , Lisanti MP . Stromal-epithelial metabolic coupling in cancer: Integrating autophagy and metabolism in the tumor microenvironment. Int J Biochem Cell Biol. (2011) ;43: :1045–51. doi: 10.1016/j.biocel.2011.01.023 |
[55] | Maycotte P , Thorburn A . Autophagy and cancer therapy. Cancer Biol Ther. (2011) ;11: :127–37. doi: 10.4161/cbt.11.2.14627 |


