
Influence of coagulation parameters by stabilization of fibrinogen
Abstract
INTRODUCTION:
Besides a sodium chloride solution, a hydroxyethyl starch solution, and an immunoglobulin G solution, a human albumin solution is more frequently used in infusion solutions. To prevent negative influence of volume replacement solutions on hemostasis, additional administration of fibrinogen has been used in this assignment with the intention of keeping the plasmatic hemostasis stable. Therefore, in this study possible effects on hemostasis by plasma dilution with HES along with the effects of other clinically applied volume replacement solutions will be analyzed.
MATERIAL AND METHODS:
Whilst maintaining the concentration of fibrinogen the experiment used four different volume replacement solutions in increments of 1 : 3, 1 : 6 and 1 : 11. To evaluate the changed hemostasis the coagulation parameters PT, PTT and thrombin time have been measured and assessed.
RESULTS:
A consistent increase of PT is observable in all four dilution solutions. The undiluted samples have a mean value of 11.44 sec. For example, the highest increase of PT of all dilution factors could be detected in samples treated with human albumin solution, where 19.54 sec was the mean value of the 1 : 3 dilution, whereas values of the 1 : 11 dilution nearly tripled (85.00 sec). Lower values could be achieved in measurements where solutions were diluted with NaCl and HES. However, PT values for the NaCl and HES dilutions (1 : 6) were 39.26 seconds and 36.55 seconds and have exceeded the corresponding human albumin dilution value. However, the steepest curves are achieved using immunoglobulin G solution as dilution agent.
CONCLUSION:
All results explicitly show that a dilution of the plasma results in worsening the hemostasis. However, the thrombin time can be considered as an exception, as even with a stronger dilution the solutions do not show an increase. Additionally, it could be established that the intrinsic factors are stronger influenced in their function than the extrinsic factors.
1Introduction
Human blood contains a multiplicity of components and its properties are influenced by different quantities. This is a necessity so that the various tasks of the blood in the body can be fulfilled. Besides very important tasks like gas exchange and immune defense, hemostasis is of utmost importance. Blood coagulation as a defense mechanism against injuries of all kinds can be seen as an interplay of the vascular wall, thrombocytes and plasmatic factors. Hemostasis can take place only in specific parts or does not work at all if one of these factors is either dysfunctional or missing or is interfered with.
Hemostasis is activated by two parallel-running phases. Firstly, the adhesion and aggregation of thrombocytes helps sealing the injured endothelium. Consequently, hemostatic factors found in the plasma are activated to stabilize the aggregate via formation of fibrin polymers [1].
In this progression it is possible to control hemostasis by regulation of different quantities, for example blood volume. Often it is obvious to use infusions, when patients are admitted into in a clinic due to a contracted disease. The operation of volume replacement therapies for volume deficiency due to causes like acute hemorrhage or enhanced vessel dilation are of crucial importance. In this case, the blood volume has to be artificially restocked by using volume replacement solutions rather than human blood [2].
Infusion solutions do have side effects as is the case for all available drugs [3]. Besides the additional burden for the cardiovascular system due to increased volume [4], changes in blood composition occur and hence affect processes and substances produced naturally in the body. Interestingly some studies have found that one infusion solution, namely hydroxyethyl starch (HES) mediates coagulation due to inhibition of platelet function, reduced release of factor VIII and hemodilution lowers clot polymerization whereas other studies indicated that HES does not lead to adverse effects. It is suggested that molecular weight, degree of substitution and the quantity of applied volume play an important role in influencing clot affects [5, 6]. To address these restrictions of blood coagulation, fibrinogen concentrates were developed and are currently available on the market [7]. These concentrates aim to maintain or recover blood coagulation potency whilst the usage of volume replacement solutions [8]. Due to these findings possible effects on hemostasis by plasma dilution with HES along with the effects of other clinically applied volume replacement solutions will be analyzed in this paper. The core aspect will be the discovery of the fibrinogen concentration which is necessary to reach a significant shortage of coagulation time. In this context, fibrinogen concentration is maintained at a constant level whilst the other coagulation factors are diluted consecutively. This paper is focusing on global coagulation parameters like prothrombin time (PT), activated partial thromboplastin time (PTT) and the thrombin time (TT).
2Material and methods
2.1Sample preparation
To perform the coagulation assays sample material has to be prepared. 21 ml of venous blood of five probands are drawn and filled in citrate tubes (Fa. Sarstedt, Germany) to inhibit coagulation. Three female and two male probands participate in the experiment. All of the probands are between 20–25 years old. None of the participants were taking medication at the time of the study. After drawing blood the tubes are centrifuged at 2500 g for 20 minutes before plasma supernatant can be removed and used. The frozen fibrinogen (Fa. Sigma-Aldrich, Germany) is thawed and solved in 0.9% sodium chloride (Fa. Fresenius Kabi, Germany) in a water bath (37 °C). Following for each of the five probands, dilutions have to be prepared according to the scheme stated below.
In case of a 1 : 3 dilution 0.333 ml plasma from the citrate tubes must be mixed with 0.178 ml solved Fibrinogen and after that 0.489 ml volume replacement solution must be added. The final volume of 1 ml is necessary for a fully automated analysis of the coagulation. The described plan is also used for the other dilutions (Table 1).
Table 1
Scheme for preparation of serial dilution of plasma of the probands
| Dilution level | Volume | Volume fibrinogen | Volume | Final concentration | Final |
| plasma | (stock solution; | replacement | fibrinogen | volume | |
| c = 10 mg/ml) | solutions | ||||
| undiluted | 1 ml | 0 ml | 0 ml | 2 mg/ml | 1 ml |
| 1 : 3 | 0,333 ml | 0,2 ml | 0,467 ml | 2 mg/ml | 1 ml |
| 1 : 6 | 0,167 ml | 0,2 ml | 0,633 ml | 2 mg/ml | 1 ml |
| 1 : 11 | 0,091 ml | 0,2 ml | 0,709 ml | 2 mg/ml | 1 ml |
2.2Measuring process
The tubes used for taking of blood samples are coated with sodium citrate. The Sarstedt tubes contain a 0.106-molar solution and the tube has to be filled to get a mix ratio of one part of citrate and nine parts of blood. The sodium citrate inhibits the coagulation of the blood sample by sequestering the calcium ions. During the coagulation measuring the inhibition of coagulation is amended by adding calcium ions to the tubes.
2.3Used volume replacement solutions
For volume replacement therapy crystalloid and colloidal solutions are used [9]. Crystalloid solutions can be divided in electrolyte solutions and glucose solutions. Among electrolyte solutions only those containing high levels of sodium, which is the most important extracellular cation, may be used for volume replacement. This only applies to full-electrolyte solutions whose sodium concentration is at a minimum of 120 mmol/l. In colloidal solutions, components which are naturally produced in the body must be distinguished from artificial ones. Colloidal solutions are said to have a more beneficial volume effect. Samples are diluted by the electrolyte solution sodium chloride, the artificial colloidal solution hydroxyethyl starch (HES), an immunoglobulin G solution and a human albumin solution is part of the body’s own colloids.
2.4Sodium chloride (NaCl)
The sodium chloride solution, having a concentration of 0.9%, is widely clinically used since it contains sodium in physiological concentration. As it comprises sodium and chloride in equal amounts it is part of the full-electrolyte solutions.
2.5Hydroxyethyl starch (HES)
A HES solution (Fa. Fresenius Kabi, Germany) with a concentration of 6% is also used to dilute plasmatic samples. The compound fulfills the task of a plasma expander. Not only is the volume restocked when using HES but also it transfers the volume from the interstitial to the intravascular area. HES has its main applications in operations and injuries due to its great volume deficiency. The half-life in the plasma amounts to 3–6 hours.
2.6Immunoglobulin G (IgG solution)
Other than the previous described solutions, the IgG solution (Fa. CSL Behring, Germany) is not necessarily used in volume replacement therapy. Instead, it is applied for substitutional purposes in patients having a deficiency of IgG antibodies as for example when undergoing pathological conditions like immune deficiency, hypogammaglobulinaemia as well as AIDS. The production of IgG solutions is very complicated and expensive since it is extracted from human blood. The same applies to human albumin solutions.
2.7Human albumin
Another substance that is used in the industry of volume replacement is a human albumin solution (Fa. CSL Behring, Germany). Albumin as the main component is part of the natural colloidal solutions and hence are very compatible. Due to the complex extraction process from human plasma it has relatively high manufacturing costs and thus is not often used in emergency medicine.
For the measuring of prothrombin time RecombiPlasTin 2 G (Fa. Instrumentation Laboratory, Italy) is used. For coagulatory measuring methods devices of ACL TOP 500 are used.
2.8Statistics
Statistical analysis of PT, PTT and TT values was performed using standard deviation as means of analysis (p < 0.05). A p-value <0.05 was considered to be significant.
3Results
To analyze the impact of infusion solutions on hemostasis, blood of five individuals was used in four different dilution factors with four volume replacement solutions.
The results of PT, PTT and thrombin time measurements indicated a decrease in hemostatic activity with further plasma dilution. The decrease varies among solutions to a different extent. Samples diluted with immunoglobulin G solutions have shown the biggest spread. In this case hemostatic activity is weakened with higher dilution (Tables 2–4).
Table 2
Percentage deviation of prothrombin time values with reference to the undiluted sample as the basic value
| PT | 1 : 3 | 1 : 6 | 1 : 11 |
| NaCl-Dilution | 206,36% | 346,82% | 671,91% |
| HES-Dilution | 242,48% | 323,45% | 619,29% |
| IgG-Dilution | 206,70% | 454,50% | 722,22% |
| Human albumin-Dilution | 170,80% | 309,66% | 743,01% |
Table 3
Percentage deviation of activated thromboplastin time values with reference to the undiluted sample as the basic value
| PTT | 1 : 3 | 1 : 6 | 1 : 11 |
| NaCl-Dilution | 171,91% | 362,59% | 686,70% |
| HES-Dilution | 216,56% | 309,98% | 518,41% |
| IgG-Dilution | 166,01% | 372,96% | 576,20% |
| Human albumin-Dilution | 138,30% | 281,08% | 645,61% |
Table 4
Percentage deviation of thrombin time values with reference to the undiluted sample as the basic value
| TT | 1 : 3 | 1 : 6 | 1 : 11 |
| NaCl-Dilution | 140,79% | 158,87% | 157,34% |
| HES-Dilution | 83,33% | 66,67% | 65,02% |
| IgG-Dilution | 145,89% | 251,22% | 350,27% |
| Human albumin-Dilution | 98,39% | 107,48% | 125,11% |
3.1Prothrombin time
The prothrombin time is the first hemostatic parameter to be analyzed.
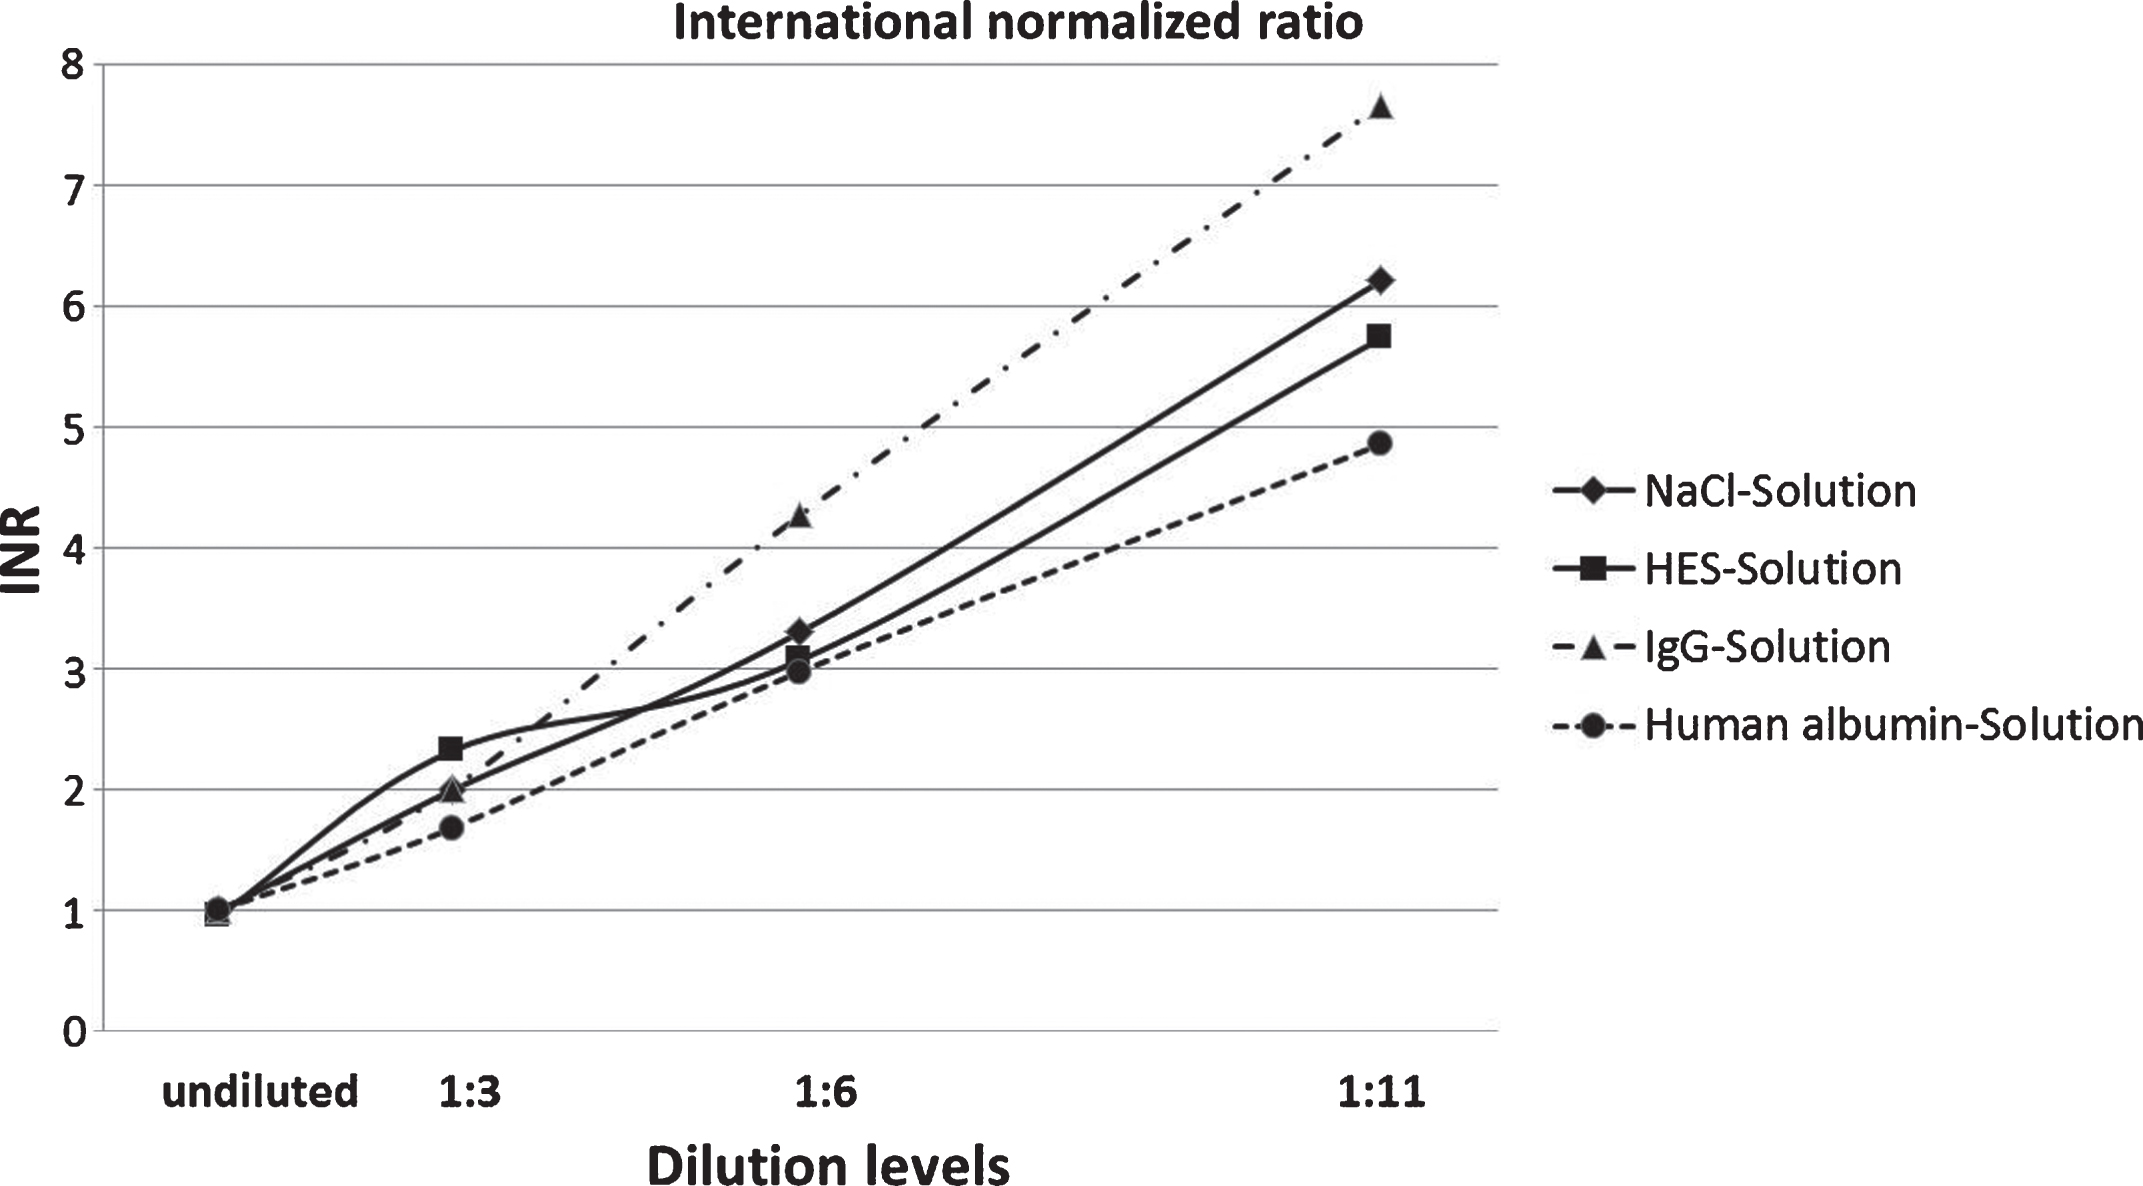
As can be seen in Fig. 1, a consistent increase of PT is observable in all four dilution solutions. The undiluted samples have a value of 11.44 seconds. The highest increase of PT of all dilution factors could be detected in samples treated with human albumin solution, where 19.54 seconds was the value of the 1 : 3 dilutions, whereas values of the 1 : 11 dilution nearly tripled (85.00 seconds). Additionally, Fig. 2 shows the PT values converted into INR values.
Fig.1
Results of prothrombin time measurements of NaCl, HES, IgG and human albumin solutions in four degrees of dilution.
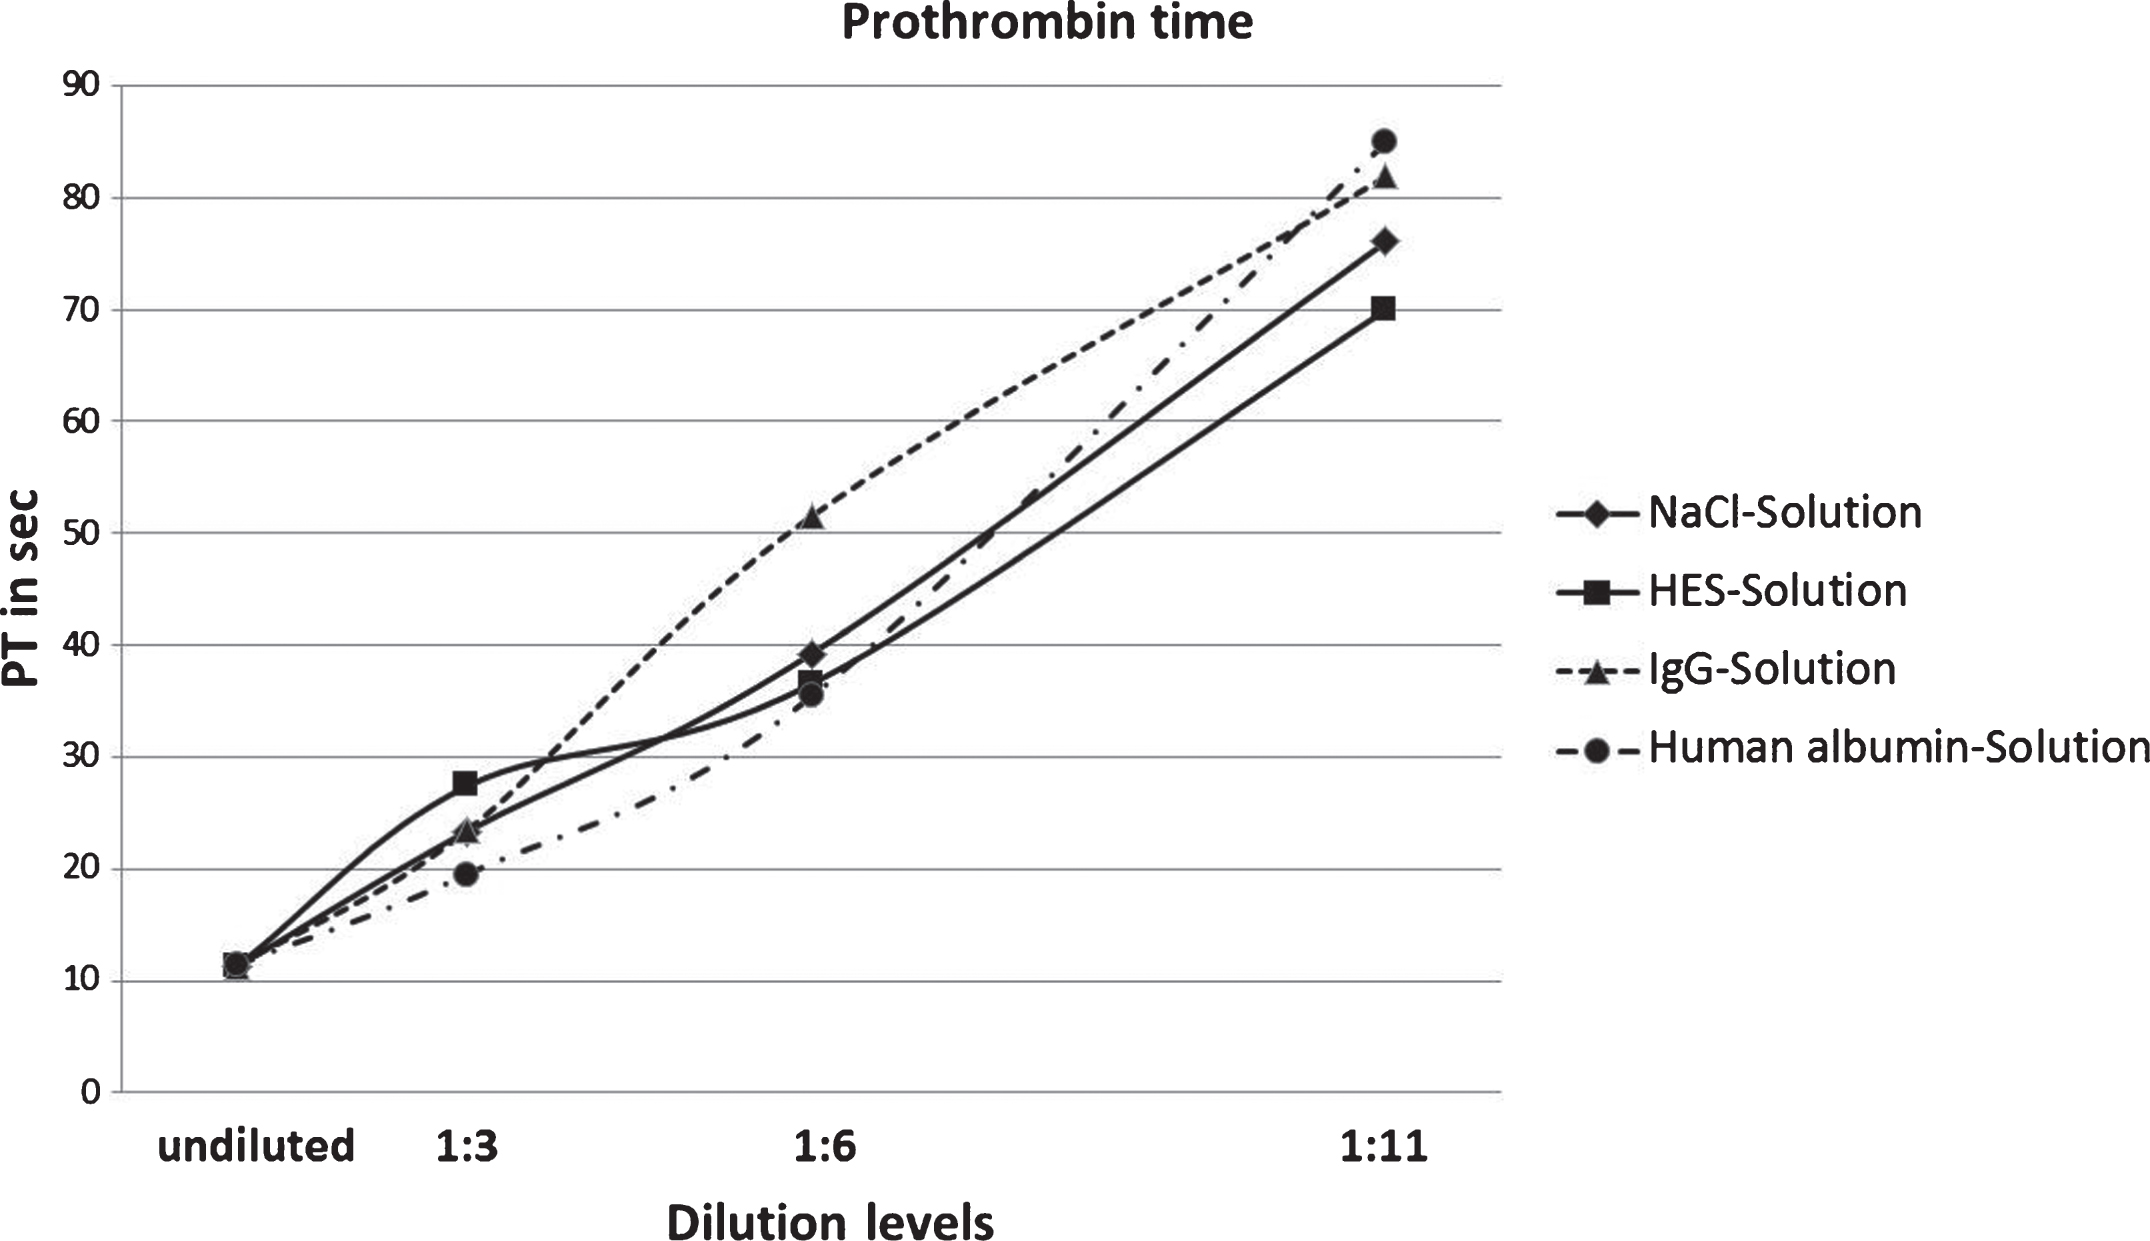
Fig.2
Results of prothrombin time measurements converted into international normalized ratio values, since this conversion is clinically acknowledged and serves as internationally standardized comparable basis of PT values among laboratories.
Lower values could be achieved in measurements where solutions were diluted with NaCl and HES. However, PT values for the NaCl and HES dilutions (1 : 6) were 39.26 seconds and 36.55 seconds and have exceeded the corresponding human albumin dilution value. A more pronounced spread could be observed in 1 : 11 dilution values, of which samples diluted with sodium chloride and HES were 76.06 and 69.98.
The steepest curve of the diagram shows the measurement results using immunoglobulin G solution as dilution agent. Although the 1 : 3 dilution value is still in the range of the other dilution solutions (23.44 seconds) it increases to 51.54 when diluted 1 : 6 and to 81.90 seconds when diluted 1 : 11.
Figure 3 contains the results of partial PT measurements of all four volume replacement solutions. The four different degrees of dilution are also taken into account.
Fig.3
Results of PTT measurement of NaCl, HES, IgG and human albumin solutions in four degrees of dilution.
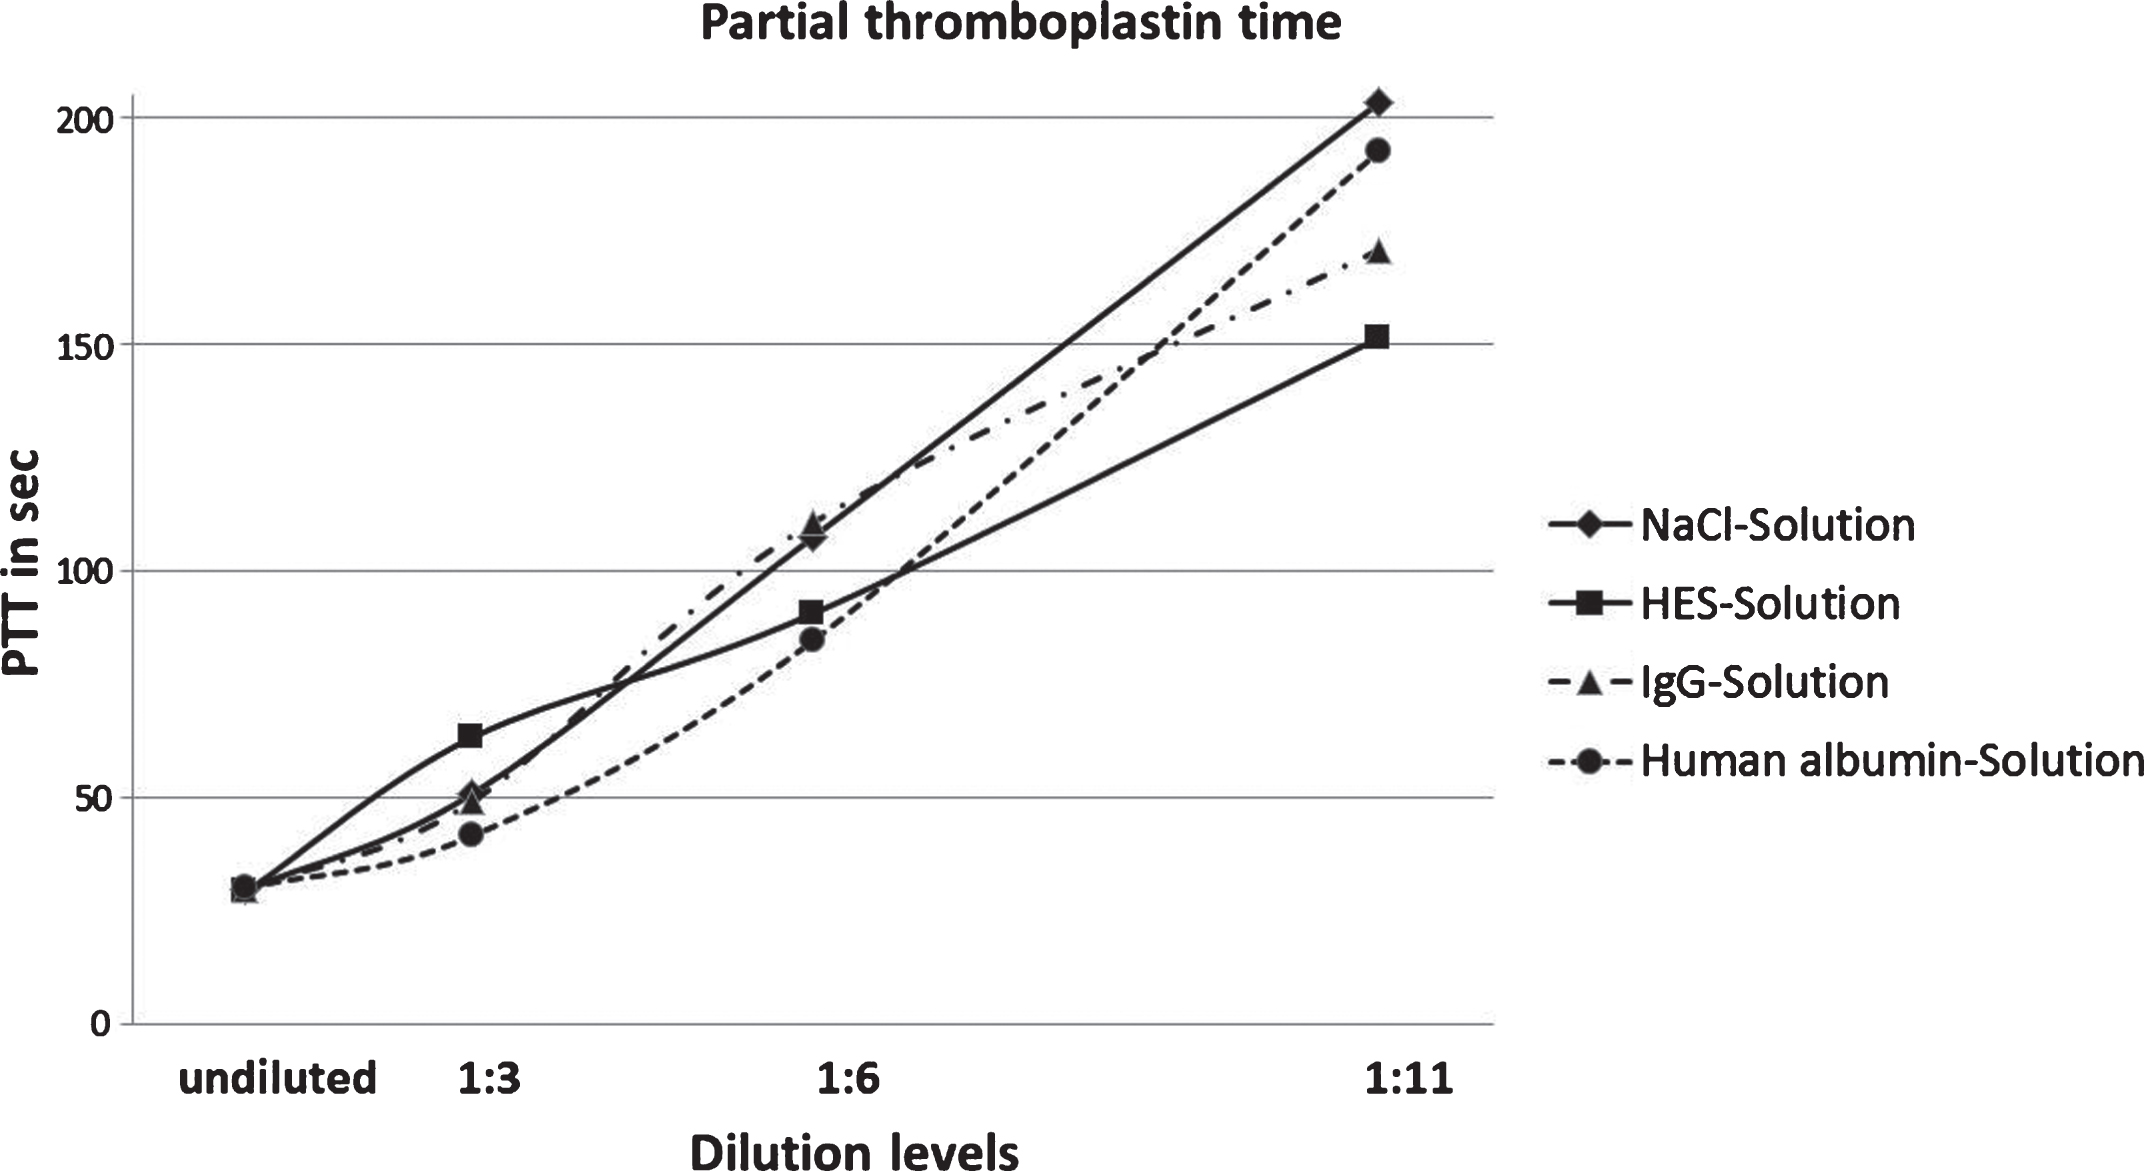
The curve progression in this diagram shows consistency for all volume replacement solutions that had an increase of PTT the further the plasm was diluted. Among samples diluted with the four solutions, results of the PTT measurement seem to remain unchanged.
Considering the results of HES, you can acknowledge a straight line. PTT of plasma undiluted is 30.08 sec and rises up to 63.28 sec at the dilution of 1 : 3. Such an enhancement can’t be found with the other three solutions. The prolongation of PTT from 1 : 3 to a 1 : 6 dilution accounts for 30 seconds to 90.57 sec. This corresponds to a thrice value of the undiluted sample. The 1 : 11 dilution moreover causes a prolongation of the PTT by 60 sec.
The curves of the dilutions with IgG and NaCl show a similar behavior. After the first prolongation of the 1 : 3 dilution of PTT from 30.08 sec. to 42 sec. follows a prolonged PTT of the 1 : 6 dilution up to 110 sec.
Dilution with NaCl forms the peak value with duration of 203.4 sec. Against this 1 : 11 dilution with IgG resides below with 170.9 sec.
The dilution with albumin shows the most diverse results. It shows the shortest PTT at the 1 : 3 dilution (41.6 sec.). The result of the 1 : 6 dilution is 84.55 sec. and of the 1 : 11 dilution it is 194.2 sec.
The last parameter of coagulation is the Thrombin Time. Undiluted the duration until the coagulation is 13.7 sec. and varies depending on the used volume resuscitation medium (Fig. 4).
Fig.4
Results of TT measurement of NaCl, HES, IgG and human albumin solutions in four degrees of dilution (p < 0.05 is significant; * compared to the control value).
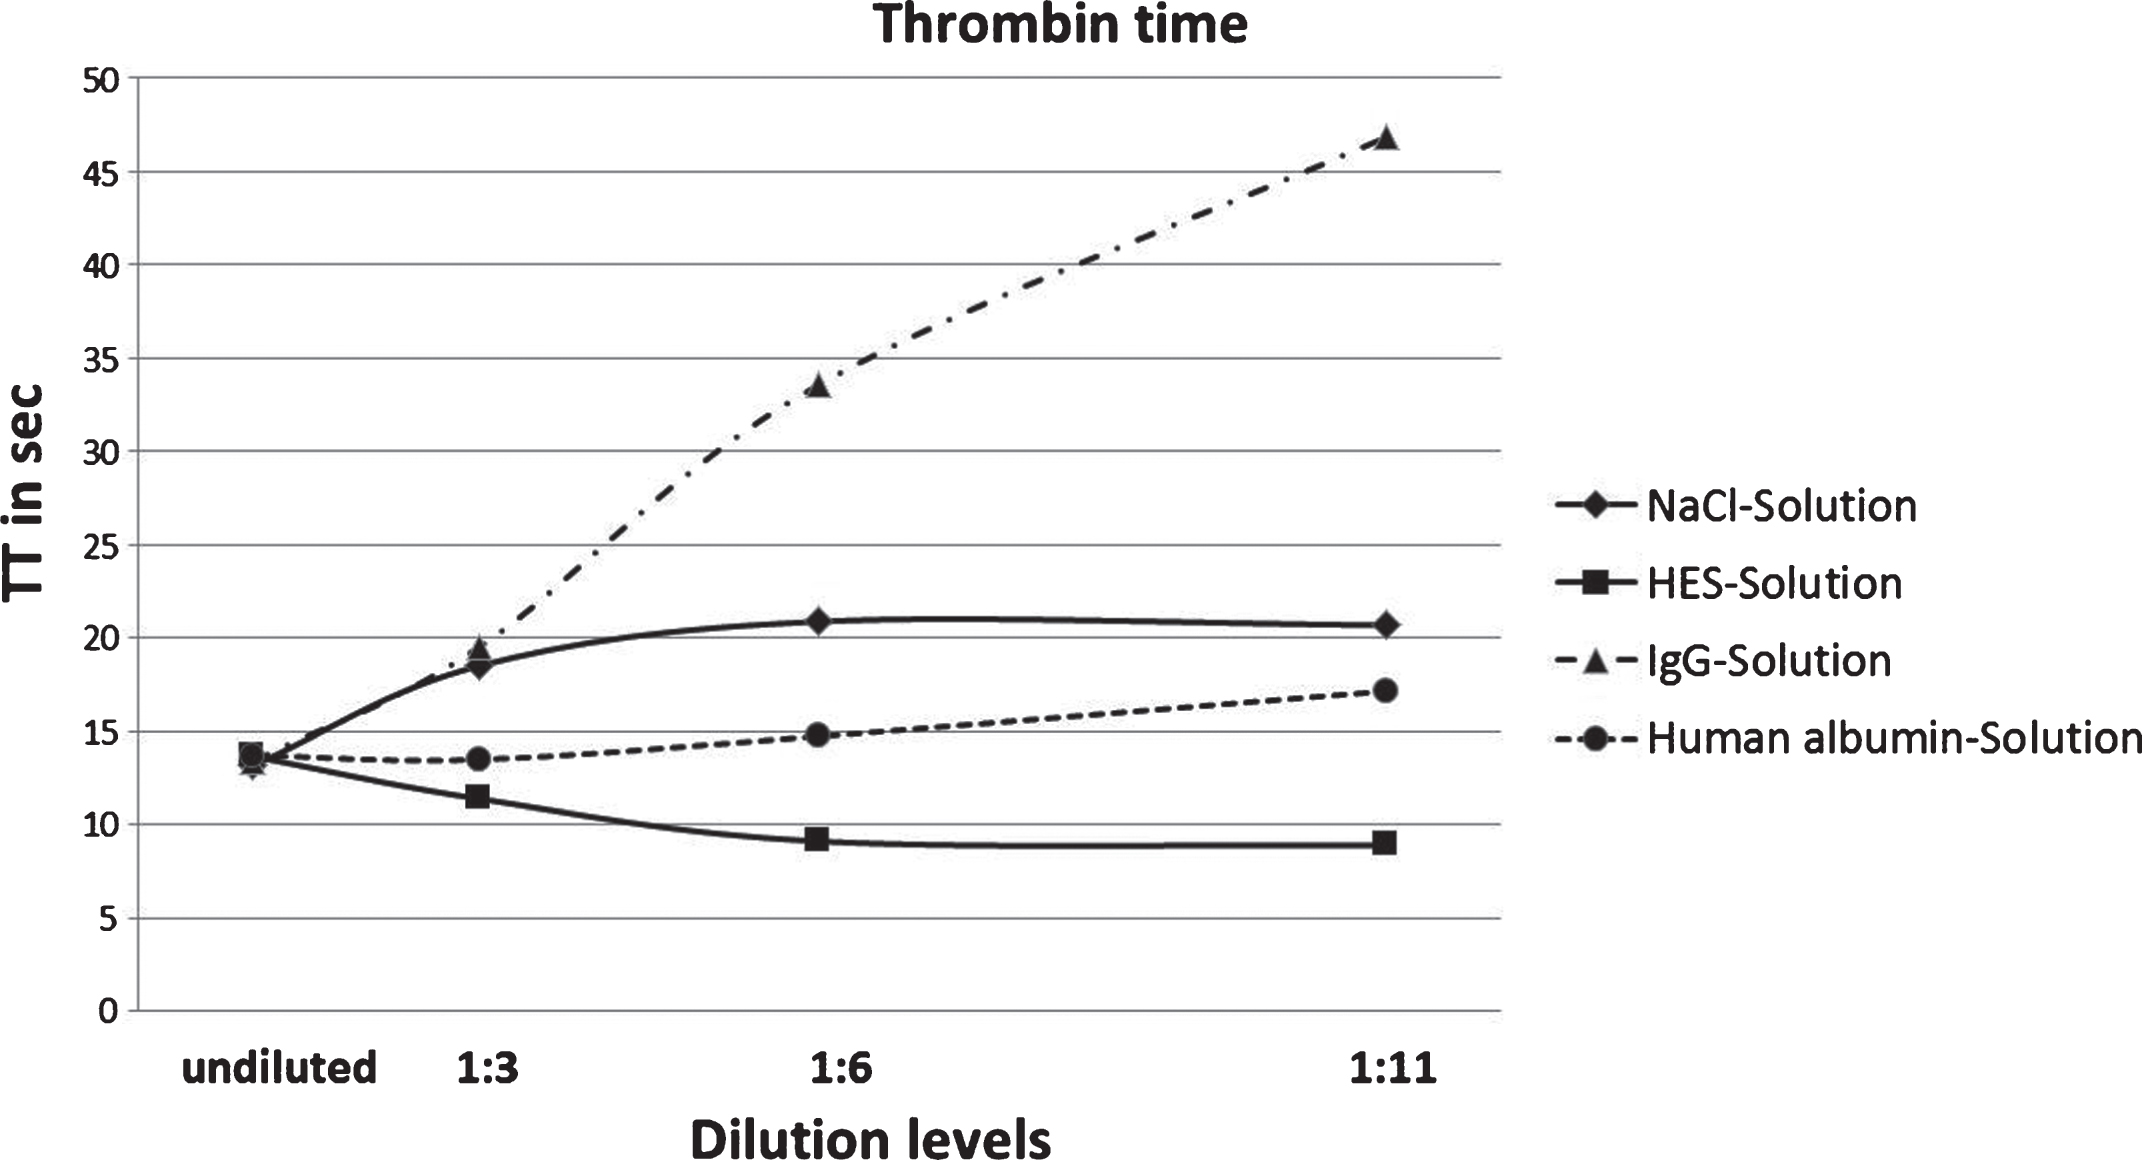
Similar to the PTT dilution with IgG declines in all dilution levels. Compared to the undiluted sample, the 1 : 3 dilution prolongs the TT by six seconds and the result of the 1 : 6 dilution shows a TT of 33.58 sec. Finally, the TT increases at the 1 : 11 dilution to 46.82 sec.
Samples diluted with the other three solutions show particularly different TT. With albumin as a diluent TT is enhanced to 17.15 sec. at the 1 : 11 level. NaCl causes an increased TT of 20.88 sec. at the 1 : 6 dilution but decreases at the 1 : 11 dilution to 20.68 sec.
Furthermore, a continuous decrease of the TT at the dilution with HES can be identified. TT at the 1 : 11 dilution only amounts to 8.88 sec.
4Discussion
We assessed changes in curve progression of every solution applied. To further analyze the direct effect of fibrinogen addition, a comparison to experiments without fibrinogen addition is conducted. In these experiments the same volume replacement solutions were used to dilute plasma samples omitting fibrinogen. A reference to standard values will not be made as only the undiluted samples are within the norm. It is foreseeable, that by 1 : 3 dilution, hemostatic activity can no longer be quantified using PTT and prothrombin time.
As expected, PT was increased using higher plasma dilutions. It is evident that all curves show almost the same progression until the 1 : 3 dilution whereas starting from the 1 : 6 dilution an increase of the IgG curve can be identified. Considerable differences regarding the IgG and human albumin curves can be observed, since measurements of hemostasis were not possible starting from the 1 : 6 dilution. Interestingly there were no deviations regarding the PT values of NaCl and HES even though fibrinogen was added. This suggests that maintained fibrinogen levels contribute to measuring hemostasis IgG and human albumin solutions. The assumption is that NaCl and HES solutions are not significantly affected by fibrinogen.
According to prothrombin time values there should be an increase in PTT values since it is also based on the time until coagulation. Hence curve progression should be steeper with higher dilution levels. It is remarkable that the 1 : 6 dilution have smaller deviations among the different solutions compared to the 1 : 11 dilutions. A similar curve progression pattern can be seen in which PTT progression takes place twice as fast. It should be noted that values for dilution levels higher than 1 : 9 could not be measured which prevents an interpolation and hence a time estimation for the 1 : 6 dilution (Tables 5–7).
Table 5
Two-tailed Wilcoxon Rank sum test for PT data
| PT | 1 : 3 | 1 : 6 | 1 : 11 |
| HAES/IgG | 26 | 13 | 25 |
| HAES/NaCl | 26 | 19 | 17 |
| HAES/Albumin | 20 | 18 | 26 |
| IgG/NaCl | 26 | 20 | 25 |
| IgG/Albumin | 22 | 13 | 24 |
| NaCl/Albumin | 21 | 16 | 25 |
Equal sample sizes. Not evaluable values are excluded and signification range is fitted accordingly. Intervals are taken from “Some Rapid Approximate Statistical Procedures (Pearl River, N.Y. Lederle Laboratories, 1964)”. Intervalls for equal sample sizes are Tl = 18 and Tu = 37; (n1 = 5, n2 = 5) and Tl = 11 and Tu = 25 (n1 = 4, n2 = 4). For unequal sample sizes values were n1 = 5, n2 = 4: Tl = 12, Tu = 28. In case of significant deviations vales are highlighted in bold font.
Table 6
Two-tailed Wilcoxon Rank sum test for PTT data
| PTT | 1 : 3 | 1 : 6 | 1 : 11 |
| HAES/IgG | 27 | 18 | 23 |
| HAES/NaCl | 26 | 17 | 15 |
| HAES/Albumin | 21 | 17 | 22 |
| IgG/NaCl | 24 | 23 | 21 |
| IgG/Albumin | 19 | 32 | 26 |
| NaCl/Albumin | 18 | 29 | 24 |
Equal sample sizes. Not evaluable values are excluded and signification range is fitted accordingly. Intervals are taken from “Some Rapid Approximate Statistical Procedures (Pearl River, N.Y. Lederle Laboratories, 1964)”. Intervalls for equal sample sizes are Tl = 18 and Tu = 37; (n1 = 5, n2 = 5) and Tl = 11 and Tu = 25 (n1 = 4, n2 = 4). For unequal sample sizes values were n1 = 5, n2 = 4: Tl = 12, Tu = 28. In case of significant deviations vales are highlighted in bold font.
Table 7
Two-tailed Wilcoxon Rank sum test for TT data. Equal sample sizes. Not evaluable values are excluded and signification range is fitted accordingly
| TT | 1 : 3 | 1 : 6 | 1 : 11 |
| HAES/IgG | 19 | 15 | 15 |
| HAES/NaCl | 15 | 19 | 20 |
| HAES/Albumin | 20 | 19 | 15 |
| IgG/NaCl | 23 | 15 | 19 |
| IgG/Albumin | 20 | 15 | 20 |
| NaCl/Albumin | 15 | 19 | 20 |
Intervals are taken from “Some Rapid Approximate Statistical Procedures (Pearl River, N.Y. Lederle Laboratories, 1964)”. Intervalls for equal sample sizes are Tl = 18 and Tu = 37; (n1 = 5, n2 = 5) and Tl = 11 and Tu = 25 (n1 = 4, n2 = 4). For unequal sample sizes values were n1 = 5, n2 = 4: Tl = 12, Tu = 28. In case of significant deviations vales are highlighted in bold font.
This comparison implies that the shortened PTT is the result of a constant concentration of fibrinogen. As the PTT is a parameter, with its aid it can be captured the factors of the intrinsic activating pathway. Moreover, it does mean that despite of the dilution of all coagulation factors, a positive effect of fibrinogen can be achieved in addition to the intrinsic factors. Hence, the coagulation can be stabilized.
The curve of the thrombin time should be formed so that the curves run parallel to the x-axis. This can be equated with a constant thrombin time and also with a constant coagulation. Since this coagulation parameter immediately depends on the contained concentration of fibrinogen in the sample, a stabilization of fibrinogen should cause the aforementioned process. The latter was achieved by adding of the fibrinogen stock solution, whereby each sample analyzed contains a fibrinogen concentration of 2 mg/ml.
According to the results, none of the curves are indeed parallel to the x-axis, but the curves of NaCl and human albumin follow this pattern. Only the curves of HES and IgG show strong deviations. It is yet to be clarified; what caused the significant increase of the IgG curve and the continual degression of the HES curve. In the case of the IgG a clustering could be causal, which inhibits the activation of fibrinogen by thrombin and therefore exacerbates the formation of a thrombus. A pathogenesis similar to Morbus Waldenström could be the reason for this [10].
This disease is an attributing to the non-Hodgkin’s lymphoma malignancy of the B-cells, which leads to a hyper proliferation of IgM antibodies. Rheological properties result in blood being changed to hyper-viscous. The degression of the HES curve and the improvement of coagulation could be the reason that the initial fibrinogen concentration, (with HES) was less than the 2 mg/ml added as standard.
We can conclude that fibrinogen seems to interact differently with the volume replacement solutions, which could lead to differential curves. With the exception of IgG solution a stable plasmatic hemostasis could be identified regarding the parameters covered by the thrombin time.
Despite the general trend, each parameter with the help of constant fibrinogen indicates an improvement of coagulation. Each volume replacement seems to interact individually with the Fibrinogen due to its special properties and therefore influences the coagulability of the plasma. This becomes clear especially when looking at the thrombin time of the samples.
On the other hand, these findings may be beneficial for quality control of surfaces. Thus, it could be assessed where minimal concentration of coagulation factors would be necessary, so a surface can activate the hemostasis [11]. Conversely, the information could be important for extracorporeal systems, how much volume can be added, without affecting the coagulation and becoming detrimental for the patient [12, 13].
References
[1] | Mosesson MW . Fibrinogen and fibrin structure and functions. J Thromb Haemost (2005) ;3: :1894–904. |
[2] | Vanmassenhove J , Kielstein J , Jörres A , Biesen WV . Management of patients at risk of acute kidney injury. Lancet (2017) ;389: (10084):2139–51. |
[3] | Goodnough LT , Brecher ME , Kanter MH , AuBuchon JP . Transfusion medicine. First of two parts- blood transfusion. N Engl J Med (1999) ;340: (14):438–47. |
[4] | Ueyama H , Kiyonaka S . Predicting the need for fluid therapy—does fluid responsiveness work? J Intensive Care (2017) ;5: :34. |
[5] | Entholzner EK , Mielke LL , Calatzis AN , et al. Coagulation effects of a recently developed hydroxyethyl starch (HES 130/0.4) compared to hydroxyethyl starches with higher molecular weight. Acta Anaesthesiol Scand (2000) ;44: (9):1116–21. |
[6] | Akay MO , Bilir A , Öge T , et al. The evaluation of hydroxyethyl starch (6% HES 130/0.4) solution’s potential preventive effects on coagulation status in women with gynecologic malignancies using rotation thromboelastography. Turk J Haematol (2014) ;31: (3):261–5. |
[7] | Fenger-Eriksen C , Ingerslev J , Sørensen B . Fibrinogen concentrate–a potential universal hemostatic agent. Expert Opin Biol Ther (2009) ;9: (10):1325–33. |
[8] | Franchini M , Lippi G . Fibrinogen replacement therapy: A critical review of the literature. Blood Transfus (2012) ;10: (1):23–7. |
[9] | Chappell D , Jacob M , Hofmann-Kiefer K , Conzen P , Rehm M . A rational approach to perioperative fluid management. Anesthesiology (2008) ;109: (4):723–40. |
[10] | Castillo JJ , Hunter ZR , Yang G , Treon SP . Novel approaches to targeting MYD88 in Waldenström macroglobulinemia. Expert Rev Hematol (2017) :1–6. |
[11] | Zhu S , Diamond SL . Contact activation of blood coagulation on a defined kaolin/collagen surface in a microfluidic assay. Thromb Res (2014) ;134: (6):1335–43. |
[12] | Kalbhenn J , Wittau N , Schmutz A , et al. Identification of acquired coagulation disorders and effects of target-controlled coagulation factor substitution on the incidence and severity of spontaneous intracranial bleeding during veno-venous ECMO therapy. Perfusion (2015) ;30: :675–82. |
[13] | Bembea MM , Annich G , Rycus P , et al. Variability in anticoagulation management of patients on extracorporeal membrane oxygenation: An international survey. Pediatr Crit Care Med (2013) ;14: :e77–84. |


