
Multiscale modeling of tumor response to vascular endothelial growth factor (VEGF) inhibitor
Abstract
Vascular endothelial growth factor (VEGF) has been known as a key mediator of angiogenesis in cancer. Bevacizumab is anti-VEGF monoclonal antibody that has been approved by the FDA as a first-line treatment in many types of cancer. In this paper, we extend a previously validated multiscale tumor model to comprehensively include the multiple roles of VEGF during the course of angiogenesis and its binding mechanism with bevacizumab. We use the model to simulate tumor system response under various bevacizumab concentrations, both in stand-alone treatment and in combination with chemotherapy. Our simulation indicates that periodic administration of bevacizumab with lower concentration can achieve greater efficacy than a single treatment with higher concentration. The simulation of the combined therapy also shows that the continuous administration of bevacizumab during the maintenance phase can lead to antitumor activity which further suppresses its growth. Agreement with experimental results indicates the potential of the model in predicting the efficacy of anti-VEGF therapies and could therefore contribute to developing prospective clinical trials.
1Introduction
Angiogenesis, the formation of new blood vessels from an existing vasculature, is a fundamental process that enables a solid tumor to sustain its growth and metastasize to distant organs. The driving force behind tumor-induced angiogenesis is the vascular endothelial growth factor (VEGF), that is released by starving tumor cells when the supply of oxygen or nutrient becomes limited. Inhibition of VEGF to suppress angiogenesis has become one major focus in cancer therapy in recent decades.
Experiments have provided vast evidences on multiple roles of VEGF during the course of angiogenesis. Upon released by the tumors, VEGF diffuses into the surrounding tissue and reaches the endothelial cells (EC) that form the lining of the blood vessel. The binding of VEGF with the receptor VEGFR located on the EC membrane triggers the sprouting of the new vessels. The tip of these sprouts is made of specialized ECs, called the tip cells. The ECs behind the tip cells are the stalk cells that proliferate and elongate the sprout, forming the trunk of the capillaries. The tip cells migrate and lead the growth direction of the sprout towards the tumor [1–5]. This migratory movement of EC tip cells is directed primarily by positive chemotaxis up the VEGF gradient and also by haptotaxis that occurs along the positive gradients of cellular adhesion sites in the extracellular matrix [6–8].
As in other living cells, ECs also undergo apoptosis, a programmed cell death that occurs naturally as part of its growth and development. In normal condition, apoptosis occurs as a balance between pro and anti-apoptosis proteins. This balance can be disrupted by VEGF-VEGFR binding, which triggers the activation of several other multiple downstream signaling pathways, in particular the PI3K/AKT pathway that regulates cell survival [9, 10]. Experiment by Nör [11] has shown the correlation between higher VEGF concentration and the upregulation of anti-apoptosis protein BCl-2. This result indicates the ability of VEGF to enhance EC survival by inhibiting cellular apoptosis, and thus promotes angiogenesis.
Due to multiple roles of VEGF in facilitating angiogenesis, various cancer therapies targetting VEGF have been developed in pre-clinical and clinical settings. Bevacizumab, also known by its brand name Avastin, is a cancer drug designed to prevent VEGF from binding to VEGFR located on the EC membrane. This blockage ultimately prevents the blood vessels from reaching the tumor. Bevacizumab was the first anti-angiogenic drug approved by FDA for treatment of certain types of cancer, such as colorectal, kidney and lung cancers. It is administered intravenously and can be used alone or in combination with other methods, such as chemotherapy.
Understanding the complex dynamics of VEGF and its inhibitor is important in developing an effective treatment strategy. Although many pre-clinical and clinical trials have been performed extensively, assessment of the drug efficacy is still difficult to conduct, and even more so for combined therapies. Computational models are useful in providing a framework to study the detailed mechanism of VEGF inhibitor, and to investigate tumor response to different treatment strategies.
For a long time, mathematical models have been developed to study various anti-angiogenesis therapies [12–20]. Finley et al. [21] provides a summary of developments in this area. Most models studied one or more aspects of anti-angiogenesis strategies using either discrete or continuous approach. Continuous models consider the interactions between cell density and drug concentration that influence the viability of tumor and ECs. Although computationally inexpensive, these models can only capture large-scale features of angiogenesis, without maintaining cell-specific properties and individual cell interactions. On the other hand, discrete models are able to capture single-cell variability and finer processes involved in angiogenesis at the expense of higher computational cost. Hybrid discrete-continuous models aim to maximize the advantages of both implementations within the same simulation. Many hybrid models for angiogenesis are also multiscale models that encompass several biological scales from the intracellular signaling up to vasculature formation at the tissue level.
In this study, we extend our previously tested multiscale hybrid discrete-continuous model [22, 23] to include detailed mechanisms of the role of VEGF in angiogenesis and individual EC response to VEGF and its inhibitor. We specifically aim to model: 1) VEGF-VEGFR binding and EC tip activation, 2) EC apoptosis signaling and cell survival, and 3) tumor system response to bevacizumab and chemotherapy drug. The model extension covers several biological scales. At the molecular scale, we employ the pharmacodynamics Emax model to quantify the binding effect of VEGF to VEGFR on EC membrane, which serves as a trigger for angiogenesis initiation. We further combine the VEGF signaling with the apoptosis signaling pathway to determine the viability state of each EC. This molecular level model is connected to the tissue level through reaction-diffusion partial differential equations that govern the changes in VEGF, bevacizumab, and chemotherapy drug concentrations at the extracellular scale. The algorithm at the cellular scale is also extended to incorporate tumor response to chemotherapy.
We perform model simulation to analyze the efficacy of bevacizumab in suppressing angiogenesis and tumor growth. As a model system, we chose A549 lung adenocarcinoma. In year 2020, lung cancer is the leading cause of cancer-related deaths in the world. A549 is a non-small cell lung cancer (NSCLC) cell line that has been used extensively as a testing ground for therapeutic drugs development, such as bevacizumab, paclitaxel and docetaxel, both in vitro and in vivo [15, 24, 25]. We compare the effect of different bevacizumab concentration and treatment strategies on the VEGF expression in the tumor tissue, on the EC apoptosis and the resulting capillary structure, and on the overall tumor volume. In addition, using the same model, we explore a combined treatment strategy with chemoterapy drug paclitaxel. Our simulation shows that continuous suppression of angiogenesis by bevacizumab can effectively reduce the overall growth of the tumor in the long run.
2Methods
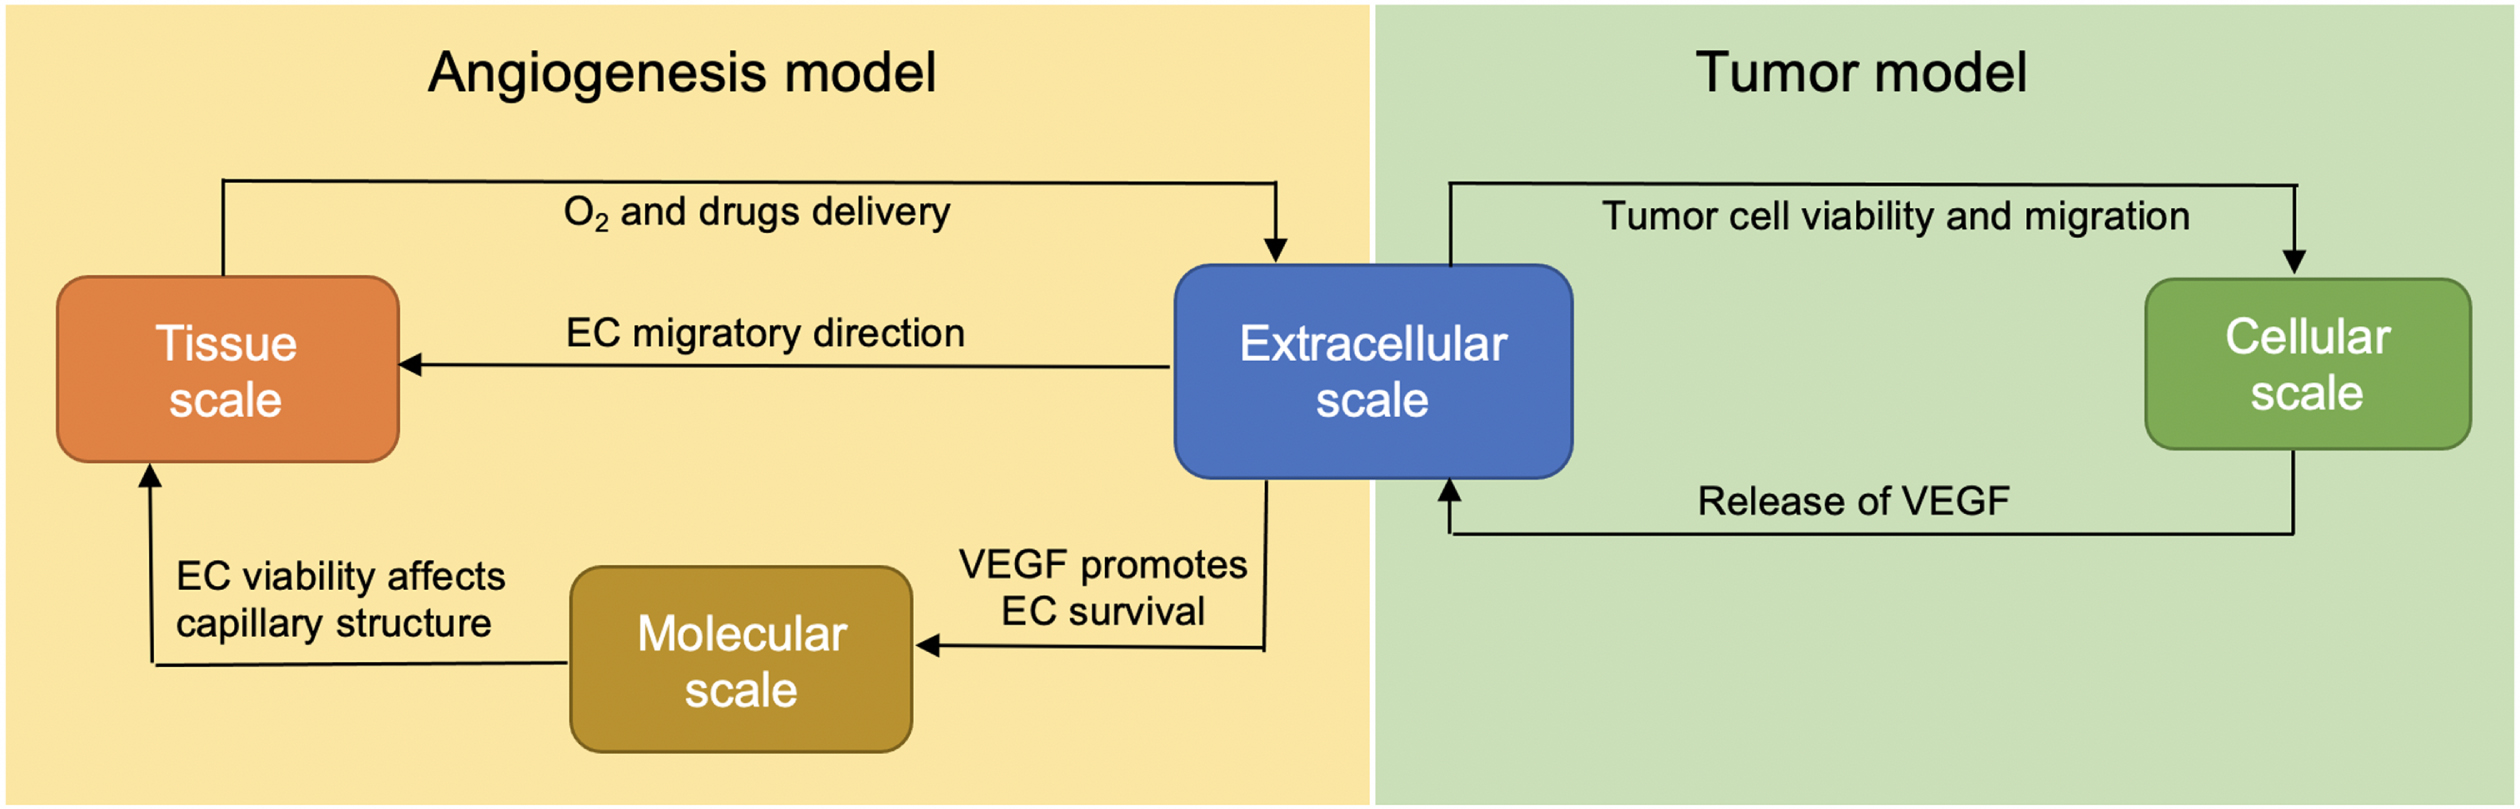
We extend our previous model [22, 23] at several biological scales. In the extracellular scale, additional equations governing the changes in VEGF, bevacizumab and paclitaxel concentrations are added into the system. At the molecular scale, the apoptosis signaling pathway of the EC is now added to control its survival. At the cellular scale, additional feature is added into each tumor cell agent, allowing it to respond to chemotherapy drug, and at the tissue scale, each key process of vasculature formation is designed to be VEGF-dependent, in accordance with experimental observations. Figure 1 illustrates how these biological scales are interconnected.
Fig. 1
The integration of extracellular, cellular, molecular and tissue scales in the extended model.
We choose the hybrid discrete–continuous modeling approach to study the complex interplay between the tumor cells, endothelial cells, and their microenvironmental factors. The simulation developed in this work consists of two types of interacting environments: (a) the discrete cell fields representing tumor cells and ECs, and (b) the continuous fields representing the microenvironmental factors. Components in the continuous fields are modeled through a system of six coupled partial differential equations (PDEs) reflecting the spatiotemporal dynamics and interconnections between the following components: oxygen, VEGF, matrix degradative enzyme (MDE) and fibronectin, along with VEGF inhibitor (bevacizumab) and chemotherapy drug (paclitaxel). The system of coupled PDEs is solved using the finite difference scheme, in which both spatial domain and time interval are discretized [26]. The tumor cells and ECs are modeled as discrete agents residing in and confined to a fixed two-dimensional domain.
2.1Micro-environmental factors and drugs dynamics
The extracellular scale is a central part of the model that connects the other components. In this model, we consider six extracellular micro-environmental factors, namely oxygen, VEGF, matrix degradative enzyme (MDE) and fibronectin, along with VEGF inhibitor (bevacizumab) and chemotherapy drug (paclitaxel).
Oxygen is a critical factor that determines tumor viability. The availability of oxygen facilitates tumor growth, while hypoxic tumor cells secrete VEGF that diffuses into the surrounding tissue, initiating EC capillary formation. ECs adhere to the extracellular matrix (ECM), which mainly consists of fibronectin that bounds to the surrounding tissue, and require ECM for their growth and migration during angiogenesis. Viable tumor cells produce MDE that diffuses and degrades the ECM, enabling the tumor cells to migrate within the tissue. In clinical treatment, both bevacizumab and paclitaxel are injected intravenously, delivered by the capillaries, diffuse into the tumor tissue and decay naturally. Bevacizumab binds with VEGF, while paclitaxel kills tumor cells directly.
The reaction-diffusion equations governing the spatial and temporal changes in the oxygen concentration u (x, t), MDE m (x, t), fibronectin f (x, t), VEGF v (x, t), bevacizumab B (x, t), and paclitaxel P (x, t) are as follows:
(1)
(2)
(3)
(4)
(5)
(6)
(7)
(8)
Paclitaxel, like most chemotherapy drugs, targets tumor cells directly and we will discuss the effect of paclitaxel on the proliferation of tumor cells in the following section. The parameters used in the extracellular scale and the values used in the simulation are listed in Table 1 in the Appendix. We use the parameter values that come from experiments as much as possible and only estimate those whose data are not available.
The coupled system of reaction-diffusion equations (1)-(6) are defined across a two-dimensional rectangular domain representing a tumor tissue. The domain is divided into grid of points with grid sizes Δx and Δy. During each time-step of length Δt, these chemicals diffuse across the grid points and cells consume from the nearby nodes. The central difference scheme is employed to discretize the diffusion term in the equations. The gradient at a grid point (i, j) is calculated by taking the average value of the gradient across the four orthogonal neighboring grid points. We calculate the changes in the chemical concentrations in a fixed time step Δt and write t = nΔt, for n = 0, 1, 2, . . .. As an example, the diffusion term Dv ∇ 2v of VEGF in equation (4) at time t = nΔt can be approximated by
(9)
The other equations in the system (1)-(6) can be implemented in a similar fashion.
2.2Tumor model
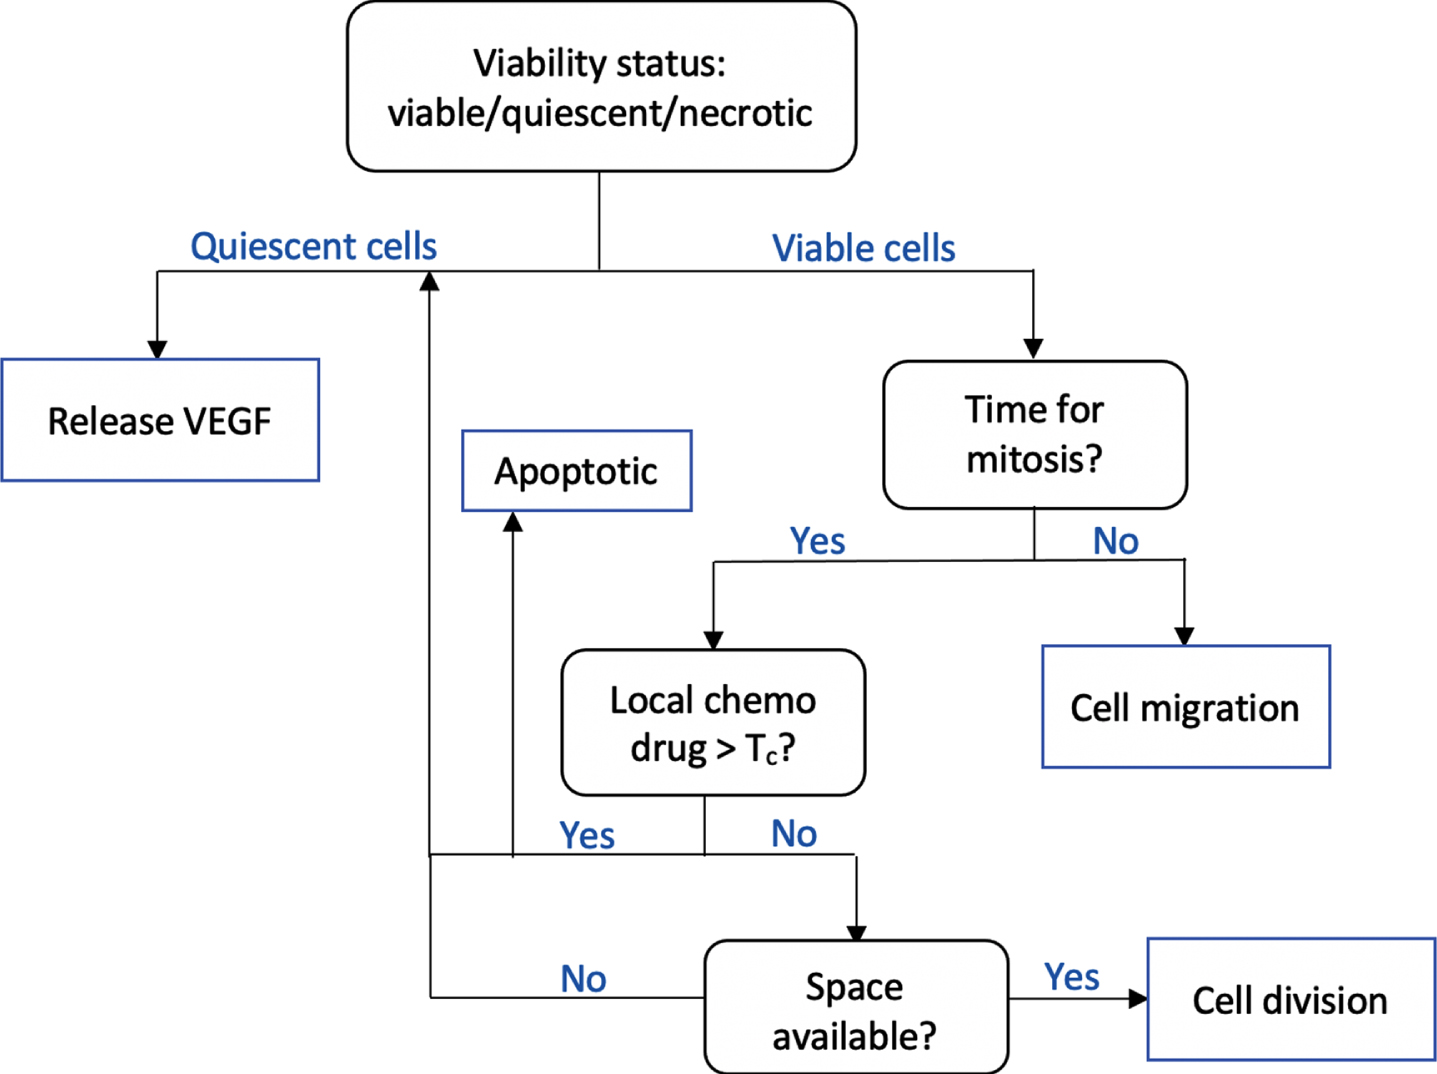
In the cellular scale, the agent-based approach is taken to model tumor phenotypic switch and migration. The object-oriented implementation strongly supports agent-based modeling paradigm. We construct a Tumor class, and each tumor cell is an object with a set of attributes, namely its position, viability status, age, and threshold value Tc that determines the cell’s resistance to chemotherapy drug. At each time step, a tumor cell executes a sequence of operations following the flowchart in Fig. 2.
Fig. 2
The flowchart shows a sequence of checks performed by a tumor cell at each time step. Tumor viability is determined by local oxygen concentration. While necrotic cells are mainly idle, the quiescent cells release VEGF to initiate angiogenesis. Viable tumors may undergo either cell division or migration. Cell division occurs only if it has reached a certain age, is insufficiently affected by chemotherapy drug, and if there is space available.
The operation performed by each tumor cell is primarily dependent on its current state. We determine whether a tumor cell is viable, quiescent, or necrotic based on its local oxygen concentration u (x, t). Two threshold values Tq and Tn are set and a cell is viable if u (x, t) > Tq, necrotic if u (x, t) < Tn, and quiescent otherwise.
While the quiescent cells release VEGF, the viable cells continue to proliferation check to determine if either cell division or cell migration should take place. The proliferation check consists of checking whether a certain time interval T has elapsed since the last cell division and whether there is available space in its surrounding for a cell to divide and give rise to a daughter cell. Physically, this wait-time T ensures that the cell has completed all stages in its cell cycle. In our simulation, we set T to be the cell’s doubling time.
Paclitaxel, which is also known under the brand name Taxol, targets cells that are undergoing mitosis. It specifically prevents cells to achieve metaphase stage and prolong the activation of mitotic checkpoint. Furthermore, it stabilizes microtubules that leads to either cell cycle arrest or apoptotic cell death [27]. In our simulation, we set an individual threshold value Tc for each cell so that it can proceed with mitosis if the local paclitaxel concentration P (x, t) ≤ Tc. If P (x, t) > Tc, the cell pauses until the next iteration, and then randomly chooses whether it undergoes cell cycle arrest and becomes quiescent, or becomes apoptotic. We can capture cell’s variability in drug resistance by setting a random threshold value Tc for individual cell.
Viable cells that are not undergoing mitosis may migrate to nearby available space according to the discrete equation
(10)
(11)
(12)
2.3Angiogenesis model
The tissue scale of the model consists of the algorithm that governs the activation and dynamics of ECs, both the tip and stalk cells. We incorporate the apoptosis signaling pathway, which controls EC survival and apoptosis, in response to the change in VEGF concentration. This approach connects the tissue scale to the molecular scale via the extracellular scale.
Similar to the tumor model described in the previous section, we employ the object-oriented paradigm to implement the angiogenesis model. Each EC is an object with the following attributes: cell type, activation status, position, age, and apoptosis protein concentrations. Cell type is an attribute that takes on a value 1 if the EC is a tip cell and 0 if it is a stalk cell. The activation status has binary value as well. It is 1 if EC has been activated through the binding of VEGF to its receptor VEGFR, and 0 otherwise. As each EC object is equipped with an apoptosis signaling pathway, individual apoptosis protein concentrations are also included as part of the EC’s attributes. This enables us to capture cell variability and resistance to apoptosis. The VEGF-driven processes during the course of angiogenesis are described below.
VEGF-VEGFR binding The binding of VEGF to its receptor VEGFR located on the tip of EC has been shown to be the key process during the initial stage of angiogenesis. We quantify the binding effect using the nonlinear Emax model that is often used in dose-response analysis of drugs [13, 28, 29]. The effect E induced by VEGF upon binding to VEGFR is given by
(13)
Signaling pathway model for EC survival and apoptosis In addition to its role in EC tip activation, the upregulation of VEGF concentration has been shown to inhibit EC apoptosis and promote its survival.
Cellular apoptosis is controlled by two major pathways: the intrinsic and extrinsic pathways. We propose a simplified pathway that still captures the activation and inhibition of the key proteins without increasing the computational complexity as much. The simplified intrinsic and extrinsic pathways are shown in red boxes in Fig. 3. The intrinsic pathway is triggered by intracellular apoptosis stimulus, such as DNA damage, while the extrinsic pathway is triggered by death receptor TNF [30–33]. In response to DNA damage, pro-apoptosis proteins, such as Bax, are activated. The activation of Bax triggers the release of cytochrome c, which in turn activates Caspase 9 protein. In the extrinsic pathway, the tumor necrosis factor (TNF) activates Caspase 8 protein. Both intrinsic and extrinsic pathways converge to the activation of Caspase 3 protein leading to EC apoptosis.
Fig. 3
Schematic diagram of EC intracellular signaling. The proteins involved in apoptosis pathway are represented by red rectangles, while the ones involved in P13K/Akt pathway are represented by blue rectangles. The P13K/Akt terminates at the activation of CXCL8 proangiogenic protein that promotes cell survival, while the apoptosis pathway leads to EC apoptosis.
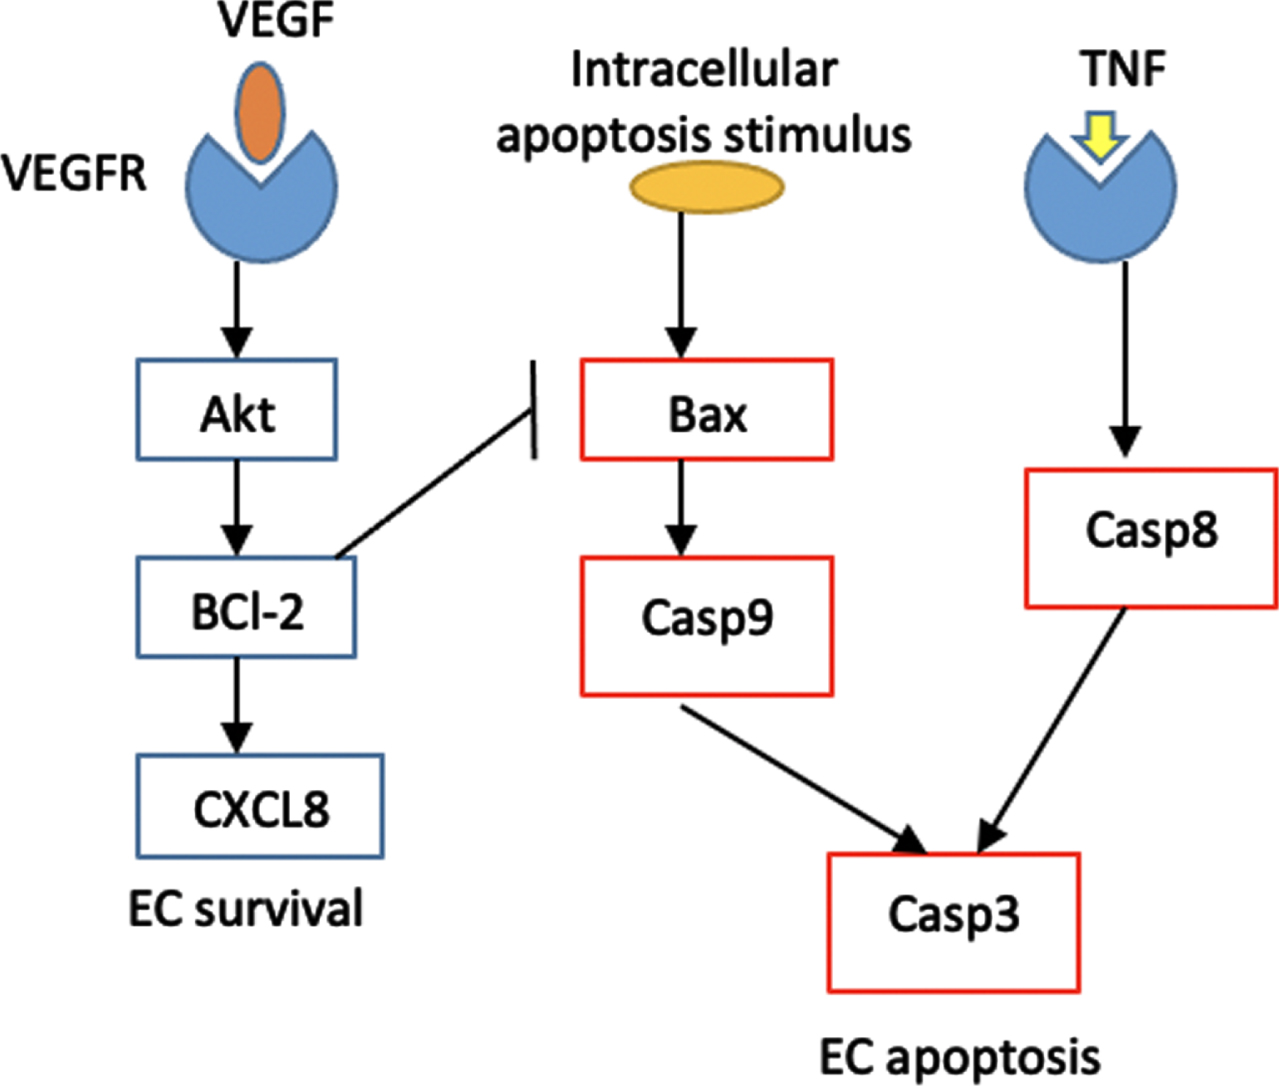
On the other end, the P13K/Akt pathway, repesented by blue boxes in Fig. 3, is activated once diffused VEGF reaches and activates the EC tip. VEGF upregulation induces the expression of BCl-2, which is the anti-apoptosis protein that suppresses the activation of Bax [11, 34]. In addition, BCl-2 activates the proangiogenic chemokine CXCL8 that induces EC survival, proliferation and migration [20].
We incorporate this signaling pathway of the EC into the model to determine the fate of EC in response to VEGF upregulation or its inhibition by bevacizumab. The biochemical kinetics involved in the model are given in Table 4 in the Appendix. We use the law of mass action to translate the biochemical kinetics into a system of ODEs (Table 5) which govern the changes in the apoptosis protein concentrations. The reaction rate constants and initial value of each apoptosis protein are listed in Table 6.
Tip cells migration Upon activation by VEGF, the EC tip cells start to migrate while the stalk cells right behind them proliferate and sprout, forming new vasculature. We assume that the growth direction of the capillary sprout is determined by migratory direction of the EC tip cell. The EC stalk cells behind it proliferate and elongate following the tip cell, forming a contiguous sprout wall.
In our simulation setup, the tumor tissue is represented by a two-dimensional square lattice, where we employ the agent-based approach with biased random walk to model the movement of EC tip on the lattice points. The EC stalk cell right behind the tip cell grows along the horizontal and vertical lines connecting the lattice points that have been previously occupied by the tip cell, forming a continuous capillary, as shown in Fig. 4(a).
Fig. 4
(a) Capillary growth starting from a single EC tip on the parent blood vessel on the left boundary towards higher VEGF concentration on the right boundary. At any grid point, an EC tip may branch out and yields two new EC tips, and the stalk cells behing the tips elongate. Two capillaries may also merge and form a closed loop (anastomosis). Example of branching and anastomosis are indicated. Blue dots denote the EC tips. VEGF gradient directs the migratory direction of the EC tip as well as the branching frequency. As the capillaries move towards higher VEGF concentration, the branching frequency increases. (b) A schematic diagram showing two-dimensional lattice in which an EC tip cell occupying a grid point N5 with its von Neumann neighborhood comprises the four grid points (N1, N2, N3, N4) orthogonal to it. The von Neumann neighborhood defines a set of possible locations to which the EC tip cell can move in the subsequent time step.
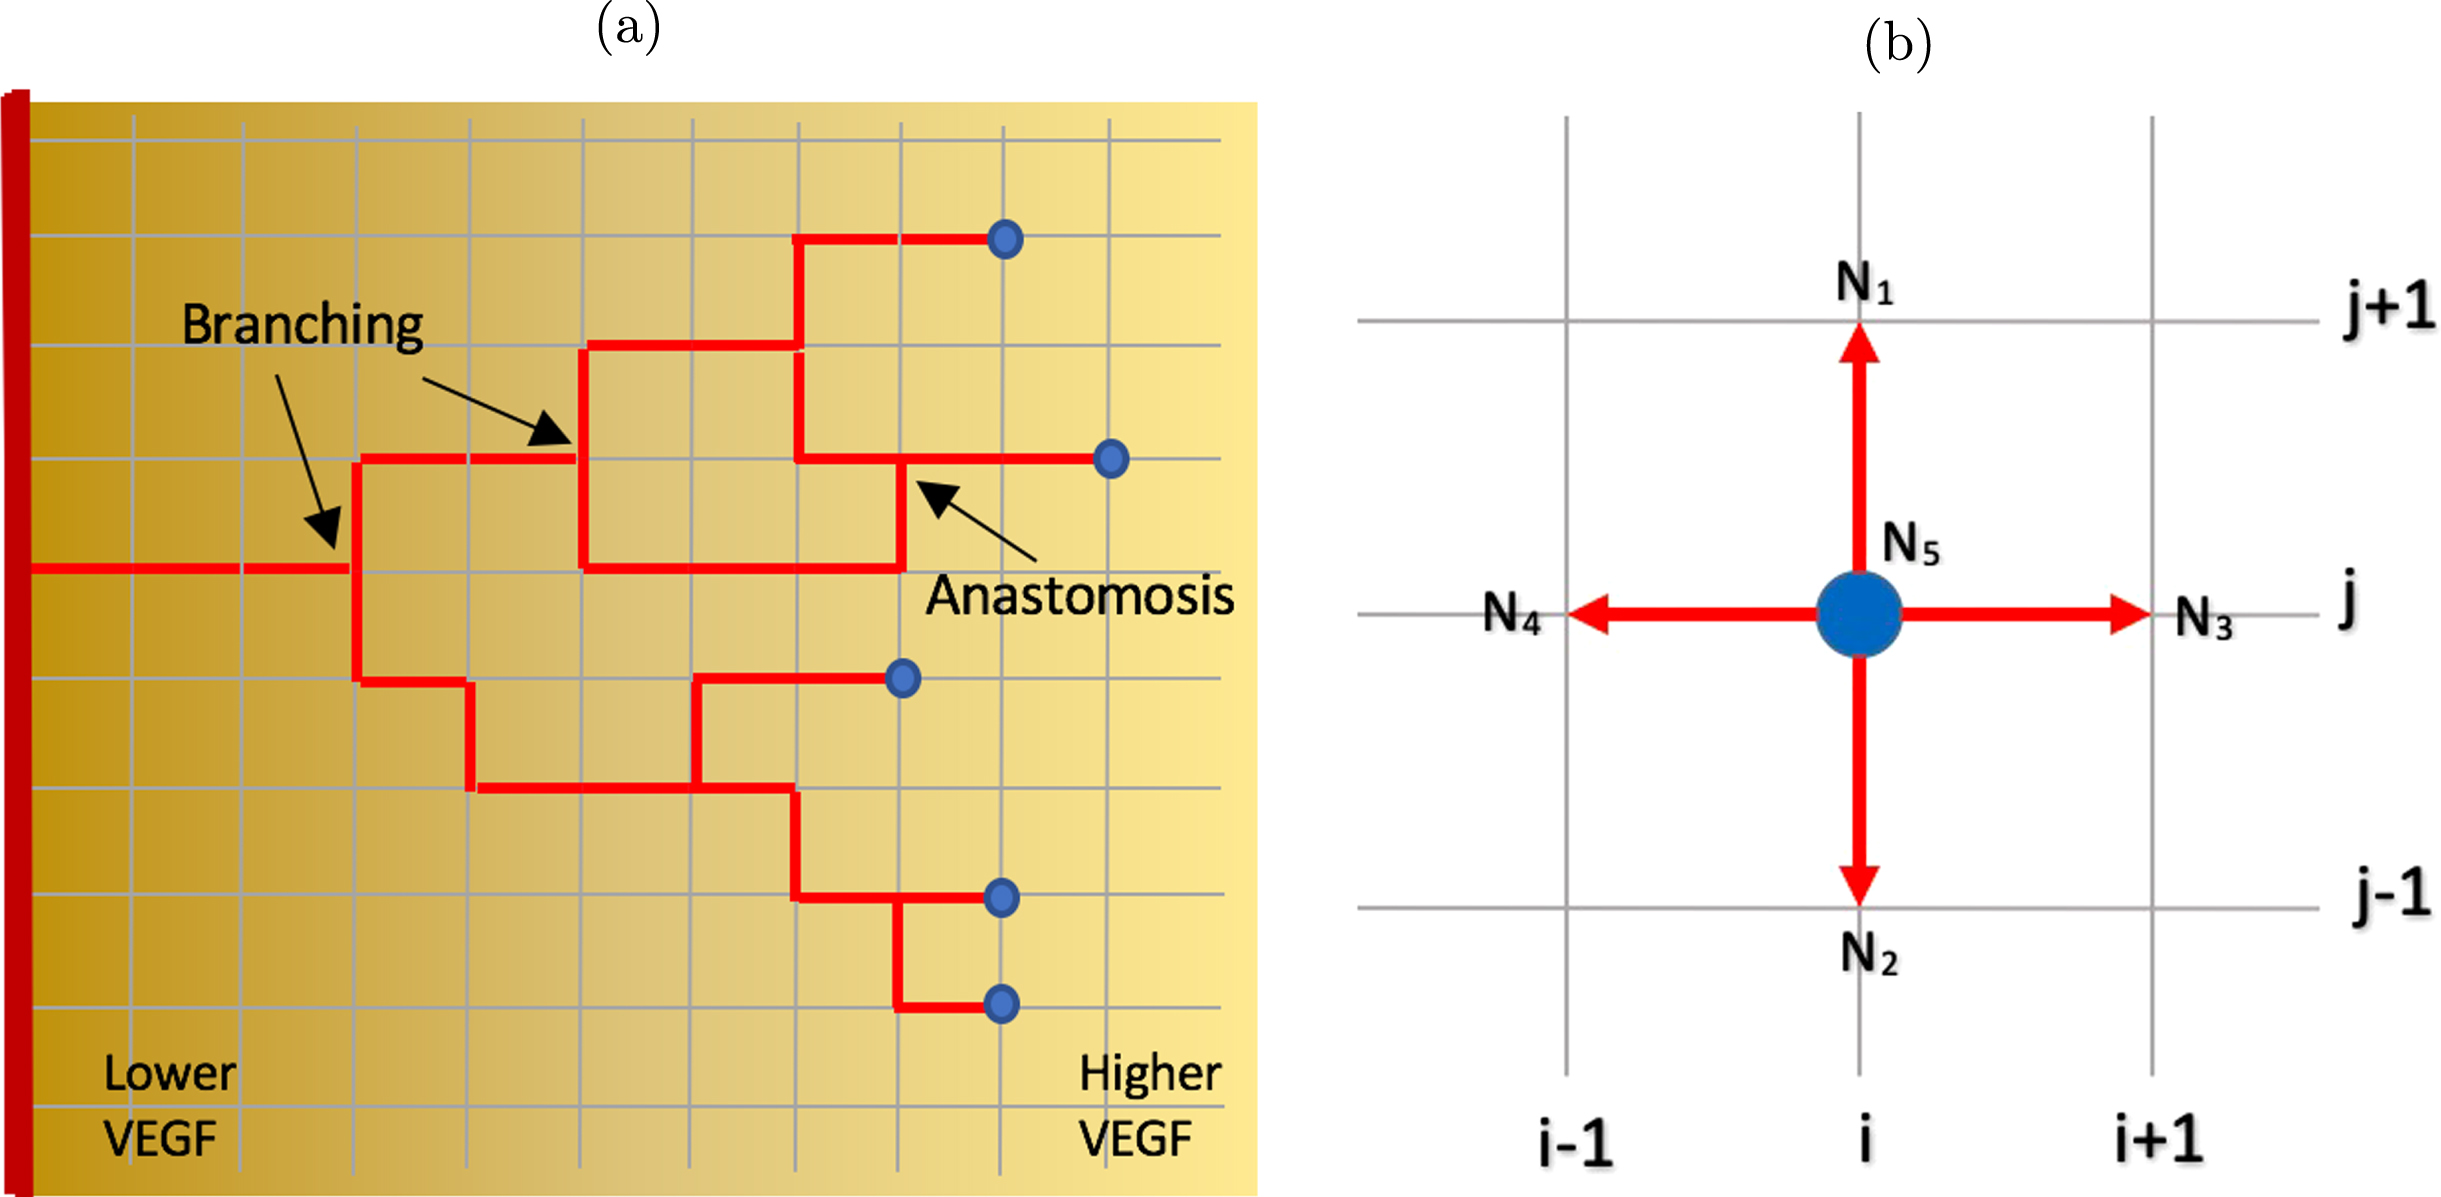
At any given time step, an EC tip cell occupies a grid point (i, j), indicated as node N5 in Fig. 4(b). The four grid points N1, N2, N3, N4 orthogonally surrounding the center grid point N5 form the von Neumann neighborhood for this EC tip cell and these are the possible locations that the cell can migrate to in the subsequent time step. The EC tip cell can move up to position N1 (i, j + 1), move down to N2 (i, j - 1), move right to N3 (i + 1, j), move left to N4 (i - 1, j), or stay at its current position N5 (i, j).
For each k = 1, . . . , 5, we construct the probability function Pk that corresponds to each lattice point Nk to determine the new position of the EC tip in subsequent time step. We take into account the two biasing factors in EC migratory direction, namely the chemotaxis to VEGF and haptotaxis to the extracellular matrix (fibronectin), as proposed in [8, 16]. Thus,
(14)
(15)
(16)
Capillary sprouting and branching A common phenomenon during tumor-induced angiogenesis that has been experimentally observed is the brush border effect, in which the frequency of branching increases at the edge of the network as capillary sprouts get closer to the tumor [35]. Since spatial distance to the tumor correlates with the level of VEGF concentration, we employ positional information approach to model the branching probability as a function of local VEGF concentration. In [23], the branching probability
(17)
At any time step, a random number r ∈ (0, 1) is generated for each agent (the EC tip cell). If r ≤ Pb, then the EC tip will branch out and generates two new EC tips. Two random numbers s1, s2 ∈ (0, 1) are generated and the two new EC tips will occupy gridpoint Nk for which sk ∈ Ik, k = 1, 2. However, if r > Pb, then EC tip will migrate to an adjacent location, as discussed previously, followed by stalk cell elongation and sprouting.
Our algorithm would also allow two capillary sprouts to encounter each other and merge (anastomosis). In the simulation this process would occur if an EC tip happens to occupy a grid point that is currently or previously occupied by another EC tip. In this case, the algorithm decides randomly which sprout will continue to grow and deactivate the other one. The list of parameter values used in the tissue scale is available in Table 3 in the Appendix.
3Results and discussion
Tumor angiogenesis can be quantified through various parameters, such as the estimation of VEGF expression, MVD (Mean Vascular Density), Chalky counting, MAGS (Microscopic Angiogenesis Grading System) scoring, and Color Doppler study [36]. We implement the proposed model in two simulation setups. In the first set of simulations, we aim to analyze the effect of bevacizumab on VEGF expression, capillary density and structure, as well as EC survival. For the simulation domain, we consider a unit square D = [0, 1] × [0, 1] with parent blood vessel with 6 EC tip cells located along the left boundary (x = 0). The line tumor as the source of VEGF is placed along the right boundary (x = 1). The initial VEGF concentration is taken to be
(18)
(19)
In the second set of simulations, we analyze the effect of bevacizumab on the overall tumor growth, both when administered alone and when in combination with chemotherapy drug paclitaxel. Tumor algorithm in Section 2.2 is now incorporated into the simulation. We initially place 400 active and quiescent cells in the center of the simulation domain D = [0, 1] × [0, 1], forming a lump of cells with radius 0.1. The parent blood vessel is located along the four perpendicular sides of the domain, that is, along x = 0, x = 1, y = 0, and y = 1, with two randomly placed EC tip cells per side.
As the tumor used in the laboratory experiment has been inoculated and grown to a certain size, we assume that certain level of VEGF has already been present in the tumor tissue when the first dose of bevacizumab is administered. In our simulation, we take the initial VEGF distribution to be
(20)
We implement our model in C++ programming environment and use MATLAB for data analysis and visualization. For model validation, our simulation results are compared with the experimental data on A549 lung adenocarcinoma from Zhang et al [24].
3.1Effect of bevacizumab on VEGF expression
Bevacizumab works by directly binding the circulating VEGF, thereby lowering the expression of VEGF in the tumor tissue. Using the first simulation setup described earlier, we compute the total VEGF concentration in the tumor tissue ∑(x,y)∈Dv (x, y, t) under bevacizumab treatment as a percentage relative to the total VEGF concentration of the control group (without bevacizumab treatment).
Figure 5 shows the comparison of total VEGF expressions between the control and the case groups with concentrations of 3.0 and 6.0 mg/kg administered in two different ways. In the first treatment method, bevacizumab is administered once at the beginning of experiment, while in the second case, administration is done periodically every other day during the first ten days.
Fig. 5
Total VEGF expression in the tumor tissue under different bevacizumab concentrations. (a) Bevacizumab is administered once at the beginning of the experiment. (b) A fixed amount of bevacizumab is added into the tumor tissue every other day for 10 days of treatment duration. Comparison with experimental data from day 7 measurement from [24] is also shown.
![Total VEGF expression in the tumor tissue under different bevacizumab concentrations. (a) Bevacizumab is administered once at the beginning of the experiment. (b) A fixed amount of bevacizumab is added into the tumor tissue every other day for 10 days of treatment duration. Comparison with experimental data from day 7 measurement from [24] is also shown.](https://content.iospress.com:443/media/isb/2021/14-3-4/isb-14-3-4-isb210235/isb-14-isb210235-g005.jpg)
We compare our simulation result with the experimental data from [24] on day 7, where bevacizumab is administered every other day. In Fig. 5, the total VEGF expression from the experimental control group on day 7 is taken to be the reference value. By comparing (a) and (b) in Fig. 5, we see that periodic treatment, even with lower concentration, shows higher efficacy in suppressing the VEGF expression. With the periodic treatment, bevacizumab with concentration 3.0 mg/kg can reduce the total VEGF expression by more than 45% at the end of day 10, while one-time treatment with concentration 6.0 mg/kg can only decrease the total VEGF expression by 35%.
3.2Effect of bevacizumab on capillary morphology
Using the same setup, we simulate the VEGF-driven capillary formation to investigate the effect of bevacizumab on the capillary structure and branching frequency.
Since the capillary branching probability is defined as a function of VEGF concentration in equation (17), our model is able to quantitatively measure the effect of different bevacizumab concentration on the branching frequency. Figure 6 shows that during the first four days, there is no significant difference between the control group and the case groups. However, at the end of day 10, bevacizumab concentrations of 3.0 and 6.0 mg/kg give approximately 50% and 65% reductions in the total number of branching when given once on day 1. If given periodically, the reduction is much greater, that is, 66% and 83% for concentration of 3.0 and 6.0 mg/kg, respectively.
Fig. 6
The effect of different bevacizumab concentrations on the total number of capillary branching during the first 10 days of treatment. (a) Bevacizumab is administered once at the beginning of the experiment. (b) A fixed amount of bevacizumab is added into the tumor tissue every other day for 10 days of treatment duration. Comparison with experimental data from day 7 measurement from [24] is also shown.
![The effect of different bevacizumab concentrations on the total number of capillary branching during the first 10 days of treatment. (a) Bevacizumab is administered once at the beginning of the experiment. (b) A fixed amount of bevacizumab is added into the tumor tissue every other day for 10 days of treatment duration. Comparison with experimental data from day 7 measurement from [24] is also shown.](https://content.iospress.com:443/media/isb/2021/14-3-4/isb-14-3-4-isb210235/isb-14-isb210235-g006.jpg)
Counting branching frequency directly is difficult to achieve in a laboratory experiment. A more common approach to quantify angiogenesis is by calculating the vascular density, which is defined to be the total length of perfused vessels per unit area of observation field. Zhang et al [24] provides experimental data on the vascular density of the control group and case groups after 7 days of periodic bevacizumab treatment. As branching frequency correlates to vascular density and both can be used to measure tumor vascularization, we take these experimental data to test the model. The comparison between experimental data and simulation results on the branching frequency is shown in Figure 6(b), where the total number of branching of the control group on day 7 is taken to be the reference value.
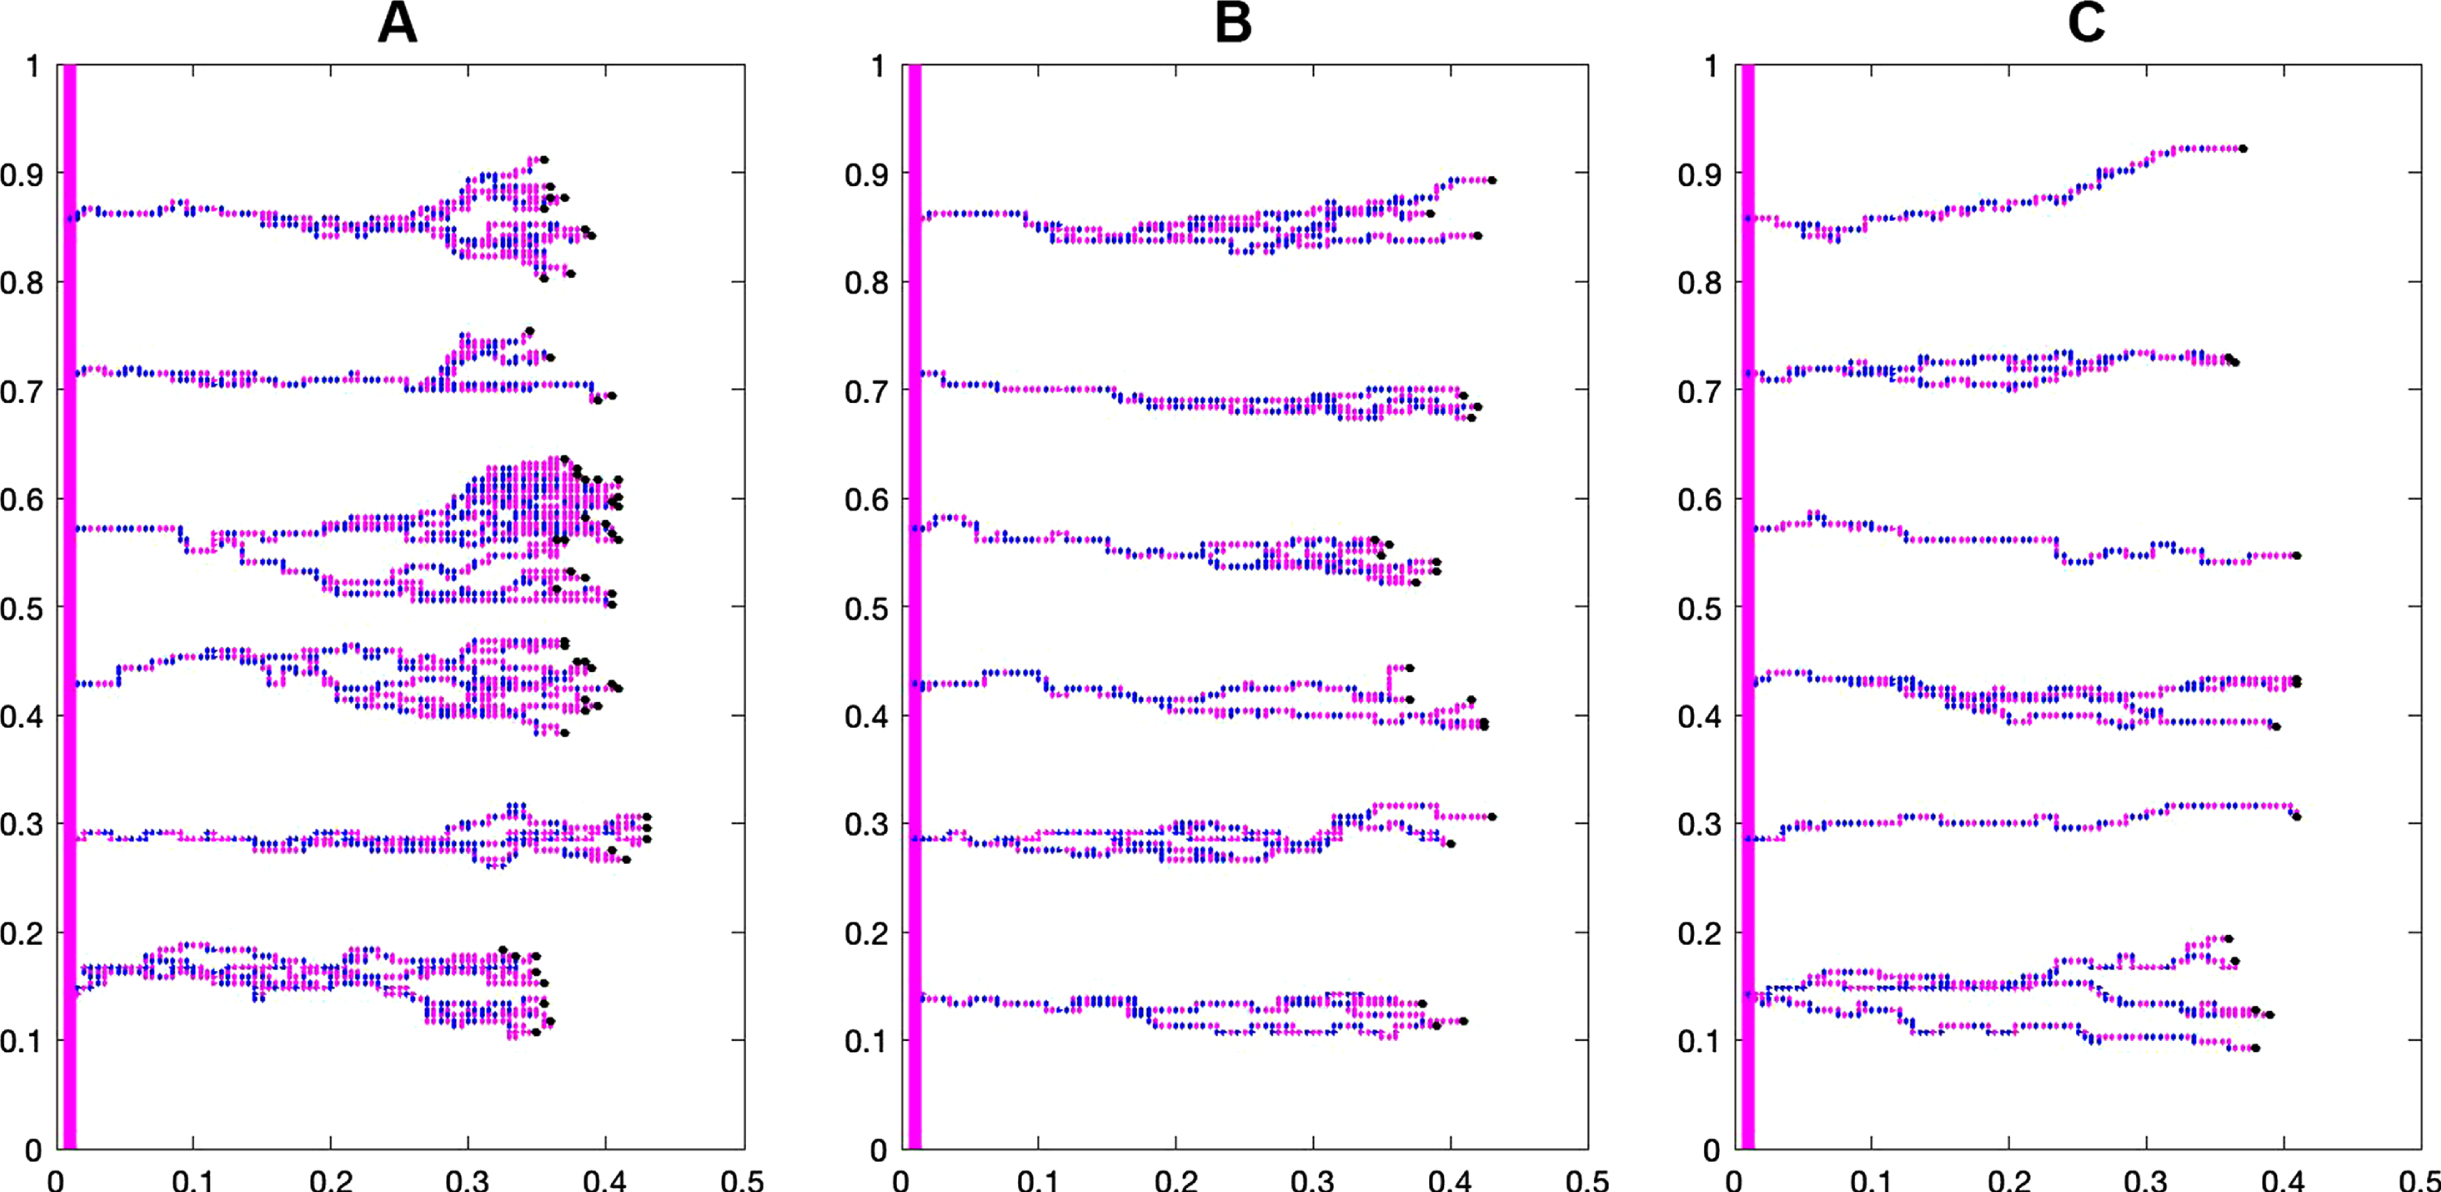
Figure 7 shows the difference in capillary structure between the control and case groups. Branching and brush border formation are clearly seen in the control group, but these phenomena are less prominent as bevacizumab concentration increases.
Fig. 7
The effect of different bevacizumab concentrations on the capillary structure during the first 10 days of treatment: A) Control group, B) Bevacizumab 3 mg/kg, and C) Bevacizumab 6 mg/kg.
3.3Effect of bevacizumab on EC survival
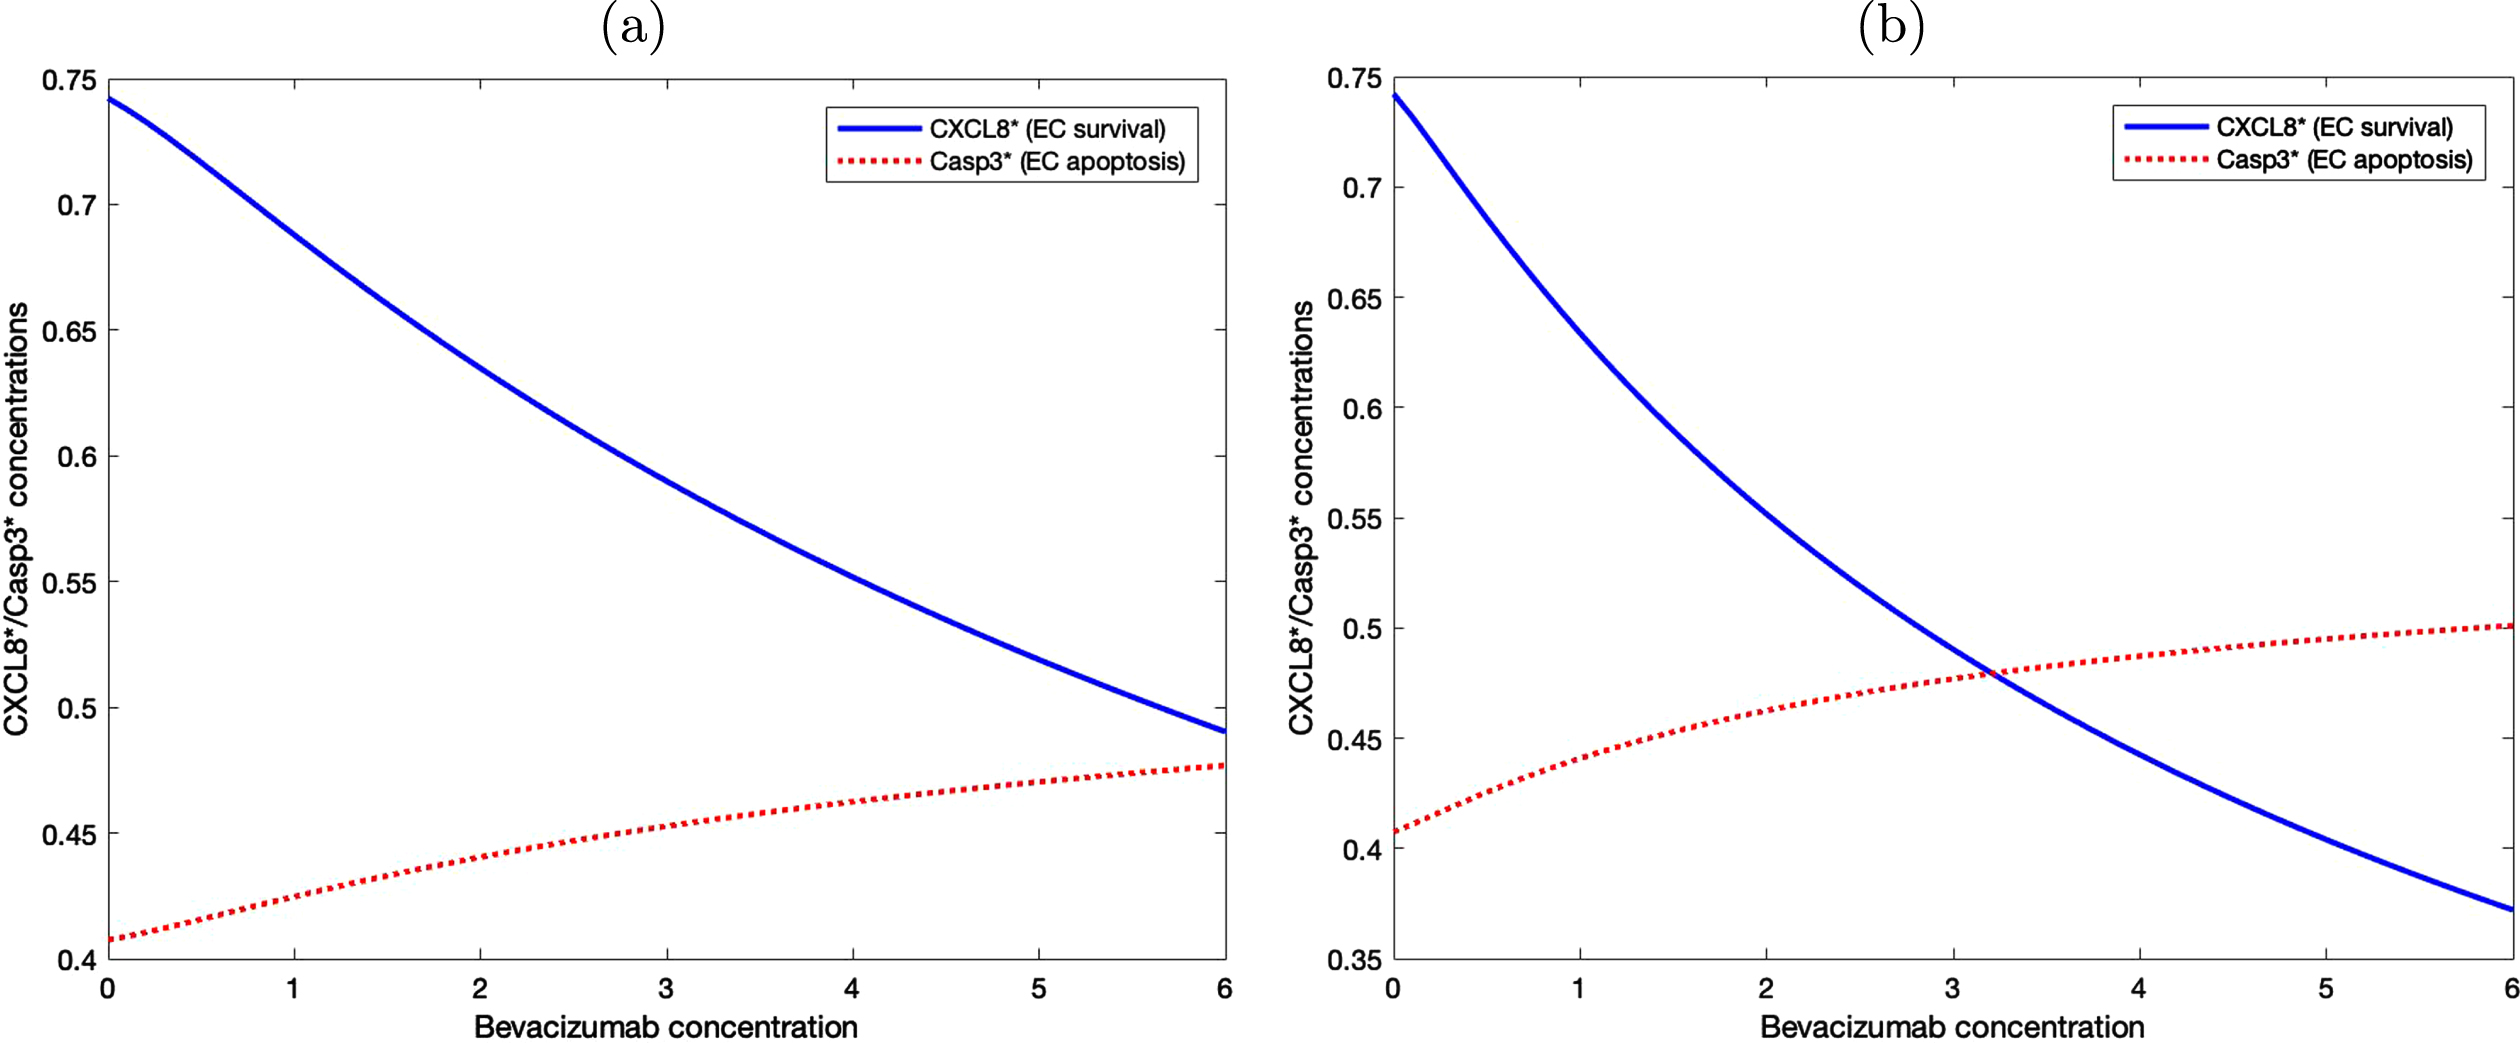
To analyze the effect of various bevacizumab concentrations on EC survival and apoptosis, we implement the signaling pathway in Table 5. Since apoptosis is determined by the level of activated Caspase 3 protein and the activated CXCL8 level is directly associated with EC proliferation and migration, in our model we determine EC viability by taking the numerical difference between the level of these two protein concentrations.
Figure 8 shows the level of activated CXCL8 and Caspase 3 proteins with various bevacizumab concentrations under two different treatment methods. In (a), the level of activated CXCL8 associated with cell survival is constantly higher than the level of Caspase 3 that drives cellular apoptosis, although the difference decreases as bevacizumab concentration increases. In (b), bevacizumab is administered periodically every other day and the level of Caspase 3 protein starts to exceed the level of activated CXCL8 when the bevacizumab concentration is slightly above 3. This result suggests that periodic administration of bevacizumab is more effective even with a much lower concentration.
Fig. 8
EC survival and apoptosis are determined by the level of activated CXCL8 and Casp3 proteins. (a) Bevacizumab is administered once at the beginning of the experiment. (b) Bevacizumab is administered periodically every other day.
3.4Effect of bevacizumab on tumor growth
We now combine the tumor and angiogenesis models described in Sections 2.2 and 2.3 to simulate the effect of bevacizumab on the overall tumor growth.
Recall that in the setup of the second set of simulations described earlier, the parent blood vessels are located along the boundary of the simulation domain D = [0, 1] × [0, 1]. Thus, we define the bevacizumab concentration at the administration time tk by
(21)
For each treatment dosage, we run 10 simulations and record the average tumor radius, which is taken to be the largest distance from a tumor cell to the center of the lump at (0.5, 0.5). Assuming the spherical shape of the tumor mass, the volume can be estimated according to the formula V = (4/3) πr3. Figure 9 shows the growth of the tumor during the first 10 days of treatment. The volume of the tumor in the control group on day 9 is taken to be the reference volume, where the volume at different days or different treatment groups are calculated as a percentage relative to this reference value. Compared with the control group, tumor growth in the case groups slows down significantly once treatment starts. Lower bevacizumab concentration (3 mg/kg) reduces the tumor volume on day 10 by 30% while bevacizumab with twice higher concentration can reduce the tumor volume up to approximately 55%, suggesting that bevacizumab suppresses tumor growth in concentration dependent manner.
Fig. 9
The effect of different bevacizumab concentrations on the tumor volume during the first 10 days of periodic treatment. Bevacizumab is administered on day 0, 2,...,10. Comparison with experimental data from day 7 measurement from [24] is also shown.
![The effect of different bevacizumab concentrations on the tumor volume during the first 10 days of periodic treatment. Bevacizumab is administered on day 0, 2,...,10. Comparison with experimental data from day 7 measurement from [24] is also shown.](https://content.iospress.com:443/media/isb/2021/14-3-4/isb-14-3-4-isb210235/isb-14-isb210235-g009.jpg)
3.5Exploring bevacizumab-paclitaxel combined treatment
Experiments have shown promising efficacy data in combined therapy that involves chemotherapy drug and anti-VEGF. Using the proposed model, we investigate the role of bevacizumab in a combined treatment with chemotherapy drug paclitaxel. Our simulation result indicates the importance of continuous bevacizumab administration during the maintenance phase after chemotherapy.
Incorporating equations (6) and (8) into the extracellular component of the model, we adopt the treatment schedule used in Ishikura et al [37] in which 20 mg/kg paclitaxel and 5mg/kg bevacizumab were administered on inoculated A549 lung cancer cells. Four treatment groups are considered. The first group is the untreated control group. In group 2, paclitaxel is administered on days 1, 8 and 15. In group 3, both paclitaxel and bevacizumab are administered simultaneously on days 1, 8 and 15. Finally in group 4, after both paclitaxel and bevacizumab are administered on days 1, 8, 15, weekly bevacizumab administration continues on during the maintenance phase.
Since both paclitaxel and bevacizumab are injected into the tissue intravenously, we set their concentration on the parent blood vessels located along the domain boundary at the administration time tk to be
(22)
Figure 10 shows the comparison in tumor volume between these treatment groups. The volume of each group is calculated as a percentage relative to the volume of the control group on day 32. While paclitaxel alone can reduce the tumor volume by around 40%, combination with bevacizumab supresses the volume by approximately 55%. We note that in both groups, the tumor can still grow after the last treatment on day 15 before reaching their stable volume at around day 25. In group 4, continuous suppression of angiogenesis by bevacizumab may contribute to higher antitumor activity and smaller tumor volume.
Fig. 10
Comparison of the tumor growth in stand-alone chemotherapy, in combined treatments with bevacizumab, and in combined treatments followed by bevacizumab maintenance.
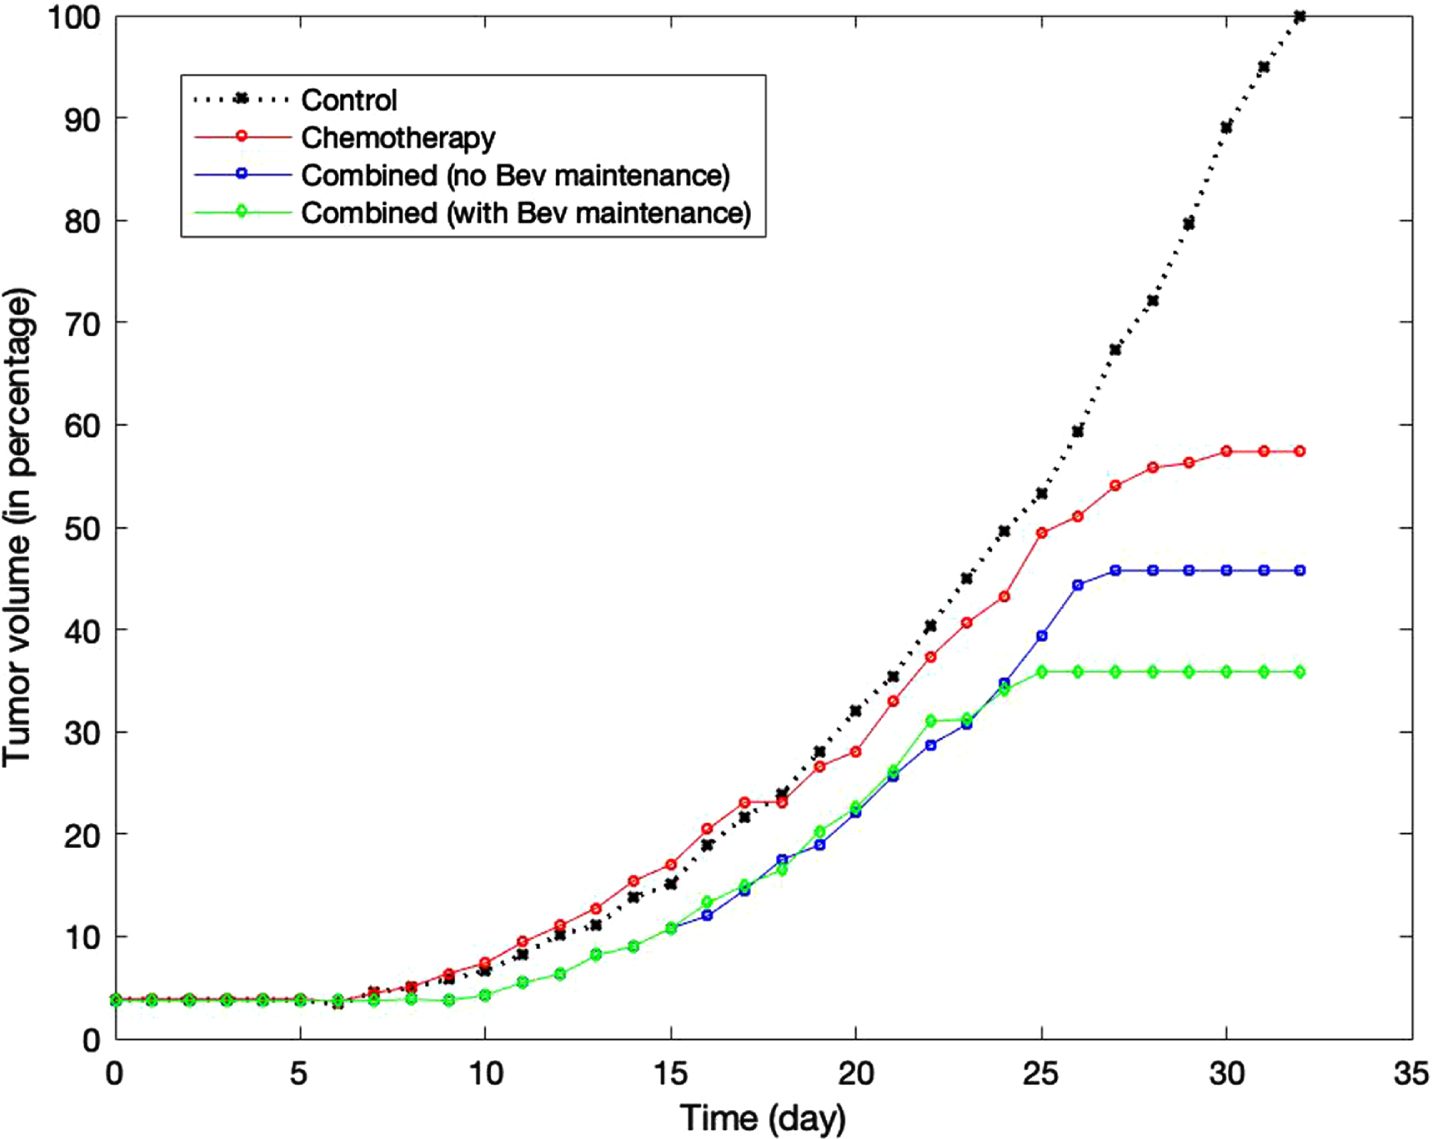
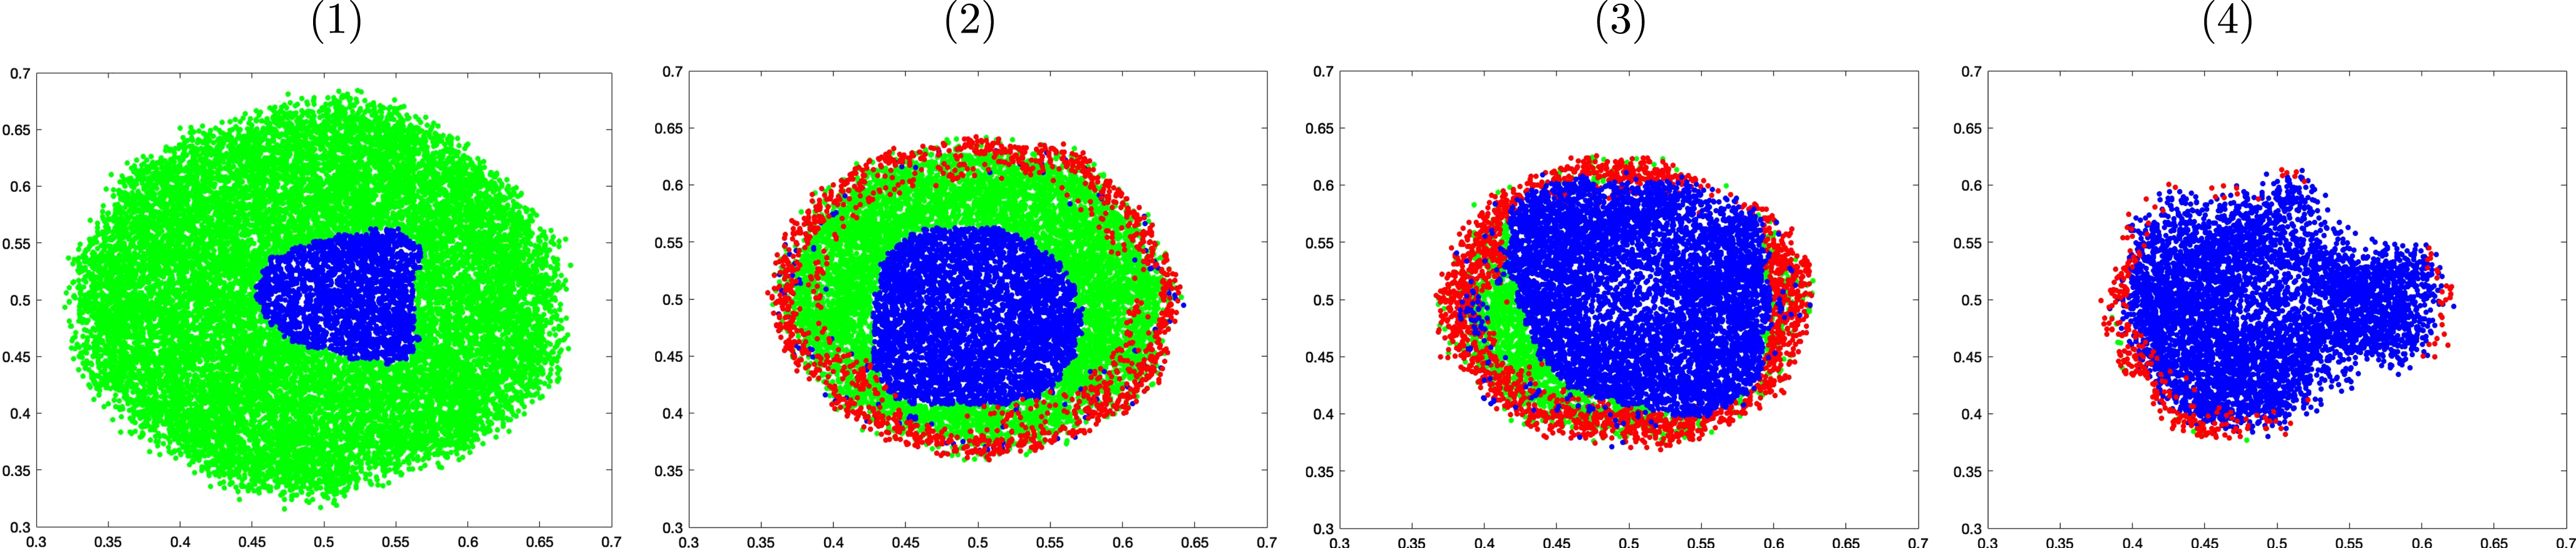
Figure 11 shows the cross section of the tumor morphology under these treatments on day 32. The proliferative cells are colored in green, while the quiescent and apoptotic cells are shown in blue and red, respectively. Under chemotherapy stand-alone treatment, proliferative cells still make up a good portion of the lump even though the apoptotic cells are visible around the perimeter. These viable cells can potentially keep growing unless paclitaxel is administered with sufficiently high concentration to eventually stop its growth and achieve stable volume. In groups 3 and 4, quiescent cells make up the biggest portion of the lump as bevacizumab suppresses angiogenesis and oxygen delivery. Although apoptotic cells are found on the perimeter in both groups, more viable cells are seen in group 3 than in group 4, and consequently the tumor in group 3 saturates at a higher volume. In group 4, the majority of the cells have become quiescent. These cells, although not apoptotic, cannot grow or divide.
Fig. 11
Cross sectional comparison of the tumor morphology on day 32 of the control group (1), under paclitaxel treatment only (2), under combined therapy with no maintenance (3), and under combined treatment followed by bevacizumab maintenance (4).
4Conclusion
Our previously developed multi-scale tumor model has been extended to incorporate detailed mechanism of VEGF during angiogenesis and simulate tumor response to VEGF inhibitor, such as bevacizumab. The strengths of the proposed model come from the use of multiscale, hybrid discrete-continuous approach that provides transparency and flexibility in modeling different parts of the tumor system.
We adopt the Emax model to control the activation of EC upon binding with VEGF. A set of biochemical kinetics equations for the EC intracellular signaling is now incorporated into the molecular scale of the model and it takes into account the VEGF expression as a factor that influences cellular apoptosis and survival. By employing a discrete biased random walk in modeling VEGF-driven capillary formation, we can directly investigate the effect of bevacizumab on the capillary density and structure. Furthermore, it allows us to model the blood flow through the fine capillary network that delivers both the oxygen and anti-tumor drugs, rather than make a simplified assumption that any cell within a fixed distance from the blood vessel receives sufficient supply of these chemicals. Likewise, by employing the agent-based model for the tumor cell, we can include individual variability in cell viability and resistance to chemotherapy drug, mimicking the actual tumor system.
The inclusion of the EC apoptosis pathway allows us to quantify EC cell survival as the numerical difference between two main proteins that are responsible for cell apoptosis and survival. Although this would be difficult, if not impossible, to test in the experiment, the simulation result is able to show that periodic treatment with lower concentration can achieve greater efficacy than a one-time treatment with higher concentration. Moreoever, our simulation of the combined therapy also shows significant reduction in the tumor volume when continuous administration of bevacizumab is maintained post chemotherapy.
We realize that the proposed model still has shortcomings that can be addressed in future work. The current model considers VEGF as the only switch that can trigger angiogenesis even though there are many angiogenic pathways that may allow angiogenesis to occur even though VEGF pathway has been completely blocked. Additionally, although the current model is able to produce results that agree with the experiments, the simulation is run in two-dimensional setting to minimize computational cost. Given the transparency and flexibility of the hybrid agent-based model, one could naturally extend this to three dimensions to achieve better precisions.
Author contributions
M.H. developed computational model, wrote computer codes, performed simulations, analyzed data and simulation results. J. S. formulated biological questions and performed literature study. Both authors designed the project and wrote the paper.
References
[1] | Gerhardt H. , Golding M. , Fruttinger M. , et al., VEGF guidesangiogenic sprouting utilizing endothelial tip cell filopodia, Journal of Cell Biology 161: ((2003) ), 1163–1177. |
[2] | Yoshida A. , Anand-Apte B. and Zetter B.R. , Differential endothelialmigration and proliferation to basic fibroblast growth factor andvascular endothelial growth factor, Growth Factors 13: (1996), 57–64. |
[3] | Paweletz N. and Knierim M. , Tumor-related angiogenesis, Critical Review in Oncology/Hematology 9: ((1989) ), 197–242. |
[4] | Terranova V.P. , Diorio R. , Lyall R.M. , et al., Human endothelialcells are chemotactic to endothelial cell growth factor and heparin, Journal of Cell Biology 101: ((1985) ), 2330–2334. |
[5] | Suchting S. and Eichmann A. , Jagged gives endothelial tip cells anedge, Cell 137: ((2009) ), 988–990. |
[6] | Cao Y. , Chen H. , Zhou L. , et al., Heterodimers of placenta growthfactor/vascular endothelial growth factor: endothelial activity,tumor cell expression, and high affinity binding to FLK-1/KDR, Journal of Biological Chemistry 271: ((1996) ), 3154–3162. |
[7] | Stetler-Stevenson W.G. , Matrix metalloproteinases in angiogenesis: amoving target for therapeutic intervention, Journal of ClinicalInvestigation 103: ((1999) ), 1237–1241. |
[8] | Stokes C.L. and Lauffenburger D.A. , Analysis of the roles ofmicrovessel endothelial cell random motility and chemotaxis inangiogenesis, Journal of Theoretical Biology 152: ((1991) ), 377–403. |
[9] | Lee S. , Chen T. , Barber C. , et al., Autocrine VEGF signaling isrequired for vascular homeostatis, Cell 130: ((2007) ), 691–703. |
[10] | Zachary I. , VEGF signaling: integration and multi-tasking inendothelial cell biology, Biochem Soc Trans 31: ((2003) ), 1171–1177. |
[11] | Nör J.E. , Christensen J. , Mooney D.J. and Polverini P.J. , Vascular endothelial growth factor (VEGF)-mediated angiogenesis isassociated with enhanced endothelial cell survival and induction ofBcl-2 expression, Am J Pathol 154: ((1999) ), 375–384. |
[12] | Drexler D.A. , Sapi J. and Kovacs L. , Modeling of Tumor GrowthIncorporating the Effects of Necrosis and the Effect of Bevacizumab, Complexity 2017: , Article ID 5985031, https://doi.org/10.1155/2017/5985031. |
[13] | Billy F. , et al., A pharmacologically based multiscale mathematicalmodel of angiogenesis and its use in investigating the efficacy of anew cancer treatment strategy, Journal of Theoretical Biology 260: ((2009) ), 545–562. |
[14] | Gevertz J.L. , Computational Modeling of Tumor Response toVascular-Targeting Therapies –Part I: Validation,Article ID 15, Computational and Mathematical Methods in Medicine 2011: , Article ID 830515, doi: 10.1155/2011/830515. |
[15] | Wang J. , et al., Multi-scale agent-based modeling on melanoma andits related angiogenesis analysis, Theor Biol Med Model 10: ((2013) ), 41. |
[16] | Sun X. , Zhang L. and Tan H. , et al., Multi-scale agent-based braincancer modeling and prediction of TKI treatment response: Incorporating EGFR signaling pathway and angiogenesis, BMC Bioinformatics 13: ((2012) ), 218. |
[17] | Lai X. and Friedman A. , Mathematical modeling in scheduling cancertreatment with combination of VEGF inhibitor and chemotherapy drugs, J Theor Biol 462: ((2019) ), 490–498. |
[18] | Mollard S. , et al., Model driven optimization of antiangiogenics +cytotoxics combination: application to breast cancer mice treatedwith bevacizumab + paclitaxel doublet leads to reduced tumor growthand fewer metastasis, Oncotarget 8: ((2017) ), 23087–23098. |
[19] | Jain H.V. , Nör J.E. and Jackson T.L. , Quantification ofendothelial cell-targeted anti-BCl-2 therapy and its suppression oftumor growth and vascularization, Mol Cancer Ther 8: (2009), 2926–2936. |
[20] | Jain H.V. , Nör J.E. and Jackson T.L. , Modeling theVEGF-Bcl-2-CXCL8 pathway in intratumoral angiogenesis, Bull Math Bio 70: ((2008) ), 89–117. |
[21] | Finley S.D. , Chu L. and Popel A.S. , Computational systems biologyapproaches to antiangiogenic cancer therapeutics, Drug DiscovToday 20: ((2015) ), 187–197. |
[22] | Hendrata M. and Sudiono J. , A computational model for investigatingtumor apoptosis induced by mesenchymal stem cell-derived secretome, Computational and Mathematical Methods in Medicine 2016: , Article ID 4910603, https://doi.org/10.1155/2016/4910603. |
[23] | Hendrata M. and Sudiono J. , A hybrid multiscale model forinvestigating tumor angiogenesis and its response to cell-basedtherapy, In Silico Biology 13: ((2019) ), 1–20. |
[24] | Zhang N. , Zhang G. , Zheng Y. , Wang T. and Wang H. , Effect of Avastinon the number and structure of tumor blood vessels of nude mice withA549 lung adenocarcinoma, Experimental and TherapeuticMedicine 8: ((2014) ), 1723–1726. |
[25] | Franklin M. , A549 - A Model for Non-Small Cell Lung Cancer, MiBioresearch, Retrieved January 20, 2021. |
[26] | Strikwerda J.C. , Finite Difference Schemes and Partial Differential Equations, SIAM, 2004. |
[27] | Bacus S. , et al., Taxol-induced apoptosis depends on MAP kinasepathways (ERK and p38) and is independent of p53, Oncogene 20: ((2001) ), 147–155. |
[28] | Macdougall J. , Analysis of Dose–Response Studies–Emax Model. Dose Finding in Drug Development, Springer (2006), 127–145. |
[29] | Salahudeen M.S. and Nishtala P.S. , An overview of pharmacodynamicmodelling, ligand-binding approach and its application in clinicalpractice, Saudi Pharm J 25: ((2017) ), 165–175. |
[30] | Fujio Y. and Walsh K. , Akt mediates cytoprotection of endothelialcells by vascular endothelial growth factor in ananchorage-dependent manner, J Biol Chem 274: ((1999) ), 16349–16354. |
[31] | Gerber H.P. , et al., Vascular endothelial growth factor regulatesendothelial cell survival through the phosphatidylinositol3-kinase/Akt signal transduction pathway: requirement for Flk-1/KDRactivation, J Biol Chem 273: ((1998) ), 30336–30343. |
[32] | Gerber H.P. , Dixit V. and Ferrara N. , Vascular endothelial growthfactor induces expression of the antiapoptotic proteins Bcl-2 and A1in vascular endothelial cells, J Biol Chem 273: ((1998) ), 13313–13316. |
[33] | Spyridopoulos I. , et al., Vascular endothelial growth factorinhibits endothelial cell apoptosis induced by tumor necrosisfactor-alpha: balance between growth and death signals, J MolCell Cardiol 29: ((1997) ), 1321–1330. |
[34] | Pidgeon G.P. , Barr M.P. , Harmey J.H. and Foley D.A. , and D.J.Bouchier-Hayes, Vascular endothelial growth factor (VEGF)upregulates BCl-2 and inhibits apoptosis in human and murine mammaryadenocarcinoma cells, British Journal of Cancer 85: (2001), 273–278. |
[35] | Muthukkaruppan V.R. , Kubai L. and Auerbach R. , Tumor-inducedneovascularization in the mouse eye, J Natl Cancer Inst 69: ((1982) ), 699–705. |
[36] | Sudiono J. and Thalib S. , Angiogenesis intensity within benign andmalignant oral mucosa epithelial tumor, Mol Cell Biomed Sci 2: ((2018) ), 23–27. |
[37] | Ishikura N. , et al., Importance of bevacizumab maintenance followingcombination chemotherapy in human non-small cell lung cancerxenograft models, Anticancer Research 37: ((2017) ), 623–630. |
[38] | Grote J. , Susskind R. and Vaupel P. , Oxygen diffusivity in tumortissue (DS-Carcinosarcoma) under temperature conditions within therange of 20-40C, Pugers Archiv 372: ((1977) ), 37–42. doi: 10.1007/BF00582204. |
[39] | Casciari J.J. , Sotirchos S.V. and Sutherland R.M. , Mathematicalmodelling of microenvironment and growth in EMT6/Ro multicellulartumor spheroids, Cell Proliferation 25: ((1992) ), 1–22. |
[40] | Hotary K. , Allen E.D. , Punturieri A. , Yana I. and Weiss S.J. , Regulation of cell invasion and morphogenesis in a 3-dimensionaltype I collagen matrix by membrane-type metalloproteinases 1, 2 and 3, Journal of Cell Biology 149: ((2000) ), 1309–1323. |
[41] | Anderson A.R.A. , A hybrid mathematical model of solid tumourinvasion: the importance of cell adhesion, MathematicalMedicine and Biology 22: ((2005) ), 163–186. |
[42] | Anderson A. and Chaplain M. , Continuous and Discrete MathematicalModels of Tumor-induced Angiogenesis, Bulletin of MathematicalBiology 60: ((1998) ), 857–900. |
[43] | Papadopoulos N. , et al., Binding and neutralization of vascularendothelial growth factor (VEGF) and related ligands by VEGF Trap,ranibizumab and bevacizumab, Angiogenesis 15: ((2012) ), 171–185. |
[44] | Welter M. and Rieger H. , Interstitial Fluid Flow and Drug Deliveryin Vascularized Tumors: A Computational Model, PLoS ONE 8: (8) ((2013) ), e70395. https://doi.org/10.1371/journal.pone.0070395. |
[45] | Cremasco M. and Wang L. , Estimation of partition, free and specificdiffusion coefficients of paclitaxel and taxanes in a fixed bed bymoment analysis: experimental, modeling and simulation studies, Acta Scientiarum 34: ((2012) ), 33–40. |
[46] | A549 Cell Line: Cell Culture and Transfection Protocol, https://www.a549.com/cell-subcultureprotocol/, Retrieved January 20, 2021. |
Appendices
Appendix
Table 1
Parameter values used in the extracellular component of the model
| Symbol | Parameter | Value | Reference |
| Du | Oxygen diffusion coefficient | 1.75 × 10⁻⁵ cm2/s | [38] |
| γu | Tumor cell oxygen consumption rate | 6.25 × 10⁻¹⁷ M/cells/s | [39] |
| ∈ | Degree of chemical localization | 0.1 | Est. in [22] |
| δu | Oxygen decay rate | 10-3/h | [13] |
| pu | Vessel permeability of oxygen | 3 × 10⁻⁴ cm/s | [16] |
| r | Blood vessel radius | 0.001 cm | [16] |
| Dm | MDE diffusion coefficient | 10-9 cm2/s | [40] |
| μm | Single cell MDE production rate | 1* | [41] |
| δm | MDE decay rate | 0* | [41] |
| δf | ECM degradation rate | 50* | [41] |
| μf | Fibronectin production rate | 0.05* | [42] |
| Dv | VEGF diffusion coefficient | 2.9 × 10⁻⁷ cm2/s | [42] |
| μv | VEGF production rate | 0.6 nM/h | [16] |
| δv | VEGF decay rate | 0.001/h | [14] |
| γv | VEGF uptake rate | 0.1 × 10⁻⁴ /s | [42] |
| β | Binding rate of VEGF and bevacizumab | 35.1 pM | [43] |
| DB | Bevacizumab diffusion coefficient | 4 × 10⁻⁷ cm2/s | [17] |
| δB | Bevacizumab degradation rate | 0.17 day-1 | [17] |
| p | Vessel permeability to drug in tumor tissue | 17103 μ/s | [44] |
| DP | Paclitaxel diffusion coefficient | 4.27 × 10⁻⁶ cm2/s | [45] |
| γP | Paclitaxel uptake rate | 27.68 cm3/g· day | [17] |
| δP | Paclitaxel degradation rate | 1.23 day-1 | [17] |
*=non-dimensionalized value
Table 2
Parameter values used in the cellular component of the model
| Symbol | Parameter | Value | Reference |
| CA/CR | Attraction to repulsion coefficient ratio | 0.3* | [23] |
| lA, lR | Attraction and repulsion length-scales | 0.5, 0.1* | [23] |
| ξ | Haptotaxis coefficient | 2600 cm2/s/M | [41] |
| T | A549 lung cancer cell doubling time | 22 hours | [46] |
| Tq | Threshold oxygen level for quiescent state | 0.5 | Est. in [22, 23] |
| Tn | Threshold oxygen level for necrotic state | 0.4 | Est. in [22, 23] |
| Tc | Threshold value of paclitaxel toxicity | 0.39 | Est. |
*=non-dimensionalized value
Table 3
Parameter values used in the tissue component of the model
| Symbol | Parameter | Value | Reference |
| α | EC chemotaxis coefficient | 2600 cm2 s-1 M-1 | [42] |
| λ | EC haptotaxis coefficient | 986 cm2 s-1 M-1 | [42] |
| σ | Constant of VEGF chemotaxis sensitivity | 1.667 × 10⁻¹⁰* | [42] |
| Emax | Maximum effect of VEGF on EC activation | 0.05 h-1 | [13] |
| KD | Dissociation constant of VEGF at VEGF receptor | 10-7 M | [13] |
| Eactive | Threshold for EC activation | 0 . 5* | Est. |
*=non-dimensionalized value
Table 4
Biochemical kinetics involved in apoptosis signaling pathways of endothelial cell
| VEGF + Bevacizumab
|
| VEGF + Akt
|
| Akt* + BCl 2
|
| BCl 2* + CXCL 8
|
| ApopStim + Bax
|
| BCl 2* + Bax*
|
| Bax* + Casp 9
|
| Casp 9* + Casp 3
|
| TNF + Casp 8
|
| Casp 8* + Casp 3
|
Notation: A* = the activated state of protein A; A.B = the compound of proteins A and B; k+ = forward rate constant of reaction; k- = reverse rate constant of reaction.
Table 5
The ODEs associated with the biochemical kinetics of the apoptosis signaling pathways of endothelial cell
| d [VEGF . Bevacizumab]/dt = β [VEGF] [Bevacizumab] = β [v] [B] |
| d [Akt]/dt = - k1 [Akt] |
|
|
|
|
|
|
|
|
|
|
|
|
| d [CXCL8*]/dt = k5 [BCl2* . CXCL8] |
| d [Bax]/dt = - k6 [Bax] [ApopStim] |
|
|
|
|
| d [ApopStim]/dt = - k6 [Bax] [ApopStim] |
|
|
|
|
|
|
|
|
|
|
|
|
| d [Casp3*]/dt = k11 [Casp9* . Casp3] + k14 [Casp8* . Casp3] |
| d [TNF]/dt = - k12 [TNF] [Casp8] |
| d [Casp8]/dt = - k12 [TNF] [Casp8] |
|
|
|
|
Notation: A* = the activated state of protein A; A.B = the compound of proteins A and B; k+ = forward rate constant of reaction; k- = reverse rate constant of reaction.
Table 6
Initial values of apoptosis proteins used in the simulation
| Akt | [0, 1] | Akt* | 0 | VEGF.Bevacizumab | 0 | FasL*.Casp8 | 0 |
| BCl2 | [0, 1] | BCl2* | 0 | Akt*.BCl2 | 0 | Casp3 | [0, 1] |
| CXCL8 | [0, 1] | CXCL8* | 0 | BCl2*.CXCL8 | 0 | Casp3* | 0 |
| Bad | [0, 1] | Bad* | 0 | BCl2*.Bad* | 0 | Bad*.Casp9 | 0 |
| Casp9 | [0, 1] | Casp9* | 0 | Casp9*.Casp3 | 0 | ApopStim | 0.1 |
| Casp8 | [0,1] | Casp8* | 0 | Casp8*.Casp3 | 0 | TNF | 0.1 |
All values are in non-dimensional form. The value [0, 1] means a uniformly random number between 0 and 1. Notation: A* = the activated state of protein A; A.B = the compound of proteins A and B. Here the initial values of the proteins are set to be a random number between 0 and 1 representing the variability within the cells, while the activated form of these proteins are initially set to be 0.


