
Effects on work ability, job strain and quality of life of monitoring depression using a self-assessment instrument in recurrent general practitioner consultations: A randomized controlled study
Abstract
BACKGROUND:
Depression reduces individuals’ function and work ability and is associated with both frequent and long-term sickness absence.
OBJECTIVE:
Investigate if monitoring of depression course using a self-assessment instrument in recurrent general practitioner (GP) consultations leads to improved work ability, decreased job strain, and quality of life among primary care patients.
METHODS:
Primary care patients n = 183, who worked. In addition to regular treatment (control group), intervention patients received evaluation and monitoring and used the MADRS-S depression scale during GP visit at baseline and at visits 4, 8, and 12 weeks. Work ability, quality of life and job strain were outcome measures.
RESULTS:
Depression symptoms decreased in all patients. Significantly steeper increase of WAI at 3 months in the intervention group. Social support was perceived high in a significantly higher frequency in intervention group compared to control group.
CONCLUSIONS:
Monitoring of depression course using a self-assessment instrument in recurrent GP consultations seems to lead to improved self-assessed work ability and increased high social support, but not to reduced job strain or increased quality of life compared to TAU. Future studies concerning rehabilitative efforts that seek to influence work ability probably also should include more active interventions at the workplace.
1Introduction
Depression has a substantial impact on individuals’ lives and on society. Disability caused by depression affects 10–15% of the population across cultures; of all patients with depression, 70% are treated within primary care [1–6]. Individuals with depression almost always suffer from poor work ability [7–9]. When patients recover from depression, work ability does not increase to the same extent and at the same pace as the depression lapse [8, 10, 11]. The severity of the depression also has an impact on function [10, 12]. Koivumaa-Honkanen has shown that individuals with slow recovery and long treatment of the depression have low improvement on functional ability [11]. This is supported in the International Classification of Functioning, Disability and Health (ICF) model, which emphasizes the environmental factors that influences health, such as demographic, motivational factors as well as personal and work characteristic. Therefore more than disorder related factors need to be considered when predicting return to work [13]. Reduced work ability is also associated with both frequent and long-term sickness absence [7, 9, 14]. A study by Ervasti et al. [15] showed that individuals with other health conditions such as psychiatric and somatic disorders co-occurring with the depression delayed return to work.
Depression is one of the leading causes of sick leave in Sweden today, and an increasing disability problem world-wide [2, 16]. In UK, 35% of sick notes are linked to mild/moderate depression, and according to WHO, depression is the leading cause of long time sick leave in Europe [17]. The risk of developing a depression at some point in life is for women about 25% and for men about 15% [1, 18]. To improve prognosis regarding function and return to work, early detection and treatment of co-occurring depression are crucial, but screening does not seem to produce any significant benefits. Case-finding or screening questionnaires for depression, when used alone, have little or no impact on the detection and management of depression by clinicians in the primary care context [19]. However, using a self-assessment instrument in the general practitioner (GP) consultation to provide feedback to the patient on the lapse of depression could be a part of the cognitive process that helps the patient to understand the illness [20]. This could be a step towards faster recovery from depressive symptoms, shortened sick leave and a catalyst towards a more welcoming tone amongst fellow co-workers in a rigid atmosphere. Even so there is today a lack of studies evaluating the long term effects of using these instruments in the primary care context, and this is requested by stakeholders [21].
During consultation the GP needs to question the patients about the impact of the depression on their work and monitor the impact of symptom reduction on recovery of work ability [22]. The employees’ own expectations of their sick leave duration have been shown to successfully predict the actual sick leave [20], and the work of Nils Fleten supports this notion reporting that the GP will get a more accurate prognosis for sick leave by communicating with the patient instead of just relying on medical records and documentations [23]. Measures that in this way could improve the quality of care for patients with depression and poor work ability thus could facilitate return to work and have a significant effect on the rehabilitation process. Even if there are studies that show the relation between work ability and productivity loss there is a lack and need of more studies, studying possible correlation between work ability index (WAI)-score and productivity [24].
In the PRI-SMA project [25], an intervention of the effects of a regular and recurrent use of a depression self-assessment instrument in GP consultations was evaluated for patients with depressive disorders during 3 months [25]. In this present study (using participants from PRI-SMA project who had a job) we investigate whether this intervention has any long-term effect on work ability, job strain, and quality of life (QoL) for the patient with major depression in primary care.
Specific aims were to:
– determine whether there were differences between the intervention and control groups regarding work ability [26].
– determine whether there were differences between the intervention and control groups regarding job strain [27].
– determine whether there were differences between the intervention and control groups regarding QoL.
2Method
2.1Setting and subjects
This RCT took place from March 2010 to December 2013. All primary care centers (PCC) (n = 98) in Gothenburg and South Bohuslän, Sweden, were invited to participate in the study. Twenty-two PCCs agreed to participate. By a blinded procedure (simple two block randomization), the GPs at each PCC were randomized to intervention (n = 45) or treatment as usual (TAU) (n = 44). Intervention consisted of, in addition to TAU, a structured, repeated monitoring of depression course using a self-assessment instrument in four recurrent GP consultations. Randomization on the GP level was done to avoid that patients would have to change GP during the intervention phase at the PCC. The GPs in the intervention group received a 4 hour orientation including verbal and written information concerning the self-assessment instrument and how to manage it in the recurrent consultations. Consecutive patients visiting PCCs aged 18 and older, diagnosed by the GP with mild to moderate depressive disorder according to PRIME-MD (a well-known assessment tool for the GP to aid diagnosis for major and minor depression disorder according DSM-IV criteria) [28], and with no antidepressant medication introduced/changed in the preceding 2 months were included. All patients received verbal and written information about the study and signed an informed consent. The patients were also informed of the confidential handling of the data. Patients were excluded if diagnosed as having severe depressive disorder according to the Beck Depression Inventory-II (BDI-II) [29–31], i.e. BDI-II>36, severe mental psychiatric disorder (i.e. bipolar disorder, antisocial personality disorder, psychosis, substance use disorder or other serious mental disorder), suicidal ideation or intentions (earlier or ongoing), lack of written informed consent or if the patient did not speak/understand Swedish language or had cognitive disabilities, to such an extent that it was difficult to fill in self-assessment instruments.
2.2Data collection
The 22 PCCs consecutively started inclusion of patients during a two to three-week period. During the inclusion period, a research nurse was placed at the PCC to provide help to organize the patient data collection and support the staff. The patient was monitored at the PCC at first visit (baseline) and at 3, 6, and 12 months. The study leader informed the GPs who were randomized to the intervention how to proceed in the use of the self-assessment instrument, emphasizing the fact that the instrument was the patient’s own instrument. The GPs in the TAU group managed the patients as they usually did within the conventional care framework (except for the diagnostic procedure at the initial consultation). Patients visiting the PCC fulfilling the inclusion criteria and who agreed to participate were included.
2.3Intervention
All patients in the intervention group received an appointment with their GP once every month for 3 months (4 appointments in total). In addition to the regular treatment, patients received evaluation and monitoring of symptom severity and change by using the self-assessment instrument Montgomery-Åsberg Depression Rating Scale - Self report (MADRS-S) [32] (at baseline, 4, 8, and 12 weeks follow up). MADRS-S is especially designed to follow the lapse of the patient’s depressive symptoms and is well suited for use in primary care [33]. Change in the depressive symptoms based on the actual MADRS-S assessment at the given consultation was discussed between the GP and the patient [34]. All other measures were based on the patient’s needs (pharmacological, psychological, psychosocial, etc.).
2.4Outcome measures
Work ability was measured by Work Ability Index (WAI) [26]. WAI measures physical and mental demands of the individual’s work, diagnosed diseases, effect of diseases on work ability, sick leave, work ability prognosis, and psychological resources. The assessment of psychological demands, decision latitude, and social support in the workplace was done utilizing the Swedish Demand-Control-Support Questionnaire, an instrument that is widely used and validated in several languages [35]. It is suitable to use when measuring outcomes related to public health problems [36, 37]. The job strain model [27] was used to analyze work aspects related to demand and control. QoL was measured using the EuroQol-5D (British tariff) [38, 39]. The Beck Depression inventory-II (BDI-II) was used to measure the severity of the depression [40]. All outcome measures were collected at baseline, 3, 6, and 12 months.
In addition, information concerning sick leave and medication for the 3, 6, and 12 months follow up periods was collected from the electronic patient records (EPR) and from patients’ questionnaires. Information on use of anti-depressants (yes/no), sedatives (yes/no), sick leave (yes/no), and number of days of sick leave, measured during 0–3, 4–6, and 7–12 months was collected. Return to Work (RTW) was measured as the end of sick leave.
2.5Instruments
2.5.1Work Ability Index
Work Ability Index (WAI) is a questionnaire containing 7 dimensions of work ability and a list of health conditions. WAI is designed to measure the individuals’ own perception of their current and future work ability.
The following eight subscales are included in the index: 1) estimation of current work ability compared with lifetime best (0–10 points), 2) work ability in relation to physical demands of the work (1–5 points), 3) work ability in relation to mental demands of the work (1–5 points), 4) number of diagnosed diseases (1–7 points), 5) estimation of work impairment due to diseases (1–6 points), 6) sickness absence during the past year (1–5 points), 7) own prognosis of work ability 2 years from now (1, 4, or 7 points), and 8) mental resources (1–4 points). All subscale scores were summed up to a total score (range 7–49). WAI score between 7–27 points indicated poor work ability, 28–36 points moderate work ability, 37–43 points adequate work ability, and 44–49 points excellent work ability [41]. WAI has been validated in several studies and has been shown to have acceptable test-retest reliability of the individuals, and this gives support for the applicability in occupation research and daily practice [42–44].
2.5.2Job demands, job control, and social support
The Demand– Control– Support Questionnaire contains 17 items: 5 for demands, 6 for control and 6 for support. The response alternatives for demands and control were “yes often”, “yes rather often”, “no, seldom” and “no”. Each answer alternative was given a value, and summary scores were calculated for each index and dichotomized using the median score as a cut-off point. The demand subscale ranged from 5–20 and was dichotomized into low demand (5–13 score) and high demand (14–20 score). The control subscale ranged from 6–24 and was dichotomized into low control (6–18 score) and high control (19–24 score). The support subscale regarding support intensity was based on the following response alternatives: “agree, totally,” “agree, rather well,” “do not agree particularly well,” and “do not agree at all”. The support subscale ranged from 6–24 and was dichotomized into low support (6–19 score) and high support (20–24 score).
2.5.3Job strain
The job strain model was used to analyze the combination of demand and control [27]. Using median values, each index was dichotomized into high and low control and high and low demand, respectively. The dichotomized variables were combined into the job strain index as follows: low-strain jobs (low demand, high control), high-strain jobs (high demand, low control), passive jobs (low demand, low control), and active jobs (high demands, high control).
2.6Covariates
2.6.1Beck Depression Inventory-II
Depressive symptoms were monitored by the Beck Depression inventory (BDI-II) [31]. The inventory assesses depressive symptoms during the past 2 weeks and consists of 21 questions with four response alternatives and a total score of 0–63 points. Scores between 0–12 were classified as no depression, scores between 13–19 mild, 20–28 moderate, 29–36 high moderate depression, and scores >36 as severe depression [30, 46].
Collection of data also included age, gender, children <18 years living at home, alcohol consumption per week (<2 times per week/≥2–4 times per week), smoking (yes/no), educational level, occupational class, employment, and country of birth. To predict RTW we used the single question “When will you be back at work?” with the following response alternatives: within 1–4 weeks, within 1–6 months, never, or do not know.
Statistics Sweden has elaborated a socio-economic classification system, “Socioeconomic indexation” (SEI). Occupational class was classified from SEI into five categories, according to self-reported job title and work tasks obtained from the questionnaire: high-level non-manual, medium non-manual, low non-manual, skilled manual, and unskilled manual work. In this study the five categories were merged into three categories: 1) High white collar, 2) Middle/low white collar, 3) Blue collar/students.
2.7Statistics
Standard methods were used for descriptive statistics. Frequencies were compared by using Chi-square and means by the Mann Whitney U-test, all two-sided tests. Statistical significance was set at p < 0.05. In order to compare change from baseline to 3, 6 and 12 months follow up with regards to age and gender, logistic regression analysis was used. Subgroup analysis concerning sick leave and number of work days was performed in the group of patients 18–65 years, taking age into consideration. Data analysis was performed with statistical software (IBM SPSS Statistics for windows, version 21.0, IBM Corp, Armonk, New York).
In the planning of the study and calculation of possible power with the predestined sample size of 183 individuals (n = 91 vs n = 92) and the significance level set at 0.05 and the beta error as 0.20 (power of the study; 1–0.20 = 0.80), we approximated we would be able to detect a significant improvement in the WAI instrument by around 10% in the intervention group compared to TAU.
3Results
In this study 183 patients were enrolled, 92 in the intervention group and 91 in the TAU group. For this present paper, studying outcomes concerning work ability, decreased job strain, and QoL, only participants who stated they actually worked were included. Participation rate at 3, 6, and 12 months follow up was 77% , 78% and 73% in the intervention group, and 67% , 65% , and 62% in the TAU group, respectively, for the 183 patients (Fig. 1). There were no significant differences concerning age, gender, social and lifestyle variables, job strain, depressive symptoms or QoL between the intervention and TAU groups at baseline (Table 1).
Fig.1
Flow chart of the PRI-SMA RCT from baseline to 12 months follow up. Only those participants who stated they worked are shown in the flow-chart.
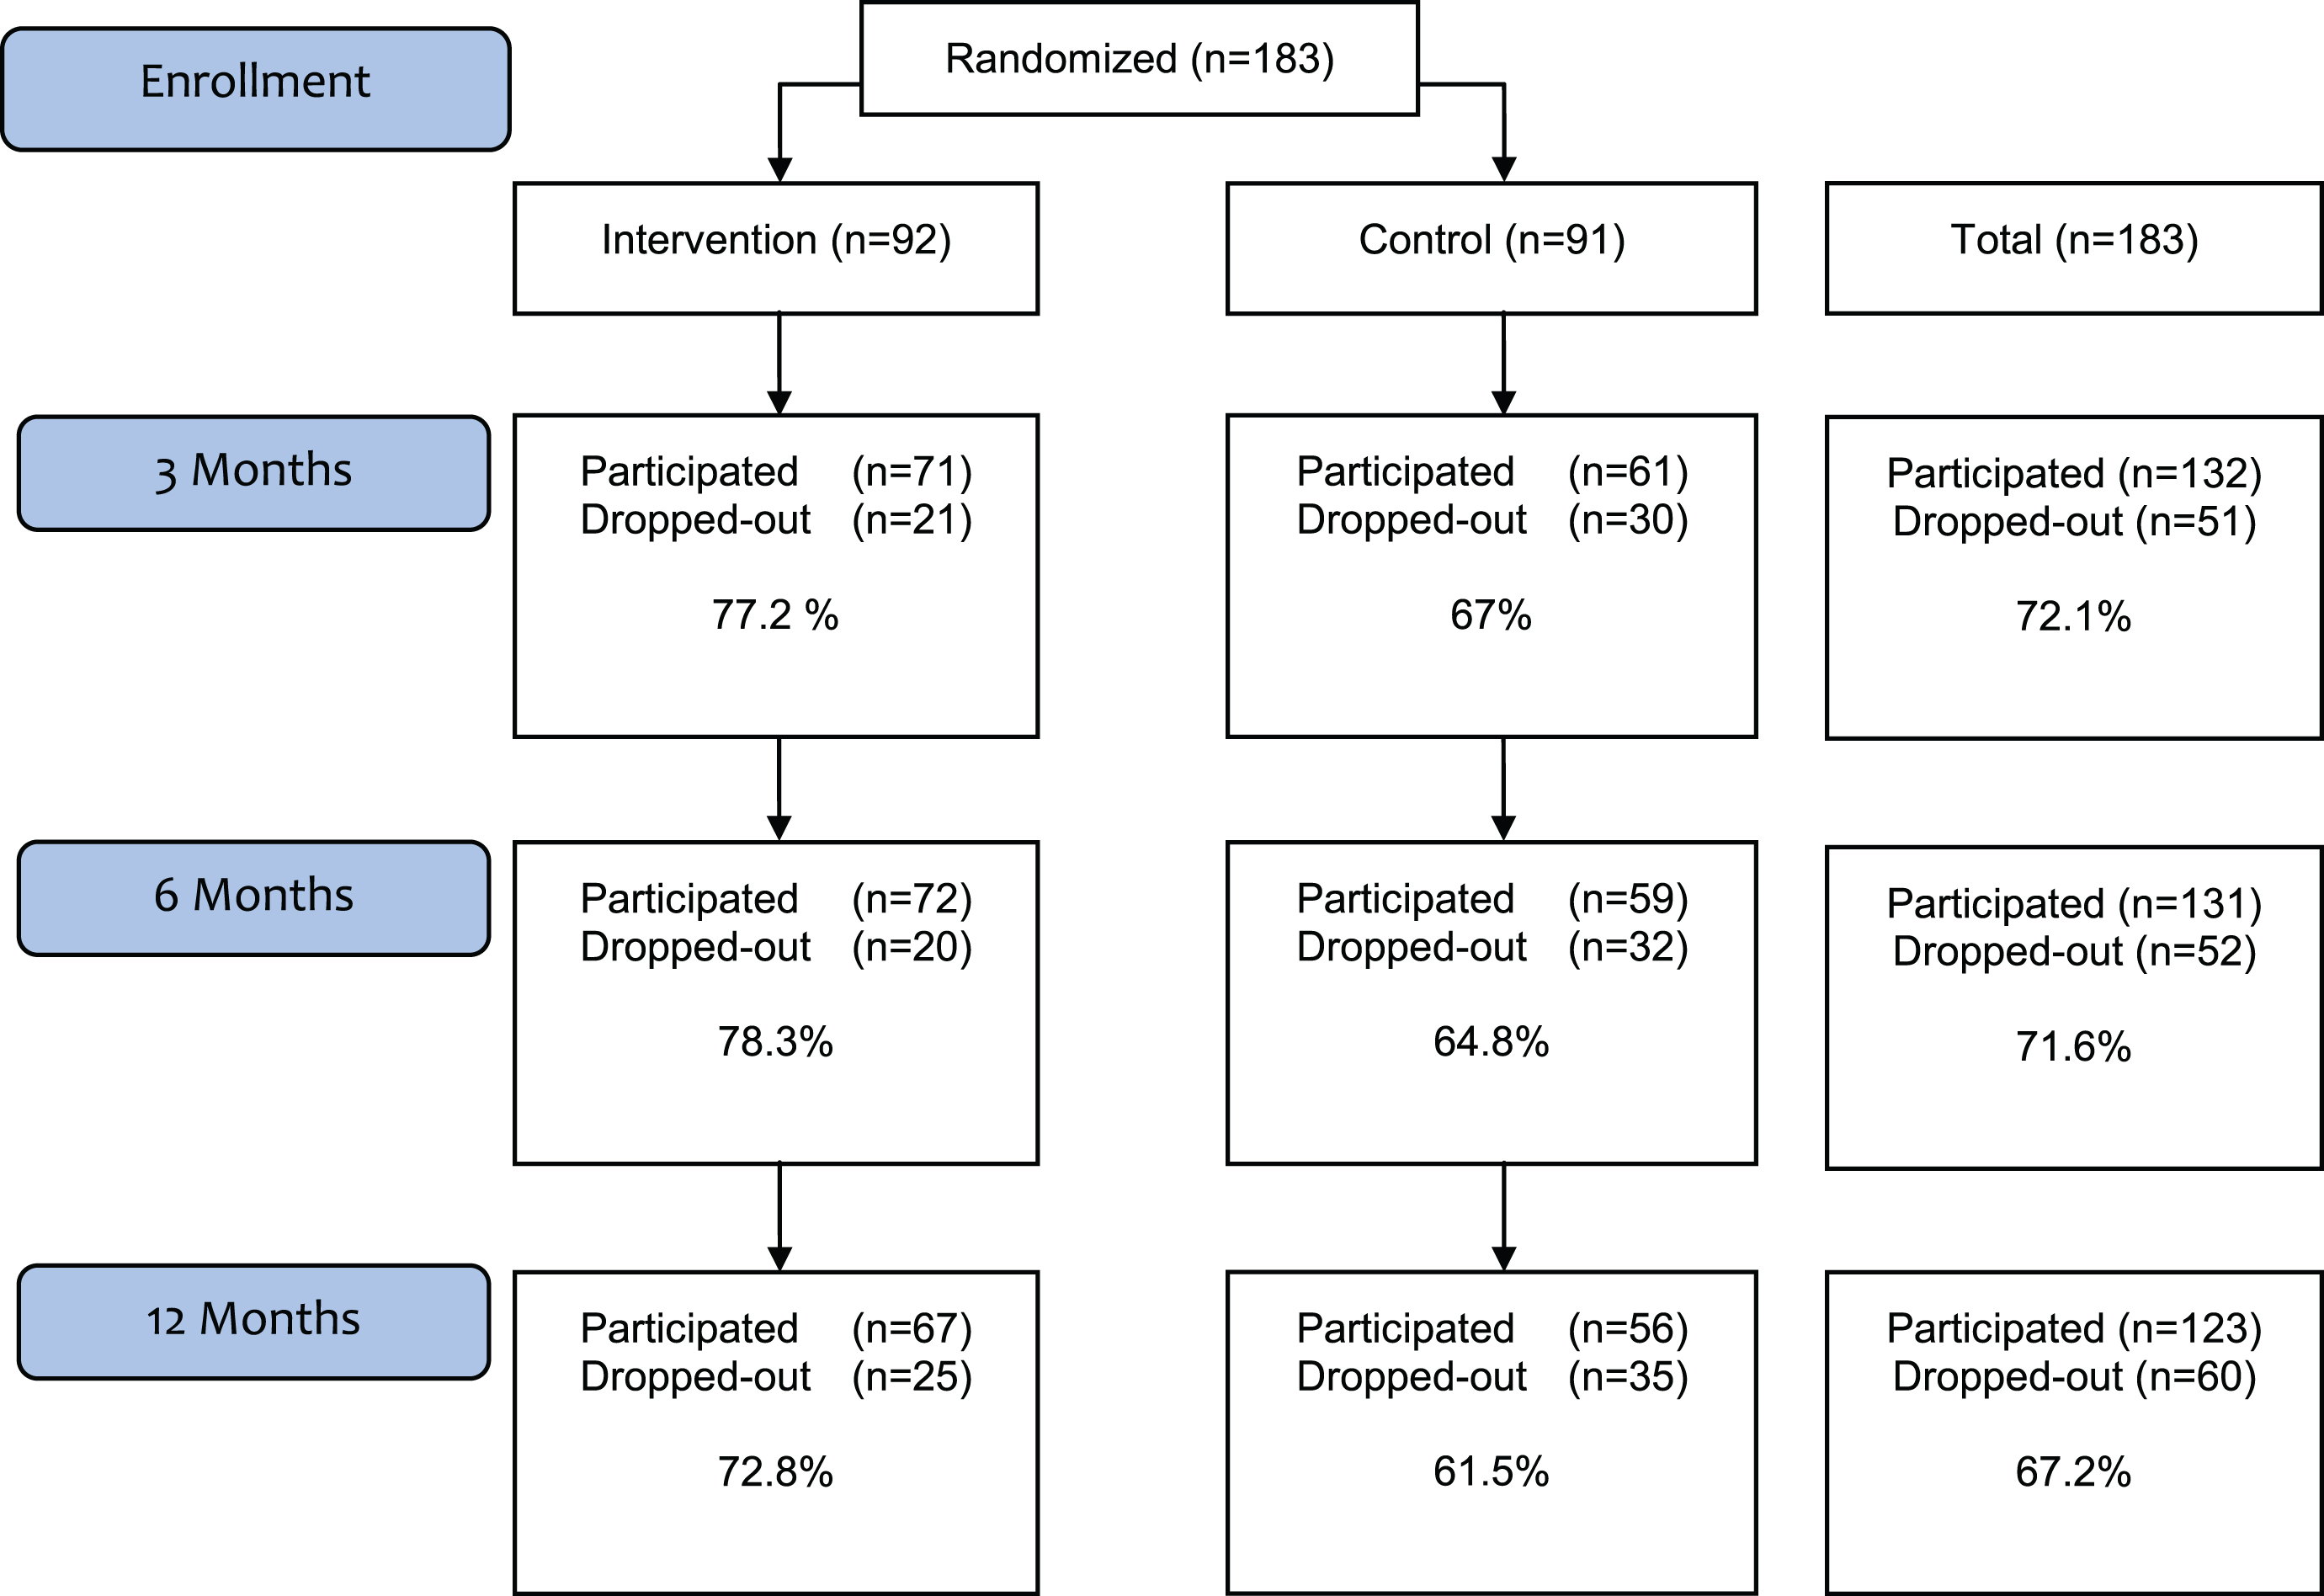
Table 1
Demographic characteristics of the intervention and TAU groups in the PRI-SMA trial for the group of participants who stated they worked: age, gender, social and lifestyle variables, and job strain
| Characteristics | Total n = 183 (%) | Intervention n = 92 (%) | Control n = 91 (%) | P-value |
| Age (years, mean SD) | 40.5 | 42 (13.5) | 39 (12.2) | 0.2 |
| Men | 51 (28) | 22 (24) | 29 (32) | 0.11 |
| Women | 132 (72) | 70 (76) | 62 (68) | 0.34 |
| Marital status (n = 183) | ||||
| Single | 76 (41.5) | 44 (47.8) | 32 (35.2) | 0.08 |
| Children at home <18 (n = 183) | 65 (35.5) | 29 (42.6) | 36 (48.6) | 0.47 |
| Alcohol (n = 183) | ||||
| 2–4 times/week | 32 (17.9) | 17 (18.7) | 15 (17) | 0.78 |
| Smoking (n = 183) | ||||
| Yes+ sometimes | 48 (26.4) | 25 (27.5) | 23 (25.3) | 0.74 |
| Educational level (n = 183) | ||||
| Up to primary education | 10 (5.5) | 5 (5.5) | 5 (5.5) | |
| Secondary education | 82 (45.1) | 47 (51.6) | 35 (38.5) | 0.19 |
| University or college | 90 (49.5) | 39 (42.9) | 51 (56.0) | |
| Occupational class (n = 158) | ||||
| High white collar | 60 (38.0) | 29 (36.7) | 31 (39.2) | |
| Middle/low white collar | 51 (32.3) | 29 (36.7) | 22 (27.8) | 0.46 |
| Blue collar/students | 47 (29.7) | 21 (26.6) | 26 (32.9) | |
| Employment (n = 181) | ||||
| Employment | 181 (100) | 90 (100) | 91 (100) | |
| Working | 150 (82.9) | 72 (80.0) | 78 (85.7) | 0. 31 |
| Studying | 31 (17.1) | 18 (20.0) | 13 (14.3) | |
| Country of birth (n = 182) | ||||
| Nordic country | 156 (85.7) | 78 (85.7) | 78 (85.7) | |
| Europe | 8 (4.4) | 3 (3.3) | 5 (5.5) | 0.70 |
| Outside the Nordic countries | 18 (9.9) | 10 (11.0) | 8 (8.8) | |
| Job strain (n = 164) | ||||
| Active jobs | 41 (25.0) | 22 (27.0) | 19 (24.0) | |
| Low-strain | 40 (24.0) | 22 (26.0) | 18 (22.0) | |
| Passive jobs | 44 (27.0) | 23 (28.0) | 21 (26.0) | 0.58 |
| High-strain | 39 (24.0) | 16 (19.0) | 23 (28.0) |
P-values indicate test of significant difference between intervention and control group. Missing values not included.
Follow up concerning depression symptoms, work ability, QoL, and perception of high social support at 3, 6 and 12 months is presented in Fig. 2 a-c. Depression symptoms decreased over time in both the intervention and control groups (Fig. 2 a), whereas work ability and QoL increased over time in both groups (Fig. 2 b). There was a significant difference in increase of WAI at 3 months between the intervention and the TAU group, with steeper increase in intervention group, although this levelled off at 6 and 12 months (Fig. 2 c). Further, there was a significantly higher frequency of perception of social support in the intervention group at 12 months follow up than in the TAU group (p = 0.009) (Fig. 3). Regarding low job demand and high job control, the analysis showed no difference between the intervention and the TAU groups. Experience of job strain was relatively stable over time and no significant differences between intervention and TAU groups in intra-individual change from “worse/no change” to “better” were seen from baseline to 3, 6, or 12 months follow up (Table 2). Around 20% of participants in both groups perceived an improvement in job strain compared to baseline.
Fig.2
(a) BDI mean values in intervention and control group at baseline, 3, 6, and 12 months. No statistically significant differences between intervention and control group. (b) EQ-5D mean values in intervention and control group at baseline, 3, 6, and 12 months. No statistically significant differences between intervention and control group. (c) WAI mean values in intervention and control group at baseline, 3, 6, and 12 months. Statistically significant difference at 3 months between intervention and control group.
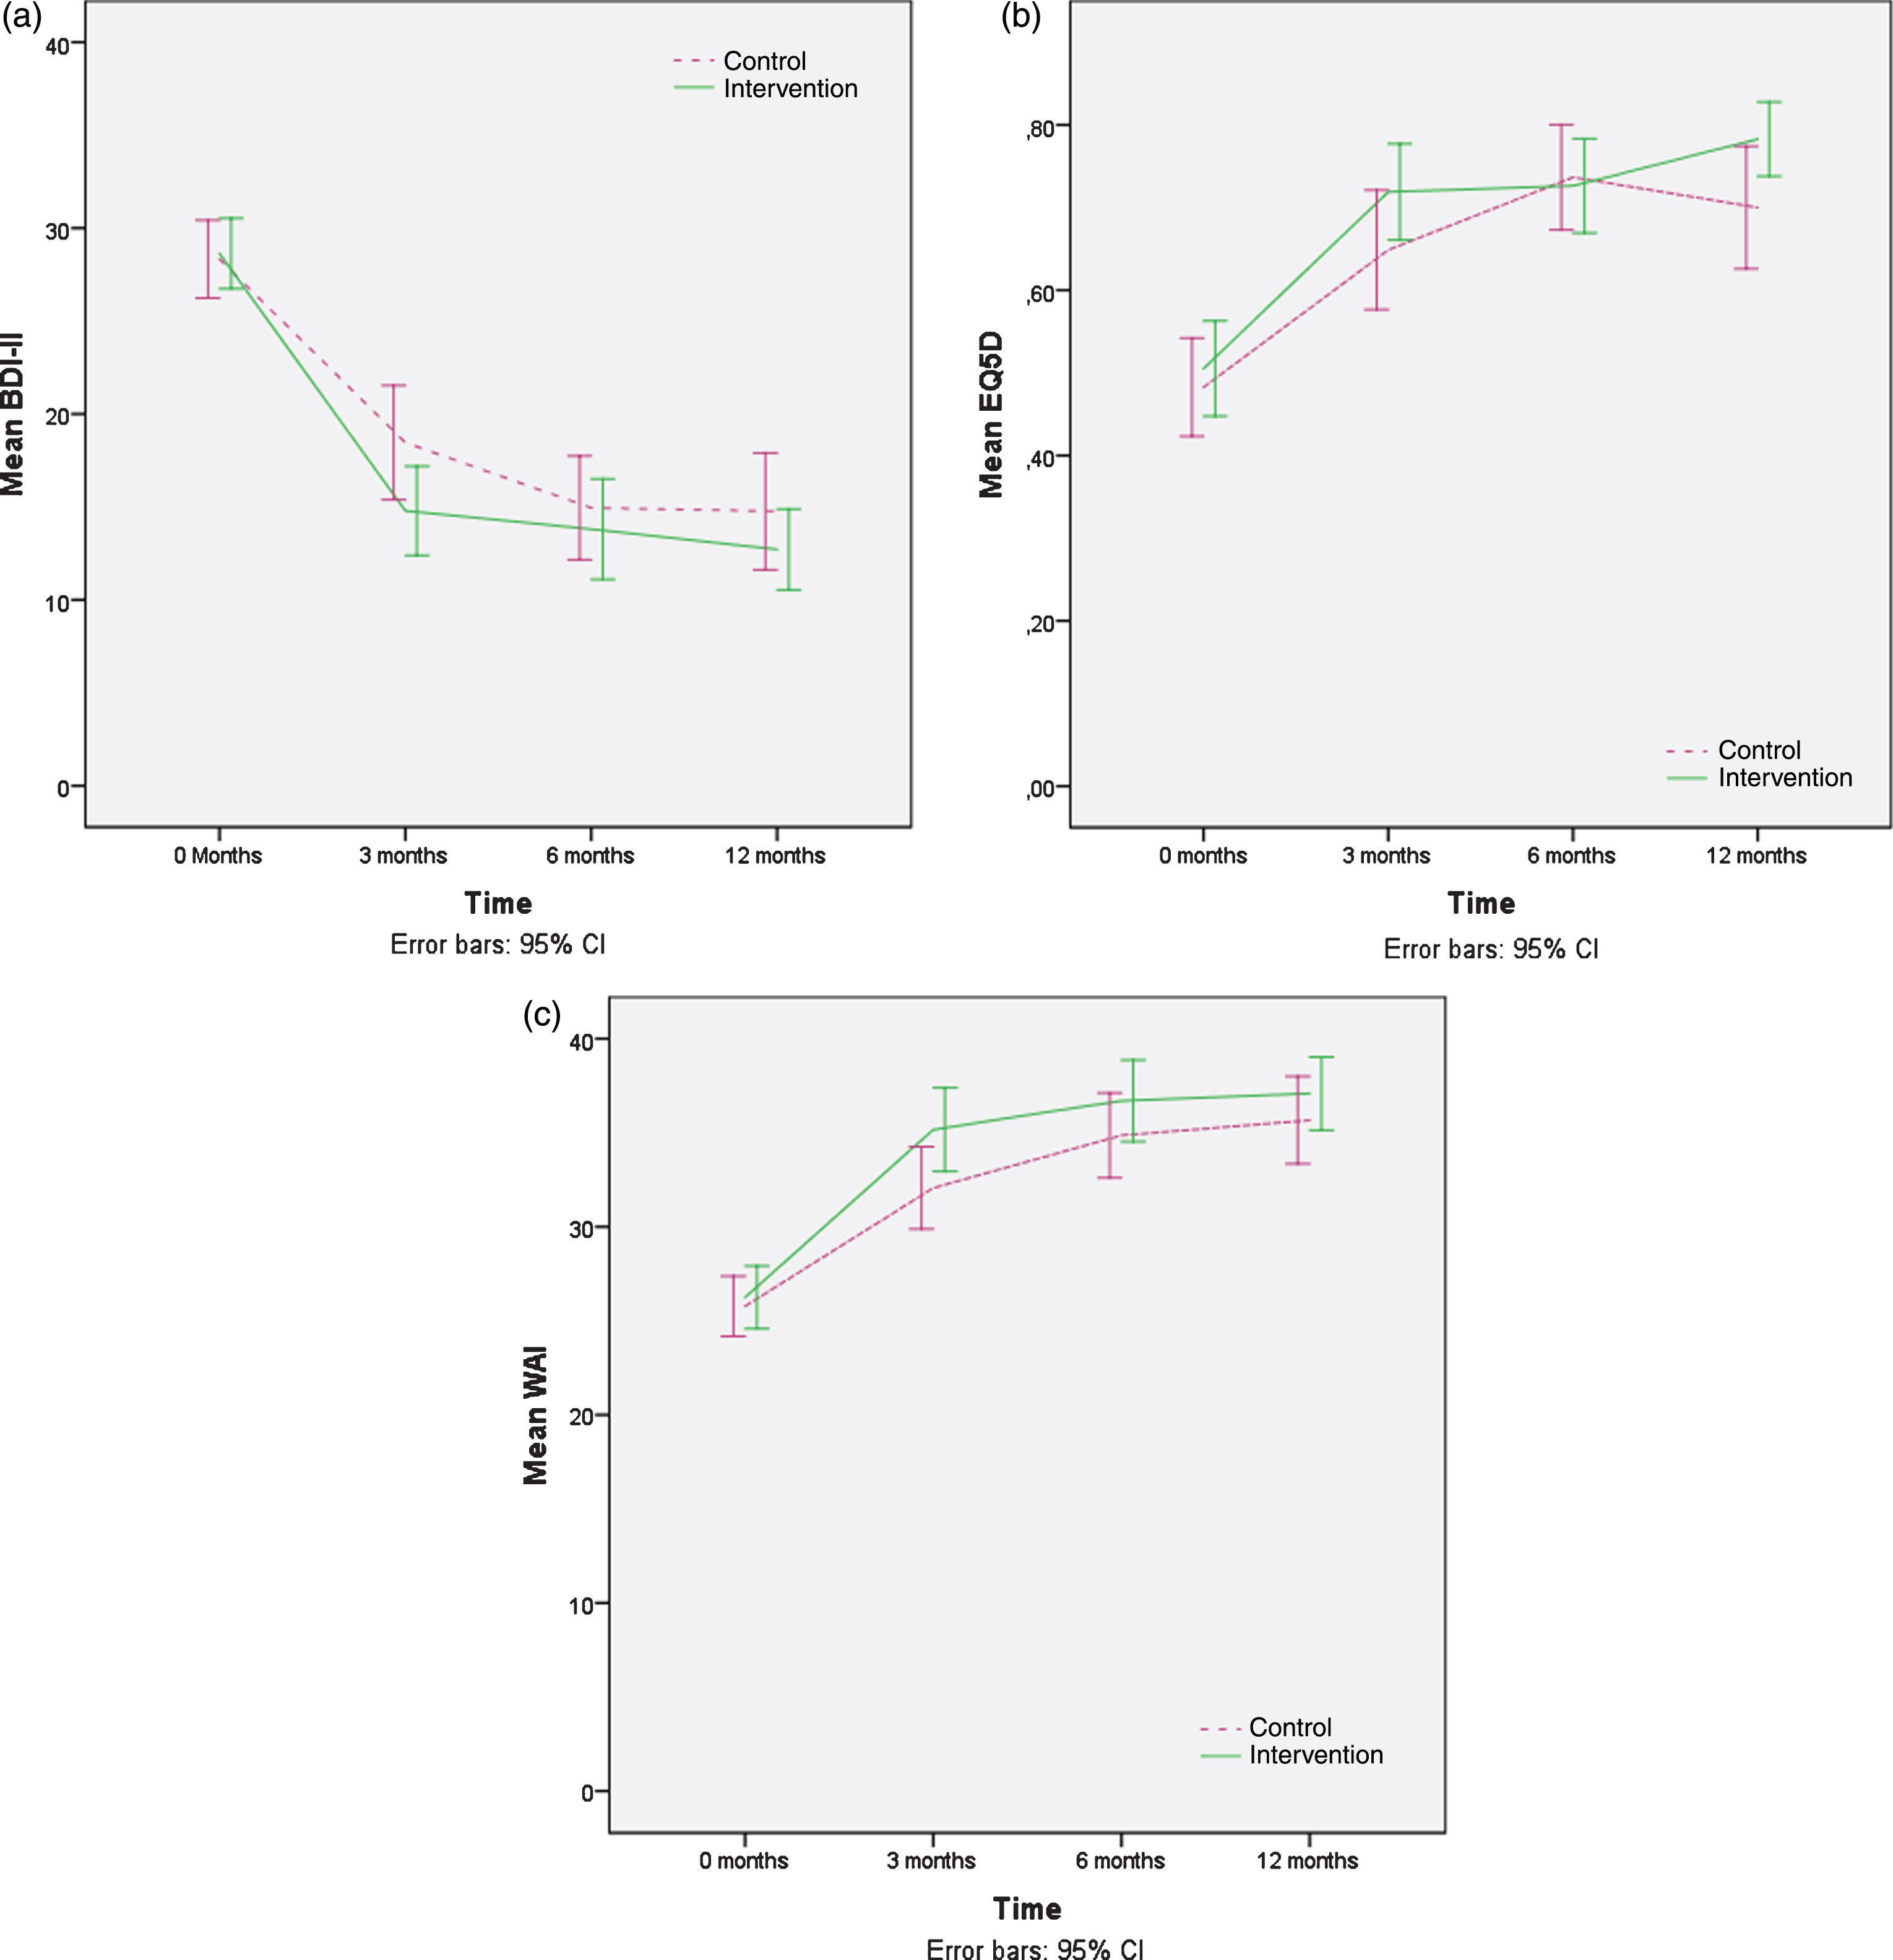
Fig.3
Percentage of individuals in intervention and control group at baseline, 3, 6, and 12 months who perceived high social support. Statistically significant difference at 12 months between intervention and control group, p = 0.009.
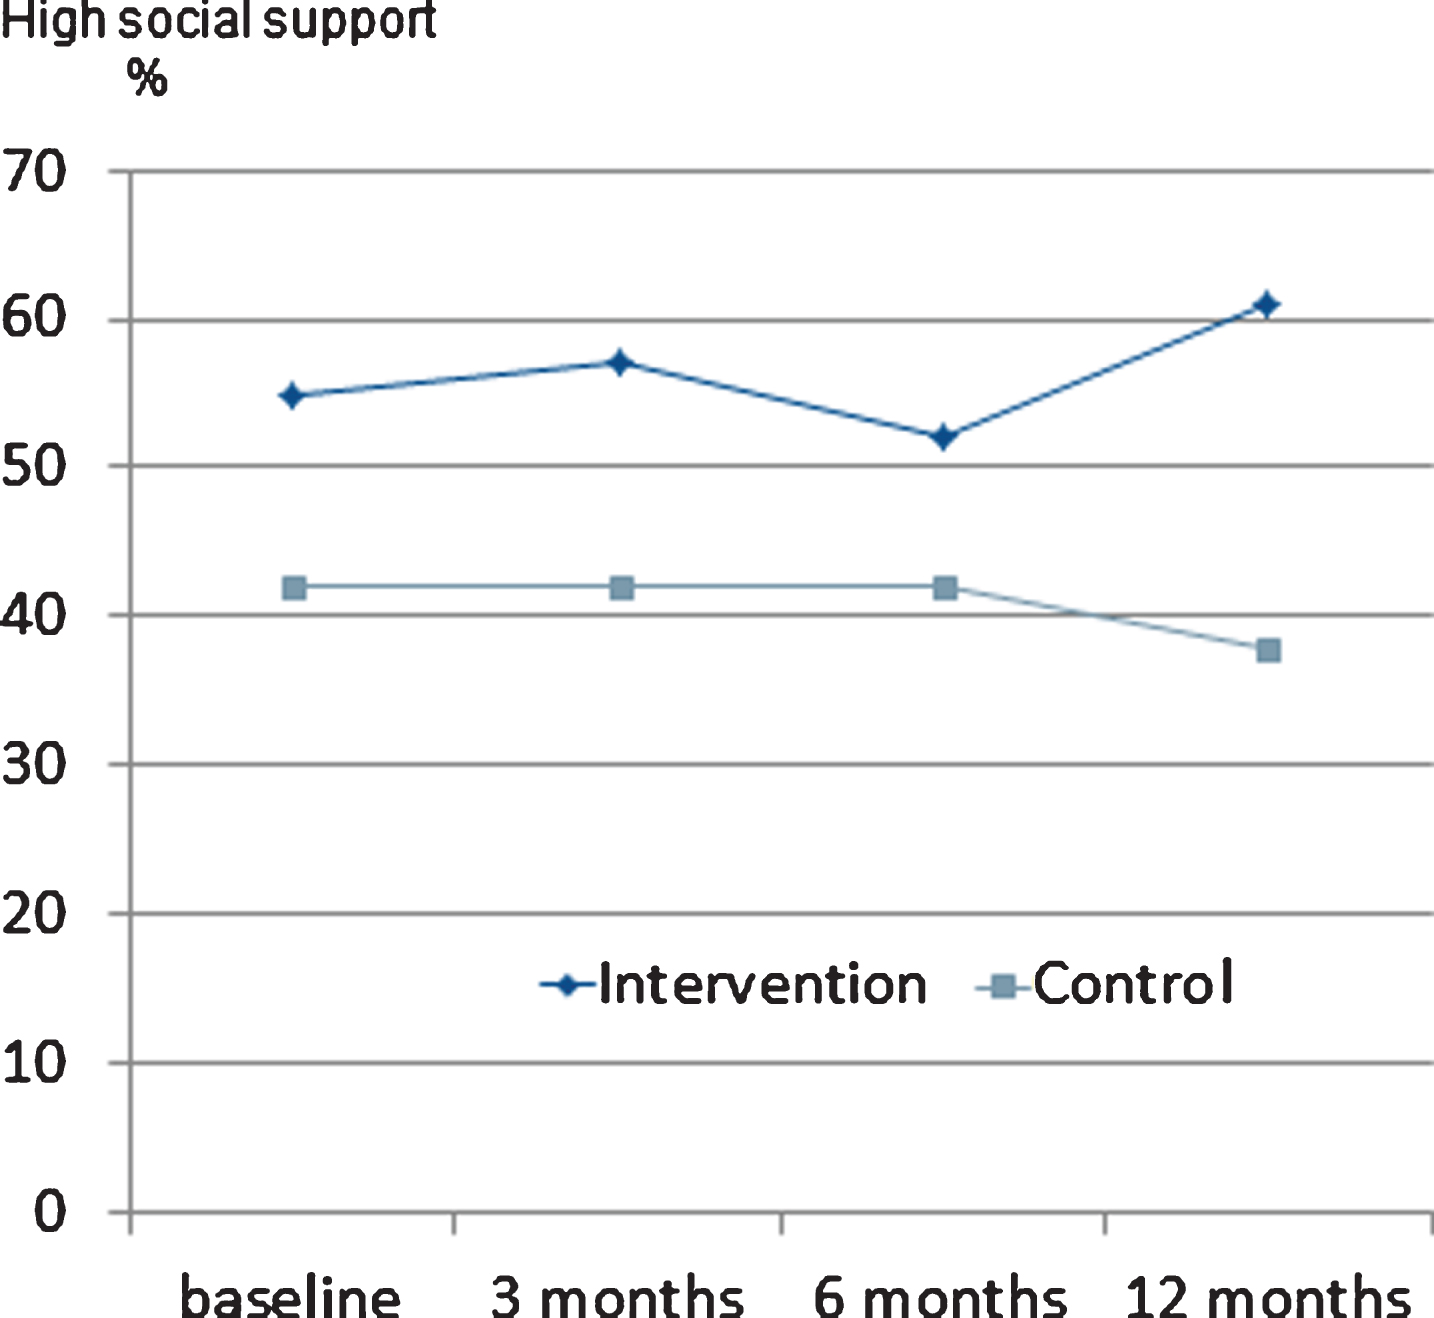
Table 2
Perceived intra-individual change regarding job strain during 0–3, 0–6, 0–12 months. Odds ratio (OR) and 95% confidence interval for difference between intervention and TAU group
| Job strain | Intervention better vs no change/worse n (%)/n (%) | Control better vs no change/worse n (%)/n (%) | OR(CI) |
| 0–3 months1 | 10 (18)/44 (82) | 8 (15)/44 (85) | 1.48 (0.46–4.79) |
| 0–6 months2 | 9 (18)/42 (82) | 10 (21)/37 (79) | 0.92 (0.30–2.80) |
| 0–12 months3 | 12 (26)/34 (74) | 9 (21)/35 (79) | 1.26 (0.39–4.11) |
1 n = 106, 2 n = 98, 3 n = 90.
The frequency of participants on antidepressants was 72% in both groups at 3 months follow up, and this medication was continued longer in the intervention group; at 6 months follow up, 69% were still on antidepressants compared to 59% in the TAU group (p = 0.01), levelling off to 59 and 58% , respectively, at 12 months follow up.
The patients’ assessment of the probable duration of the ongoing sick leave at the time of their inclusion did not differ between intervention and TAU groups (Table 3). There were no significant group differences in frequency of sick leave or mean total days of sick leave (total frequency 39% intervention group vs. 48% control group; mean 125 days vs. 123 days for the group on sick leave any time during the 12 months observation period). There were no significant differences between those with any sick leave vs. those without sick leave during the 12 months period concerning WAI, EQ5D, or high social support at 3, 6, and 12 months follow up. However, BDI-II at 12 months showed that intervention patients who had been on sick leave for any period had nearly significantly lower mean BDI-II compared to control patients who had been on sick leave (13.33 SD 9.21 vs 17.33 SD 11.27, p = 0.06.)
Table 3
Response at baseline to question “When will you be back at work” in individuals on sick leave (n = 101)
| Intervention n (%) | Control n (%) | |
| Within 1–4 weeks | 16 (35.6) | 23 (41.1) |
| Within 1–6 months | 18 (40) | 18 (32.1) |
| Never | 0 (0) | 2 (3.6) |
| Don‘t know | 11 (24.4) | 13 (23.2) |
Number and percentage in intervention and control group, respectively. No significant differences between the intervention group and control group.
4Discussion
This study shows that regular use of a self-assessment instrument in the treatment of depression in recurrent primary care GP visits during a 3-months period has positive effects concerning the patient’s work ability and high social support, both in a short and a long term perspective. On the other hand, although there was a higher frequency of regular GP visits combined with discussion of self-assessment results in the intervention group, resulting in a higher patient adherence also to antidepressant medication for the recommended minimum of 6 months, no reduction in sick leave frequency or duration was achieved.
The prerequisites of treatment differ between primary and secondary care levels in several ways. In primary care, continuity, accessibility, and close cooperation between patient and health care constitute the basis for treatment as usual. Treatment is carried out adjusted to the individual patient’s preferences and needs and is influenced not only by diagnosis and symptoms, but also by the patient’s concerns, expectations, and ideas, and social as well as educational and psychological background. Further, treatment is guided by the notions of enhanced and developed doctor-patient communication [47].
Although the intervention in this study included a consultation approach with a collaborative way of working, it did not specifically target the improvement of work ability. A person may be sufficiently medically recovered to be able to return to work but still suffer from reduced cognitive functioning. Wisenthal and Krupa showed that the treatment “cognitive work hardening” can be used as an enabler in the process from disability to RTW for people recovering from depression [48].
Recommendations for using assessment and self-assessment instruments in primary care have not been based on trials showing higher quality of care for the patient or more effective health care. To reach higher quality of care and more effective primary care, single measures such as regular use of self-assessment instruments in the care of patients with depression seem to have little or no impact on management of depression. Only more complex interventions, such as implementing a care manager at the PCC, have shown significant effects concerning depression outcomes as well as earlier return to work and higher patient satisfaction [49]. The current study shows that even facilitating patient’s recovery by regular use of the MADRS-S instrument, especially designed to measure intra-individual change in the lapse of depression and enhancing the possibility to discuss the impact of symptom lapse on patient’s work ability, is not sufficient to facilitate return to work or increase work ability, even if the intervention seems to have some significant effect on the rehabilitation process. According to current literature, interventions with workplace engagement is of importance to reach reduction of sick leave and increase RTW, although the evidence concerning mental health problems is regarded as of low quality [50].
There has been little research concerning how workers themselves perceive and experience social support [51, 52]. In this study the intervention group reported a high level of social support at work in a higher frequency than the controls at 12 months. We believe that the consultation method with its monitoring of symptom severity by the self-assessment instrument during the GP consultation increased the patients’ understanding of their illness. This in turn may have strengthened the patients to be more open about their depression at work and thus to receive more support from colleagues and managers.
However, most studies indicate [48, 53, 54] that interventions to enhance RTW for the depressed patient should involve work and work place rehabilitation to a higher degree, and further research should include support for the patient concerning this type of rehabilitation. The importance of function as a part of depression recovery and treatment should be taken seriously [55].
The strengths of the study include the fact that it was performed in primary health care, where the majority of patients with depression are managed, but where RCT evaluations of the effectiveness of several recommended care measures have seldom been performed. An additional strength is the long follow up time and the follow up not only of depression course, but also of several other factors known to be of importance for the depressed patient’s work ability and function. Depression is also known to co-occur with various types of somatic illness and can in many cases be the factor that ultimately tips the balance and causes sick leave. Further, all patients were diagnosed by a GP according to diagnostic criteria for mild to moderate depression disorder, and not recruited by waiting room screening or a self-assessment instrument without a proper diagnostic procedure.
An additional strength of this RCT is that the study concerns a patient group with a well-defined diagnosis, well known and prevalent in primary care, and whose illness is increasingly regarded as the origin of or the contributory cause of reduced work ability and absence from work [15]. Further, study personnel was onsite to aid the participants, answer questions regarding the RCT and assist during the completion of baseline questionnaires.
Among the limitations of the study is that the design of the intervention with recurrent self-assessments and feed-back during regular GP visits makes it impossible to distinguish whether the effect emanated from the recurrent self-assessment process or was partly explained by regular GP visits per se. Another limitation was that we did not include information on the participants’ workplace.
5Conclusions
Structured, repeated monitoring of depression course using a self-assessment instrument in recurrent GP consultations seems to lead to improved self-assessed work ability and high social support, but not to reduced job strain or increased QoL compared to treatment as usual among patients with depression in primary care. Therefore, future studies concerning rehabilitative efforts that seek to influence work ability probably also should include more active interventions at the workplace.
Conflict of interest
None to report.
Acknowledgments
We would like to thank all patients who participated in our study. We also thank all primary health care staff at the participating primary care centers for valuable contributions.
References
[1] | Behandling av depressionssjukdomar, volym 1: En systematisk litteraturöversikt. (Treatment of depressive disorders – a systematic review). Stockholm: Statens beredning för medicinsk utvärdering (SBU) SBU-rapport nr 166:1. 2004. |
[2] | World Health Organization. The global burden of disease: 2004 update. Geneva: WHO; (2008) . |
[3] | Bokma WA , Batelaan NM , van Balkom AJ , Penninx BW . Impact of Anxiety and/or Depressive Disorders and Chronic Somatic Diseases on disability and work impairment. J Psychosom Res. (2017) ;94: :10–6. |
[4] | Broadhead WE , Blazer DG , George LK , Tse CK . Depression, disability days, and days lost from work in a prospective epidemiologic survey. Jama. (1990) ;264: (19):2524–8. |
[5] | Bijl RV , Ravelli A . Psychiatric morbidity, service use, and need for care in the general population: Results of The Netherlands Mental Health Survey and Incidence Study. Am J Public Health Res. (2000) ;90: (4):602–7. |
[6] | Alonso J , Angermeyer MC , Bernert S , Bruffaerts R , Brugha TS , Bryson H , et al. Disability and quality of life impact of mental disorders in Europe: Results from the European Study of the Epidemiology of Mental Disorders (ESEMeD) project. Acta Psychiat Scand. (2004) )420 38–46. |
[7] | Plaisier I , Beekman AT , de Graaf R , Smit JH , van Dyck R , Penninx BW . Work functioning in persons with depressive and anxiety disorders: The role of specific psychopathological characteristics. J Affect Disord. (2010) ;125: (1-3):198–206. |
[8] | Adler DA , McLaughlin TJ , Rogers WH , Chang H , Lapitsky L , Lerner D . Job performance deficits due to depression. Am J Psychiatry. (2006) ;163: (9):1569–76. |
[9] | Waghorn G , Chant D . Work performance among Australians with depression and anxiety disorders: A population level second order analysis. J Nerv Ment Dis. (2006) ;194: (12):898–904. |
[10] | Mintz J , Mintz LI , Arruda MJ , Hwang SS . Treatments of depression and the functional capacity to work. Arch Gen Psychiatry. (1992) ;49: (10):761–8. |
[11] | Koivumaa-Honkanen H , Tuovinen TK , Honkalampi K , Antikainen R , Hintikka J , Haatainen K , Viinamäki H . Mental health and well-being in a 6-year follow-up of patients with depression: Assessments of patients and clinicians. Soc Psychiatry Psychiatr Epidemiol. (2008) ;43: (9):688–96. |
[12] | Wahlin-Norgren C , Ekberg K , Oberg B . Is an expert diagnosis enough for assessment of sick leave for employees with musculoskeletal and mental disorders? Disabil Rehabil. (2011) ;33: (13-14):1147–56. |
[13] | World Health Organization. International Classification of Functioning, Disability and Health (ICF). Geneva 2001. [online] Available at: http://www.who.int/classifications/icf/en/. |
[14] | Notenbomer A , Groothoff JW , van Rhenen W , Roelen CA . Associations of work ability with frequent and long-term sickness absence. Occup Med. (2015) ;65: (5):373–9. |
[15] | Ervasti J , Vahtera J , Pentti J , Oksanen T , Ahola K , Kivekas T , Kivimäki M , Virtanen M . Return to work after depression-related absence by employees with and without other health conditions: A cohort study. Psychosom Med. (2015) ;77: (2):126–35. |
[16] | Social Insurance Report: Sick leave development 2016. Swedish social insurance agency, analysis and prognosis. 2016; ISSN 1654-8574. [online] Available at: https://www.forsakringskassan.se/wps/wcm/connect/a891-5c47-4b8a-b47b-64dfbbd5/socialforsakringsrapport_2016_07.pdf?MOD=AJPERES [Accessed 7 Jul. 2017]. |
[17] | Euro.who.int. (2017). Depression in Europe. [online] Available at: http://www.euro.who.int/en/health-topics/noncommunicable-diseases/mental-health/news/news/2012/10/depression-in-europe [Accessed 7 Jul. 2017]. |
[18] | Rorsman B , Grasbeck A , Hagnell O , Lanke J , Ohman R , Ojesjo L , Otterbeck L . A prospective study of first-incidence depression. The Lundby study, 1957-72. Br J Psychiatry. (1990) ;156: :336–42. |
[19] | Gilbody S , House A , Sheldon T . Screening and case finding instruments for depression. Cochrane Database of Systematic Reviews: Wiley-Blackwell; (2005) . |
[20] | Brouwers EP , Terluin B , Tiemens BG , Verhaak PF . Predicting return to work in employees sick-listed due to minor mental disorders. J Occup Rehabil. (2009) ;19: (4):323–32. |
[21] | Swedish Council for Health Technology Assessment. Diagnosis and follow up of affective disorders- a systematic review. Report 212/2012. ISBN 978-91-85413-52-2 ISSN 1400–1403 [in Swedish]. |
[22] | Adler DA , Oslin DW , Valenstein M , Avery J , Dixon LB , Nossel I , Berlant J , Goldman B , Hackman AL , Koh S , Siris SG . Our job andtheir jobs: Mental health clinicians and patients’ workfunctioning. J Nerv Ment Dis. (2012) ;200: (5):451–3. |
[23] | Fleten N , Johnsen R , Forde OH . Length of sick leave - why not ask the sick-listed? Sick-listed individuals predict their length of sick leave more accurately than professionals. BMC Public Health. (2004) ;4: :46. |
[24] | Gardner BT , Dale AM , Buckner-Petty S , Van Dillen L , Amick BC , Evanoff B . Comparison of employer productivity metrics to lost productivity estimated by commonly used questionnaires. J Occup Environ Med. (2016) ;58: (2):170–7. |
[25] | Wikberg C , Westman J , Petersson E , Larsson MEH , André M , Eggertsen R , et al. Use of a self-rating scale to monitor depression severity in recurrent GP consultations in primary care – does it really make a difference? A randomised controlled study. BMC Fam Pract. (2017) ;18: :6. |
[26] | Ilmarinen J . The Work Ability Index (WAI). Occup Med. (2007) ;57: (2):160. |
[27] | Karasek R , Theorell Tr . Healthy work: Stress, productivity, and the reconstruction of working life. New York: Basic Books; (1990) . |
[28] | Spitzer RL , Kroenke K , Williams JB . Validation and utility of aself-report version of PRIME-MD: The PHQ primary care study. Primary Care Evaluation of Mental Disorders. Patient HealthQuestionnaire. JAMA. (1999) ;282: (18):1737–44. |
[29] | Beck AT , Steer RA , Ball R , Ciervo CA , Kabat M . Use of the Beck anxiety and depression inventories for primary care with medical outpatients. Assessment. (1997) ;4: (3):211–9. |
[30] | Beck AT , Steer RA , Carbin MG . Psychometric properties of the Beck depression inventory: Twenty-five years of evaluation. Clin Psychol Rev. (1988) ;8: (1):77–100. |
[31] | Beck AT , Ward CH , Mendelson M , Mock J , Erbaugh J . An inventory for measuring depression. Arch Gen Psychiatry. (1961) ;4: :561–71. |
[32] | Montgomery SA , Asberg M . A new depression scale designed to be sensitive to change. Br J Psychiatry. (1979) ;134: :382–9. |
[33] | Wikberg C , Nejati S , Larsson ME , Petersson EL , Westman J , Ariai N , Kivi M , Eriksson M , Eggertsen R , Hange D , Baigi A , Bjorkelund C . Comparison between the Montgomery-Asberg depression rating scale-self and the Beck depression inventory II in primary care. Prim Care Companion CNS Disord. (2015) ;17: (3). |
[34] | Maguire P , Pitceathly C . Key communication skills and how to acquire them. BMJ. (2002) ;325: (7366)697–700. |
[35] | Sanne B , Torp S , Mykletun A , Dahl AA . The Swedish Demand-Control-Support Questionnaire (DCSQ): Factor structure, item analyses, and internal consistency in a large population. Scand J Public Health. (2005) ;33: (3):166–74. |
[36] | Theorell T , Karasek RA . Current issues relating to psychosocialjob strain and cardiovascular disease research. J Occup HealthPsychol. (1996) ;1: (1):9–26. |
[37] | Van der Doef M , Maes S . The Job Demand-Control (Support) Model and psychological well-being: A review of 20 years of empirical research. Work Stress. (1999) ;13: :87–114. |
[38] | EuroQol–a new facility for the measurement of health-related quality of life. Health Policy. (1990) ;16: (3):199–208. |
[39] | Dolan P . Modeling valuations for EuroQol health states. Med Care. (1997) ;35: (11):1095–108. |
[40] | Beck AT , Steer RA , Brown GK . Manual for the Beck depression inventory-II. San Antonio, TX: Psychological Corporation; (1996) . |
[41] | Tuomi K , Oja G . Work ability index. 1998. [online] Available at: http://server1.docfoc.com/uploads/Z2015/12/31/fpMm9AsAlG/bbee3d51d86ef738ad8ea2e4.pdf [Accessed 7 Jul.2017]. |
[42] | de Zwart BCH , Frings-Dresen MHW , van Duivenbooden JC . Test– retest reliability of the Work Ability Index questionnaire. Occ Med. (2002) ;52: (4):177–81. |
[43] | Torgén M . Experiences of WAI in a random sample of the Swedish working population. Int Congr Ser. (2005) ;1280: 328–32. |
[44] | Radkiewich P , Widerszal-Bazyl M . Psychometric Properties of Work Ability Index in the Light of Comparative Survey Study. Int Congr Ser 1280. The Netherlands: Elsevier; (2005) ; 304–9. |
[45] | Dolan P , Gudex C , Kind P , Williams A . The time trade-off method: Results from a general population study. Health Econ. (1996) ;5: (2):141–54. |
[46] | Arnau RC , Meagher MW , Norris MP , Bramson R . Psychometric evaluation of the Beck Depression Inventory-II with primary care medical patients. Health Psychol. (2001) ;20: (2):112–9. |
[47] | Pendleton D , Schofield T , Tate P , Havelock P . The new consultation: Developing doctor-patient communication. Oxford University Press; (2003) . |
[48] | Wisenthal A , Krupa T . Cognitive work hardening: A return-to-work intervention for people with depression. Work. (2013) ;45: (4):423–30. |
[49] | Nieuwenhuijsen K , Faber B , Verbeek JH , Neumeyer-Gromen A , Hees HL , Verhoeven AC , van der Feltz-Cornelis CM , Bultman U . Interventions to improve return to work in depressed people. Cochrane Database Syst Rev. (2014) (12):Cd006237. |
[50] | van Vilsteren M , van Oostrom SH , de Vet HC , Franche RL , Boot CR , Anema JR . Workplace interventions to prevent work disability in workers on sick leave. Cochrane Database Syst Rev. (2015) (10): Cd006955. |
[51] | McGuire GM . Intimate work: A typology of the social support that workers provide to their network members. Work Occu. (2007) ;34: (2):125–47. |
[52] | Sundin L , Bildt C , Lisspers J , Hochwalder J , Setterlind S . Organisational factors, individual characteristics and social support: What determines the level of social support? Work. (2006) ;27: (1):45–55. |
[53] | Hauck K , Chard G . How do employees and managers perceive depression: A worksite case study. Work. (2009) ;33: (1):13–22. |
[54] | Dekkers-Sanchez PM , Wind H , Sluiter JK , Frings-Dresen MH . What factors are most relevant to the assessment of work ability of employees on long-term sick leave? The physicians’ perspective. Int Arch Occup Environ Health. (2013) ;86: (5):509–18. |
[55] | Kemenov K , Cabello M , Coenen M , Ayuso-Mateos JL . How much do we know about the functional effectiveness of interventions for depression? A systematic review. J Affect Disord. (2015) ;188: :89–96. |


