
The high and low comfort peaks in passengers’ flight
Abstract
BACKGROUND:
Knowing the high and low peaks in comfort during a flight could be useful in prioritizing aircraft interior improvements.
OBJECTIVE:
The first objective of this study was to identify whether there are differences in comfort experiences during different phases of a flight. The second objective of this study was to identify similarities between recalled and real time reported comfort experiences.
METHODS:
149 participants were asked to rate the comfort in the different phases of their last flight on a scale from 1–10. Additionally, a combination of a self-reporting design probe and generative interview was used to investigate the appraisal patterns of emotions in nine passengers.
RESULTS:
The 149 subjects reported the highest comfort after take-off and arriving at the destination, the lowest while stowing the luggage and during the cruise flight. The qualitative long haul inflight study showed after take-off and while arriving at the destination the most positive emotions and during the cruise flight there is a negative experience phase.
CONCLUSIONS:
Suggestions are given to improve the cruise flight phase, by for example stimulation of movement or better service.
1Introduction
The growth of world air travel has averaged approximately 5% per year over the past 30 years and air traffic will double in the next 15 years [1]. It is important for airlines to obtain a share in this growing market. Designing a comfortable interior is one way to acquire a market share, since this can attract passengers. Dependent on the length of flight, 20–40% of air passengers name the cabin environment as the most important factor in their choice of an airline [2]. Vink, Bazley, Kamp and Blok demonstrated a correlation (r = 0.73) between comfort of the aircraft interior and “fly again with the same airline” in a study among 10,032 passengers [3].
Having said that comfort is an important factor, prioritizing design efforts in order to create better comfort is difficult. Knee space has the highest correlation with comfort [4], which corresponds with the finding of Kremser, Guenzkofer, Sedlmeier, Sabbah and Bengler [5] that seat pitch is an important design factor. Increasing leg room seems to offer the obvious solution to improve comfort, however Lewis, Patel, Cobb, D’Cruz, Bues, Stefano et al. showed that by using a VR entertainment system, passengers can be distracted from discomfort caused by a lack of knee space [6]. In addition, Hiemstra-van Mastrigt showed that interaction with other people could also distract from discomfort [7].
The seat is also often mentioned in relation to comfort [8]. Next to legroom and seat there might be other improvements conceivable. McMullin studied the experienced comfort of the same seats with two different ceilings in the Boeing 737. It appeared that 78% of the passengers feel there is greater comfort in the same seat in the new Dreamliner sky interior [9], which indicates that humans are often not aware of the environmental characteristics that exactly cause positive experiences.
Ahmadpour, Lindgaard, Robert and Pownall showed that the seat plays an important role in the overall comfort experience [8], but a later study showed that passengers’ first part of the flight determined their overall comfort [10]. An older study found that comfort perception during the flight correlates with comfort experience preceding the flight (r = 0.407) [11]. This indicates that also during the flight comfort experiences at different moments in time might be important. The fact that comfort experiences varies over time have been described before. Discomfort increases during the workday [12] and discomfort experiences increases significantly within the first two hours of sitting in a business class seat [13]. Theoretically, this pattern in discomfort or comfort in time could help prioritizing the aspects that need attention. When after the flight certain phases of the journey are remembered for its low comfort or high discomfort, these should be a starting point as input for design, since negative experiences could be a decisive factor in booking your next flight and therefore taken as input for design.
The question is whether the comfort and emotions noticed during the flight correspond with the recalled comfort experience after the flight. In this study the following research questions are researched:
• Do passengers remember differences in comfort experience during different phases of their last flight?
• What do passengers report during different phases of their flight as the emotional experience in real time recording?
• Is there a similarity between both patterns?
2Method
To answer the first research question 149 participants (students, 21–33 years old) in 2014 and 2015 were asked to rate the comfort on a scale from 1–10 in the different phases of their last flight. The following 10 phases were distinguished: before the flight at the airport, stowing hand luggage, taxiing, taking off, just after taking-off, in cruise, preparing for landing, landing, taxiing and at the airport of arrival. The comfort rating of the cruise phase of the flight was indicated by activities respondents performed during their flight. Nine activities were pre-defined: watching a movie, food being served, garbage collected, reading, sleeping, gaming, listening to music, walking through the plane and being bored. Information was also gathered on the length of the flight. To see if there are difference in comfort in the different phases of the flight a t-test for paired comparison (p < 0.05) was done between the phases following each other chronologically. Also, a difference was made between the short (<6 hours) and long haul flights (>6 hours) following Hiemstra-van Mastrigt [7], and a t-test (p < 0.05) was done to see whether differences in comfort scores could be found between the two lengths of the flights. To find out whether differences in activities score differently on comfort, they were analysed pairwise with a t-test.
To answer the second research question, a more in-depth qualitative approach was used. A combination of a self-reporting design probe and a generative interview was used to investigate the appraisal patterns of emotions in the passengers’ in-flight journey. First, a design probe, in the form of either a physical booklet or a digital file (according to their convenience), was filled out by 9 frequent flyers during their long haul (6–12 hours) flight. Passengers’ self-reported experiences, documented in the probe gave insights on the activities and feelings of the passengers during different stages and events in the flight. The feelings and emotions for each stage was indicated by the passenger picking a corresponding facial expression [14] and writing down the reasons why they are feeling in such way. After the flight, a generative interview was done to map out the emotional timeline for each passenger. The passenger also elaborated on the reasons of the peaks in comfort perception. Lastly, the individual emotion-based timelines were compared and collective patterns among the 9 experience reports were identified. Passengers’ concern for the high and low comfort peaks were also mapped out. The third question is answered by comparing both trend lines.
3Results
From the 149 participants, 68% were from the Netherlands, 17% from Asia (China, Taiwan and South Korea), 9% was from other EU countries and 6% from the rest of the world. The average flying time of the participants was 5.9 hours, 90 participants had a flight shorter than 6 hours (average flying time 2.52 hours; SD = 1.11) and 59 participants flew 6 hours or more (average 11.2 hours, SD = 2.52).
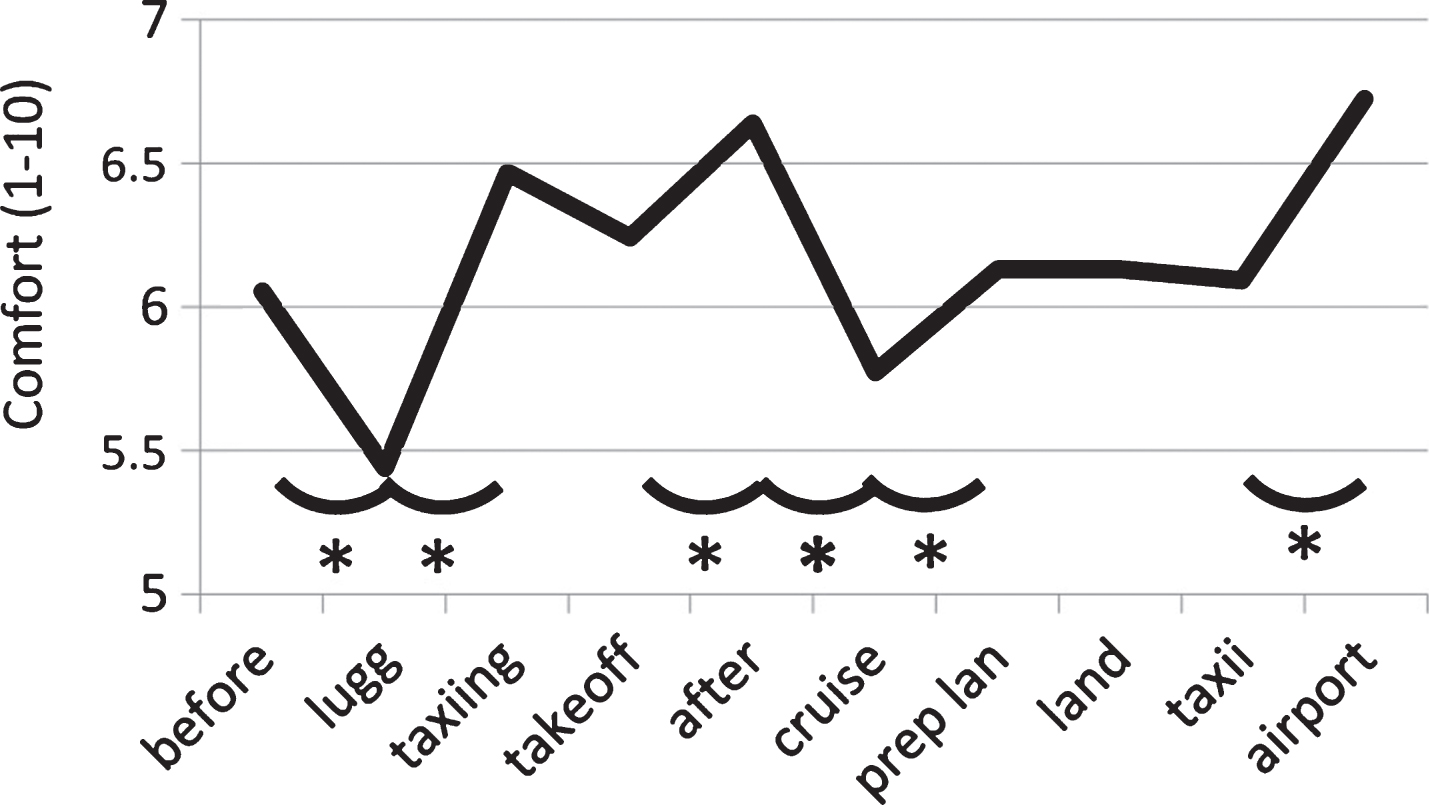
In Fig. 1 the comfort scores at the different times in the flight are shown. The lowest scores are found during hand luggage stowage and during cruise. The highest scores are found just after take-off and arriving at the destination airport. These two lowest and two highest scores are significantly different from the adjacent phase.
Fig.1
Average comfort scores at the different phases during a flight. *means significantly different from the adjacent phase (t-test for paired comparison, p < 0.05).
Comparing the different activities, it is clear that the activity gaming is done by a small group of flyers, while sleeping is done by the majority (see Fig. 2), and the comfort experienced during these activities vary (see Fig. 3). Figure 3 shows that sleeping and being bored have the lowest comfort scores. These scores are significantly lower from the other activities (t-test for paired comparison, p < 0.05). The highest scores (significantly higher than the other scores) are found when the garbage is collected, while watching In Flight Entertainment (IFE), when listening to music and while the food is being served.
Fig.2
Percentage of the participants that watch IFE, have food served, read, sleep, game, listen to music, walk through the plane during cruise flight and are bored during a flight.
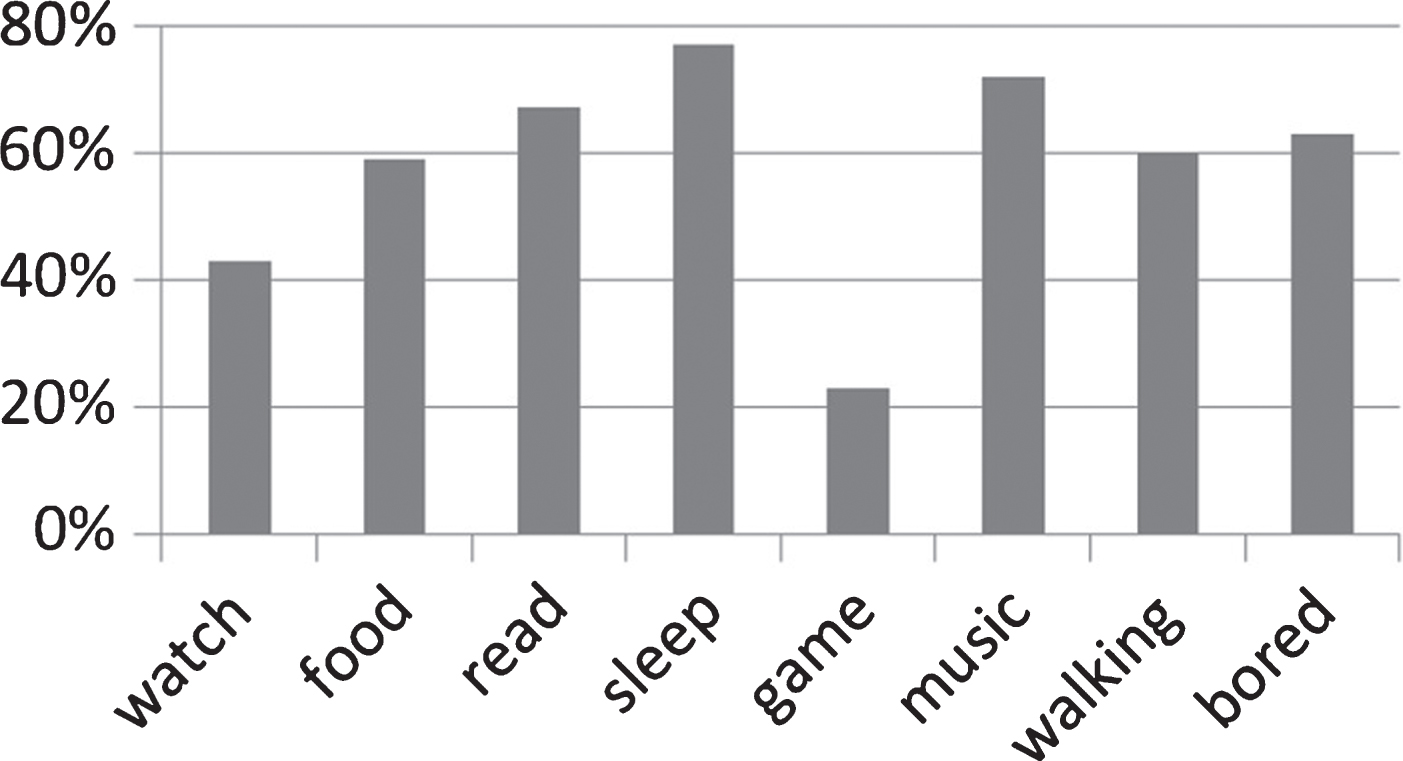
Fig.3
Average comfort scores at the different activities during a flight. *means significantly different from the adjacent phase (t-test for paired comparison, p < 0.05).
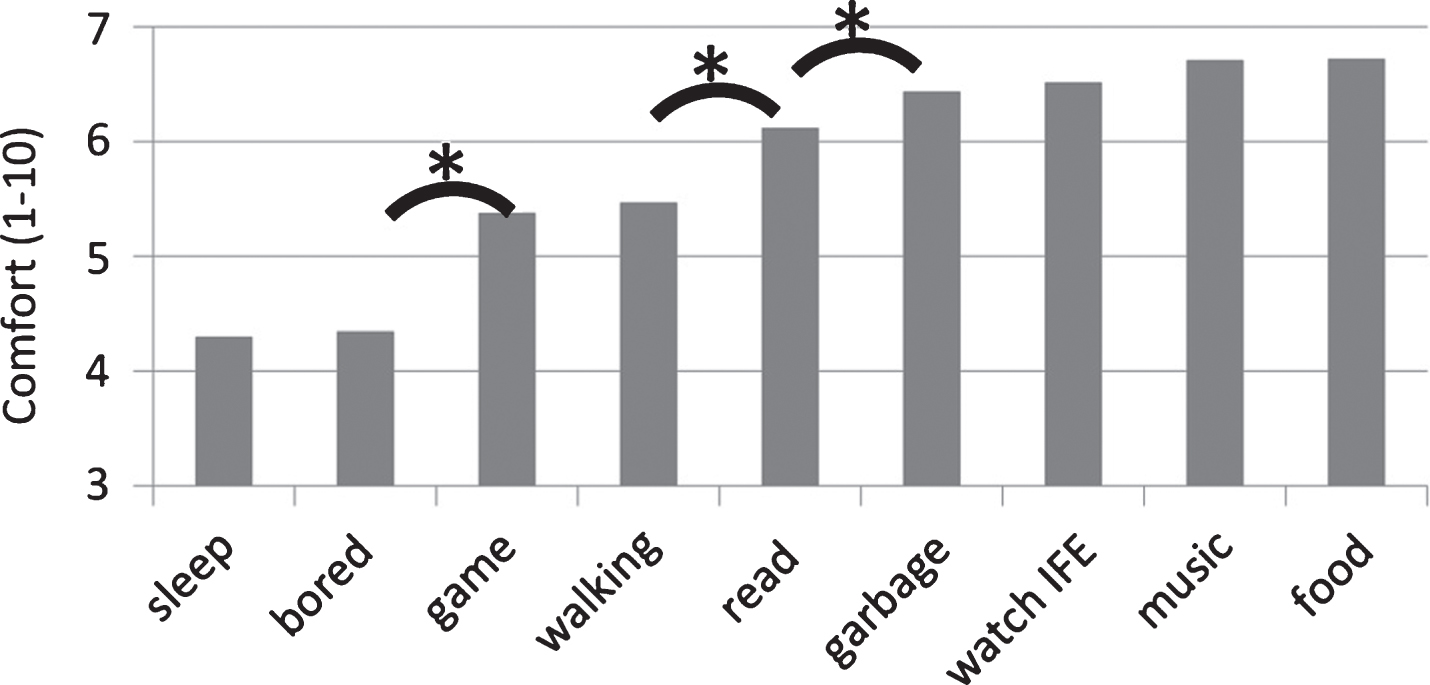
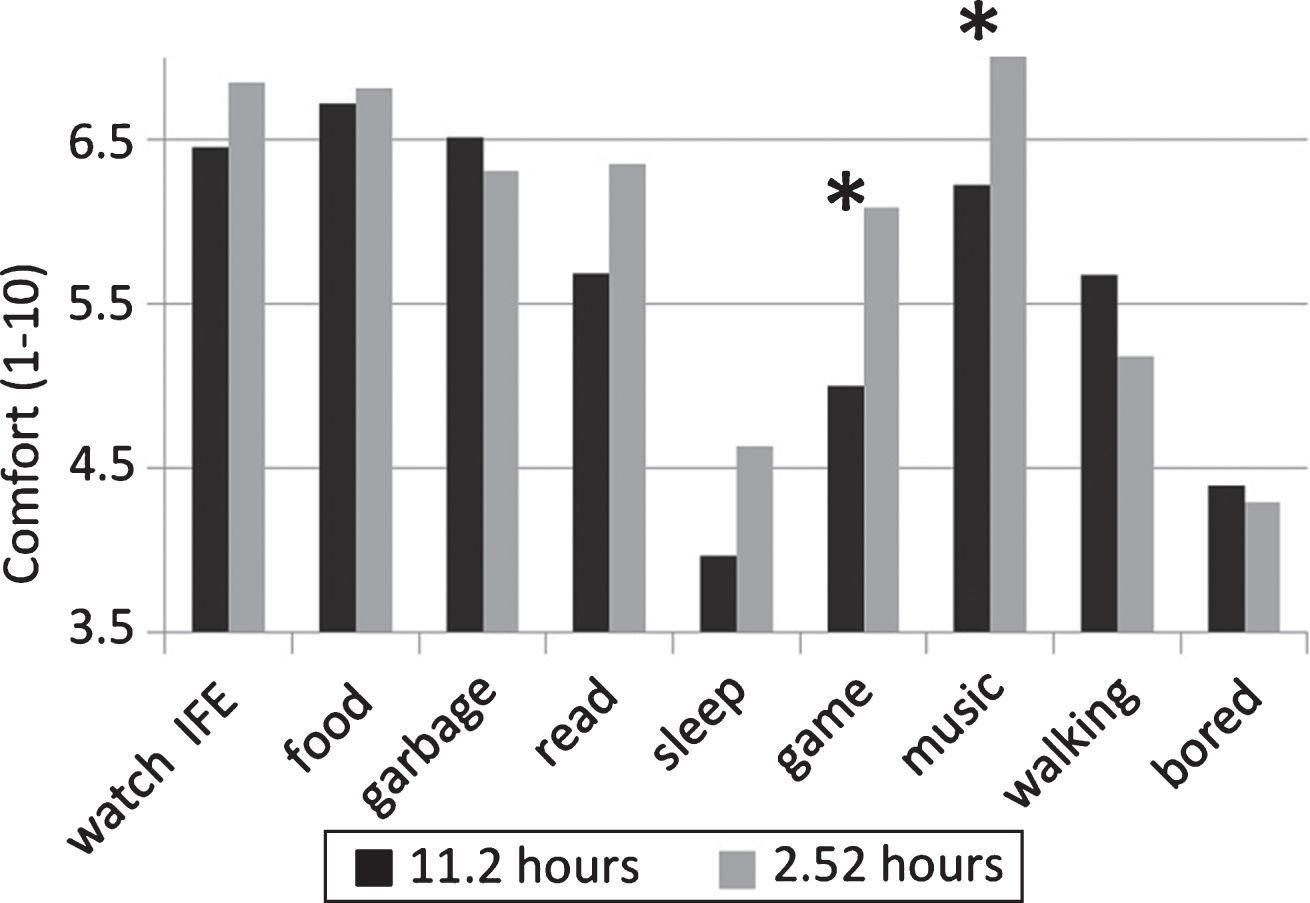
Figure 4 shows that the comfort scores at a short flight are similar to the long haul flight. The only two significant differences are found while gaming and listening to music. The comfort scores are higher during a short flight.
Fig.4
Average comfort scores at different activities during a short and long haul flight. *means significantly different (t-test, p < 0.05).
In Fig. 5 an overview of the qualitative real time reported emotions is presented. This graph shows that there are differences between the 9 participants, although all of them have relatively positive emotions right after boarding, while settling themselves before the take-off. In the following in-flight phases, two general patterns can be observed. First, a general pattern of combination of extreme high and low emotion peaks can be found during food and drink services (the stages with black background which includes drink/snack service or the two full meal services). Secondly, the stages in between food and drink service were reported negative. This includes the stage before the 1st full meal service and during the cruise flight. During the cruise flight all participants rate their emotion level scale negatively. The participants unanimously consider the stage before landing and the landing itself as positive.
Fig.5
A map of the emotional timeline of nine passengers recorded during the flight. The solid line shows the overall emotion level participants have during different stages of the flight and the dashed line shows the outliers. The numbers in the bubbles represent the amount of participants that reported their emotions similarly.
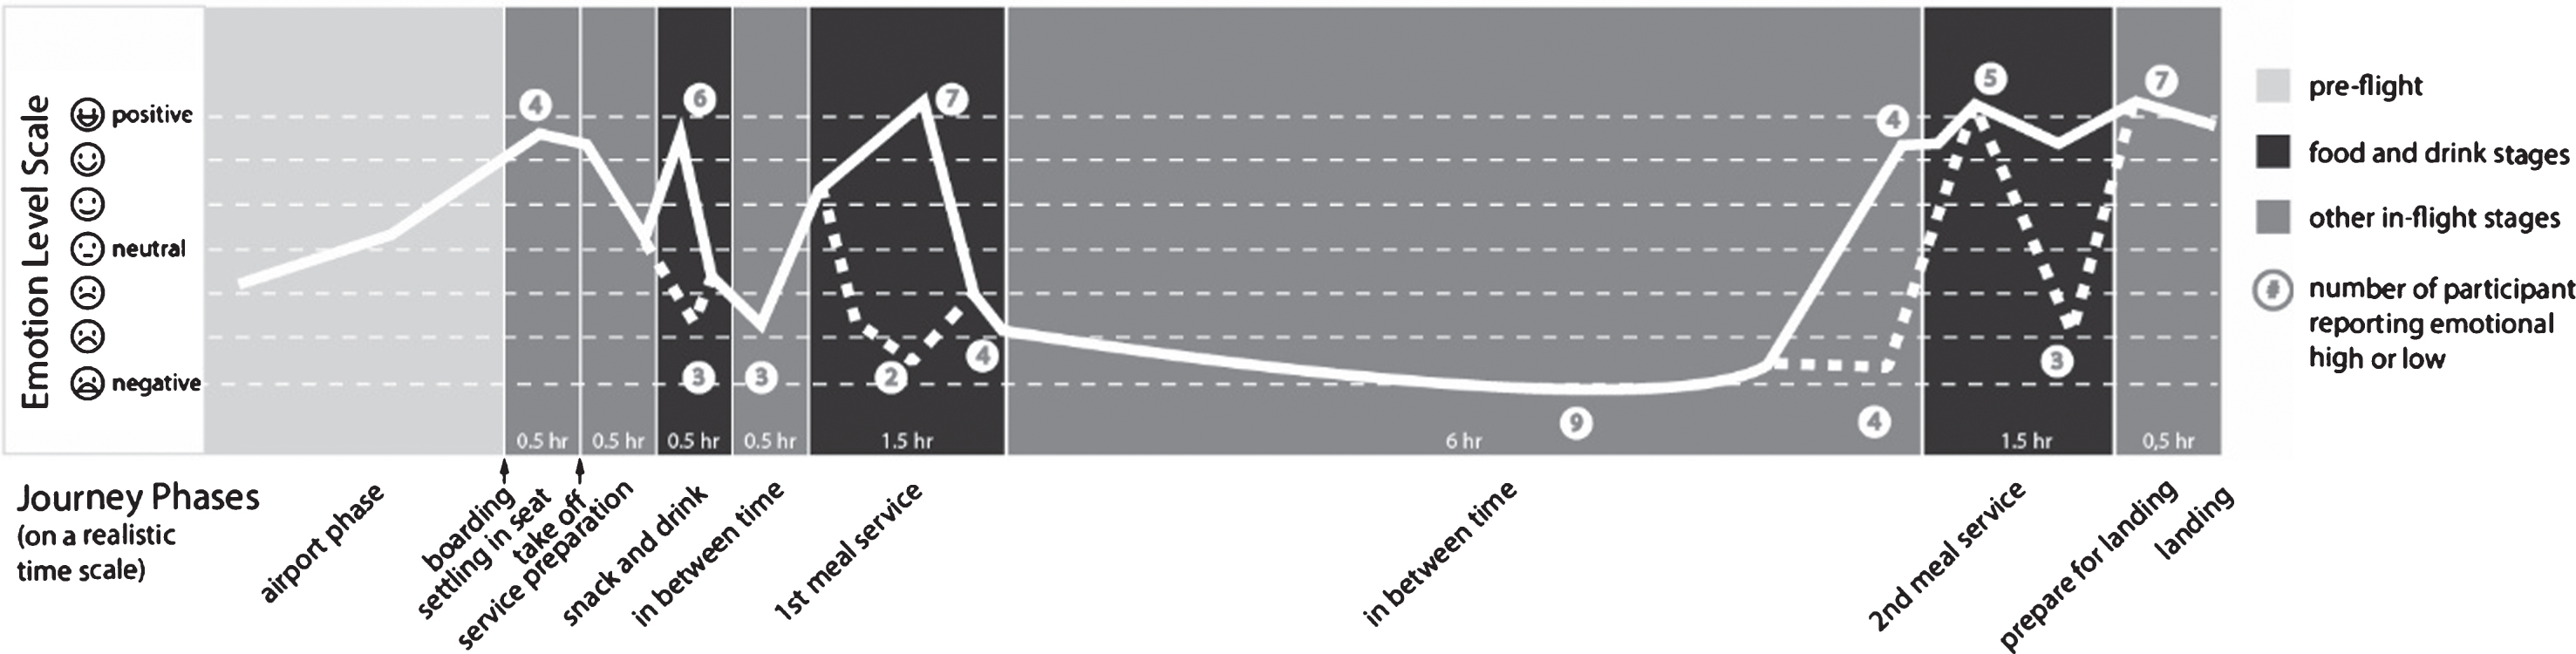
Figs. 1 and 5 are useful in answering the third research question. The cruise flight, which is usually the longest part of the flight showed significantly lower comfort and the most negative emotions. The period after boarding and before taking off and the period of arriving at the destination both have a high comfort and positive emotions.
4Discussion
The first research question regarding the recall of previous comfort experiences can be answered by this study. In different phases of the flight, differences in comfort experience were shown. The highest comfort was between take-off and the cruise flight period and arriving at the destination and the lowest comfort was experienced while stowing the luggage and during the cruise flight. It shows similarities with the answers to the second research question. Real time recording of the emotions show that during the long haul flight, ‘after boarding but before take-off’, ‘meal service stages’ and ‘arriving at the destination’ were experienced as positive, while the long cruising time is perceived negative. Ahmadpour, Kühne, Robert and Vink also showed that the real-time emotional recordings and retrospective evaluations of comfort were not significantly different [15].
In this study not all answers were similar. The period “after boarding but before taking off” is reported as a positive through real-time reporting, while stowing carry-on luggage has low comfort scores in the retrospective study. Perhaps the whole process of boarding and settling down in passenger’s seat is seen as positive and the stage of luggage stowing is only a small element in it, with minimal influence on the total experience. However Ahmadpour, Robert and Lindgaard also found a significant correlation between overall comfort and carry-on luggage room for long haul flights [10] and Vink, Bazley, Kamp and Blok also reported a correlation of 0.33 between luggage stowing and overall comfort [3].
In the qualitative in-flight research, food and drink services (including the first drink/snack service and the two full meal services) were reported as a combination of positive and negative experiences. The positive perception of food and drink services found in the quantitative retrospective study is also rather high. From the in-depth insights of the qualitative reporting, it suggests that food and drink service provides passenger something to do and it distracts them from boredom and the discomfort of lack of leg room. Also VR can distract from a situation with low discomfort [6]. In the retrospective study it is shown that under the same conditions the comfort is rated significantly higher while gaming, walking through the plane, reading, when the garbage is collected, while watching IFE, when listening to music and while the food is being served, probably also because it distracts from the situation.
On the other hand, in the real-time reporting, some passengers expressed that although they appreciate the food service, they also experience negative emotions of feeling overwhelmed by the abundant objects (e.g. food tray, fold down table, personal items etc.) and multiple activities (e.g. watching a movie, being served by flight attendant, and eating a meal at the same time) during this period. This explains the combination of positive and negative experiences.
Sleeping and boredom have the lowest comfort recordings from both the retrospective research and real-time reporting. This makes sense since sleeping upright is not ideal and can even lead to health risks [16].
Some drawbacks of this study are that a relatively young population is studied and the majority of participants is from the Netherlands. Age and difference in cultures do play a role in the emotional experience and comfort [17]. Accessing overhead bins, using in-flight entertainment systems and in- and egress are for instance problems mentioned by elderly. The hand luggage issue was mentioned by the relatively young people in this study as well, but boarding and IFE scored relatively good.
This study also did not explicitly relate the different aspects to the overall comfort (like [8] and [3]). Also first impressions of the cabin environment (within the 12.8±4.5 minutes of a short and 31±19.5 minutes of long flights) highly determines passengers’ overall comfort experience [15]. So, apart from paying attention to the cruise flight and luggage, it might be useful to see what the elements in this phase are. Passengers associate the seat and the cabin temperature both with positive and negative emotions, while IFE is only considered positive and the neighbour as negative [8].
The data is analysed statistically with multiple pairwise t-tests, comparing consecutive phases of the flight. This method might lead to a chance of error when comparing comfort experience of activities in all different (not adjacent) phases due to using multiple t-tests.
This study suggests that airlines should invest in improving the passenger comfort experience during the cruise phase of the flight. This can be done by improving the possibility to sleep, overcoming boredom and adjust the service provided by the flight attendants to the liking of the passengers [3, 18]. Moreover, opportunities could be in two directions, improving the in-seat experience or innovation in cabin spaces outside of the seat to encourage passengers to get out of their seat occasionally during the long cruise. For the latter [7] showed that walking in the plane of flights longer than 6 hours during cruise flight was seen as the most refreshing activity.
5Conclusion
149 young travellers reported the highest comfort after their flight after take-off and arriving at the destination. The lowest comfort was experienced while stowing the luggage and during the cruise flight between the two meals. It shows similarities with the qualitative long haul inflight study as after take-off and while arriving at the destination the most positive emotions were recorded and during the cruise flight there is a negative experience phase.
Conflict of interest
None to report.
References
[1] | Airbus. Global Market Forecast 2015-2033 [Internet]. (2004) [cited 2014 Dec 8]. Available from: http://www.airbus.com/company/market/forecast/ |
[2] | Brauer K . What is it worth? Published as “Group Therapy” Aircraft Interiors International. March (2006) . |
[3] | Vink P , Bazley C , Kamp I , Blok M . Possibilities to improve the aircraft interior comfort experience. Appl Ergon (2012) ;43: (2):354–9. |
[4] | Kremser F , Guenzkofer F , Sedlmeier C , Sabbah O , Bengler K . Aircraft seating comfort: The influence of seat pitch on passengers’ wellbeing. Work (2012) ;41: :4936–42. |
[5] | Vink P , Hallbeck S . Editorial: Comfort and discomfort studies demonstrate the need for a new model. Appl Ergon (2012) ;43: (2):271–6. |
[6] | Lewis L , Patel H , Cobb S , D’Cruz M , Bues M , Stefano O , et al. Distracting people from sources of discomfort in a simulated aircraft environment. Work (2016) , Accepted for publication. |
[7] | Hiemstra-van Mastrigt S . Comfortable passenger seats [Ph.D]. Delft University of Technology; (2015) . |
[8] | Ahmadpour N , Lindgaard G , Robert JM , Pownall B . The thematic structure of passenger comfort experience and its relationship to the context features in the aircraft cabin. Ergonomics (2014) ;57: (6):801–15. |
[9] | McMullin D . Aircraft seating comfort in the context of passenger comfort. Presentation presented at; (2013) ; IQPC Innovative Aircraft Seating conference, Hamburg, Germany. |
[10] | Ahmadpour N , Robert J , Lindgaard G editors. A Study of Passengers’ Real-Time Emotional Responses and Comfort Experience During the Flight Using an Experience Sampling Method. Applied Human Factors and Ergonomics conference; (2014) July 19-23. pp. 2225–33. |
[11] | Konieczny G . Die Messung und Steigerung der Qualität von Dienstleistungen in der Flugzeugkabine-ein Beitrag zur kundenorientierten Flugzeugentwicklung [Ph.D]. Technische Universität Berlin; (2001) . |
[12] | Bazley C , Nugent R , Vink P . Patterns of discomfort. Ergonomics (2015) ;5: (1). |
[13] | Smulders M , Berghman K , Koenraads M , Kane JA , Krishna K , Carter TK , et al. Comfort and pressure distribution in a human contour shaped aircraft seat (developed with 3d scans of the human body). Work (2016) ;54: (4):925–40. |
[14] | Desmet PM . Designing emotion [Ph.D]. Delft University of Technology; (2002) . |
[15] | Ahmadpour N , Kühne M , Robert JM , Vink P . Attitudes towards personal and shared space during the flight. Work (2016) ;54: (4):981–7. |
[16] | Brundrett G . Comfort and health in commercial aircraft: A literature review. J R Soc Health (2001) ;121: (1):29–37. |
[17] | McMullin D , Angerer J , Green R , Stancato F , Ciaccia F , Cintra A , David A , Morgan ED , Mastaw M , Ruggiero F editors. Qualitative and Quantitative Study of Older Japanese, German, Brazilian and US Air Travelers – the BEST AGE study. Human Factors and Ergonomics Society 58th Annual Meeting. (2014) Oct 27-31. pp. 135–9. |
[18] | Chen CF . Investigating structural relationships between service quality, perceived value, satisfaction, and behavioral intentions for air passengers: Evidence from Taiwan. Transp Res Part A Policy Pract (2008) ;42: (4):709–17. |


