
Musculoskeletal signs in female homecare personnel: A longitudinal epidemiological study
Abstract
BACKGROUND:
In Sweden, homecare services take care of elderly and disabled people, work that often requires heavy lifting and forward bending, resulting in high prevalences of pain and work accidents.
OBJECTIVE:
Using an eight-year follow-up, this study determines the prognostic importance of certain musculoskeletal signs reported in earlier studies [1, 2] with respect to aspects of pain and perceived disability.
METHODS:
Baseline data has been reported in earlier studies of 607 women [1–3]. This study uses a postal questionnaire survey and reports the results of eight years post initial study.
RESULTS:
Segmental pain at L4-L5 and/or L5-S1 levels was associated with higher low back pain intensity and disability at the eight-year follow-up. A decrease in low back pain intensity over eight years was larger for those with segmental pain. The important signs in the longitudinal analyses of pain aspects and disability were lumbar spinal mobility and segmental pain at L4-L5 and L5-S1 levels, but the explained variations were low.
CONCLUSION:
Evaluation of low lumbar segmental pain provocation and mobility should be considered in routine clinical assessments, as this type of evaluation provides prognostic pain and disability information over time.
1Introduction
High prevalence of chronic pain conditions is found in the community [4–6]; 19 % of the European population report moderate to severe chronic pain states [7]. This high prevalence is associated with large individual suffering and high socioeconomic costs [8–11]. The majority of chronic pain conditions assessed and treated at primary healthcare centres, general medical clinics, and pain managementcentres are considered musculoskeletal pain conditions [12, 13].
In Sweden, homecare services are part of the public health system that takes care of elderly and disabled people. Homecare personnel report frequent heavy lifting, forward bending [14], and high frequencies of work-related musculoskeletal pain conditions [15, 16] and injuries [17]. Similar negative consequences are reported for nurses and nursing assistants [18]. This study is part of a larger project concerning this working population.
In clinical practice, signs are considered objective when an independent examiner observes them. However, many of the signs examined routinely in patients with chronic pain conditions require co-operation and verbal reports from the patient and/or concern a subjective symptom/disorder and are therefore per definition subjective. According to cross-sectional studies, signs of musculoskeletal system are regarded to have low correlation with pain and disability [19–21]. Our previous epidemiological studies of homecare personnel [1, 2] investigated cross-sectional aspects of validity and reliability of certain signs. To estimate posture and total spinal mobility (extension/flexion in the thoracic and lumbar spine), we used a kyphometer, which we regarded as the most objective instrument in clinical practice for registration of mobility and posture [1]. A kyphometer has good inter-rater reliability (kappa ≈ 0.7) of segmental motion tests and segmental pain provocation tests of the lumbar segments L4-S1 [1]. Good criterion validity for segmental mobility tests in relation to kyphometric tests was also shown [1]. Deviations from normal segmental mobility of the lumbar spine were associated with more lumbar pain and higher degrees of disability [2]. Segmental pain provocation tests in the examined low-lumbar spinal region (L4 to S1 segments) correlated strongly with self-reported pain intensity as well as disability [2]. Hence, several of these signs showed good reliability and validity and it is important to investigate the prognostic values of these signs (e.g., with respect to pain intensities, anatomical spreading of pain, and disability) in order to determine the clinical utility of musculoskeletal signs. This has only been investigated to a limited extent even though some studies indicate that signs in general have little relevance for prognosis and outcome of treatments and rehabilitation at the disability level [19–21].
Thus, the aim of this prospective epidemiological study of women in homecare work was to evaluate what signs (posture, total spinal mobility, Beighton score, segmental pain provocation, and segmental mobility) reported in our earlier studies [1, 2] had prognostic importance with respect to perceived aspects of pain and disability at the eight-year follow-up. More specifically, we asked the following questions:
• Did signs measured at baseline have significant relations with the follow-up parameters, possibly implying any prognostic value?
• In a multivariate context, which signs at baseline had the strongest relationships/associations with the follow-up variables of pain anddisability?
2Subjects and methods
2.1Subjects
To take part in the baseline study in 1997, the subjects had to fulfil the following criteria: employed by the local authority of Nyköping (Sweden) and working at least 50% part-time as homecare personnel (permanent appointment or employed long-term without permanent position). All female employees (with or without pain and/or disability) fulfilling these criteria were invited to participate in the study: 56.9% of the subjects reported low back pain problems and 47.8% of the subjects reported low back pain on several days during the previous week before the baseline study. Of these, 607 (94%) out of 643 subjects participated in the baseline part of the project; eight (1.3%) out of 607 were on parental leave and nine (1.5%) were on sick leave. The sample of subjects thus consisted of employed homecare personnel [2].
In this follow-up study (performed in 2005), 528 (87%) out of 607 answered the questionnaires after up to two postal reminders. We could not reach 71 people and eight people – all retired – did not answer despite letter and phone reminders. No systematic statistical differences were noted from the first study in any parameter between those participating in the follow-up and those who did not (Table 1). Fifty-five were fully retired, two were half retired, and two were 25% retired. Of those not retired (467 cases), 33% no longer worked in homecare, but the vast majority still worked within healthcare.
The study was granted ethical clearances by the Ethics Committee of Örebro County Council(Dnr: 399/95).
Table 1
Baseline data for participants (n = 528) and non-participants (n = 79) in the eight-year follow-up
| Group | Participants | Non-participants | |
| Variables | Mean ± SD | Mean ± SD | p-value |
| Age (years) | 40.7 ± 11.6 | 39.5 ± 14.0 | 0.433 |
| Weight (kg) | 66.7 ± 11.6 | 70.3 ± 14.0 | 0.024 |
| Height (cm) | 165.5 ± 5.6 | 166.2 ± 4.9 | 0.326 |
| Pain intensity neck | 26.2 ± 27.1 | 25.2 ± 26.5 | 0.801 |
| Pain intensity shoulders | 25.8 ± 25.7 | 26.1 ± 25.6 | 0.896 |
| Pain intensity upper back | 20.5 ± 23.3 | 23.2 ± 22.8 | 0.343 |
| Pain intensity lower back | 33.9 ± 28.0 | 36.4 ± 27.9 | 0.471 |
| DRI | 17.8 ± 15.6 | 19.5 ± 15.9 | 0.393 |
| Work in actual work (years) | 12.5 ± 7.6 | 10.9 ± 7.9 | 0.091 |
| Work in health care (years) | 18.4 ± 10.0 | 17.6 ± 11.9 | 0.572 |
| Signs | |||
| Beighton score | 1.5 ± 1.9 | 1.4 ± 1.9 | 0.496 |
| Total lumbar sagittal mobility (degrees) | 71.0 ± 13.5 | 71.8 ± 13.0 | 0.577 |
| Lumbar lordosis (degrees) | –33.0 ± 6.5 | –32.6 ± 6.5 | 0.637 |
| % | % | ||
| Mobility at L4-L5a | 73.3 | 76.3 | 0.187 |
| Mobility at L5-S1a | 64.9 | 68.4 | 0.216 |
| Segmental pain at L4-L5b | 21.7 | 21.1 | 0.886 |
| Segmental pain at L5-S1b | 22.0 | 18.4 | 0.418 |
Mean ± SD are reported. Furthest to the right is given the result of the statistical analyses (p-values). a = % with normal mobility; b = % with segmental pain.
2.2Methods
In the baseline part of the project, subjects answered a questionnaire composed of anthropometric and socio-demographic variables, pain intensity in nine different anatomical regions (neck, shoulder, arm, hand, upper back, low back, hip, knee, and foot) as described by the Nordic Minister Council questionnaire [22] and the Disability Rating Index (DRI) for assessment of mainly physical aspects of disability. Finally subjects were clinically examined by three experienced physiotherapists (blinded to the results of the baseline questionnaire). These assessments and examinations were performed according to a predetermined schedule. The follow-up was made after eight years and consisted of a postal questionnaire with up to two postal reminders sent out in two- or three-week intervals.
2.2.1Signs registered in the baseline study
This longitudinal study uses signs that demonstrated reliability and validity in the two previous studies. The signs are described in detail in our previous studies [1, 2]. Brief descriptions are given below. Body posture was assessed while the participants were standing at ease and spinal mobility was registered in degrees by Debrunner’s kyphometer (in short, a type of angle hook that can measure the degree of kyphosis, lordosis, and the degree of back and forward bending in the thoracic and lumbar spine) [1–3, 23].
General joint laxity was assessed using the modified Beighton score (0–9 points): i) passive dorsiflexion of MCP 5 beyond 90, ii) passive apposition of the thumb to the flexor aspect of the forearms, iii) hyperextension of the elbow beyond 10°, iv) hyperextension of the knees beyond 10°, and v) forward flexion of the trunk, with knees straight, so that the palms of the hands rested easily on the floor [1–3, 24, 25].
Segmental mobility and segmental provocation pain (from T10 to the lumbo-sacral level) was estimated manually by trained physiotherapists [1]. In brief, the subject lying on her side with hips and knees flexed and the examiner standing, the mobility of each of the eight segments from the lumbosacral segment up to T10-T11 was tested using five passive movements: extension and flexion, right and left rotation, and translatoric joint play. The lumbosacral segment was defined as segment L5-S1. Segmental mobility was estimated, from the neutral position, by stepwise interspinal palpation. Any tenderness/pain (labelled “provocation pain”) during each part of the testing was recorded. From these five passive movements, the examiner rated the segmental mobility using a five-point scale: +2 = extreme hypermobility, +1 = moderate hypermobility, 0 = normal mobility, –1 = moderate hypomobility, and –2 = extreme hypomobility. No predetermined criteria for the segmental mobility with respect to the five passive movements were used. The physiotherapists were instructed to determine the passive movement tests whether a segment was hypermobile, normal, or hypomobile. Segmental pain provocation was rated as 1 = pain and 0 = no pain. This study included segmental mobility and segmental pain provocation tests for L4-L5 and L5-S1 mainly because deviations from normal were sparse above these levels.
2.2.2Symptoms and disability ratings registered in the eight-year follow-up questionnaire
Pain and disability results at baseline have been presented elsewhere [26].
2.2.2.1Pain
Pain intensity was requested over the previous 30 days for all nine anatomical regions (neck, shoulder, arm, hand, upper back, low back, hip, knee, and foot) [22] using a 100-mm visual analogue scale (VAS) with the anchor points 0 = no pain and 100 = maximal pain [1]. In the results presented, we have excluded local arm, hand, and foot pain as these regions are clinically less relevant (although we included them in the variables average pain intensities and number of painful regions). The average of the pain intensities of the nine predefined anatomical regions was calculated and denoted as PainVASreg. The number of painful regions (PainNosreg; 0 to 9 anatomical regions) were also calculated. A painful region was defined as a pain intensity >9 out of 100.
2.2.2.2Disability
International Classification of Functioning, Disability and Health (ICF) offers an integrated bio-psycho-social model of human functioning and disability and constitutes a useful tool [27]. Functioning serves as an umbrella term that includes body functions, activities, and participation. Disability includes impairments, activity limitations, and participation restrictions.
In the former and in the present study, Disability Rating Index (DRI) was used to assess mainly physical aspects of disability [28] (i.e., a combination of body functions and activities). The DRI was calculated as the mean of the 12 items (i.e., the DRI is a continuous scale and can vary between 0–100; a high value denotes high disability). The following items were considered: 1) dressing without help, 2) outdoor walks, 3) climbing stairs, 4) sitting for a long time, 5) standing bent over a sink, 6) carrying a bag, 7) making a bed, 8) running, 9) light work, 10) heavy work, 11) lifting heavy objects, and 12) participating in exercise/sports. Hence, 12 items are arranged in increasing order of physical demand, particularly with reference to low-back pain. DRI has been used in studies of various pain cohorts with cross-sectional or longitudinal designs [29–33]. The DRI is considered as a robust and useful clinical and research instrument with good reliability, internal consistency, and construct validity [28, 31].
2.3Statistics
The statistical evaluations were made using the statistical packages SPSS (version 21.0; SPSS Inc., Chicago, Illinois, USA), and SIMCA-P+ (version 13.0; Umetrics Inc., Umeå, Sweden). P < 0.05 was considered significant in all tests.
2.3.1Traditional statistics
Results in the text and tables are generally given as mean values ± one standard deviation ( ± 1SD). The pain intensities and DRI are not normally distributed but the sample size is large (n > 500) and parametric tests are more sensitive than non-parametric tests, so according to the “Sample limit theorem” [34] for comparisons between groups, we used parametric tests (t-test, paired t-test, ANOVA, and repeated ANOVA). Spearman rank order correlation was used for correlation analysis and the Wilcoxon matched pairs test was used for analysing differences in small groups (i.e., low back pain subgroups).
2.3.2Multivariate statistics
Classical statistical methods can quantify the level of individual variables but disregard interrelationships between different variables and thereby ignore system-wide aspects [35]. Classical methods assume variable independence when interpreting the results. Because signs and symptoms at baseline and at follow-up were intercorrelated, certain advanced multivariate techniques were used to analyse the importance of different variables.
Principal component analysis (PCA) can be viewed as a multivariate correlation analysis, which was performed using SIMCA-P+. R2 describes the goodness of fit while Q2 describes the goodness of prediction. The PCA and the partial least square regression (PLS) implemented in SIMCA-P+, in contrast to traditional statistical packages, includes cross-validation to secure stable results (models). SIMCA-P+ and similar advanced packages, unlike SPSS, use the NIPALS algorithm to compensate for missing data. The main reason for using PCA in the present study was to identify multivariate outliers. Outliers were identified using the two methods available in SIMCA-P+: 1) score plots in combination with Hotelling’s T2 (identifies strong outliers) and 2) distance to model in X-space (identifies moderate outliers). There were six strong outliers identified in the data which were excluded from the multivariate analyses.
PLS was used for the multivariate regression analyses [35]. The VIP variable (variable influence on projection) indicates the relative relevance of each X-variable; VIP ≥ 1.0 was considered significant [35]. Coefficients were used to note the direction of the relationship (positive or negative correlation).
3Results
The results concerning the registered signs at baseline have been presented in detail elsewhere and are summarized in Table 2 [2, 3].
Table 2
Signs registered at the clinical examination at baseline [1, 2]
| Signs at baseline | Reported as | Value |
| Mobility at L4-L5 | Proportion (%) of the sample with normal mobility | 73.3% |
| Mobility at L5-S1 | Proportion (%) of the sample with normal mobility | 64.9% |
| Segmental pain at L4-L5 | Proportion (%) of the sample with segmental pain | 21.7% |
| Segmental pain at L5-S1 | Proportion (%) of the sample with segmental pain | 22.0% |
| Beighton score | Mean ± SD | 1.5 ± 1.9 |
| Total lumbar sagittal mobility | Mean ± SD (degrees) | 71.0 ± 13.5 |
| Lumbar lordosis | Mean ± SD (degrees) | –33.0 ± 6.5 |
3.1Signs at baseline vs. follow-up variables
The follow-up variables (pain aspects and disability) registered using the eight-year follow-up postal questionnaire are presented in Table 3. Comparisons between pre- and post-values for pain and disability have been recently presented elsewhere [26]; disability had increased significantly during the time period while prevalence of pain in upper back, lower back, and knees as well as pain intensity of the low back had decreased.
Table 3
Pain intensity ratings, aspects of spreading of pain and DRI values at follow up
| Variables at follow up | Follow up |
| Mean ± SD | |
| Pain intensity neck | 24.5 ± 27.9 |
| Pain intensity shoulders | 27.6 ± 27.9 |
| Pain intensity upper back | 18.9 ± 26.0 |
| Pain intensity lower back | 27.7 ± 27.9 |
| Pain intensity hips | 16.5 ± 25.4 |
| Pain intensity knees | 16.0 ± 24.4 |
| PainNosreg | 4.1 ± 2.9 |
| PainVASreg | 20.7 ± 19.1 |
| DRI | 21.4 ± 20.0 |
Mean values ± one SD are reported.
3.1.1Total lumbar sagittal mobility and lumbar lordosis at baseline vs. follow-up variables
The total lumbar sagittal mobility registered at baseline showed low correlations; however, for several parameters, significant negative correlations were observed. Hence, there were significant correlations between total lumbar sagittal mobility and pain intensities for four out of six anatomical regions together with pain intensity across anatomical regions, spreading of pain and DRI: pain intensity shoulders (r = –0.104, p = 0.017), pain intensity low back (r = –0.166, p < 0.001), pain intensity hips (r = –0.188, p < 0.001), and pain intensity knees (r = –0.237, p < 0.001), pain intensity across anatomical regions (PainVASreg; r = –0.184, p < 0.001), spreading of pain (PainNosreg) (r = –0.182, p < 0.001) and DRI (r = –0.210, p < 0.001). The degree of lumbar lordosis correlated positively with pain intensities of two anatomical regions (i.e., pain intensity low back (r = 0.108, p = 0.013), and pain intensity hips (r = 0.098, p = 0.025)), PainVASreg (r = 0.097, p = 0.027), and DRI (r = 0.148, p = 0.001). Hence, low correlations existed between this sign and some pain characteristics and disability aspects.
3.1.2Beighton score at baseline vs. follow-up variables
Beighton score registered at baseline showed no significant correlations with either pain intensities, including PainVASreg and PainNosreg, or DRI at the eight-year follow-up (data not shown).
3.1.3Segmental mobility at baseline vs. follow-up variables
Segmental mobility of L4-L5 showed significant differences in low back pain intensity at follow-up (ANOVA p = 0.0378). Post hoc tests showed a significantly higher pain intensity of the low back for segmental hypermobility versus normal mobility (Table 4). There was a V-form with tendency to higher pain levels for hypo- and hyper-mobility and the sign hypermobility was still related to a significant higher low back pain intensity at follow-up (Fig. 1); this pattern was also found at baseline.
Fig.1
Segmental mobility at L4-L5 level at the clinical assessment at baseline versus low back pain intensity (mean ± 95% CI) at baseline and at eight-year follow-up. *denotes significant difference in relation to normal segmental mobility.
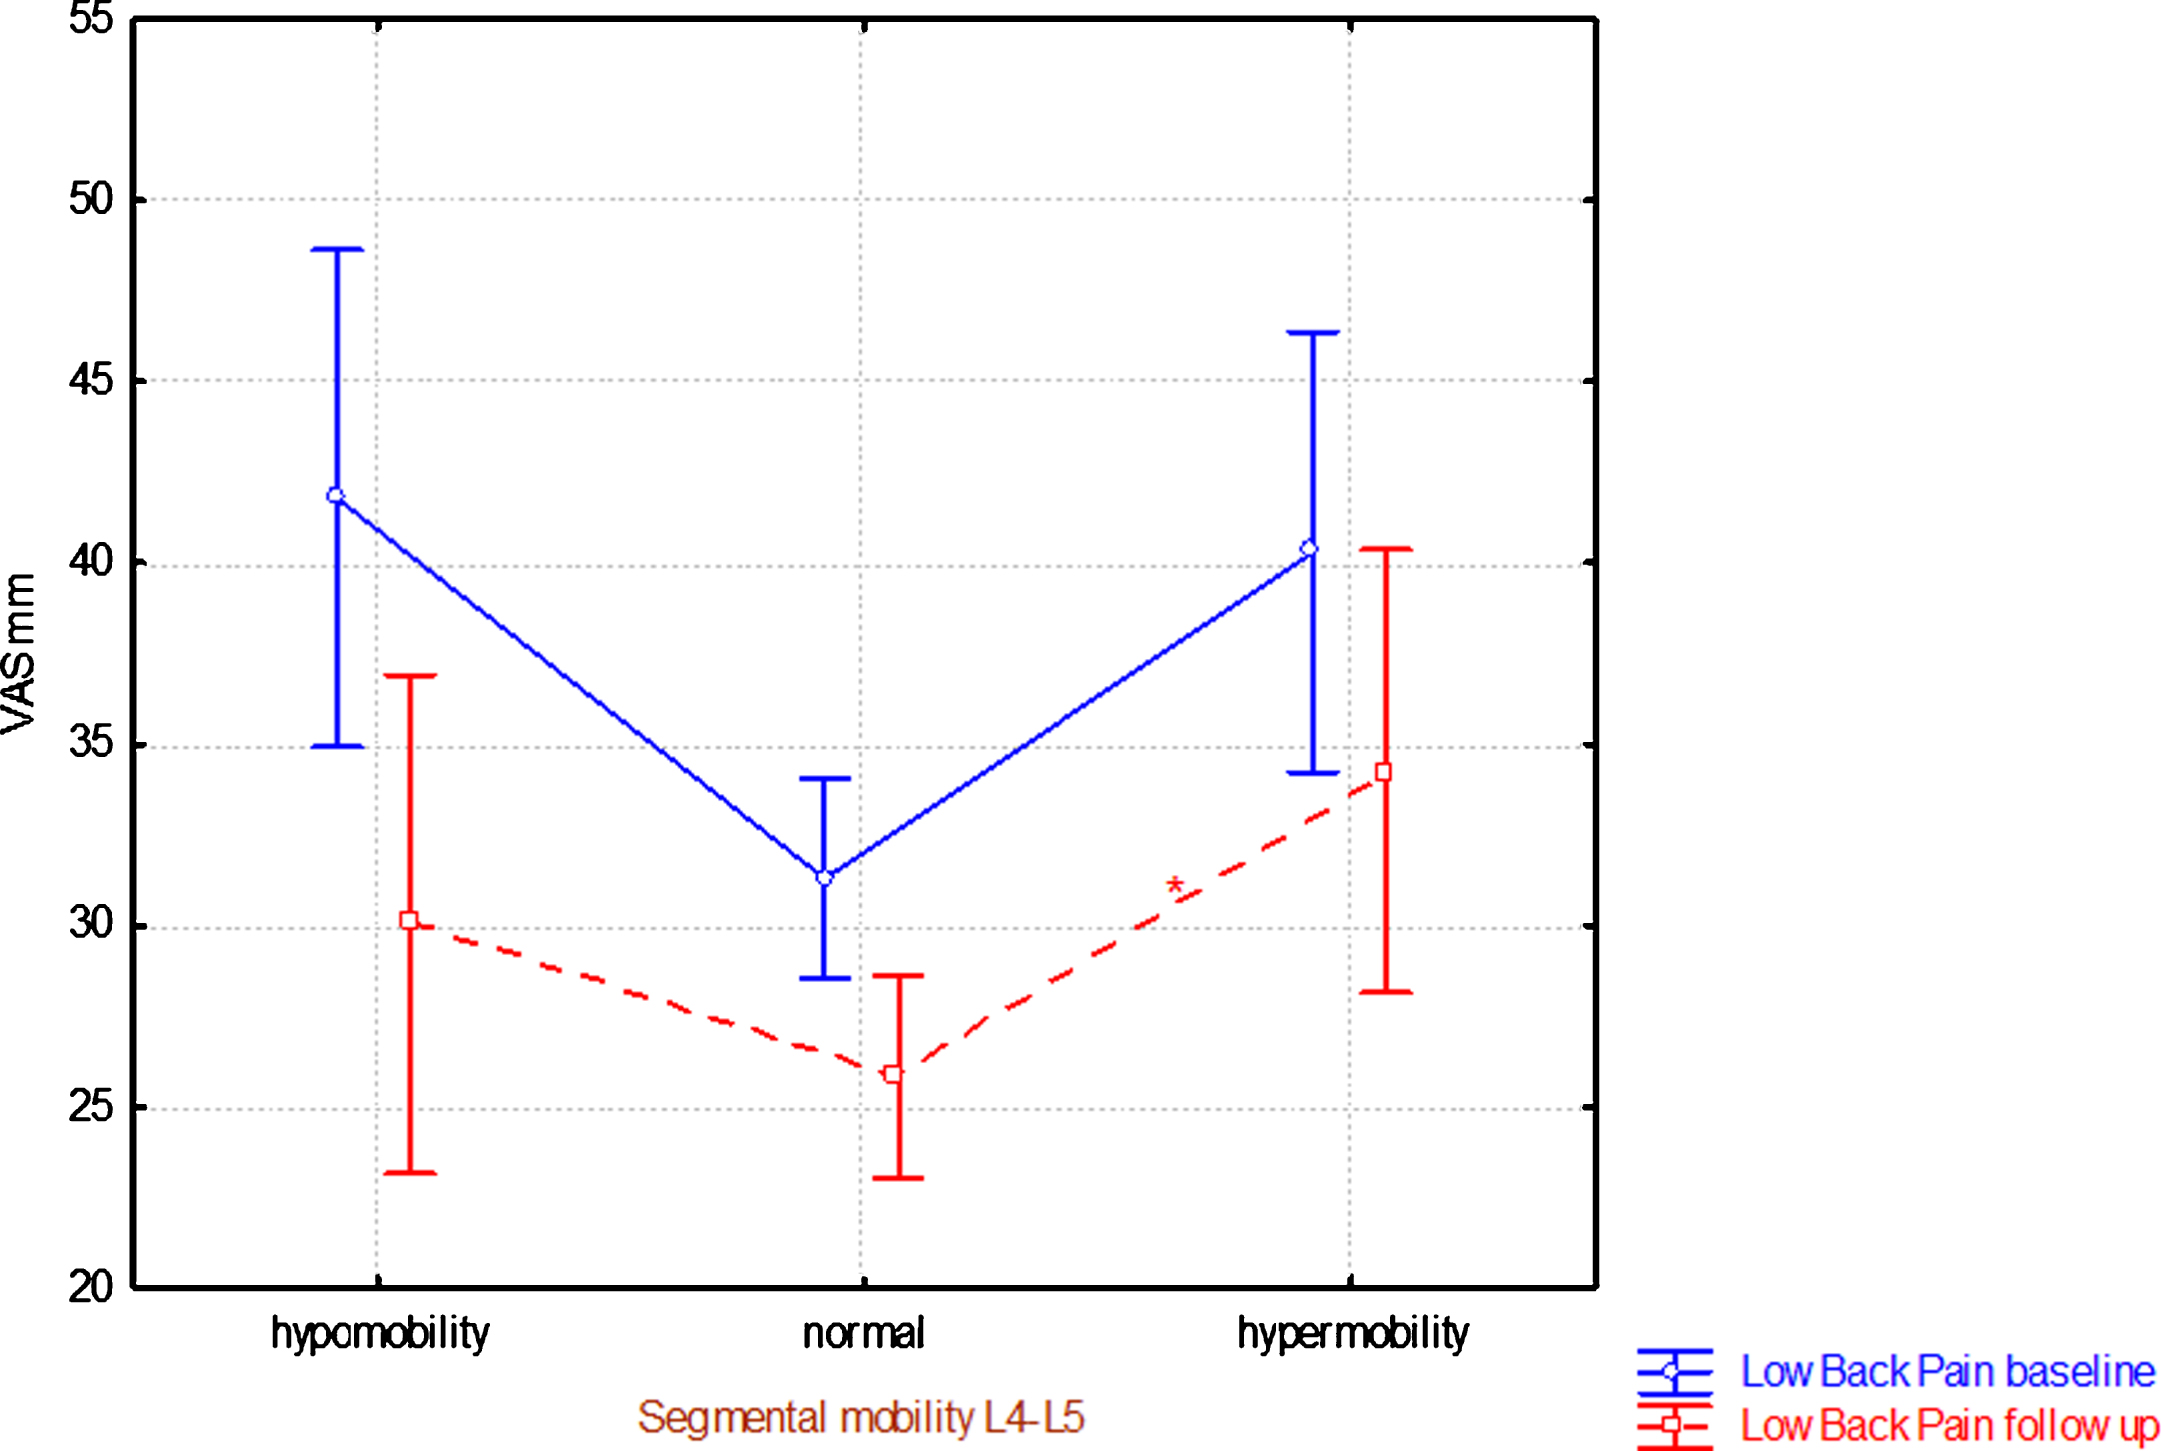
Table 4
Segmental mobility status of L4-L5 and L5-S1 levels at baseline versus pain intensity of low back at eight-year follow-up
| Pain intensity at follow up | Statistics | |||
| Segmental mobility of L4-L5 at baseline | N | Mean | SD | p-value |
| hypo | 63 | 30.1 | 27.3 | 0.038 |
| normal | 383 | 25.9 | 27.9 | |
| hyper | 80 | 34.3 | 27.6 | |
| All subgroups | 526 | 27.7 | 27.9 | |
| Post hoc tests | Hypo | Normal | Hyper | |
| p-value | p-value | p-value | ||
| hypo | 0.542 | 0.666 | ||
| normal | 0.542 | 0.049 | ||
| hyper | 0.666 | 0.049 | ||
| Pain intensity at follow up | ||||
| Segmental mobility of L5-S1 at baseline | N | Mean | SD | p-value |
| hypo | 99 | 32.1 | 27.5 | 0.209 |
| normal | 338 | 26.4 | 28.5 | |
| hyper | 89 | 27.3 | 26.0 | |
| All subgroups | 526 | 27.7 | 27.9 | |
Mean ± one SD is reported for pain intensities. Furthest to the right is given the result of the statistical analyses (p-values). |it Post hoc test (Scheffé; p-values) is shown below the results concerning segmental mobility of the L4-5 level. No post-hoc test was done at the L5-S1 level since the overall comparison was non-significant.
For the level L5-S1, there were no significant differences in pain intensity of the low back at follow-up between the three categories (Table 4). The pain intensity pattern was different from the L4-L5 level. In the hypermobility group, low back pain intensity had decreased significantly and approximately reached the low back pain intensity at follow-up level of those who had normal segmental mobility (Fig. 2). Segmental mobility at the L5-S1 level at the baseline assessment correlated significantly with DRI at follow-up (Table 5). No significant relationships were found for the L4-5 segmental level.
Fig.2
Segmental mobility at L5-S1 at the clinical assessment at baseline versus low back pain intensity (mean ± 95% CI) at baseline and at eight-year follow-up eight. *denotes significant difference in relation to normal segmental mobility and significant difference between baseline and follow-up, respectively.
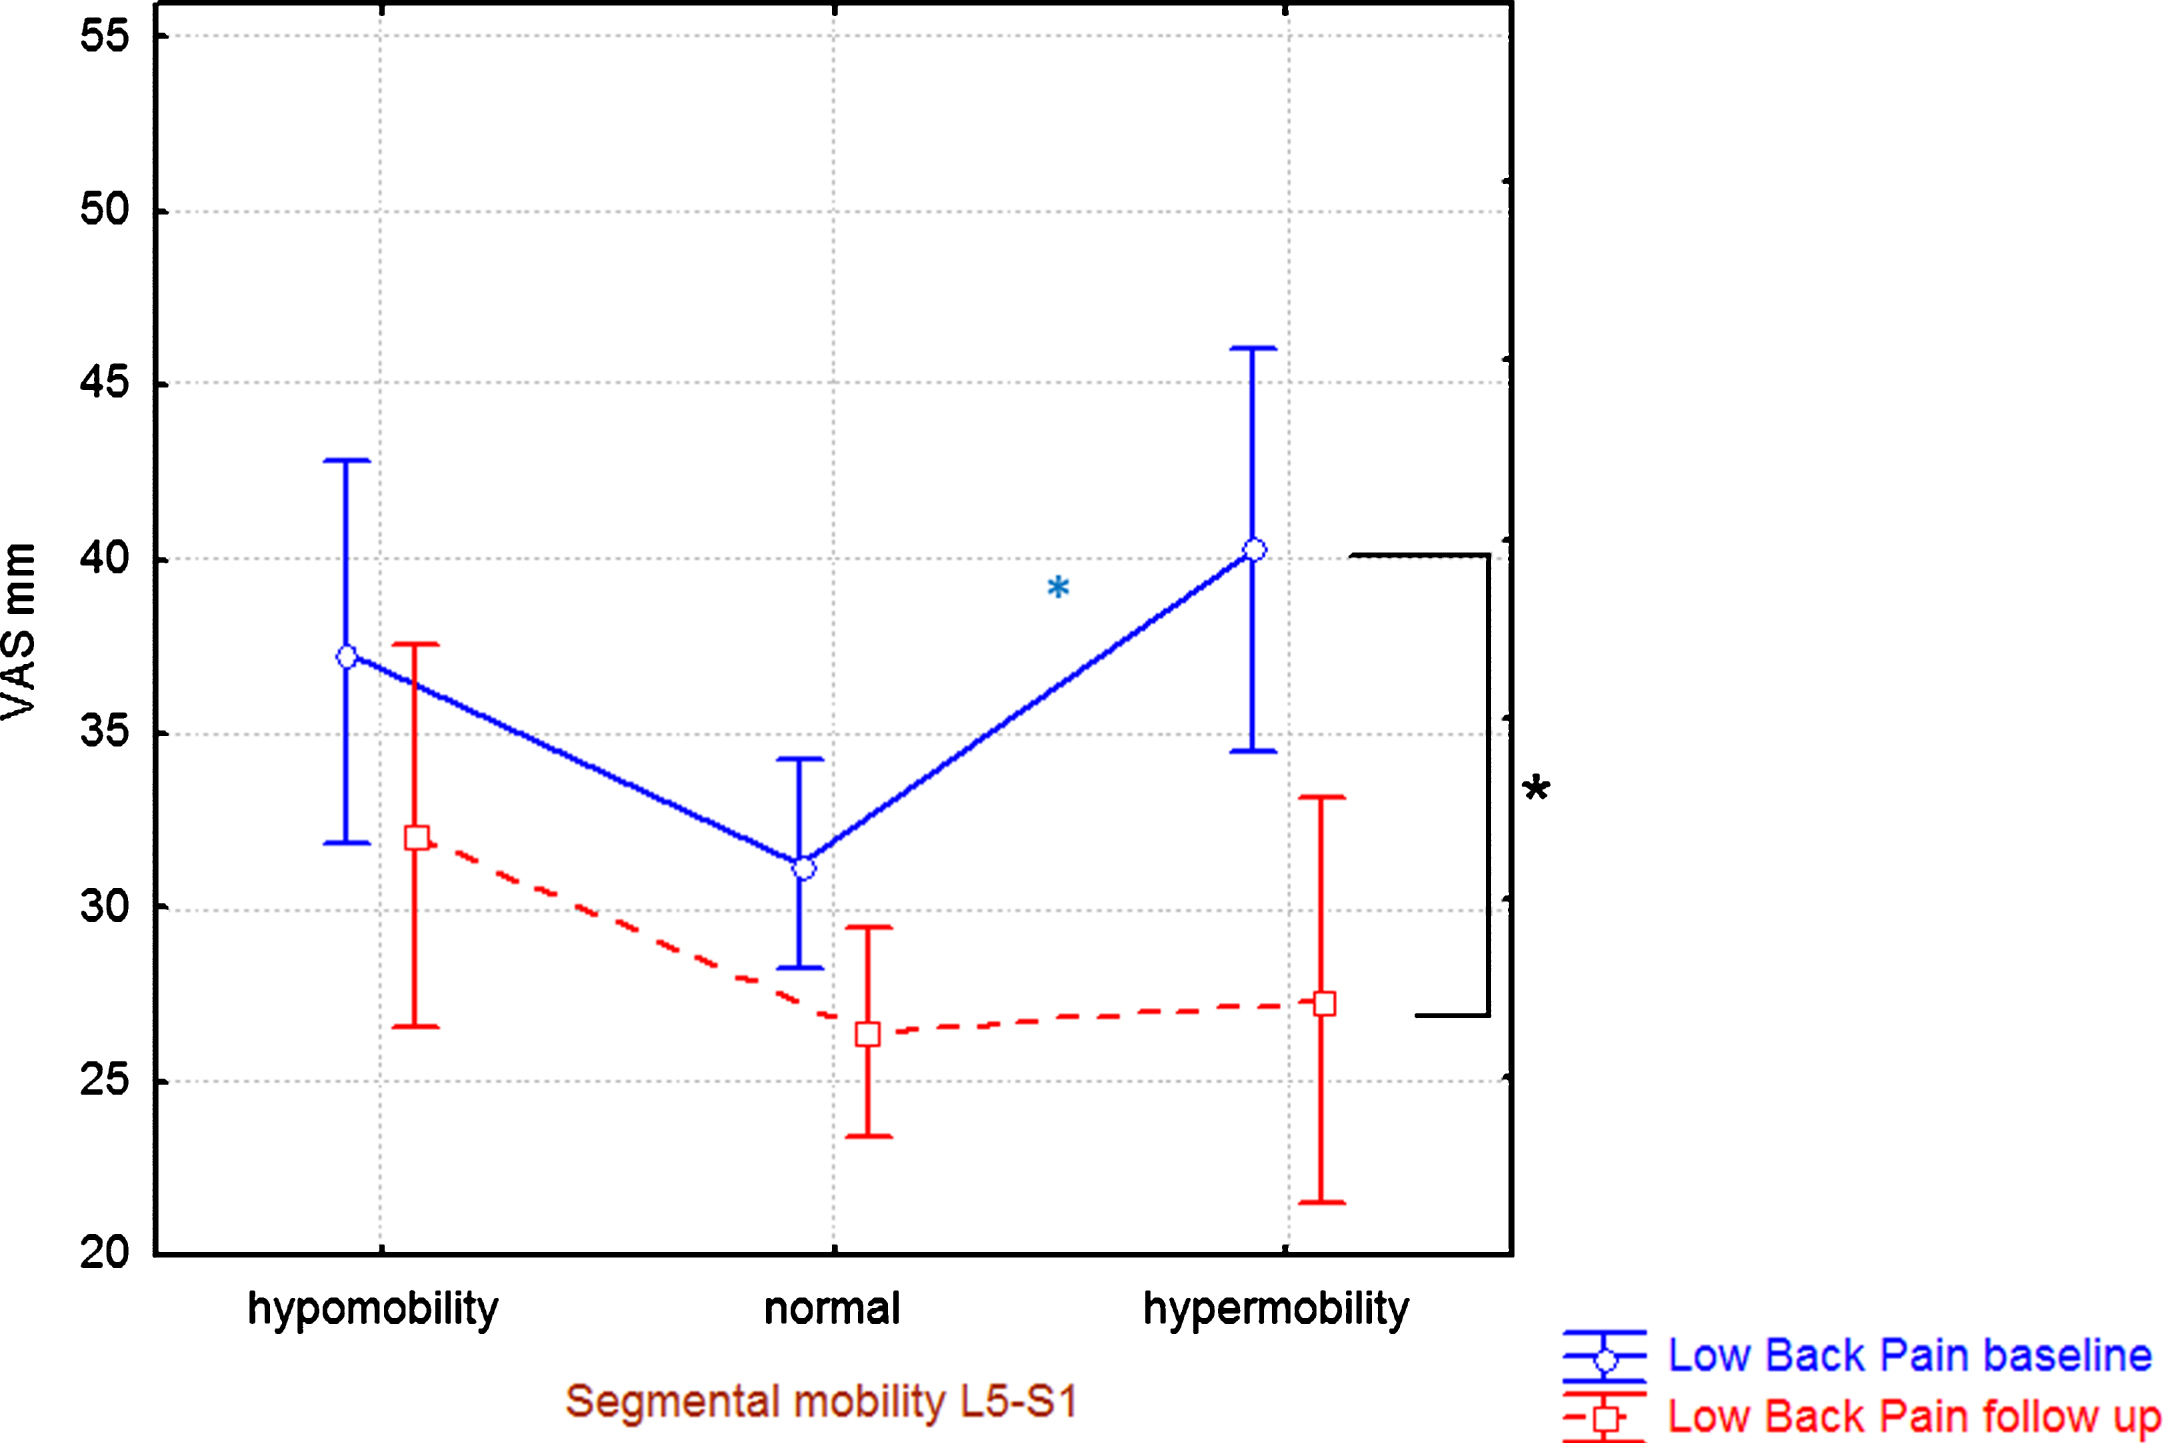
Table 5
Segmental mobility at the L5-S1 level at the clinical assessment at baseline versus DRI at eight-year follow-up
| Segmental mobility | N | DRI | at follow up | K-W ANOVA | Post-hoc |
| at L5-S1 at baseline | Mean | SD | Normal vs. hypo | ||
| p-value | p-value | ||||
| Hypo | 99 | 25.1 | 19.3 | 0.025 | 0.021 |
| Normal | 340 | 20.5 | 20.1 | ||
| Hyper | 89 | 21.4 | 20.8 | ||
| All | 528 |
Mean ± one SD is shown for DRI. Furthest to the right is given the result of the statistical analyses (p-values).
3.1.4Segmental pain at baseline vs. follow-up variables
Those who had segmental pain at L4-L5 and/or L5-S1 levels at baseline had significantly higher low back pain intensity at the eight-year follow-up than those without these signs (Table 6). Those with segmental pain of L4-L5 and/or L5-S1 levels at baseline also reported higher pain intensities at follow-up in several other anatomical areas (Table 6).
Table 6
Segmental pain status at L4-L5 and L5-S1 levels at baseline versus pain intensities in different anatomical regions at eight-year follow-up
| Pain | Intensities at follow up | Statistics | |||
| Segmental pain at L4-L5 at baseline | No | N = 411 | Yes | N = 115 | p-values |
| Mean VAS | SD | Mean VAS | SD | ||
| neck | 23.0 | 27.7 | 29.7 | 27.9 | 0.012 |
| shoulders | 25.7 | 27.6 | 34.3 | 28.0 | 0.001 |
| upper back | 17.5 | 25.1 | 24.1 | 28.3 | 0.012 |
| lower back | 24.9 | 27.5 | 37.7 | 27.1 | <0.001 |
| hips | 14.5 | 24.3 | 23.9 | 27.7 | <0.001 |
| knees | 14.6 | 23.9 | 20.7 | 25.6 | 0.004 |
| Segmental pain | No | N = 407 | Yes | N = 119 | p-values |
| at L5-S1 at baseline | Mean | SD | Mean | SD | |
| neck | 22.9 | 27.1 | 29.9 | 29.8 | 0.015 |
| shoulders | 25.6 | 27.1 | 34.2 | 29.5 | 0.003 |
| upper back | 17.3 | 25.0 | 24.7 | 28.5 | 0.008 |
| lower back | 25.6 | 27.4 | 34.8 | 28.8 | 0.001 |
| hips | 14.6 | 24.2 | 22.9 | 28.1 | 0.005 |
| knees | 14.4 | 23.1 | 21.3 | 27.7 | 0.013 |
Means ± one SD are shown for pain intensities. Furthest to the right is given the result of the statistical analyses (p-values) between those without and with segmental pain.
As described elsewhere, pain intensity of the low back pain had decreased significantly during the eight-year period [36]. The decrease in low back pain intensity over time was larger for those with segmental pain than for those without segmental pain at the baseline assessment: L4-L5: segmental pain (n = 115) decreased from 51 to 38 mm (p < 0.001); no segmental pain (n = 411) decreased from 29 to 25 mm (p = 0.007); L5-S1: segmental pain (n = 119) decreased from 50 to 35 mm (p < 0.001), no segmental pain (n = 407) decreased from 29 to 26 mm (p = 0.023). Still, low back pain after eight years showed significant higher levels when segmental pain was found at baseline (24.9 vs. 37.7 painful L4-L5; 25.6 vs. 34.8 level L5-S1) (Table 6). Those who had segmental pain at baseline had significantly higher DRI at follow-up than those without segmental pain (Table 7).
Table 7
Segmental pain status at L4-L5 and L5-S1 levels at baseline versus DRI at eight-year follow-up
| Baseline | DRI | at follow up | Statistics | ||
| Segmental | No | N = 411 | Yes | N = 115 | p-values |
| pain level | Mean | SD | Mean | SD | |
| L4-L5 | 19.7 | 19.3 | 27.7 | 21.0 | <0.001 |
| L5-S1 | 20.2 | 19.4 | 25.6 | 21.1 | 0.009 |
Mean ± one SD for DRI are shown. Furthest to the right is given the result of the statistical analyses (p-values) between those without and with segmental pain at baseline.
3.2Multivariate analyses
3.2.1Longitudinal regression of pain aspects at follow-up using signs and age as regressors
It was possible to regress the pain intensities at follow-up (i.e., six Y-variables) using the signs at baseline as regressors (X-variables) (R2 = 0.05; Q2 = 0.03). However, the explained variation was markedly better for the lower part of the body than the upper body. Hence, a new regression was made with three Y variables (i.e., pain intensities of lower back, hips, and knees). The significant variables in this regression (R2 = 0.08; Q2 = 0.05) were age (VIP = 2.18+)*, lumbar spinal mobility (VIP = 1.76–), segmental pain of L4-L5 (VIP = 1.34+), and segmental pain of L5-S1 (VIP = 1.21+).
For the overall pain intensity (PainVASreg) (R2 = 0.06; Q2 = 0.03), the following variables were important: age (VIP = 1.78+), lumbar spinal mobility (VIP = 1.74–), segmental pain of L5-S1 (VIP = 1.48+), segmental pain of L4-L5 (VIP = 1.46+), hypomobility at L5-S1 (VIP = 1.38+), and hypomobility at L4-L5 (VIP = 1.04+).
The significant regression of spreading of pain (i.e., PainNosreg) identified the following significant regressors (R2 = 0.08; Q2 = 0.04): age (VIP = 1.82+), segmental pain of L4-L5 (VIP = 1.78+), lumbar spinal mobility (VIP = 1.63–), segmental pain of L5-S1 (VIP = 1.31+), hypomobility at L5-S1 (VIP = 1.22+), and hypomobility at L4-L5 (VIP = 1.09+).
3.2.2Longitudinal regression of DRI at follow-up using signs and age as regressors
The significant regression of DRI at follow-up identified the following variables as significant regressors (R2 = 0.09; Q2 = 0.07): age (VIP = 2.45+), lumbar spinal mobility (VIP = 1.77), segmental pain of L4-L5 (VIP = 1.34+), and lumbar lordosis (VIP = 1.25+).
3.3Summary of results
The main findings from the present study are listed below.
• Those who had segmental pain at L4-L5 and/or L5-S1 levels at baseline had significantly higher low back pain intensity at the eight-year follow-up than those without these signs.
• The decrease of low back pain intensity over eight years was larger for those with segmental pain than for those without segmental pain at baseline.
• Those who had segmental pain at baseline had significantly higher DRI at the eight-year follow-up than those without segmental pain.
• The most important signs in the longitudinal analyses of pain aspects and disability were generally lumbar spinal mobility and segmental pain of L4-L5 and L5-S1 together with age, but the explained variations were low (6–10%).
4Discussion
When this study was initiated in 1990, neck/shoulder pain and low back pain were major health problems and were associated with high sickness absence and disability pensions in the western world, including Sweden, [37, 38]. Unfortunately, these circumstances are generally still present. Furthermore, it has been increasingly evident that the recurrence rates for neck/shoulder and low back pain are high both in short- and long-term perspectives [39–41]. These and other circumstances, such as socioeconomic factors and suffering, taken together necessitate continued efforts to develop assessment procedures including analysis of risk for chronic pain development and effective guidelines for treatments [42]. Biomedical and/or biomechanical signs have not been useful with respect to predicting clinical course, but relatively few longitudinal studies have been published and the available studies have investigated various signs. Several of the signs investigated in this study showed significant relationships with pain and disability aspects after eight years.
Total lumbar sagittal mobility at baseline correlated negatively with DRI and pain intensities (in four out of six regions) at follow-up. We also noted significant negative correlations between this sign at baseline and aspects of spreading of pain at follow-up (i.e., PainVASreg and PainNosreg). A more mobile lumbar spine might lead to less strain in, at least, the lower part of the body. However, the posture aspect that was investigated (i.e., lumbar lordosis) had little importance in relation to other signs in the multivariate longitudinal analyses. Physiotherapists often regard posture as an important clinical variable and as an indication for therapy. With the exception of hyper-lordosis, no other posture deviation from normal showed significance vs. the follow-up parameters. In the baseline study, only “hypercurvatures” showed a slight increase in one out of 14 DRI items [2]. Hence, our results taken together do not support focusing on posture in the clinical assessment.
General hyper-mobility/joint laxity (i.e., Beighton score) at baseline did not show significant correlations with pain aspects or disability after eight years. This finding agrees with the cross-sectional analyses at baseline, which did not identify a significant correlation between this sign and DRI [2]. Our results from this cohort of homecare personnel, unlike an earlier questionnaire-based study, found a significant correlation between hypermobility and chronic widespread pain in the population [43]. The earlier study, however, did not clinically assess the signs and the drop-out rate was high (72%).
Segmental hypermobility of the L4-L5 segment at baseline was associated with a higher low back pain intensity at follow-up (Table 4). The same pattern was observed at baseline (Fig. 1). At baseline, the pattern visavi pain intensity of the low back was the same at level L5-S1, but that significant difference had disappeared at follow-up where at baseline normal and hypermobile L5-S1 segments showed approximately equal low back pain intensity levels (Table 4). One possible reason for this discrepancy between the two levels may be related to intervertebral disc degeneration. The disc degeneration generally starts at the lowest level [44] and may therefore to a greater extent have “stabilized” L5-S1 in comparison to the L4-L5 level at follow-up. Hypo-mobility of the L5-S1 segment was associated with significantly higher DRI at follow-up than normal and hyper mobility of this segment (Table 5). Although hypomobility at L5-S1 did not significantly correlate with low back pain at follow-up, it as well as disability did significantly correlate at baseline (Fig. 2).
Segmental pain provocation of L4-L5 and L5- S1 segments was related to significantly higher pain levels at follow-up regarding most anatomical regions especially for the low back (Table 6). The same pattern was seen at baseline [2]. Interestingly, the differences in the low back pain intensity between those with segmental pain and those without had lessened markedly during the eight-year follow-up period, even if the difference was still significant. Segmental pain at baseline also related to significantly higher DRI at follow-up (Table 7). The findings in this paper indicate that segmental pain provocation in the lower lumbar spine not only relates to the patient’s actual pain but also is associated with low back pain intensity and disability eight years later. The diminished difference in low back pain intensity between those with and without segmental pain indicates that even those with segmental provocation pain at baseline can improve in the longer time perspective. Aging may have contributed to this finding but other factors such as changes in the work environment for those with severe pain at baseline may have influenced this finding. For this cohort, we elsewhere have noted that DRI increases over time while pain intensity of the low back decreases over time [36], but these two variables show the same pattern versus segmental pain. To summarize, segmental pain in any of the two lowest lumbar segments seems to indicate long-term consequences with respect both to pain intensity and disability in this cohort of women.
The most important signs in the multivariate longitudinal analyses of pain and disability were lumbar spinal mobility and segmental pain at L4-L5 and L5-S1 levels together with age. Both for pain intensity and disability, a higher age at baseline was associated with a worse situation at follow-up. An age dependence has been reported in the literature both for pain and disability. For example, two systematic reviews – one on subacute pain and one on musculoskeletal pain – concluded that higher age is associated with higher disability although the literature is not in total agreement [45, 46]. Increases in pain with increasing age has also been reported [47]. These multivariate analyses concerning the signs mainly confirmed the traditional statistical analyses but also related the signs to each other with respect to the importance for pain and disability eight years later. These signs were the most important in the cross-sectional analyses of disability at baseline [2]. These multivariate longitudinal results concerning pain and disability may appear promising, but it must be pointed out the explained variations were low (6–10%).
Why were the explained variations low although significant? It is well-known that pain intensity varies both in short- and long-term perspectives [48–51], and in the present study pain intensity was registered on only two occasions, eight years apart. Thus, short-time fluctuations in pain intensity at follow-up may not be representative for the overall pain situation for certain individuals and this could result in lower explained variations. Moreover, this project did not investigate whether changes in pain intensities influence the ability to perform different work tasks. Although considerable proportions of those with pain in a cohort or a population will have chronic pain, some will be improved and cured while others will develop a pain condition; in the present cohort, 31% of those with low back pain changed their rating from baseline to follow-up (i.e., no pain at baseline but pain at follow-up and vice versa) [36]. Another aspect possibly contributing to the low explained variations concern the concept of signs. Wand and O'Connell concluded that several biomechanical signs have been described in patients with low back pain (e.g., less range of motion during functional tasks, asymmetry, and variability in performance) [52] and such signs can be categorized as compensatory, causative, neither, or both [53]. It is often assumed that they are causative [52]. Manual palpation of painful muscles is common in clinical practice and increased tenderness and pain are found compared to, for example, the contralateral side. This can be due to peripheral sensitization (primary hyperalgesia) but central alterations can also contribute to the clinical sign. Thus, the sign can be due to one or several mechanisms and the number of involved mechanisms may vary between subjects. There are a number of different explanations for the sign lumbar segmental instability such as disc degeneration, postoperative spinal fusion, trauma, and recurrent low back pain [54]. Hence, although a sign is reliable and valid in certain aspects, it can have different underlying causes and thereby may be associated with low predictive value and explain our results with low explained variations in the longitudinal analyses even though these were significant. Several of the present clinical signs are biomechanical and include subjective elements such as reporting pain or clinical judgments of the assessor. Wadell identified eight tests that successfully discriminated patients with low back pain from normal subjects and these tests were significantly related to self-reported disability: pelvic flexion, total flexion, total extension, lateral flexion, straight leg raising, spinal tenderness, bilateral straight leg raising, and sit-up. All these tests included many measures of current functional limitation rather than anatomic or structural impairment and raised questions about the physical basis of permanent disability due to chronic low back pain [21]. In a prospective study, the tests lacked predictive power in a comprehensive functional restoration program [55]. Another possibility is that the wrong signs have been investigated and signs reflecting central mechanisms ought to be focused on instead [52]. Brain-related factors registered using fMRI have been reported that clearly indicate the potential of identifying chronic patients [56] and chronic development (e.g., initially greater functional connectivity of nucleus accumbens with prefrontal cortex predicted pain persistence) [57]. Another alternative is that the signs need to be on a lower basic level (i.e., the molecular level). Identifying molecules using recent developments in proteomics and metabolomics may be necessary to identify valid signs with high predictive capacity [58, 59].
In the literature different types of long-time risk factors for low back pain aspects have been investigated. The risk factors investigated differ between the studies with partly different designs. In patients seeking help from a GP due to an episode of low back pain lasting less than two weeks who were followed-up for up to 12 months, the only relevant predictor of the prognosis was the global assessment made by the GP [60]. The importance of psychosocial screening and emotional distress for non-recovery at 12 months has been emphasised in another study [61]. Other authors have reported the importance of psychological and/or occupational factors for the prognosis of low back pain [62, 63]. In contrast, a prospective cohort study of a working population with a three-year follow-up reported that a mixture of pain characteristics, physical signs (i.e., flexion and rotation of the upper part of the body), and psychological and social factors increased the risk of recurrent low back pain [64]. One review noted that “[t]he most helpful components for predicting persistent disabling low back pain were maladaptive pain, coping behaviours, nonorganic signs, functional impairment, general health status, and presence of psychiatric comorbidities” [65]. Hence, it appears that subjective reports including psychological aspects perform better than more or less objective signs when it comes to predicting outcomes. However, it has been questioned how specific the psychological factors in fact are and it has been pointed out that it is unclear how they are connected to low back pain [66]. The importance of the psychological factors may be common across several different pain conditions while the investigated signs are less general. It has been suggested that low back pain is a heterogeneous condition and treatment results may significantly improve when clinically relevant syndromes are determined at baseline to guide treatment [67].
This study has certain shortcomings. We have investigated a female working population in one profession (homecare work). Although our prospective study includes a large number of cases (607 cases initially), uses a relatively long perspective (an eight-year follow-up), and had relatively few dropouts (13%), we still cannot judge the universal applicability of our findings. We see the need of further long-time studies of pain problems to define reliable instruments, including somatic signs, to indicate the likelihood of developing chronic pain and disability in order to focus on early interventions for the neediest patients. It would have been advantageous to also assess the signs at follow-up, but this was not possible due to economic constraints. Another limitation is that the follow-up was made more than 10 years ago and the results might not be representative for the present Swedish situation; i.e. work tasks and circumstances may have changed compared to the situations in 1997 and 2005.
5Conclusions
Segmental provocation pain in the lower lumbar spine and to some extent segmental mobility may be considered for inclusion in routine clinical assessments, as they appear to be prognostic for pain and disability. In addition, low back pain is not always benign and the symptoms may be long standing, but in a long-time perspective low back pain decreases in most cases. Future studies should investigate whether and to what extent such decreases in pain intensities are associated with increased ability to perform different work tasks. Physical diagnostic procedures ought to be additionally refined for the purpose to better diagnose subgroups of low back pain patients and to help estimate future prognosis. Chronic pain problems, regardless of what anatomic regions are involved, exist in a very complex milieu involving peripheral and central neurobiological factors, psychological factors, and social aspects. Hence, a “multivariate” approach in the assessment may be key to further progress.
Conflict of interest
None to report.
Notes
* The sign after the VIP value indicates the direction of the correlation.
Acknowledgments
We are very grateful for the valuable help of registered nurse Birgitta Carlsson.
References
[1] | Lundberg G , Gerdle B . The relationships between spinal sagittal configuration, joint mobility, general low back mobility and segmental mobility in female homecare personnel. Scand J Rehabil Med (1999) ;31: (4):197–206. |
[2] | Lundberg G , Gerdle B . Correlations between joint and spinal mobility, spinal sagittal configuration, segmental mobility,segmental pain, symptoms and disabilities in female homecare personnel. Scand J Rehabil Med (2000) ;32: (3):124–33. |
[3] | Lundberg G , Gerdle B . Tender point scores and their relations to signs of mobility, symptoms, and disability in female home care personnel and the prevalence of fibromyalgia syndrome. J Rheumatol (2002) ;29: (3):603–13. |
[4] | Brattberg G , Thorslund M , Wikman A . The prevalence of pain in a general population. The results of a postal survey in a county of Sweden. Pain (1989) ;37: (2):215–22. |
[5] | Andersson HI , Ejlertsson G , Leden I , Rosenberg C . Chronic pain ina geographically defined general population: Studies of differences in age, gender, social class, and pain localization. Clin J Pain (1993) ;9: (3):174–82. |
[6] | Gerdle B , Bjork J , Henriksson C , Bengtsson A . Prevalence of current and chronic pain and their influences upon work and healthcare-seeking: A population study. J Rheumatol (2004) ;31: (7):1399–406. |
[7] | Breivik H , Collett B , Ventafridda V , Cohen R , Gallacher D . Survey of chronic pain in Europe: Prevalence, impact on daily life, and treatment. Eur J Pain (2006) ;10: (4):287–333. |
[8] | SBU-rapport. Metoder f¨or behandling av l°angvarig sm¨arta. En systematisk litteratur¨oversikt. Stockholm: Statens beredning f¨or medicinsk utv¨ardering (SBU); 2006. Report No.: 177/1+2 Contract No.: ISBN 91-85413-08-9. |
[9] | Breivik H , Eisenberg E , O’Brien T , Openminds. The individual and societal burden of chronic pain in Europe: The case for strategic prioritisation and action to improve knowledge and availability of appropriate care. BMC Public Health (2013) ;13: :1229. |
[10] | Lalonde L , Choiniere M , Martin E , Berbiche D , Perreault S , Lussier D . Costs of moderate to severe chronic pain in primary care patients - a study of the ACCORD Program. J Pain Res (2014) ;7: :389–403. |
[11] | Neupane S , Nygard CH , Oakman J . Work-related determinants of multi-site musculoskeletal pain among employees in the health care sector. Work (2016) ;54: (3):689–97. |
[12] | Chen CK , Nizar AJ . Myofascial pain syndrome in chronic back pain patients. Korean J Pain (2011) ;24: (2):100–4. |
[13] | Hasselstrom J , Liu-Palmgren J , Rasjo-Wraak G . Prevalence of pain in general practice. Eur J Pain (2002) ;6: (5):375–85. |
[14] | Brulin C , Gerdle B , Granlund B , Hoog J , Knutson A , Sundelin G . Physical and psychosocial work-related risk factors associated with musculoskeletal symptoms among home care personnel. Scand JCaring Sci (1998) ;12: (2):104–10. |
[15] | Gerdle B , Brulin C , Elert J , Granlund B . Factors interacting with perceived work-related complaints in the musculoskeletal system among home care service personnel. An explorative multivariates tudy. Scand J Rehabil Med (1994) ;26: (2):51–8. |
[16] | Carneiro P , Martins J , Torres M . Musculoskeletal disorder risk assessment in home care nurses. Work (2015) ;51: (4):657–65. |
[17] | Swedish Work Environment Authority. Occupational Diseases and Occupational Accidents 2000 (Table 6: Reported occupational accidents per 1 000 employed by branch of industry (SNI), sex and age, 2000. Employees and selfemployed persons). (2000) . |
[18] | Choi SD , Brings K . Work-related musculoskeletal risks associated with nurses and nursing assistants handling overweight and obese patients: A literature review. Work (2015) ;53: (2):439–48. |
[19] | Miedema HS , Chorus AM , Wevers CW , van der Linden S . Chronicity of back problems during working life. Spine (Phila Pa 1976) (1998) ;23: (18):2021–8; discussion 8-9. |
[20] | Salminen JJ , Erkintalo M , Laine M , Pentti J . Low back pain in the young. A prospective three-year follow-up study of subjects withand without low back pain. Spine (Phila Pa 1976) (2101) ;20: (19):2101–7; discussion 8. |
[21] | Waddell G , Somerville D , Henderson I , Newton M . Objective clinical evaluation of physical impairment in chronic low back pain. Spine(Phila Pa 1976) (1992) ;17: (6):617–28. |
[22] | Kuorinka I , Jonsson B , Kilbom A , Vinterberg H , Biering-Sorensen F , Andersson G , et al. Standardised Nordic questionnaires for the analysis of musculoskeletal symptoms. Appl Ergon (1987) ;18: (3):233–7. |
[23] | Ohlen G , Spangfort E , Tingvall C . Measurement of spinal sagittal configuration and mobility with Debrunner’s kyphometer. Spine(Phila Pa 1976) (1989) ;14: (6):580–3. |
[24] | Beighton P , Solomon L , Soskolne CL . Articular mobility in an African population. Ann Rheum Dis (1973) ;32: (5):413–8. |
[25] | Carter C , Wilkinson J . Persistent Joint Laxity and Congenital Dislocation of the Hip. J Bone Joint Surg Br (1964) ;46: :40–5. |
[26] | Lundberg G , Gerdle B . The relationships between pain, disability,and health-related quality of life: An 8-year follow-up study of female home care personnel. Disabil Rehabil (2016) ;38: (3):235–44. |
[27] | WHO. International classification of functioning, disability andhealth (ICF). Geneva: World Health Organization; (2001) . |
[28] | Salen BA , Spangfort EV , Nygren AL , Nordemar R . The Disability Rating Index: An instrument for the assessment of disability inclinical settings. J Clin Epidemiol (1994) ;47: (12):1423–35. |
[29] | Merrick D , Sundelin G , Stalnacke BM . One-year follow-up of two different rehabilitation strategies for patients with chronic pain. J Rehabil Med (2012) ;44: (9):764–73. |
[30] | Sjostrom R , Asplund R , Alricsson M . Evaluation of a multidisciplinary rehabilitation program with emphasis on musculoskeletal disorders: A 5-year follow-up. Work (2013) ;45: (2):175–82. |
[31] | Persson E , Lexell J , Rivano-Fischer M , Eklund M . Occupational performance and factors associated with outcomes in patients participating in a musculoskeletal pain rehabilitation programme. J Rehabil Med (2014) ;46: (6):546–52. |
[32] | Parsons H , Bruce J , Achten J , Costa ML , Parsons NR . Measurement properties of the Disability Rating Index in patients undergoing hip replacement. Rheumatology (Oxford) (2015) ;54: (1):64–71. |
[33] | Pajediene E , Janusauskaite J , Samusyte G , Stasaitis K , Petrikonis K , Bileviciute-Ljungar I . Patterns of acute whiplash-associated disorder in the Lithuanian population after road traffic accidents. J Rehabil Med (2015) ;47: (1):52–7. |
[34] | Pólya G . Über den zentralen Grenzwertsatz der Wahrscheinlichkeitsrechnung und das Momentenproblem. Mathematische Zeitschrift (1920) ;8: :171–81. |
[35] | Eriksson L , Johansson E , Kettaneh-Wold N , Trygg J , Wikström C , Wold S . Multi- and Megavariate Data analysis; part I and II. 2 ed. Umeå: Umetrics AB; (2006) . |
[36] | Lundberg G , Gerdle B . The relationships between pain, disability, and health-related quality of life: An 8-year follow-up study offemale home care personnel. Disabil Rehabil (2015) 1–10. |
[37] | The Swedish Council on Technology Assessment in Health Care (SBU). Sjukskrivning - orsaker, konsekvenser och praxis. En systematisk litteratur¨oversikt; 2003. |
[38] | Nachemson AL . Spinal disorders. Overall impact on society and the need for orthopedic resources. Acta Orthop Scand Suppl (1991) ;241: :17–22. |
[39] | Linton SJ , Hellsing AL , Hallden K . A population-based study ofspinal pain among 35-45-year-old individuals. Prevalence, sickleave, and health care use. Spine (Phila Pa 1976) (1998) ;23: (13):1457–63. |
[40] | Skargren EI , Oberg BE . Predictive factors for 1-year outcome of low-back and neck pain in patients treated in primary care :Comparison between the treatment strategies chiropractic and physiotherapy. Pain (1998) ;77: (2):201–7. |
[41] | Hertzberg A . Prediction of cervical and low-back pain based onroutine school health examinations. A nine- to twelve-yearfollow-up study. Scand J Prim Health Care (1985) ;3: (4):247–53. |
[42] | Petit A , Mairiaux P , Desarmenien A , Meyer JP , Roquelaure Y . French good practice guidelines for management of the risk of low back pain among workers exposed to manual material handling: Hierarchical strategy of risk assessment of work situations. Work (2016) ;53: (4):845–50. |
[43] | Mulvey MR , Macfarlane GJ , Beasley M , Symmons DP , Lovell K , Keeley P , et al. Modest association of joint hypermobility with disabling and limiting musculoskeletal pain: Results from a large-scale general population-based survey. Arthritis Care Res (Hoboken) (2013) ;65: (8):1325–33. |
[44] | Kirkaldy-Willis WH , Wedge JH , Yong-Hing K , Reilly J . Pathology and pathogenesis of lumbar spondylosis and stenosis. Spine (Phila Pa 1976) (1978) ;3: (4):319–28. |
[45] | Mallen CD , Peat G , Thomas E , Dunn KM , Croft PR . Prognostic factors for musculoskeletal pain in primary care: A systematic review. BrJ Gen Pract (2007) ;57: (541):655–61. |
[46] | Valentin GH , Pilegaard MS , Vaegter HB , Rosendal M , Ortenblad L , Vaeggemose U , et al. Prognostic factors for disability and sick leave in patients with subacute non-malignant pain: A systematic review of cohort studies. BMJ Open (2016) ;6: (1):e007616. |
[47] | Manchikanti L , Singh V , Falco F , Benyamin R , Hirsch J . Epidemiology of low back pain in adults. Neuromodulation (2014) ;17: (Suppl 2):3–10. |
[48] | Axén I , Bergström G , Bodin L . Using few and scattered time points for analysis of a variable course of pain can be misleading: An example using weekly text message data. Spine J (2014) ;14: (8):1454–9. |
[49] | Axen I , Bodin L , Bergstrom G , Halasz L , Lange F , Lovgren PW , et al. Clustering patients on the basis of their individual course of low back pain over a six month period. BMC Musculoskelet Disord (2011) ;12: :99. |
[50] | Hirschfeld G , Zernikow B . Variability of “optimal” cut pointsfor mild, moderate, and severe pain: Neglected problems when comparing groups. Pain (2013) ;154: (1):154–9. |
[51] | Suri P , Rainville J , Fitzmaurice GM , Katz JN , Jamison RN , Martha J , et al. Acute low back pain is marked by variability: An internet-based pilot study. BMC Musculoskelet Disord (2011) ;12: :220. |
[52] | Wand BM , O’Connell NE . Chronic non-specific low back pain - sub-groups or a single mechanism? BMC Musculoskelet Disord (2008) ;9: :11. |
[53] | Moseley G , Hodges P . Chronic pain and motor control. In: Boyling J , Jull G , editors. Grieves Modern Manual Therapy. Edinburgh: Churchill Livingstone; (2004) . pp. 215–32. |
[54] | Alqarni AM , Schneiders AG , Hendrick PA . Clinical tests to diagnose lumbar segmental instability: A systematic review. J Orthop Sports Phys Ther (2011) ;41: (3):130–40. |
[55] | Polatin PB , Cox B , Gatchel RJ , Mayer TG . A prospective study of Waddell signs in patients with chronic low back pain. When they may not be predictive. Spine (1997) ;22: (14):1618–21. |
[56] | Callan D , Mills L , Nott C , England R , England S . A tool for classifying individuals with chronic back pain: Using multivariate pattern analysis with functional magnetic resonance imaging data. PLoS One. (2014) ;9: (6):e98007. |
[57] | Baliki M , Petre B , Torbey S , Herrmann K , Huang L , Schnitzer T , et al. Corticostriatal functional connectivity predicts transition tochronic back pain. Nat Neurosci (2012) ;15: (8):1117–9. |
[58] | Xie P , Liu B , Chen R , Yang B , Dong J , Rong L . Comparative analysis of serum proteomes: Identification of proteins associated with sciatica due to lumbar intervertebral disc herniation. Biomed Rep (2014) ;2: (5):693–8. |
[59] | Olausson P , Gerdle B , Ghafouri N , Larsson B , Ghafouri B . Identification of proteins from interstitium of trapezius musclein women with chronic myalgia using microdialysis in combination with proteomics. PLoS One (2013) , in press. |
[60] | Schiottz-Christensen B , Nielsen GL , Hansen VK , Schodt T , Sorensen HT , Olesen F . Long-term prognosis of acute low back pain in patients seen in general practice: A 1-year prospective follow-up study. Fam Pract (1999) ;16: (3):223–32. |
[61] | Grotle M , Brox JI , Glomsrod B , Lonn JH , Vollestad NK . Prognostic factors in first-time care seekers due to acute low back pain. Eur J Pain (2007) ;11: (3):290–8. |
[62] | Melloh M , Elfering A , Egli Presland C , Roeder C , Barz T , Rolli Salathe C , et al. Identification of prognostic factors for chronicity in patients with low back pain: A review of screening instruments. Int Orthop (2009) ;33: (2):301–13 . |
[63] | Lonnberg F , Pedersen PA , Siersma V . Early predictors of the long-term outcome of low back pain–results of a 22-year prospective cohort study. Fam Pract (2010) ;27: (6):609–14. |
[64] | van den Heuvel SG , Ariens GA , Boshuizen HC , Hoogendoorn WE , Bongers PM . Prognostic factors related to recurrent low-back pain and sickness absence. Scand J Work Environ Health (2004) ;30: (6):459–67. |
[65] | Chou R , Shekelle P . Will this patient develop persistent disabling low back pain? JAMA (2010) ;303: (13):1295–302. |
[66] | Indahl A . Low back pain: Diagnosis, treatment, and prognosis. Scand J Rheumatol (2004) ;33: (4):199–209 . |
[67] | Hall H , McIntosh G , Boyle C . Effectiveness of a low back pain classification system. Spine J (2009) ;9: (8):648–57. |


