
The risk of road traffic crashes for occupational drivers: A responsibility study with comparison to the general population
Abstract
BACKGROUND:
Road accidents are the leading type of work-related fatalities, but the impact of work-related travel on overall traffic safety has been scarcely studied.
OBJECTIVE:
The main objective of the present study was to assess drivers’ relative road accident risk between work-related and personal journeys.
METHODS:
A responsible/non-responsible case-control study was performed on a sample of 7,051 road accidents in France from the VOIESUR project. Logistic regression determined odds-ratios according to work-related versus personal travel, and identified risk factors for responsibility, specific to each of the two sub-groups.
RESULTS:
Drivers traveling on duty or commuting home were significantly less often responsible for accidents than drivers on personal journeys: OR = 0.75 [0.63; 0.89] and 0.65 [0.53; 0.80] respectively. Responsibility was significantly more frequent in commuting to versus from work: OR = 1.38 [1.06; 1.78]. Among on-duty drivers, professional passenger-transport drivers had the lowest risk of responsibility (OR = 0.25 [0.11; 0.58]), while those on temporary or work/study contracts and professional light goods vehicle drivers had the highest risk (OR = 11.64 [2.15; 62.94] and OR = 29.83 [5.19; 171.38] respectively). When driving under the influence of alcohol, risk of responsibility was higher in commuting home than in personal journeys.
CONCLUSION:
On-duty drivers showed lower risk of responsibility for an accident than other drivers. However, on-duty drivers on temporary or work/study contracts, who are usually not subject to specific regulations, showed higher risk, and should be the subject of particular attention regarding occupational risk prevention.
1Introduction
Road accidents leave some 1.35 million deaths worldwide each year. With an average rate of 27.5 deaths per 100,000, mortality is about three times higher in low-income countries as in high-income countries where the rate is 8.3 deaths per 100,000 inhabitants [1]. In France in 2019, road risk as estimated by the police was responsible for 56,016 injuries and 3,244 deaths at 30 days [2].
Road accidents are the main form of fatal work accident [3, 4]. In France, in 2019, road risk was responsible for 12% of fatal work accidents and 28% of occupational deaths if commuting journeys are included [5]: i.e., 1.48 deaths per 100,000 workers covered by the national health insurance system.
The impact of work-related travel on road safety as a whole has been little studied. According to the 2019 review by the French National Interministerial Road Safety Observatory (ONISR), 12% of road accident fatalities involved a heavy goods vehicle, and 38% of injuries involved at least one road user traveling for work [2]. These figures raise the question of the relative responsibility of on-duty drivers, and the advisability of targeting preventive measures on this category of road users.
Drivers traveling for work show specific features, some of which constitute known accident risk factors: longer time on the road [6–8], fatigue or lack of rest breaks [9], time pressure [4], demands from the hierarchy or from clients [6], distraction [10]. On the other hand, professional drivers have greater driving experience and training, with specific driving licenses for certain types of vehicle.
The main aim of the present study was to compare the relative risk of being responsible for a road accident in drivers driving to work, home from work or on duty versus drivers on personal journeys. The secondary objective was to identify responsibility risk factors specific to work-related contexts.
2Materials and methods
2.1Study data
The study data were taken from the VOIESUR (Vehicle-Occupant-Infrastructure Road-User Safety Studies project ANR11-VPTT-0007), which set up an information system based on analysis and meticulous coding of police reports, computerized and centralized by the TransPV agency, which provides insurance companies with police road accident reports [11–13]. When necessary, the data collection services provided important missing elements such as accident diagrams, vehicle photographs or injury assessments. This collection of information was based on injury or fatal accidents collected by the police for the year 2011 in metropolitan France (excluding overseas territories). The database included all fatal accidents recorded in France (accidents with at least one person killed on the spot or within 30 days), all non-fatal injury accidents recorded in the Rhone department (administrative area of 1.6 million inhabitants), and 1/20 (drawn at random) of the non-fatal injury accidents recorded in France (excluding the Rhone department). Consequently, the sampling weights applied were: 1 for all fatal accidents, 1 for non-fatal injury accidents in the Rhone department, 20 for non-fatal injury accidents outside the Rhone department. The database thus comprised 8,541 accidents, described in terms of more than 300 variables.
2.2Survey plan
A retrospective responsible/ non-responsible retrospective case-control study included all drivers involved in an injury or fatal accident, aged 18-65. Responsible drivers were considered cases, and non-responsible drivers were considered controls. To select a population representative of the working population, drivers who were retired or unemployed, or driving a vehicle on a trial basis or participating in a competition, going to or returning from a party, dance, concert, festival, or discotheque, were excluded.
2.3Study groups and risk factors
Four populations were distinguished:
1. drivers on personal journeys (going on or coming back from vacation, shopping, personal matters, leisure, touring, visits to family, friends or personal acquaintances, and journeys to or from school or university);
2. drivers on duty;
3. drivers commuting from home to work;
4. and drivers commuting home from work.
Study risk factors comprised:
• driver’s age, in 7 categories: 18-20, 21-25, 26-30, 31-40, 41-50, 51-60 and 61-65 years;
• driver’s gender;
• driver’s socio-occupational category: French national statistics institute (INSEE) level 1, or level-2 artisans, shopkeepers and business owners, or level-3 professional drivers;
• blood alcohol level at time of accident: positive if≥0.5 g/l;
• frequency of driving at the accident site;
• vehicle owner or not;
• type of vehicle.
Vehicles were classified in 10 categories:
• cycles: bicycles, electric bicycles, any other pedal vehicle;
• limited-speed motorcycles:<50cm3 2-wheelers, non-pedal cycles requiring helmet;
• scooters: rear-engine 2-wheelers without tank between the knees (motorized tricycles were counted as scooters);
• motorcycles:≥50cm3 front-engine 2-wheelers with tank between the knees;
• automobiles: registered as “private” or “company” cars under the French vehicle registration system;
• heavy utility vehicles: registered as utility vehicles < 3.5 metric tonnes, panel or window van with cab or double-cab chassis;
• light utility vehicles: registered as utility vehicles < 3.5 metric tonnes, with panel or window van chassis or pick-up;
• heavy goods vehicles: registered as lorry/truck≥3.5 metric tonnes;
• special/agricultural vehicles: registered as “special” or “agricultural”;
• buses and coaches: registered as “bus”, able to transport standing or seated passengers.
2.4Determination of responsibility and constitution of case and control groups
The underlying principle of responsibility studies as used here is to compare a group of drivers considered to have been responsible for an accident [14], due to directly causal action or inaction, versus a group of drivers involved in an accident for which they did not bear responsibility. The hypothesis is that the latter show characteristics similar to those of drivers not involved in any accident [12]. Road-user responsibility is not being used here in a legal sense. A person causing or contributing to an accident is deemed responsible due to an inappropriate maneuver, such as driving against the traffic, failure to respect a red light, obvious loss of control, etc.) or failure to act (braking too late, etc.). It is essential that responsibility be defined in terms of these actual behaviors, and not of their causes (e.g., fatigue, consumption of drugs or alcohol, etc.), otherwise the impact of such risk factors would be widely overestimated. Responsibility was determined by an expert panel based on all available evidence, including accident diagrams and comments by those involved and by the police. This provided a responsibility criterion that was both reliable (in the sense of “contributive”) and as objective as possible (i.e., based on facts).
The two comparison groups were based on 5 categories: 1- completely responsible; 2 –largely responsible; 3- partially responsible; 4- largely non-responsible; and 5- not at all responsible. The “Responsible” group comprised categories 1, 2 and 3. “Largely” and “partially” responsible drivers were included here because accidents frequently occur due to a combination of factors, the absence of any one of which would often have avoided the accident; in other words, the accident would not have happened if the driver had not done something that led the expert to hold them completely or partially responsible. The Responsible group thus comprised drivers who made a mistake considered necessary (even if not sufficient) for the accident to have occurred. On this approach, several drivers may all be deemed responsible in a single accident. The “Non-responsible” group comprised categories 4 and 5: drivers considered to be involved by bad luck, being in the wrong place at the wrong time. Based on this concept of “responsibility”, the study can be seen epidemiologically as a case-control study. The source population comprised all drivers using public roads or private roads open to the public, and both groups came from this source population, as they were involved in accidents meeting this inclusion criterion.
2.5Data imputation
Simple imputation of missing data was applied, using the MICE (Multivariate Imputations by Chained Equations) method [15]. This was mainly used to impute the type of journey, when unknown, using all relevant variables. Thus, variables imputed and used in the imputation model comprised: type of journey, driver’s occupational status, gender and socio-occupational category, being the owner of the vehicle or not, vehicle category, day of the week and time of accident, intended travel distance, distance actually traveled, frequency of driving at the accident site, accident occurring in an administrative area (Département) other than the driver’s home area, and vehicle categorized as “Special” (taxi, ambulance, fire-engine, police car, school bus, or dangerous goods transport vehicle).
2.6Statistical analysis
Statistical analyses used R software, version 3.2.4.
Sampling weighting was applied to each driver for all analyses: 1 for drivers involved in a fatal accident, and 20 for those involved in an injury accident.
We used the svyglm function of the R survey library to take into account the weighting of the data (1 for fatal accidents, 1 for non-fatal injury accidents in the Rhone department, 20 for non-fatal injury accidents outside the Rhone département) and thus obtain valid variances. The goodness of fit was tested using Cox & Snell’s pseudo-R squared (psrsq function).
Statistical tests were 2-tailed, with the significance threshold set at p < 0.05 and 95% confidence intervals were established. Logistic regression modeled responsibility according to type of journey; because our goal was to see whether certain risk factors for being responsible for an injury accident were statistically different by type of journey, we tested the (first-order) interactions between these factors and type of journey. The significance of each factor or interaction was tested by comparing the likelihoods of the nested models (with and without each factor or interaction).
3Results
3.1Type of journey
After application of exclusion criteria detailed in the survey plan paragraph, a total of 7,051 police reports were analyzed. After weighting, 69,352 drivers were involved in a fatal or injury accident in France in 2011. 1,631 (2.4%) had died within 30 days, 33,782 (49.2%) were injured, 33,211 (48.4%) were uninjured, and data were missing in 0.6% of cases.
Type of journey was known in 75.2% of cases, and imputed in the other 24.8%. After imputation, a majority of drivers (50.2%) were on personal journeys, 15.3% and 13.3% commuting to or from work respectively, and 21.1% traveling on duty.
3.2Road accident victims (Table 1)
Drivers involved in an accident while traveling home from work, to work from home or for personal purposes were relatively similar in terms of age, gender and socio-occupational category. Notable differences concerned a lower rate of artisans, shopkeepers and business owners commuting to work and of 18-20 year-old injured drivers traveling home from work, and a slightly higher rate of males on personal journeys.
Table 1
Characteristics of drivers involved in an accident according to type of journey (weighted population)
| Commuting to work | On-duty | Commuting home | Personal | |
| (N = 10,640) | (N = 14,628) | (N = 9,244) | (N = 34,840) | |
| Age (years) | ||||
| 18-20 | 662 (6.2%) | 411 (2.8%) | 396 (4.3%) | 2701 (7.8%) |
| 21-25 | 1,738 (16.3%) | 2,008 (13.7%) | 1,614 (17.5%) | 5,988 (17.2%) |
| 26-30 | 1,483 (13.9%) | 1,827 (12.5%) | 1,276 (13.8%) | 4,932 (14.2%) |
| 31-40 | 2,565 (24.1%) | 4,196 (28.7%) | 2,294 (24.8%) | 8,620 (24.7%) |
| 41-50 | 2,571 (24.2%) | 3,277 (22.4%) | 1,960 (21.2%) | 7,405 (21.3%) |
| 51-60 | 1,435(13.5%) | 2,447 (16.7%) | 1,496 (16.2%) | 4,401 (12.6%) |
| 60-65 | 186 (1.7%) | 462 (3.2%) | 208 (2.3%) | 793 (2.3%) |
| Gender | ||||
| Female | 3,402 (32.0%) | 1,569 (10.7%) | 2,859 (30.9%) | 9,246 (26.5%) |
| Male | 7,238 (68.0%) | 13,059 (89.3%) | 6,385 (69.1%) | 25,594 (73.5%) |
| Socio-occupational category | ||||
| Artisans | 85 (0.8%) | 420 (2.9%) | 270 (2.9%) | 974 (2.8%) |
| Shopkeepers | 116 (1.1%) | 432 (3.0%) | 286 (3.1%) | 784 (2.3%) |
| Business owners | 28 (0.3%) | 232 (1.6%) | 151 (1.6%) | 583 (1.7%) |
| Executive or higher intellectual professions | 1,779 (16.7%) | 1,255 (8.6%) | 1,407 (15.2%) | 5,044 (14.5%) |
| Middle-level professions | 2,544 (23.9%) | 1,658 (11.3%) | 1,820 (19.7%) | 7,250 (20.8%) |
| Office-workers | 2,347 (22.1%) | 1,986 (13.6%) | 2,320 (25.1%) | 8,223 (23.6%) |
| Manual workers | 2,226 (20.9%) | 1,403 (9.6%) | 2,056 (22.2%) | 6,853 (19.7%) |
| Professional drivers | 693 (6.5%) | 6,843 (46.8%) | 542 (5.9%) | 1,505 (4.3%) |
| Bus/coach | 0 (0.0%) | 817 (5.6%) | 22 (0.2%) | 0 (0.0%) |
| Special or agricultural vehicle | 0 (0.0%) | 61 (0.4%) | 1 (0.0%) | 0 (0.0%) |
| 2-wheelers | 223 (2.1%) | 701 (4.8%) | 83 (0.9%) | 470 (1.3%) |
| Light utility | 1 (0.0%) | 104 (0.7%) | 1 (0.0%) | 42 (0.1%) |
| Heavy goods | 28 (0.3%) | 2,946 (20.1%) | 51 (0.6%) | 27 (0.1%) |
| Trains or Tramcars | 0 (0.0%) | 146 (1.0%) | 1 (0.0%) | 0 (0.0%) |
| Others | 441 (4.1%) | 2,068 (14.1%) | 383 (4.1%) | 966 (2.8%) |
| Farmers | 85 (0.8%) | 243 (1.7%) | 94 (1.0%) | 466 (1.3%) |
| Temporary or study/work contract | 624 (5.9%) | 51 (0.4%) | 291 (3.2%) | 2,628 (7.5%) |
| Others | 113 (1.1%) | 105 (0.7%) | 7 (0.1%) | 530 (1.5%) |
| Type of vehicle | ||||
| Bicycle | 504 (4.7%) | 182 (1.2%) | 548 (5.9%) | 1,073 (3.1%) |
| Scooter | 183 (1.7%) | 40 (0.3%) | 61 (0.7%) | 478 (1.4%) |
| Scooter≤125cm3 | 1,139 (10.7%) | 1,207 (8.3%) | 1,120 (12.1%) | 2,924 (8.4%) |
| Scooter> 125cm3 | 182 (1.7%) | 180 (1.2%) | 245 (2.7%) | 457 (1.3%) |
| Motorcycle | 1,728 (16.2%) | 808 (5.5%) | 1,464 (15.8%) | 4,596 (13.2%) |
| Private/company car | 6,352 (59.7%) | 4,565 (31.2%) | 5,224 (56.5%) | 23,962 (68.8%) |
| Utility vehicle | 499 (4.7%) | 3,038 (20.8%) | 457 (4.9%) | 1,251 (3.6%) |
| Heavy utility | 117 (1.1%) | 935 (6.4%) | 127 (1.4%) | 414 (1.2%) |
| Light utility | 195 (1.8%) | 538 (3.7%) | 93 (1.0%) | 243 (0.7%) |
| Not specified | 187 (1.8%) | 1,525 (10.4%) | 235 (2.5%) | 568 (1.6%) |
| Heavy goods | 49 (0.5%) | 3,110 (21.3%) | 77 (0.8%) | 49 (0.1%) |
| Special/agricultural | 4 (0.0%) | 446 (3.1%) | 25 (0.3%) | 27 (0.1%) |
| Bus/coach | 0 (0.0%) | 840 (5.7%) | 22 (0.2%) | 0 (0.0%) |
| Train/tramcar | 0 (0.0%) | 151 (1.0%) | 1 (0.0%) | 1 (0.0%) |
| Other | 0 (0.0%) | 61 (0.5%) | 0 (0.0%) | 22 (0.1%) |
| Frequency of driving at accident site | ||||
| Daily | 9,711 (91.3%) | 2,794 (19.1%) | 8,083 (87.4%) | 4,457 (12.8%) |
| Several time weekly | 456 (4.3%) | 7,798 (53.3%) | 667 (7.2%) | 16,612 (47.7%) |
| Several time monthly | 282 (2.7%) | 3,060 (20.9%) | 166 (1.8%) | 7,658 (22.0%) |
| Less than once a month | 65 (0.6%) | 495 (3.4%) | 183 (2.0%) | 1,747 (5.0%) |
| Very rarely or first time | 126 (1.2%) | 481 (3.3%) | 145 (1.6%) | 4,366 (12.5%) |
| Vehicle owner | ||||
| Driver or spouse | 9,046 (85.0%) | 3,729 (25.5%) | 7,795 (84.3%) | 28,768 (82.6%) |
| Not driver or spouse | 1,594 (15.0%) | 10,899 (74.5%) | 1,449 (15.7%) | 6,072 (17.4%) |
| Blood alcohol test | ||||
| Negative | 10,240 (96.2%) | 14,351 (98.1%) | 8,915 (96.4%) | 30,506 (87.6%) |
| Positive (> 0.5 g/l) | 400 (3.8%) | 277 (1.9%) | 329 (3.6%) | 4,334 (12.4%) |
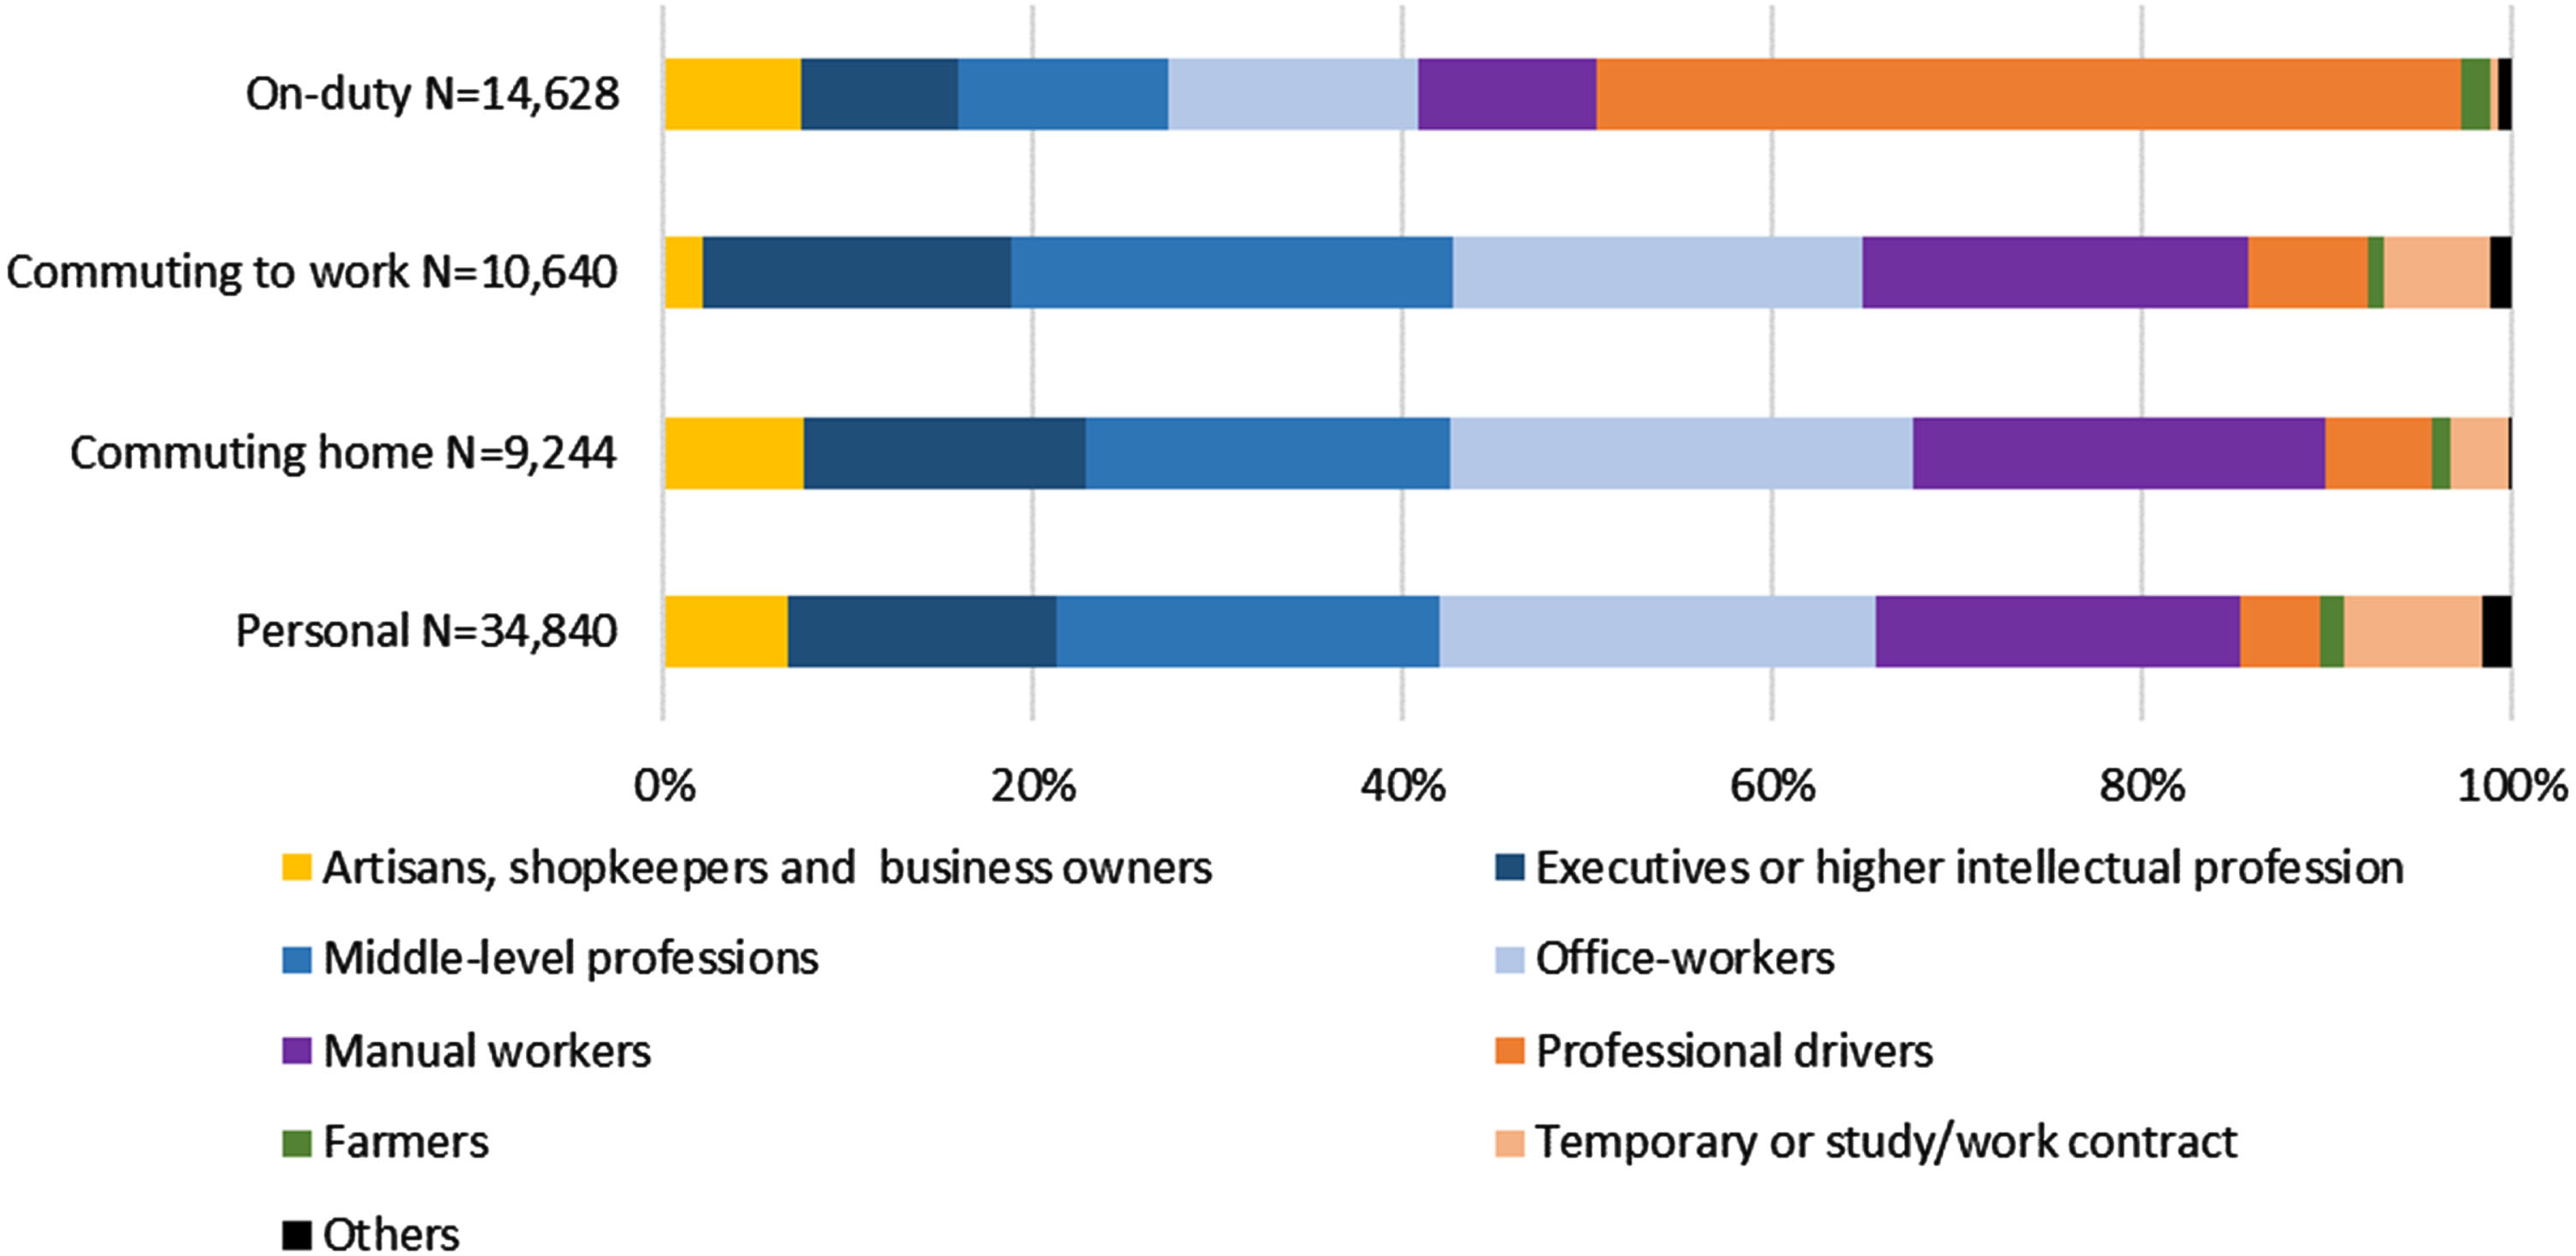
Drivers on duty differed in some respects from drivers on other types of journey, with higher rates of professional drivers and of males (p < 0.001) (Figure 1), and a lower rate of 18-25 year-olds than for drivers on personal journeys (p < 0.05).
Fig. 1
Occupational categories according to the type of journey, drivers involved in a fatal or injury accident in France in 2011.
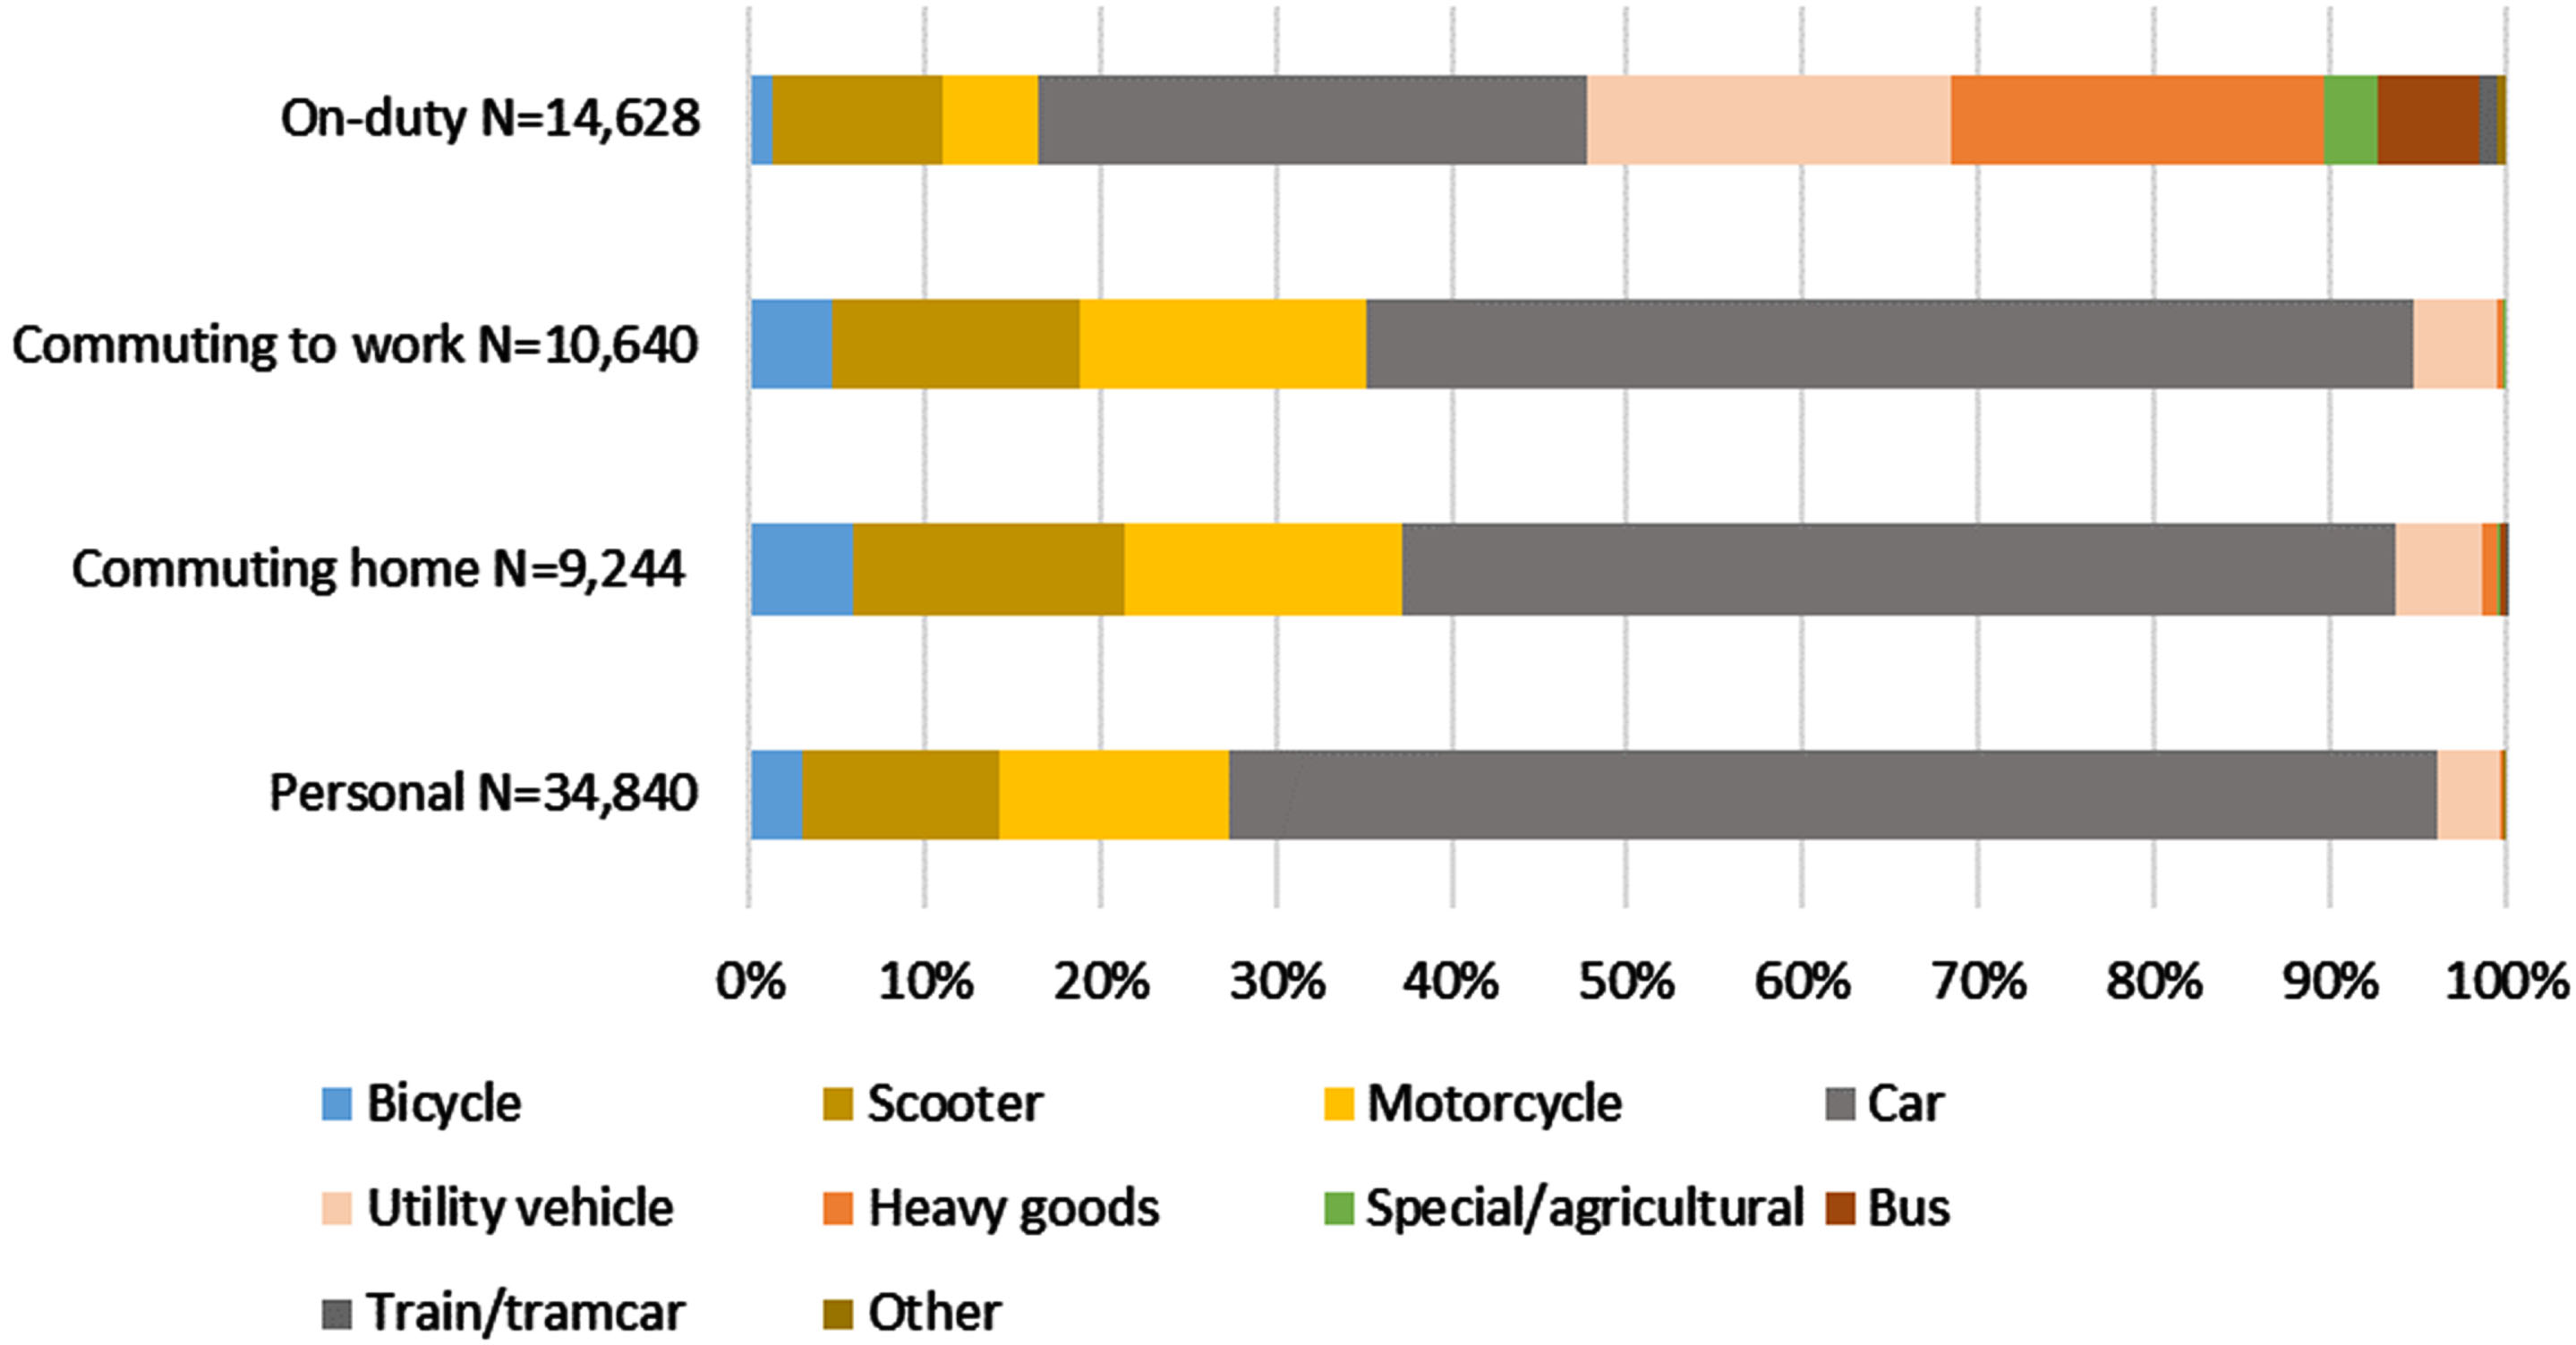
The vehicle involved in the accident was most often a private or company car, whatever the type of journey. Logically, on the other hand, occupational vehicles (utility, heavy goods, special or agricultural vehicles, buses/coaches and tramcars) figured more frequently in on-duty accidents than in other types of journey (Figure 2).
Fig. 2
Vehicle driven according to the type of journey, drivers involved in a fatal or injury accident in France in 2011.
Drivers on duty were those least often testing positive for alcohol, followed by those commuting to or from work. Drivers on personal journeys were more than 7 times more likely to test positive for alcohol (at≥0.5 g/l) than on-duty drivers (p < 0.001). On the other hand, blood alcohol level in alcohol-positive injured drivers did not significantly differ according to type of journey.
3.3Risk factors for being responsible for an injury or fatal accident
Responsibility was attributed in 97.3% of police reports, and about 80% of drivers were considered completely responsible (42.3%) or completely non-responsible (37.5%) by the experts. Responsibility was considered partial in only 5.8% of drivers.
Analysis of road accident responsibility risk according to type of journey revealed lower risk in on-duty drivers and drivers commuting home than in drivers on personal journeys (p < 0.001), the lowest risk being for journeys home from work (Table 2). After adjustment for gender and age, the difference remained significant (models 1 and 2). After adjustment for blood alcohol level, on the other hand, the protective effect of commuting home was lower and that of being on duty disappeared (model 3). After further adjustment on the frequency of driving at the accident site, the odds ratio between commuting home and personal journeys no longer differed significantly from 1 (model 4). However, there remained extra risk for commuting to versus from work (OR = 1.38 [1.06; 1.78], p = 0.015). Adjustment on the time of the accident was also tested; multivariate analysis including all the variables in model 3 plus time of accident did not significantly affect the results for commuting to or from work for on-duty driving: changes in OR for significant variables were less than 10%.
Table 2
Accident responsibility risk according to type of journey. Without adjustment; adjusted on age (model 1); adjusted on age and gender (model 2); adjusted on age, gender and alcohol test (model 3); and adjusted on age, gender, alcohol test and frequency of driving at accident site (model 4) (weighted population)
| OR | OR | OR | OR | OR | ||||||
| Univariate | Multivariate model 1 | Multivariate model 2 | Multivariate model 3 | Multivariate model 4 | ||||||
| Type of journey | ||||||||||
| Personal (= ref) | 1 | 1 | 1 | 1 | ||||||
| Commuting to work | 0.86 | [0.71;1.05] | 0.88 | [0.72; 1.07] | 0.89 | [0.73; 1.08] | 1.00 | [0.82; 1.23] | 1.20 | [0.93; 1.55] |
| On-duty | 0.75 | [0.63;0.89] | 0.79 | [0.66; 0.94] | 0.75 | [0.63; 0.90] | 0.90 | [0.75; 1.08] | 0.95 | [0.70; 1.14] |
| Commuting home | 0.65 | [0.53;0.80] | 0.66 | [0.53; 0.81] | 0.66 | [0.54; 0.82] | 0.73 | [0.59; 0.90] | 0.87 | [0.67; 1.13] |
| Age (years) | ||||||||||
| 18-20 | 2.34 | [1.70; 3.23] | 2.25 | [1.63; 3.10] | 2.17 | [1.57; 3.00] | 2.29 | [1.64; 3.20] | 2.28 | [1.63; 3.19] |
| 21-25 | 1.71 | [1.38; 2.12] | 1.70 | [1.38; 2.11] | 1.70 | [1.37; 2.10] | 1.76 | [1.41; 2.19] | 1.77 | [1.42; 2.21] |
| 26-30 | 1.28 | [1.03; 1.60] | 1.27 | [1.02; 1.59] | 1.27 | [1.02; 1.59] | 1.27 | [1.01; 1.60] | 1.24 | [0.99; 1.57] |
| 31-40 ( = ref) | 1 | 1 | 1 | 1 | 1 | |||||
| 41-50 | 1.16 | [0.96; 1.40] | 1.15 | [0.95; 1.40] | 1.16 | [0.95; 1.41] | 1.18 | [0.97; 1.44] | 1.18 | [0.96; 1.44] |
| 51-60 | 1.15 | [0.92; 1.43] | 1.16 | [0.93; 1.45] | 1.17 | [0.94; 1.46] | 1.23 | [0.98; 1.54] | 1.22 | [0.97; 1.53] |
| 60-65 | 1.46 | [0.92; 2.31] | 1.47 | [0.92; 2.34] | 1.47 | [0.92;2.35] | 1.51 | [0.94; 2.42] | 1.46 | [0.91; 2.35] |
| Gender | ||||||||||
| Female (= ref) | 1 | 1 | 1 | |||||||
| Male | 1.30 | [1.12; 1.52] | 1.20 | [1.11; 1.52] | 1.18 | [1.00; 1.38] | 1.16 | [0.99; 1.37] | ||
| Alcohol> 0.5 g/l | ||||||||||
| Negative ( = ref) | 1 | 1 | ||||||||
| Positive | 30.08 | [14.85;60.91] | 28.78 | [14.11; 58.70] | 29.66 | [14.54; 60.52] | ||||
| Frequency of driving at accident site | ||||||||||
| Daily | 1 | 1 | ||||||||
| Several time weekly | 1.23 | [1.05; 1.44] | 1.20 | [0.96; 1.48] | ||||||
| Several time monthly | 1.21 | [1.00; 1.48] | 1.17 | [0.91; 1.50] | ||||||
| Less than once a month | 0.91 | [0.63; 1.31] | 0.87 | [0.58; 1.30] | ||||||
| Very rarely or first time | 2.03 | [1.53; 2.69] | 2.05 | [1.48; 2.83] | ||||||
Model 4 tested each interaction between each risk factor and the type of journey. There was no significant interaction in the case of age, suggesting that age-linked risk is independent of type of journey. The impact of alcohol, on the other hand, differed according to type of journey, being significantly greater in commuting to work (“alcohol x commuting to work” interaction: OR = 6.77; p = 0.02) and in commuting home (“alcohol x commuting home” interaction: OR = 5.74; p = 0.02) than in personal journeys. Also, although the interaction between driving on duty and gender was not significant, being on duty nevertheless reduced the extra risk of male gender seen in other types of journey (“male x on-duty journey” interaction: OR = 0.61; p = 0.06). Finally, the impact of frequency of driving at the accident site differed according to type of journey. In the case of sites driven through less than once monthly, risk was greater when commuting to work than when on a personal journey (“site driven through less than once monthly x commuting to work” interaction: OR = 13.51 (p < 0.01); “site driven through very rarely or for the first time x commuting to work” interaction: OR > 50 (p < 0.01)).
Analysis by type of journey (Table 3) for on-duty drivers showed lower risk for bus and coach drivers (OR = 0.29 [0.14; 0.59]) and higher risk for light utility vehicle drivers (OR = 3.97 [1.42; 11.05]) than for private and company car drivers. Light utility vehicle drivers’ risk was especially high for professional drivers (OR = 29.83 [5.19; 171.38]). Risk was significantly higher for on-duty drivers on temporary or work/study contracts than for manual workers (OR = 11.64 [2.15; 62.94]). Multivariate analysis including all the variables in Table 3, plus age, did not significantly change results for commuting to or from work or on-duty driving; changes in OR for significant variables were less than 10%.
Finally, on-duty driver risk did not significantly differ between taxi, ambulance, fire engine, police vehicle, school transport and dangerous goods vehicle drivers versus drivers of other vehicles, with or without adjustment on age and gender.
Table 3
Accident responsibility risk according to type of vehicle, socio-occupational category, gender, alcohol test, frequency of driving at accident site, and vehicle ownership, for each type of journey, Univariate analysis (weighted population).
| Commuting to work | On-duty | Commuting home | Personal | |
| (responsible = 5,568 | (responsible = 7,250 | (responsible = 4,201 | (responsible = 19,481 | |
| not responsible | not responsible | not responsible | not responsible | |
| = 4,625) | = 6,917) | = 4655) | = 13,988) | |
| OR [95% CI] | OR [95% CI] | OR [95% CI] | OR [95% CI] | |
| Type of vehicle | ||||
| Bicycle | 1.58 [0.68; 3.67] | 1.04 [0.28; 3.90] | 0.53 [0.23; 1.21] | 0.45 [0.26; 0.79] |
| Scooter | 0.73 [0.20; 2.70] | 0.85 [0.05; 13.81] | 0.02 [0.00; 0.17] | 1.07 [0.47; 2.44] |
| Scooter≤125cm3 | 1.29 [0.73; 2.31] | 0.95 [0.53; 1.68] | 0.82 [0.46; 1.49] | 1.18 [0.82; 1.68] |
| Scooter> 125cm3 | 1.52 [0.36; 6.43] | 0.28 [0.06; 1.44] | 0.42 [0.12; 1.52] | 1.09 [0.46; 2.57] |
| Motorcycle | 1.04 [0.64; 1.68] | 0.90 [0.45; 1.80] | 1.17 [0.69; 1.98] | 0.68 [0.51; 0.90] |
| Private/company car (= ref) | 1 | 1 | 1 | 1 |
| Utility vehicle | ||||
| Heavy | 2.72 [0.52; 14.15] | 1.04 [0.28; 3.90] | 2.88 [0.66; 12.50] | 1.15 [0.48; 2.71] |
| Light | 1.71 [0.47; 6.18] | 3.97 [1.42; 11.05] | 11.18 [3.43; 36.43] | 1.14 [0.40; 3.85] |
| Not specified | 1.52 [0.38; 6.14] | 0 92 [0.54; 1 56] | 0.58 [0.17; 1.89] | 1.00 [0.46; 2.15] |
| Heavy goods | 0.06 [0.01; 0.31] | 0.94 [0.63; 1.38] | 1.17 [0.29; 4.73] | 0.68 [0.07; 6.94] |
| Special/agricultural | 1.79 [0.16; 20.02] | 0.52 [0.22; 1.25] | 7.72 [0.92; 65.01] | 2.85 [0.36; 22.54] |
| Bus/coach | – | 0.29 [0.14; 0.59] | – | – |
| Train/tramcar | – | 0.13 [0.02; 1.07] | – | – |
| Other | – | 0.56 [0.09; 3.37] | – | 14.24 [0.95; 214.43] |
| Socio-occupational category | ||||
| Artisans | 0.79 [0.12; 5.24] | 0.41 [0.15; 1.13] | 1.41 [0.45; 4.38] | 0.78 [0.42; 1.43] |
| Shopkeepers | 2.04 [0.41; 10.09] | 1.18 [0.44; 3.12] | 0.56 [0.19; 1.68] | 0.81 [0.42; 1.57] |
| Business owners | 0.21 [0.03; 1.55] | 1.05 [0.29; 3.74] | 1.27 [0.29; 5.56] | 0.70 [0.33; 1.52] |
| Executive or higher intellectual profession | 1.35 [0.76; 2.40] | 0.95 [0.48; 1.90] | 0.89 [0.48; 1.64] | 0.51 [0.37; 0.71] |
| Middle-level professions | 0.95 [0.57; 1.58] | 0.60 [0.32; 1.13] | 0.64 [0.36; 1.12] | 0.57 [0.42; 0.77] |
| Office-workers | 0.81 [0.48; 1.36] | 0.82 [0.44; 1.50] | 0.74 [0.43; 1.25] | 0.65 [0.48; 0.87] |
| Manual workers | 1 | 1 | 1 | 1 |
| Professional drivers | ||||
| Bus/coach | – | 0.25 [0.11; 0.58] | 0.00 [0.00; 0.00] | – |
| Special or agricultural vehicle | – | 43.65 [4.32; 440.75] | – | – |
| 2-wheeler | 0.95 [0.28; 3.27] | 0.65 [0.29; 1.47] | 2.86 [0.30; 27.79] | 0.78 [0.34; 1.80] |
| Light utility | – | 29.83 [5.19; 171.38] | – | 0.49 [0.03; 6.91] |
| Heavy goods | 0.09 [0.01; 0.67] | 0.81 [0.47; 1.41] | 0.32 [0.13; 0.77] | 0.04 [0.01; 0.35] |
| Train or Tramcar | – | 0.12 [0.01; 1.00] | – | – |
| Other | 0.57 [0.22; 1.45] | 0.95 [0.52; 1.74] | 0.92 [0.34; 2.48] | 0.46 [0.26; 0.82] |
| Farmers | 0.78 [0.12; 5.22] | 0.71 [0.21; 2.37] | 0.80 [0.14; 4.51] | 0.69 [0.30; 1.58] |
| Temporary or study/work contract | 0.67 [0.30; 1.48] | 11.64 [2.15; 62.94] | 0.89 [0.31; 2.54] | 0.86 [0.57; 1.32] |
| Other | 0.62 [0.12; 3.04] | 0.47 [0.08; 2.77] | 0.68 [0.15; 3.20] | 0.73 [0.33; 1.62] |
| Gender | ||||
| Female (= ref) | 1 | 1 | 1 | 1 |
| Male | 1.05 [0.73; 1.52] | 0.86 [0.54; 1.36] | 1.30 [0.88; 1.93] | 1.59 [1.28; 1.97] |
| Alcohol> 0.5 g/l | ||||
| Negative (= ref) | 1 | 1 | 1 | 1 |
| Positive | 149.06 [34.19; 649.85] | 159.37 [19.90; 1276.40] | 126.84 [36.76; 437.62] | 23.47 [11.14; 49.43] |
| Frequency of driving at accident site | ||||
| Daily | 1 | 1 | 1 | 1 |
| Several time weekly | 2.42 [1.01; 5.79] | 1.21 [0.82; 1.77] | 1.00 [0.51; 1.96] | 1.13 [0.84; 1.51] |
| Several time monthly | 0.59 [0.21; 1.67] | 1.38 [0.88; 2.17] | 1.36 [0.40; 4.62] | 1.06 [0.76; 1.47] |
| Less than once a month | 12.25 [2.13; 70.61] | 1.27 [0.56; 2.87] | 1.11 [0.29; 4.38] | 0.69 [0.42; 1.12] |
| Very rarely or first time | >50*** | 3.72 [1.53; 9.04] | 1.17 [0.25; 5.55] | 1.58 [1.08; 2.32] |
| Vehicle owner | ||||
| Driver or spouse | 1 | 1 | 1 | 1 |
| Not driver or spouse | 0.70 [0.43; 1.12] | 0.93 [0.66; 1.30] | 1.62 [0.97; 2.71] | 1.48 [1.14; 1.92] |
Note: Multivariate analysis including all the variables from table 3, plus age, did not significantly change results for commuting to or from work or on-duty driving; changes in OR for significant variables were less than 10%.
4Discussion
Accident risk analysis according to reasons for travel showed that drivers on personal journeys or commuting to work were more often responsible for the accident than those driving on duty or commuting home. The lowest risk for on-duty drivers concerned passenger transport (buses, coaches, trains and tramcars), and the highest concerned drivers on temporary or study/work contracts.
This lower risk in on-duty drivers seemed to involve several factors. Firstly, driving under the influence of alcohol was less prevalent, and alcohol is a major contributor to poor driving behavior and hence to responsibility for accidents [16]. Alcohol is known to be the substance that increases accident risk the most [7]; the present results confirm this, with an almost 30-fold greater risk in case of blood alcohol level exceeding 0.5 g/l. Secondly, experience may play a major role: an impact of experience on accident risk is reported elsewhere [6, 8]. Hours et al. found that risk per 100,000 km was inversely proportional to the number of kilometers driven in the year in question [8]. Within the present population, however, the protective effect of on-duty driving disappeared on simple adjustment for alcohol consumption, indicating that the lower risk in on-duty drivers was mainly due to the lower prevalence of driving under the influence of alcohol and to a moderate professional driving effect. Thirdly, the proportion of 18–25 year-olds was lower in on-duty than in personal driving, and this age group is associated with maximal risk; this may thus be a factor in the difference between on-duty drivers and others. Moreover, age is not merely correlated with driving experience, but seems to exert an effect in itself: young drivers tend to overestimate their skill, and show poorer perception of risk [18]. Older drivers are less often responsible for accidents [19]. The present results, however, suggest that the age effect is not enough to account for the lower risk observed in on-duty driving, which did not significantly change after adjustment on age. Fourthly, there was a greater proportion of males among on-duty drivers, and males show greater accident risk than females. The interaction between on-duty driving and gender, however, indicated that the gender effect on responsibility risk was lower in case of on-duty driving; moreover, the impact of on-duty driving did not significantly change after adjustment on gender. This was probably due to the extra risk associated with male gender being very likely related to higher alcohol consumption, which, however, was lower when driving on duty. Lastly, risk of responsibility for an accident while driving on duty varied according to type of vehicle. Passenger transport drivers (buses, coaches, trains and tramcars) showed lower risk, while drivers of special or agricultural vehicles, and especially light utility vehicle drivers, showed higher risk. This extra risk applied to persons who drove for a living, but without any specific driver’s license regulations: an ordinary license (“type B in the French driving license regulations”) is enough to drive a light utility vehicle, and agricultural workers require no driving license at all to drive a tractor.
There was thus considerable extra risk associated with temporary or study/work contracts, unchanged by adjustment on multiple factors and thus apparently free of confounding effects of age, gender, frequency of driving through the accident site, alcohol consumption or type of vehicle. Moreover, no such extra risk was seen in driving for non-duty purposes, which would seem to rule out any specific associated personality effect bearing on these drivers’ attitude –unless, that is, the specific personality manifestations vary with reasons for travel. This then raises issues of experience, working conditions and stress at work, which may be worsened with these less secure contracts [20].
The reasons for the lower risk associated with commuting home probably concern other factors than the two discussed above. Adjustment on age, gender and alcohol consumption had little effect on risk here, ruling out any important role for these factors. In the literature, three main groups of risk factor are distinguished: human, environmental and vehicle-related. In commuting home, the vehicle used and the environment can be presumed to be comparable to those when commuting to work, suggesting that it is human factors that are relevant. The differences to be expected are thus to be sought in terms of attention (distraction), vigilance or attitude. The most likely hypotheses regarding commuting to work concern either suboptimal vigilance due to driving too soon after waking up, increased stress and aggressiveness due to pressure to get to work on time, or greater use of distractors (cellphone personal organizer or e-mail functions, hair adjustment or make-up, etc.).
Finally, drivers commuting to or from work showed a greater impact of alcohol consumption on risk of responsibility for an accident. This is hard to explain, but may be due to workplace drinking by persons unused to alcohol and more susceptible to its effects.
To our knowledge, no previous studies focused on risk of responsibility for an accident according to type of journey. The strong point of the study lay in its being founded on a database representative of all road accidents in France over a full year. The VOIESUR database moreover includes expert assessment of the responsibility of each driver involved in the accident.
However, the study also had several limitations. For some items, there were up to 25% missing data. However, analyses were made taking account of this, and results suggest no significant biases or, especially, differentials. Moreover, missing data were imputed, so that all drivers involved in the accidents and meeting the inclusion criteria could be taken into account in the analyses.
Another limitation concerned expert attribution of responsibility, for which no standard written protocol exists. There may thus be some question as to the impact of certain factors, such as blood alcohol concentration, on attribution of responsibility. Here again, analyses were performed to screen for bias. In particular, a responsibility prediction model was constructed using an alcohol-negative population; applying this to the alcohol-positive population showed good prediction of the experts’ attributions, suggesting independence between factors such as alcohol level and expert attribution of responsibility. Moreover, the fact that about 80% of drivers were considered by the experts to be completely responsible or non-responsible suggests that the experts had a fairly clear idea of the concept of responsibility.
Finally, this kind of study raises two methodological questions. The first concerns the data available and their collection, which is not exhaustive, and possibly biased. Amoros et al. proposed improving data quality by means of correction coefficients [21, 22]; the method is robust as far as prevalences are concerned, but was not applied here due to possible uncertainties in more complex analyses. The second issue relates to risk analysis in terms of responsibility. The method assumes that drivers not responsible for the accident in which they were involved represent a random sample of the general driving population [14, 23, 24], which is strictly speaking impossible to confirm, as it would require data for drivers not involved in an accident at all but having the same exposure characteristics as those involved in an accident. In the absence of any such group, the control group used here comprised drivers involved in an accident for which they did not bear responsibility; the advantage of this was to have the same quality of information for both cases and controls.
Nevertheless, this study provides interesting knowledge regarding the prevention of road safety in the workplace. Indeed, as 38% of injuries involve drivers travelling for work, it is reasonable to question the responsibility of these drivers for the occurrence of accidents in order to better prevent them focusing on the user at higher risk. In this sense, the findings of this study suggest that prevention should target drivers of commercial vehicles and employees on temporary contracts for on duty journeys. Finally, the issue of commuting to and from work, which is considered an occupational risk in some countries, deserves to be better investigated in order to be the target of specific prevention measures.”
5Conclusion
The present study sheds new light on road risk associated with work-related journeys, with suggestions for preventive measures. Firstly, risk is greater commuting to than from work; further studies would be useful to assess the respective roles of distraction, time pressure and vigilance in these accidents.
When on duty, light utility drivers showed significant increased risk. Heavy goods vehicle drivers, on the other hand, who undergo extra training and aptitude testing, showed below-average risk. Temporary workers showed increased risk. These findings raise the question of the effect of occupational experience and training on work-related driving situations.
It would be of interest to study the temporal evolution of these results with the upcoming VOIESUR project that is expected to be implemented in the next few years.
Ethical approval
The study was approved by the Voiesur Project Authorization CNIL (No 1571622).
Informed consent
Not applicable. Data came from the coding of a police data collection. They are anonymous, but include many details about crash circumstances, responsibility of drivers involved, traffic violations and injury pattern.
Conflict of interest
The authors declare that they have no conflict of interest.
Acknowledgments
The authors would like to thank Marine Dufournet and Vivian Viallon for their advice on statistical analysis.
Funding
The study was supported by the Voiesur Project (ANR-11-VPTT-0007).
References
[1] | OMS Rapport de situation sur la sécurité routière dans le monde 2018 : résumé. [Internet]. Genève: Organisa tion mondiale de la Santé; (2018) 20 pp. Report No.: WHO/NMH/NVI/18.20. |
[2] | Salathé M , Pestour A , Defrance P La sécuritéroutière en France: Bilan de l’accidentalité de l’année[Internet], Paris: Observatoire national interministérielde la sécurité routière (2020) 201. |
[3] | Pratt SG , Bell JL . Analytical observational study of nonfatal motor vehicle collisions and incidents in a light-vehicle sales and service fleet, Accid Anal Prev (2019) ;129: :126–35. |
[4] | Pawar NM , Khanuja RK , Choudhary P , Velaga NR . Modellingbraking behaviour and accident probability ofdrivers under increasing time pressure conditions, Accid Anal Prev (2020) ;136: :105401. |
[5] | CNAMTS Rapport annuel L’assurance maladie –risquesprofessionnels, Elements statistiques et financiers. [Internet]. Paris: Caisse nationale de l’Assurance Maladie des travailleurssalariés; 2020. Available from: https://assurance-maladie.ameli.fr/sites/default/files/rapport_annuel__de_lassurance_maladie_-_risques_professionnels_decembre_pdf |
[6] | Fort E , Chiron M , Davezies P , Bergeret A , Charbotel B . Driving behaviors and on-duty road accidents: a French case-control study, Traffic Inj Prev (2013) ;14: (4):353–9. |
[7] | Charbotel B , Martin JL , Chiron M . Work-related versus non-work-related road accidents, developments in the last decade in France, Accid Anal Prev (2010) ;42: (2):604–11. |
[8] | Hours M , Fort E , Charbotel B , Chiron M . Jobs at risk of work-relatedroad crashes: An analysis of the casualties from the Rhone RoadTrauma Registry (France), Saf Sci (2011) ;49: (8-9):1270–6. |
[9] | Menéndez C , Socias-Morales C , Konda S , Ridenour M . Individual,business-related, and work environment factors associated withdriving tired among taxi drivers in two metropolitan U, S. cities. JSafety Res (2019) ;70: :71–7. |
[10] | Collet C , Guillot A , Petit C . Phoning while driving II: a review of driving conditions influence, Ergonomics (2010) ;53: (5):602–16. |
[11] | Dubos N , Varin B , Bisson O . A Better Knowledge of Powered Two Wheelers Accidents, Transp Res Arena TRA (2016) ;14: :2274–83. |
[12] | Garcia C , Viallon V , Bouaoun L , Martin JL . Prediction of responsibility for drivers and riders involved in injury road crashes, J Safety Res (2019) ;70: :159–67. |
[13] | Wu D , Hours M , Martin JL . Risk factors for motorcycle loss-of-control crashes, Traffic Inj Prev (2018) ;19: (4):433–9. |
[14] | Brubacher J , Chan H , Asbridge M . Culpability analysis is still a valuable technique, Int J Epidemiol (2014) ;43: (1):270–2. |
[15] | van Buuren S , Groothuis-Oudshoorn K . mice: Multivariate Imputation by Chained Equations in R, J Stat Softw (2011) ;45: (3):1–67. |
[16] | Martin JL , Gadegbeku B , Wu D , Viallon V , Laumon B . Cannabis, alcohol and fatal road accidents, PLOS ONE (2017) ;12: (11):1–16. |
[17] | Romano E , Torres-Saavedra P , Voas RB , Lacey JH . Drugs and Alcohol: Their Relative Crash Risk, J Stud Alcohol Drugs (2014) ;75: (1):56–64. |
[18] | Amado S , Aríkan E , Kaça G , Koyuncu M , Turkan BN . Howaccurately do drivers evaluate their own driving behavior? Anon-road observational study, Accid Anal Prev (2014) ;63: :65–73. |
[19] | Galéra C , Orriols L , M’Bailara K , Laborey M , Contrand B , Ribéreau-Gayon R , et al. Mind wandering and driving:responsibility case-control study, BMJ (2012) ;345: :e8105. |
[20] | Picchio M , van Ours JC . Temporary jobs and the severity of workplace accidents, J Safety Res (2017) ;61: :41–51. |
[21] | Amoros E , Martin JL , Lafont S , Laumon B . Actual incidences of road casualties, and their injury severity, modelled from police and hospital data, France, Eur J Public Health (2008) ;18: (4):360–5. |
[22] | Amoros E , Lardy A , Wu D , Viallon V , Martin JL Projet VOIESUR –Livrable L3 –Méthodologie: redressement et extrapolation,projet VOIESUR –ANR, [Rapport de recherche] IFSTTAR –InstitutFrançais des Sciences et Technologies desTransports, de l’Aménagement et desRéseaux. 2015;63 pp. Available from: https://hal.archives-ouvertes.fr/hal-01212490 |
[23] | afWåhlberg AE , Dorn L . Culpable versus non-culpable trafficaccidents; what is wrong with this picture? J Safety Res (2007) ;38: (4):453–9. |
[24] | Cooper PJ , Meckle W , Andersen L . The efficiency of using non-culpable crash-claim involvements from insurance data as a means of estimating travel exposure for road user sub-groups, J Safety Res (2010) ;41: (2):129–36. |


