
Eye discomfort at close work in Portuguese university students: A comparative analysis between the pre-COVID and confinement period
Abstract
BACKGROUND:
Many individuals experience visual symptoms associated with near work. The level of discomfort appears to increase with the amount of digital screen use.
OBJECTIVE:
To study the eye discomfort with near tasks in university students in the pre-COVID period and in the period of confinement due to the pandemic.
METHODS:
Two independent samples of students, aged between 18 and 35 years, were used to assess symptomatic behaviour with the Convergence Insufficiency Symptom Survey (CISS) questionnaire. In the pre-COVID period the sample had 342 participants, 64.6% females and in the COVID period 322 students participated, 71.4% females. The study of differences was carried out by the Mann-Whitney U test. The interpretation of the statistical inference was performed for a significance level≤0.05.
RESULTS:
There was an increase in the number of symptomatic cases in the COVID period without statistical evidence of differences in the frequency of symptoms reported in the two periods. The dimensions “somatic sensations” and “cognitive performance” were the typology of symptoms that most contributed to visual complaints with near vision. There was a significantly different symptomatic behaviour between genders in the period of confinement (p = 0.001), worsening in females and improving in males.
CONCLUSION:
These findings suggest that females and males exposed to digital environments, over time, may exhibit different symptomatic behaviour. Our results suggest that boys adapt more quickly than girls. Factors that predispose to these changes, aetiology and potential intervention actions still need further study.
1Introduction
In recent decades, we have witnessed a digital revolution that has changed and continues to change our world and our lives. Currently, more than 4.57 billion people, 59% of the world population, use the Internet and according to recent estimates, these rates range between 39.3% (Africa) and 95% (North America) [1], being young adults who most drive the use of mobile devices [2]. As a result of the intensive use of new technologies, problems related to health and well-being of users have been described. Literature reports problems of a diverse nature, ranging from psychological and cognitive problems to social, educational, economic, visual and postural problems [3–8]. With regard to visual problems, internal symptoms related to the user’s focus and coordination effort between the two eyes and external symptoms more related to the ocular surface are frequently reported [5, 8–10]. Postural problems and complaints about neck pain are also considered precursors of eye changes and visual symptoms [7, 11].
Digital eye strain is a condition defined as the combination of one or more vision-related symptoms that result from prolonged use of a computer, tablet, or mobile phone [8, 12–14]. Subjects who spend two or more hours using mobile digital devices [15] or who use more than one device [13] are at higher risk of developing vision-related symptoms. Subjects with uncorrected refractive errors, contact lens wearers, people with a history of eye disease, and the female gender are at risk of developing more severe symptoms [9, 14, 15]. Students are considered an audience prone to reporting symptoms due to the abrupt increase in time spent in front of digital screens [12, 15].
The coronavirus 2019 (COVID-19) pandemic forced the home confinement of most of the population around the world, including children, adolescents and young adults who started to have classes taught in a virtual environment for several weeks [12, 13, 16]. This situation has forced people to stay at home and use digital devices for work, leisure, vocational and non-vocational tasks, and the excessive use of digital devices can have negative consequences for eyes, from the increase in symptoms of visual discomfort to an increased incidence of visual problems [12, 13, 17]. This affects especially young people, as a consequence not only of the excessive use of digital devices, but also the reduction of outdoor activity, potentiating a higher incidence and progression of myopia [16, 18].
Several studies have confirmed that during confinement, the time spent on digital devices was significantly longer than the period before home curfew [13, 15]. It is also verified that the number of mobile devices used is the largest risk factor associated with complaints related to digital eye strain and that age is a predictor of its incidence [5, 10]. Females also seem to be more likely to have symptoms [4, 6, 9, 13, 15].
The objective of this work was to evaluate the level of symptoms of visual discomfort associated with near tasks, in a sample of university students, through the Convergence Insufficiency Symptom Survey (CISS), studying which of the dimensions of this questionnaire (somatic sensations, impaired vision and cognitive performance) was the most affected. It was also intended to compare the level of symptoms in each of the defined dimensions, in two independent samples, one collected before the COVID-19 pandemic and the other collected during the confinement period.
Study hypothesis: Visual discomfort associated with near work activities in university students increased during the COVID-19 lockdown.
2Materials and methods
2.1Ethical considerations
The study was carried out within the scope of the project “Promotion of visual quality of life in students” and approved by the ethics committee of our university. All participants gave their consent to participate in the study. Data collection took place in two distinct phases: phase 1 - before the pandemic situation due to COVID-19; and phase 2 – during the period of the second confinement. In none of the phases personal data was required, nor was it possible to connect the collected data with academic records.
2.2Study participants
This is an observational cross-sectional study performed at a Portuguese university, divided in two stages. In the first stage, pre-COVID, 342 students participated and in the second stage, in the confinement period, a new group of 322 students was recruited. Sociodemographic data were collected (age and gender) and data regarding the use of spectacles or contact lenses.
2.3Inclusion and exclusion criteria
Inclusion criteria were being university students, aged between 18 and 35 years. Data from subjects who did not answer all the survey questions and from subjects who changed their optical correction less than two weeks before were excluded.
2.4CISS questionnaire
The tool used to study the level of symptoms of the participants was the Portuguese version of the CISS questionnaire adapted from the original developed by the Convergence Insufficiency Treatment Trial group (CITT) [19]. This questionnaire is organized in 15 items in a Likert frequency scale, ranging from 0 (never) to 4 (always) with a total score ranging from 0 to 60. The suggested cut-off point for the CISS score in the literature for classifying symptomatic adults is equal to or greater than 21 [20].
The frequency of symptoms of visual discomfort associated with near tasks and the analysis of each of the dimensions that constitute it, allows us to analyse certain conditions that interfere with visual performance in a more specific way. The D1 dimension – somatic sensations - includes 8 of 15 items (score ranging from 0 to 32), gives information regarding asthenopia and complaints regarding the ocular surface; D2 dimension – impaired vision - includes 3 of 15 items (score ranging from 0 to 12), gives information related to visual changes such as refractive errors, binocular coordination and focusing ability, which interfere with the quality of vision; and D3 dimension – cognitive performance - includes 4 of 15 items (score ranging from 0 to 16), can provide information about the influence of mental state, which interferes with visual performance [21].
2.5Procedure
The questionnaire was prepared on the “Google Forms” platform (Alphabet Inc., Mountain View, CA, USA) and distributed for students to their institutional email and social networks, to be filled in electronically. Data from the 1st phase of the study was collected during 2019. Phase 2 data was collected during the second confinement period in Portugal (was available during the month of March 2021). In the second evaluation, students were instructed not to fill the questionnaire in case they had filled it in 2019, in order to guarantee independent samples.
2.6Variables
The variables used in the study are the CISS total score in a first analysis, and in a second analysis the individual scores of each of the three dimensions that constitute the CISS questionnaire.
The score obtained either for the CISS questionnaire or for the dimensions that constitute it, was standardized to a response scale equivalent to that of each isolated item, that is, from 0 to 4, obtaining the standardized score for each variable (sCISS; sD1, sD2 and sD3).
The cut-off point corresponding to a score of 21, in the standardized scale for symptomatic adults, corresponds to a sCISS score of 1.4.
2.7Statistical analysis
A descriptive statistical analysis was carried out, characterizing the sample in the variables of interest, calculating means and standard deviations, both in the whole sample and in the various stratifications to which it was subjected.
Data distribution was analysed by the Kolmogorov-Smirnov test. Since data followed a non-normal distribution in all sample stratification groups, differences in symptom types were analysed by the Mann-Whitney U non–parametric test.
All results of the statistical inference tests were interpreted for a confidence level of 95%, that is, a significance level of 0.05 was used.
Statistical analyses was performed using data platform Statistical Package for the Social Sciences (SPSS) version 23 (IBM Corp., Armonk, NY, USA).
3Results
3.1Sample characterization
The number of eligible participants in the first phase of the study was 342 students, with a mean age of 21.5±2.7 (years). There was a participation of 64.6% of the female gender and 53.5% of the sample did not use any type of optical correction. In the second phase of the study, the sample size was 322 students, with a mean age of 21.3±2.7. This sample had a majority of females (71.4%) and eyeglasses or contact lens wearers (71%). Table 1 summarizes the characteristics of the participants in each of the study phases.
Table 1
Characteristics of the studied sample
| 1st phase | 2nd phase | |
| Sample dimension – N | 345 | 322 |
| Average age (SD) [years] | 21,5 (2,7) | 21,3 (2,7) |
| Gender distribution – N | ||
| Males | 122 | 92 |
| Females | 223 | 230 |
| Use of optical correction – N§ | ||
| Non wearers | 186 | 93 |
| Wearers (glasses or contact lenses) | 156 | 229 |
§Three missing cases (1st phase).
3.2Symptom level (CISS score)
Using a standardized threshold of 1.4, it was found that in the first phase of the study, 32.2% of the studied sample (111 cases) manifested to be symptomatic and in the second phase, there was a slight increase, with 37% of the sample (119 cases) being registered with a sCISS score≥1.4. However in both phases of the study, the average score was below 1.4, which did not reveal a clinical significant level of symptoms.
The descriptive statistics of sCISS score at each of the evaluation moments (Phase 1 and Phase 2), as well as the study of the differences between the two phases of the study, can be seen in Table 2. Its variation according to the gender is also registered. Analysing the data from the total sample, no statistical evidence was obtained to affirm that the level of symptoms of visual discomfort inferred by the CISS questionnaire was significantly different in the two evaluation periods (p = 0.235), however there were gender related differences (p = 0.002).
Table 2
sCISS score and inferential statistics (p-values)
| Phase 1 | Phase 2 | |||
| Average (SD) | K-S (p-value) | Average (SD) | K-S (p-value) | |
| Total sample | 1.17 (0.6) | 0.008 | 1.16 (0.8) | 0.001 |
| Gender | ||||
| Male | 1.14 (0.6) | 0.043 | 0.94 (0.8) | 0.001 |
| Female | 1.19 (0.6) | 0.022 | 1.26 (0.9) | <0.001 |
| M-W (p-value) | Phase 1 x Phase 2 | 0.235 | ||
| Male x Female | 0.002** | |||
| Phase 1: Male x Female | 0.384 | |||
| Phase 2: Male x Female | 0.001** | |||
| Male: Phase 1 x Phase 2 | 0.007** | |||
| Female: Phase 1 x Phase 2 | 0.875 | |||
SD: Standard deviation; K-S: Kolmogorov-Smirnov; M-W: Mann-Whitney U. *significant for a 0.05 level; **significant for a 0.01 level.
Observing the symptomatic score between genders in each of the phases, it was found that in phase 1 (before the pandemic), the symptom score between males and females did not differ significantly (p = 0.384), but in the period of confinement, the symptomatic level revealed differences between genders (p = 0.001), with females more symptomatic than males.
The symptomatic variation in males and in females who participated in this study shows a different behaviour between the two evaluation moments (Fig. 1), there was a statistically significant improvement among males (p = 0.007) and a worsening in females, but without statistical significance (p = 0.875) from the pre-COVID period to the confinement period (Table 2).
Fig. 1
Average score of sCISS symptoms, by gender, in the two evaluation moments.
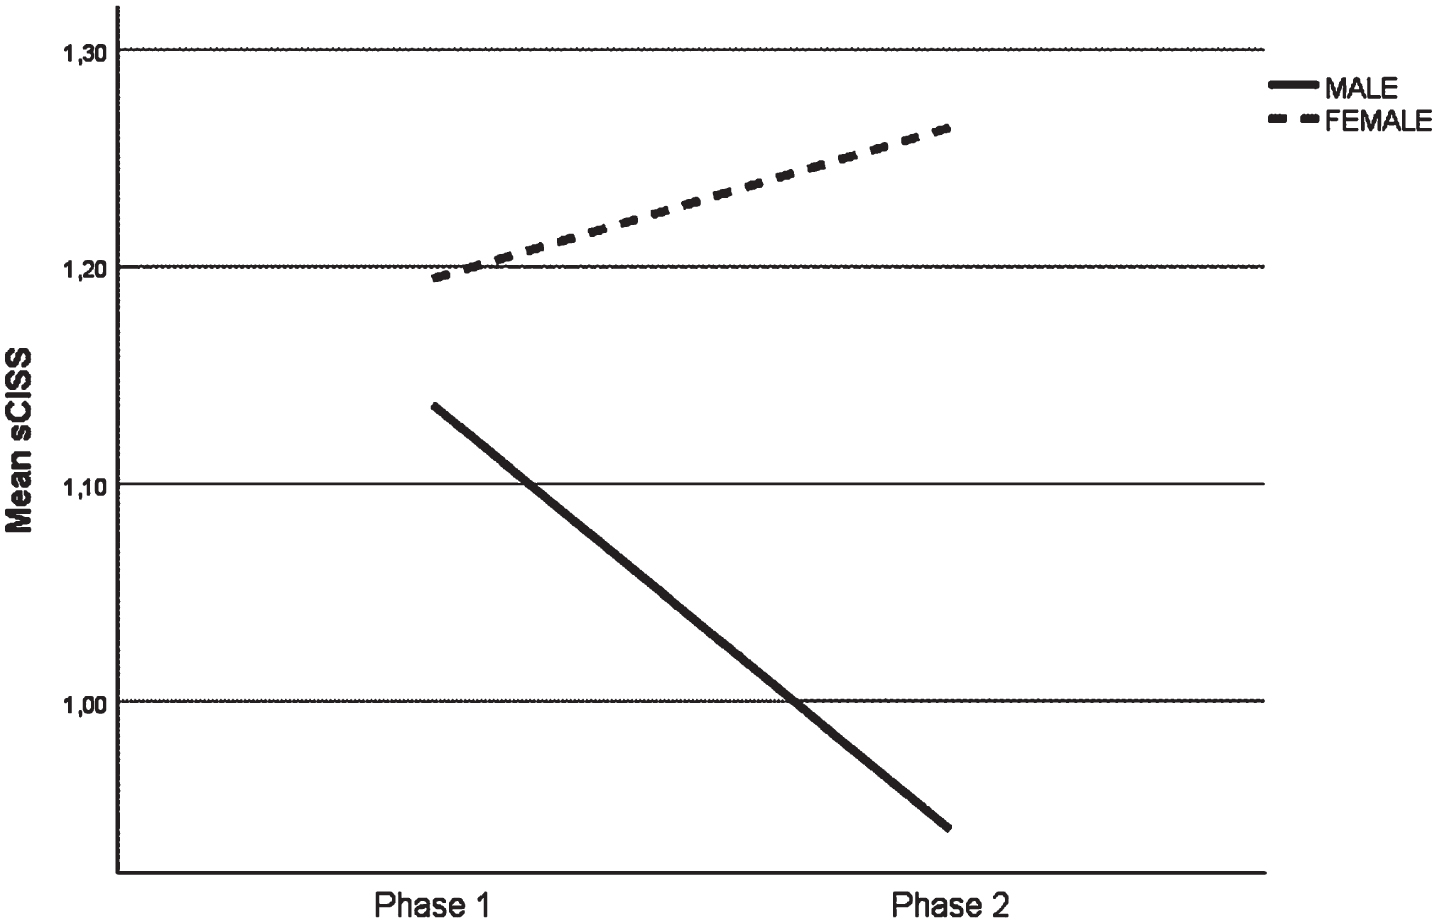
However in both phases of the study and for each gender, the average score was below 1.4, which did not reveal a clinical significant level of symptoms.
3.3Questionnaire analysis by dimensions
To verify which type of symptoms are more common among students and whether the observed aggravation or attenuation was more significant in any specific group of symptoms, the CISS questionnaire was analysed in its three-factor structure Fig. 2 illustrates the distribution of these variables in the two phases.
Fig. 2
Distribution of standardized scores of the questionnaire, in the two evaluation moments. CISS – total questionnaire; D1 – Dimension 1 (somatic sensations); D2 – Dimension 2 (impaired vision); D3 – Dimension 3 (cognitive performance).
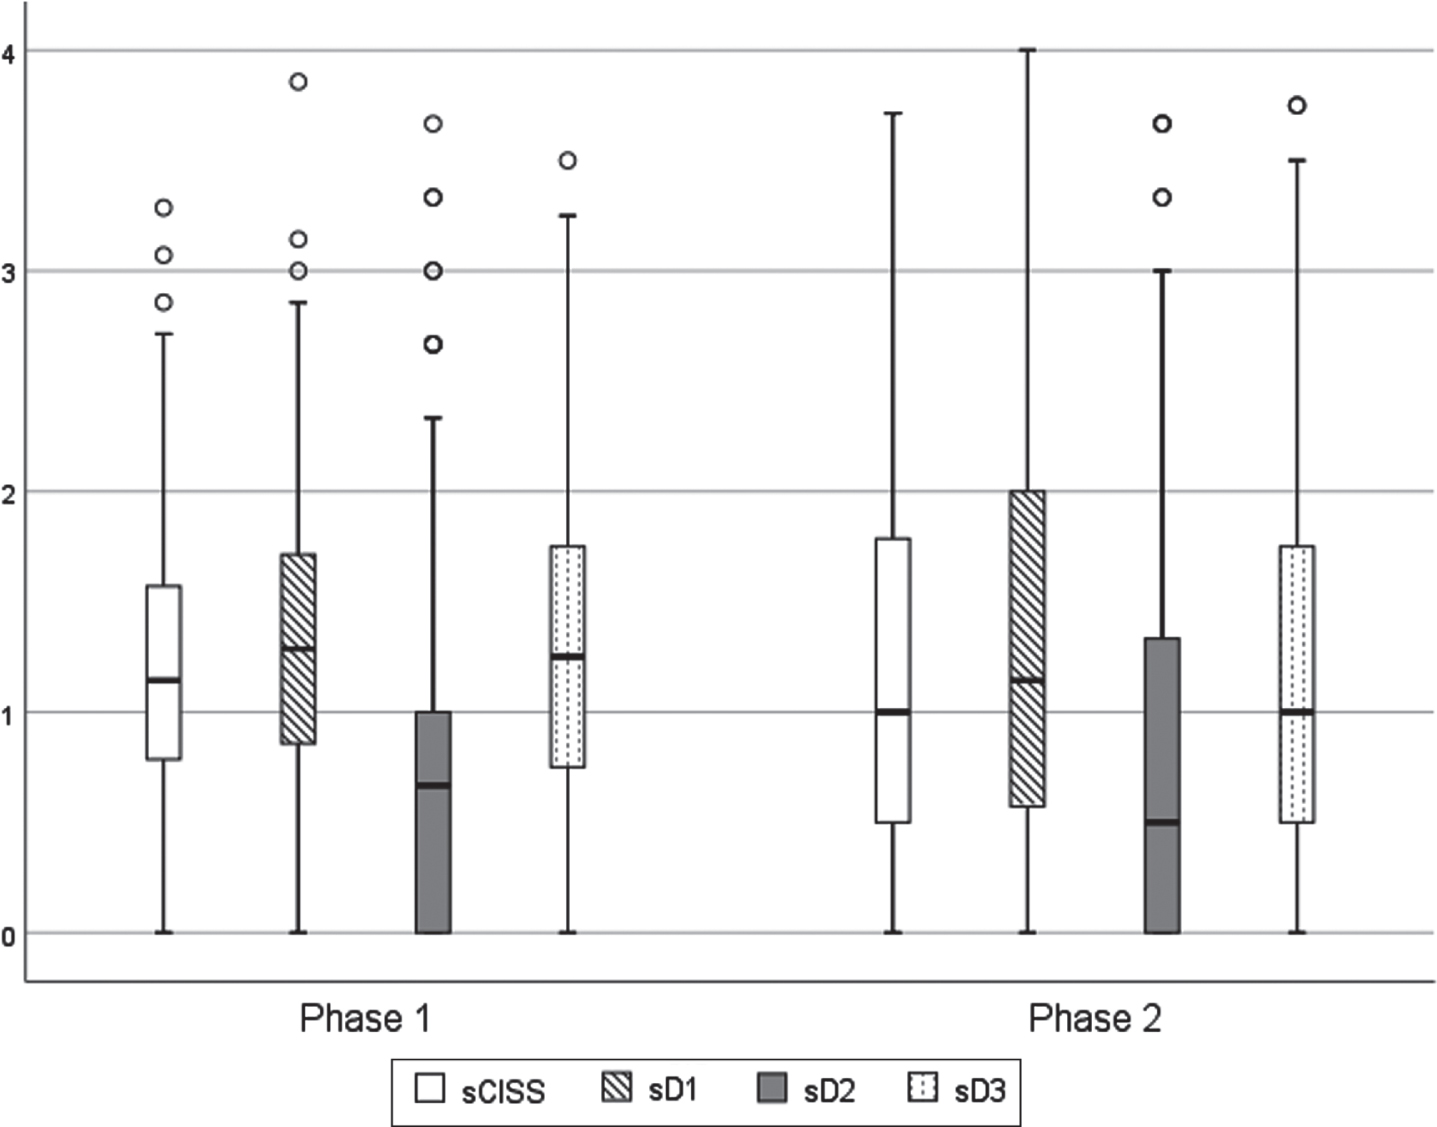
As can be seen, dimensions sD1 and sD3 were the ones that most contribute to the level of symptoms of visual discomfort, reported by students, with dimension sD2 being the one with the lowest score and this pattern was common in both moments of assessment (Table 3).
Table 3
Inferential statistics (p-value) for comparing the standardized scores of the three dimensions of the questionnaire, in the two evaluation moments, and the effect of the gender factor
| Phase 1 | Phase 2 | Mann-Whitney U (MW) | ||
| Average (SD) | Average (SD) | p-value | ||
| sD1 | Total sample | 1,33 (0,7) | 1,33 (0,9) | 0,498 |
| sD2 | 0,71 (0,7) | 0,79 (0,9) | 0,884 | |
| sD3 | 1,25 (0,7) | 1,18 (0,9) | 0,03* | |
| sD1 | Male | 1,24 (0,7) | 1,05 (0,9) | 0,027* |
| Female | 1,38 (0,7) | 1,45 (0,9) | 0,696 | |
| MWp-value | 0,064 | <0,001** | — | |
| sD2 | Male | 0,73 (0,8) | 0,62 (0,8) | 0,06 |
| Female | 0,70 (0,7) | 0,85 (0,9) | 0,309 | |
| MWp-value | 0,835 | 0,021* | — | |
| sD3 | Male | 1,26 (0,8) | 0,99 (0,8) | 0,006** |
| Female | 1,5 (0,7) | 1,25 (0,9) | 0,380 | |
| MWp-value | 0,863 | 0,025* | — |
*Significant for a 0,05 level; **significant for a 0,01 level.
Between the 2 phases of the study, small differences were observed both in the complete questionnaire (sCISS) and in the three dimensions that constitute it (sD1, sD2 and sD3), however a greater dispersion was observed in the second phase (Fig. 2). The study of differences shows that there were no statistical significance analysing the complete CISS questionnaire (sCISS), but statistically significant differences were observed in the D3 dimension (sD3) (p = 0.03) (Table 3). In both phases of the study, the average score for all dimensions was below 1.4, which did not reveal a clinical significant level of symptoms, as observed in the total score.
Fragmenting the sample by gender, for phase 1, no significant differences were found between males and females, for any of the dimensions, but significant differences were observed between genders, in phase 2, for all dimensions (sD1:p < 0.001; sD2:p = 0.021; sD3:p = 0.025). It should be noted that the greatest differences were found for the D1 dimension (somatic sensations) and in all dimensions females tend to be the most symptomatic group.
Comparing the differences between the two phases of the study, it appears that for dimension sD1, there were statistically significant differences only for males (p = 0,027), with a reduced level of symptoms in the 2nd phase (1,24±0,7 to 1,05±0,9). For dimension sD2 there were no significant differences. In the sD3 dimension significant differences were found only for males (p = 0.006), with a score improvement in the second phase.
Figure 3 graphically illustrates the interaction between the phase of study factor and the participant’s gender, for each of the symptomatic dimensions of the questionnaire.
Fig. 3
Standardized average score of dimensions D1, D2 and D3, by gender, in the two evaluation moments.
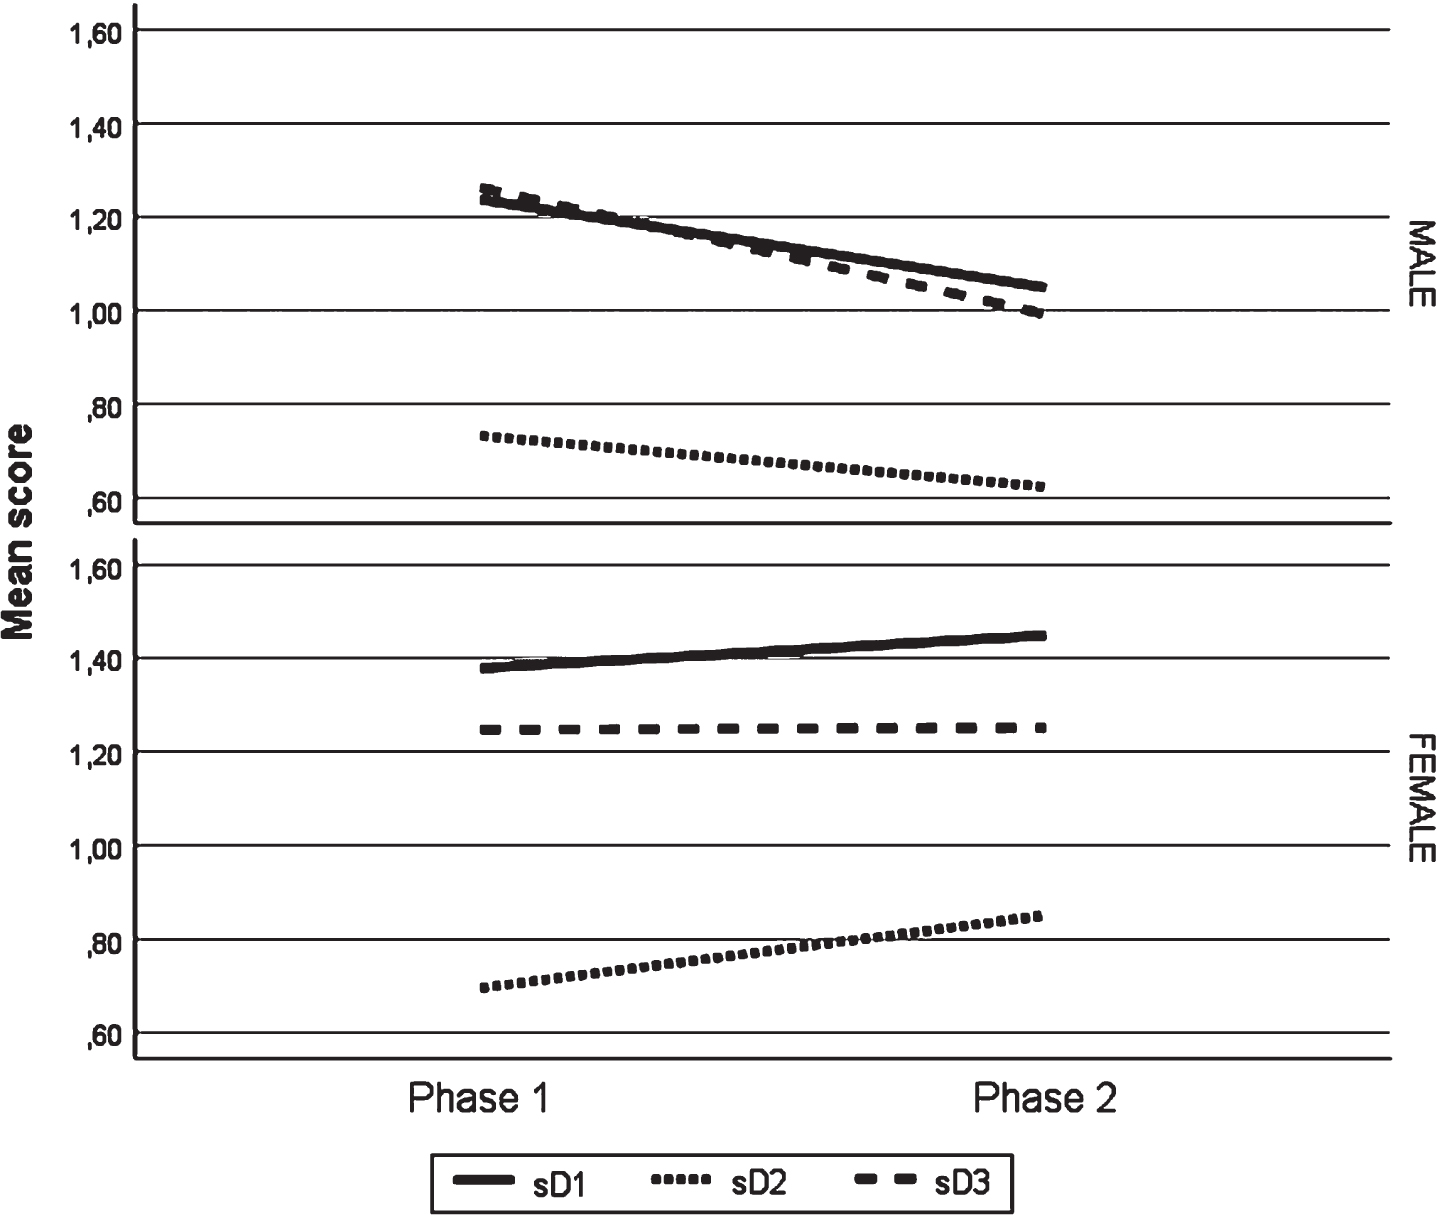
As can be seen, the symptomatic behaviour between males and females, in the two evaluation moments, was different. For males, dimensions D1 and D2 showed a reduction in symptoms in the second phase of the study and for females, an increase in symptoms for the same dimensions was observed. The D3 dimension, with symptoms related to cognitive performance, was the one that shows the most accentuated improvements among males, and for females it was the one with the least changes between the two moments under study.
In both phases of the study and for each gender, only D1 dimension for females presented an average score above 1.4, which showed a clinical significant level of symptoms.
4Discussion
The similarity between the level of symptoms obtained before the pandemic and during the period of confinement, detected in this investigation, did not meet what would be expected. The theory that the increase in the number of hours in a digital environment predisposes to an increase in symptoms has been studied and supported by several authors [5, 13, 15, 17]. In the present study, it was not possible to prove that during the second confinement period, university students reported symptoms of visual discomfort more frequently than before the COVID-19 pandemic, with the CISS questionnaire, and this finding suggests that university students may not effectively have been exposed to a change in digital habits as significant as other population groups. Scientific literature has reported that university students are a public that uses digital media with great intensity, both for academic support, as well as for leisure and social life, and this continued behaviour preceded the period of the current pandemic [5, 23, 24]. On the other hand, we should also hypothesize the existence of some adaptation mechanism, which is contributing to this effect, as it has already been described in other situations related to digital dependency, as time goes by, there is a decrease in the problems [25]. If there is any adaptation mechanism that leads to symptomatic reduction or a devaluation of these complaints, it is likely that it was registered in this research since the second phase of the study was carried out in the second confinement, that is, one year after the beginning of the pandemic situation. The results of other authors where there was a worsening in symptomatology [13, 15, 17], were studies carried out in the first confinement, so the changes in habits were still very recent at that time. Finally, studies on the effect on the visual discomfort of the isolation period due to the pandemic are based on retrospective data, using memory, with the questioning whether or not there was a worsening of symptoms compared to the period before the pandemic situation [13, 15, 26]. This aspect, as suggested by the authors themselves, may be biased, not only due to the inherent subjectivity of questionnaire research, but it may also be possible for participants to tend to exaggerate the complaints in the quarantine period, when asked to compare with the previous period. In the current study, the subjectivity factor of the answers inherent to the questionnaire is also present; however, the recall bias is less accentuated, since two independent samples were used for each of the analysis moments, without ever having asked to compare with another moment. This may also be a factor that is contributing to the achievement of less serious results than those reported by other authors.
Very recent studies have shown worsening of symptoms in students as a consequence of longer exposure to digital devices [27–29]. It should be noted that the typology of symptoms explored in these studies are more focused on symptoms related to dry eye and musculoskeletal complaints. The tool used in the present study, the CISS, does not include musculoskeletal complaints, but the D1 dimension includes complaints related to the ocular surface. Our results showed that this group of symptoms, despite not revealing significant differences between the pre- and post-COVID period, was the group with the highest level of complaints. The fact that an aggravation was not observed may be related to the design of the aforementioned studies, which assess the symptoms immediately after the use of digital devices. This fact suggests that eye strain-induced complaints may be only transient.
The observation of a higher level of symptoms in the D1 dimension, which includes asthenopia symptoms, and external symptoms of the ocular surface, is in line with what has been observed in other studies, where these symptoms are often associated with digital eye strain and conditions of dry eye and that are aggravated by the excessive use of digital devices [8–10, 12, 17]. The lowest level of complaints associated with impaired vision (D2 dimension) suggests that there are no refractive errors of significant magnitude to be corrected, and as subjects who changed the optical compensation recently were excluded from the present study, potential complaints related to refractive adaptation were excluded. Hence, small refractive magnitudes that may be uncorrected do not significantly manifest in this group of symptoms. Other authors have already argued that small uncorrected refractive errors are a frequent cause of asthenopia symptoms and these complaints are more felt in digital devices users [22].
Regarding the difference in symptomatic behaviour between males and females, it is in part a result that has already been observed in similar contexts. Excessive use of digital devices appears to have more negative consequences for females than for males, including an increase in visual complaints [4, 11] and reduced well-being [6, 30]. A curious fact of the present work was the level of similar symptoms between the two genders in the evaluations carried out before the pandemic, and the observation of significant differences in the period of confinement. This finding suggests that the adaptation to the new lifestyle is different between genders or may be a simple reflection of the adoption of different digital habits between males and females. The scientific literature reports that gender is a risk factor for the development of problems associated with the use of digital devices, in part due to different digital habits, with females spending more time on smartphones, on social networks or typing text messages, while males are more interested in games and electronic devices in general [6]. Another aspect that should also be considered concerns complaints related to dry eye, where many of them are common to digital eye strain [31]. Dry eye symptoms are more predictable in women than in men, probably due to hormonal issues [32], although other causes may also be associated with this difference such as make-up use, which can interfere with tear quality [33] and greater sensitivity to pain recorded in women [34]. The aforementioned authors may help to justify the differences found in this study between males and females, for example with regard to hormonal issues and greater sensitivity to pain. In the case of the use of make-up it seems less likely as the worsening of symptoms were observed during the period of confinement, time of social isolation, and therefore there is less probability of resorting to cosmetics with high frequency.
The differences between the 1st and 2nd phase of the study showed significant changes in the D1 dimension (somatic sensations) and D3 dimension (cognitive performance), with a record of improvements only for males (p = 0.027 andp = 0.006). The D2 dimension (impaired vision) did not reveal significant alterations. In all dimensions, it was observed that women had slightly higher symptom levels in the 2nd phase, but the differences in symptom scores were not statistically significant. Additionally, D1 Dimension for females was the only one presenting a clinical significance in symptom level (score > 1.4). The lack of data that allows us to better explore these findings, leads us to raise the hypothesis that there is a mechanism of adaptation to lifestyle, which in the long term translates into a symptomatic attenuation, and this adaptation, is more evident or faster on males. This assumption derives from the recording of other situations in the context of internet dependence, which show an improvement in follow-up studies [25], from the suggestions of authors who have also verified an adjustment to tasks arising from use of technologies, more effective in males than in females [35], and also the suggestion of other authors who advance the hypothesis of the existence of different mobile device usage thresholds, between men and women, with regard to the effect that they have in health and well-being [30]. Regarding the slight increase in symptoms of impaired vision in females, it may be a reflection of the increase in refractive changes. There was an increase in the use of optical correction between the two evaluation moments, of 45.6% in the first phase of the study, to 71.1% in the second phase of the study, and the percentage of females who participated in the research was higher than the percentage of males. Literature has reported that quarantines potentiate a higher incidence and progression of myopia [16, 18].
4.1Limitations
There are some limitations in this study, such as the lack of control for the effect of refractive errors and the type of correction used, which have been shown to have an effect on the symptoms of ocular discomfort [22, 36]. Another limitation of this research is the lack of clinical examinations, in order to signal visual conditions that contribute to some of these symptoms, such as changes in binocular coordination and focusing ability, and even signs of dry eye [9, 10, 12]. Also the larger proportion of female participants, may limit the study results. This aspect is frequently observed in other studies [8, 13, 25]. The main objective of the work was to investigate the impact of confinement, in a sample of students with online classes, on the symptomatology of visual discomfort associated with near vision. Taking advantage of the opportunity to use recently collected data, before the start of the pandemic situation, as data from a first phase, the second phase of this study was later designed to take place during a period of mandatory confinement,
Future work, controlling those aspects, as well as isolating contamination from issues related to dry eye complaints, will be needed. Follow-up studies that follow the symptomatic evolution, with prolonged exposure to the use of digital devices, with a view to observing behaviour between genders, should also be designed to better understand the issues related to potential symptomatic adaptation mechanisms and the identification of the threshold, either in the number of hours online, or in the perception of discomfort, for males and females. In addition, and due to the widespread use of smartphones at an earlier age, future studies covering different age groups should be designed.
5Conclusion
The results of this study revealed that the symptomatic differences in visual discomfort in university students between the pre-COVID and COVID-19 period did not show evidence of being statistically different. However, a different behaviour was found between males and females, recording a significant improvement of symptoms in males, for dimension D1 (somatic sensations) and D3 (cognitive performance). It was also observed that during the confinement phase, females were more symptomatic than males in all dimensions, but it was in dimension D1 (somatic sensations) where these differences were more significant. These results suggest that gender-specific action and intervention strategies in the field of visual health should be developed directed to tackle and reduce the effects of the “digital world” on ocular health.
Acknowledgments
The authors thank the Vision Sciences Clinical and Experimental Centre for the availability of the equipment used and the Mission Group in Optometry and Vision Sciences for encouraging this study.
Ethics approval
The study was performed in line with the principles of the Declaration of Helsinki. Approval was granted by the Ethics Committee of Beira Interior University (Pj-2019-043).
Informed consent
All participants provided their informed consent.
Conflict of interest
The authors declare that they have no conflict of interest.
Funding
The authors report no funding.
References
[1] | Hoehe MR , Thibaut F . Going digital: how technology use may influence human brains and behavior. Dialogues Clin Neurosci. (2020) ;22: (2):93. |
[2] | Crompton H , Burke D . The use of mobile learning in higher education: A systematic review. Computers & Education. (2018) ;123: :53–64. |
[3] | Elhai JD , Dvorak RD , Levine JC , Hall BJ . Problematic smartphone use: A conceptual overview and systematic review of relations with anxiety and depression psychopathology. J Affect Disord. (2017) ;207: :251–259. |
[4] | Portello JK , RosenfieldM, BababekovaY, EstradaJM, LeonA. Computer-related visual symptoms in office workers. Ophthalmic Physiol Opt. (2012) ;32: (5):375–382. |
[5] | Wang J , Li M , Zhu D , Cao Y . Smartphone overuse and visual impairment in children and young adults: systematic review and meta-analysis. J Med Internet Res. (2020) ;22: (12):e21923. doi: 10.2196/21923. |
[6] | Twenge JM , Martin GN . Gender differences in associations between digital media use and psychological well-being: Evidence from three large datasets. J Adolesc. (2020) ;79: :91–102. |
[7] | Rosenfield M , Li RT , Kirsch NT . A double-blind test of blue-blocking filters on symptoms of digital eye strain. Work. (2020) ;65: (2):343–348. |
[8] | İnalÖ, ArslanSS. Investigating the effect of smartphone addiction on musculoskeletal system problems and cognitive flexibility in university students. Work. (2021) ;68: (1):107–113. |
[9] | Sheppard AL , Wolffsohn JS . Digital eye strain: prevalence, measurement and amelioration. BMJ Open Ophthalmol. (2018) ;3: (1):e000146. |
[10] | Jaiswal S , Asper L , Long J , Lee A , Harrison K , Golebiowski B . Ocular and visual discomfort associated with smartphones, tablets and computers: what we do and do not know. Clin Exp Optom. (2019) ;102: (5):463–477. |
[11] | Sánchez-González MC , Gutiérrez-Sánchez E , Sánchez-González JM , Rebollo-Salas M , Ruiz-Molinero C , Jiménez-Rejano JJ , Pérez-Cabezas V . Visual system disorders and musculoskeletal neck complaints: a systematic review and meta-analysis. Ann N Y Acad Sci. (2019) ;1457(1):26–40. |
[12] | Napoli PE , Nioi M , Fossarello M . The “Quarantine Dry Eye”: The lockdown for coronavirus disease and its implications for ocular surface health. Risk Manag Healthc Policy. (2021) ;14: :1629–36. |
[13] | Alabdulkader B . Effect of digital device use during COVID-19 on digital eye strain. Clin Exp Optom. (2021) ;104: (6):698–704. DOI: 10.1080/08164622.2021.1878843. |
[14] | Coles-Brennan C , Sulley A , Young G . Management of digital eye strain. Clin Exp Optom. (2019) ;102: (1):18–29. |
[15] | Bahkir FA , Grandee SS . Impact of the COVID-19 lockdown on digital device-related ocular health. Indian J Ophthalmol. (2020) ;68: (11):2378–83. |
[16] | Wong CW , Tsai A , Jonas JB , Ohno MK , Chen J , Ang M , Tin DSW . Digital Screen Time During the COVID-19 Pandemic: Risk for a further myopia boom. Am J Ophthalmol. (2020) ;223: :333–337. |
[17] | Ganne P , Najeeb S , Chaitanya G , Sharma A , Krishnappa NC . Digital eye strain epidemic amid COVID-19 pandemic–a cross-sectional survey. Ophthalmic Epidemiology. (2021) ;28: (4):285–292. |
[18] | Liu J , Li B , Chen Q , Dang J . Student Health Implications of School Closures during the COVID-19 Pandemic: New Evidence on the Association of e-Learning, Outdoor Exercise, and Myopia. Healthcare. (2021) ;9: (5):500. https://doi.org/10.3390/healthcare9050500 |
[19] | Tavares C , Nunes AF , Nunes AS , PatoMV, MonteiroPL. Translation and validation of Convergence Insufficiency Symptom Survey (CISS) to Portuguese-psychometric results. Arq Bras Oftalmol. (2014) ;77: (1):21–24. |
[20] | Rouse MW , Borsting EJ , Lynn MG ,et al. Validity and reliability of the revised convergence insufficiency symptom survey in adults. Ophthalmic Physiol Opt. (2004) ;24: (5):384–390. |
[21] | Nunes AF , Monteiro PL , Nunes AS . Factor structure of the convergence insufficiency symptom survey questionnaire. Plos One. (2020) ;15.2: :e0229511. https://doi.org/10.1371/journal.pone.0229511 |
[22] | HeusP, VerbeekJH, TikkaC. Optical correction of refractive error for preventing and treating eye symptoms in computer users. Cochrane Database of Systematic Reviews. 2018;4:CD009877. https://doi.org/10.1002/14651858.CD009877.pub2 |
[23] | Henderson M , Selwyn N , Finger G , Aston R . Students’ everyday engagement with digital technology in university: exploring patterns of use and ‘usefulness’. J High Educ Policy Manag. (2015) ;37: (3):308–319. |
[24] | Wang P , Chiu DK , Ho KK , Lo P . Why read it on your mobile device? Change in reading habit of electronic magazines for university students. The Journal of Academic Librarianship. (2016) ;42: (6):664–669. |
[25] | Carbonell X , Chamarro A , Oberst U , Rodrigo B , Prades M . Problematic use of the internet and smartphones in university students: 2006–2017. Int J Environ Res Public Health. (2018) ;15: (3):475. https://doi.org/10.3390/ijerph15030475 |
[26] | Mon-López D , Bernardez-Vilaboa R , Fernandez-Balbuena AA , Sillero-Quintana M . The Influence of COVID-19 Isolation on Physical Activity Habits and Its Relationship with Convergence Insufficiency. Int J Environ Res Public Health. (2020) ;17: (20):7406. https://doi.org/10.3390/ijerph17207406 |
[27] | Sterczewska A , Wojtyniak A , Mrukwa-Kominek E . Ocular complaints from students during COVID-19 pandemic. Advances in Clinical and Experimental Medicine. (2022) ;31: (2):197–202. |
[28] | Chen AH , Rosli SA , Basri R , Hoe CYW . Investigation of Screen Time Inclination and the Accompanying Visual and Musculoskeletal Discomfort in Young Smartphone Users. Trends in Sciences. (2022) ;19: (2):1753–1753. |
[29] | Hashish A , Aly E , Baatiah NY , Bashaweeh AH , Kattan AM . The online learning experience and reported headaches associated with screen exposure time among Saudi health sciences students during the COVID-19 pandemic. BMC Medical Education. (2021) ;22: (1):1–13. |
[30] | Lachmann B , Sariyska R , Kannen C , Cooper A , Montag C . Life satisfaction and problematic Internet use: Evidence for gender specific effects. Psychiatry Research. (2016) ;238: :363–367. |
[31] | Mehra D , Galor A . Digital Screen Use and Dry Eye: A Review. Asia Pac J Ophthalmol. (2009) ;9: (6):491–497. |
[32] | Truong S , Cole N , Stapleton F , Golebiowski B . Sex hormones and the dry eye. Clin Exp Optom. (2014) ;97: (4):324–336. |
[33] | Ng A , Evans K , North RV , Jones L , Purslow C . Impact of eye cosmetics on the eye, adnexa, and ocular surface. Eye Contact Lens. (2016) ;42: (4):211–220. |
[34] | Li W , Lin MC . Sex Disparity in How Pain Sensitivity Influences Dry Eye Symptoms. Cornea. (2019) ;38: (10):1291–1298. |
[35] | Park C , Kim DG , Cho S , Han HJ . Adoption of multimedia technology for learning and gender difference. Comput Hum Behav. (2019) ;92: :288–296. |
[36] | Meyer D , Rickert M , Kollbaum P . Ocular symptoms associated with digital device use in contact lens and non-contact lens groups. Contact Lens and Anterior Eye. (2021) ;44: (1):42–50. |


