
Perceptions of work environment priorities: Are there any differences by company size? An ecological study
Abstract
BACKGROUND:
Earlier studies suggest that the quality of handling occupational health and safety (OHS) activities differs between companies of different sizes. Company size is a proxy variable for other variables affecting OHS performance.
OBJECTIVE:
The objective of this study was to investigate if there is an association between company size and perceptions of work environment prioritizations.
METHODS:
Data from 106 small- and medium-sized Swedish manufacturing companies was collected. One manager and one safety delegate at each company rated different aspects of their companies’ work environment prioritizations with a 43-item questionnaire. Ratings were aggregated to a summary statistic for each company before analysis.
RESULTS:
No significant differences in perceptions of priority were found to be associated with company sizes. This is in contrast to earlier studies of objective differences. The respondents in small companies, however, showed significantly greater consensus in their ratings.
CONCLUSIONS:
Company size does not appear to be associated with perceptions of work environment prioritizations. Company size is an important proxy variable to study in order to understand what factors enable and obstruct safe and healthy workplaces. The work presented here should be viewed as an initial exploration to serve as direction for future academic work.
1Introduction
Quality and extent of occupational health and safety (OHS) management vary between companies. Employers are, however, required to follow national legislation and associated regulations governing how a safe and healthy work environment should be systematically planned and implemented, for example, Swedishlegislation and regulations [1, 33], or American [29]. Hopefully, companies choose to meet the legislated requirements of a satisfying work environment. In addition, some companies choose to invest even further in their work environments by using workplace health promotion. In other words, different companies prioritize their work environments in different ways, and different aspects may also be emphasized. The “challenge of transforming workplaces into safe and healthy places to work” is acknowledged in a special issue in WORK [28]. A part of the challenge is to discover what factors enable companies to achieve health and safety for their employees, and on the contrary, what factors obstruct. Company size is a factor considered to impact companies’ OHS [2, 5, 19, 39]. In the present ecological study we discuss the role of company size further, with special focus on perceptions of the work environment at companies, with the aim of investigating if there is an association between company size and perceptions of work environment prioritizations.
1.1Literature review: Company sizes and differences in work environment efforts
It is not company size per se that is responsible for differences between companies, but rather other mediating variables, like organizational structure, management, and resources, that change when companies grow in size [4]. Company size is therefore an approximation, or proxy variable, for other variables affecting OHS performance. Øystein Saksvik, Torvatn, and Nytrø [42] point out that, though OHS is influenced by company size, it is the companies’ actual performance in terms of OHS management that is of interest.
Earlier studies have shown that OHS is poor in small companies compared to large companies [18, 35, 42]. Larger companies have a more developed internal control system for systematic OHS management [35, 42]. Small companies have poor OHS management [18]. The safety climate is better in larger companies compared to smaller [14, 24]. Companies with more than 100 employees are almost twice as likely to have implemented health promotional programs as companies with fewer than 100 employees [40]. At companies using solvent substances, the worker exposure to solvent vapor concentrations in the air is lower in larger companies [38]. In terms of vulnerability in the physical work environment, the least favorable work environments are found in small and privately owned enterprises [18]. In contrast, the psychosocial work environment is better in small firms than in large [18].
The OHS standard improves as company size increases. OHS management activity appears to gradually improve as there are increases in company size, resources, and incentives for OHS management [5]. The prevalence of workplace assessments increases respectively as the company size increases [34]. Wilson, Jr., and Koehn [39] suggest as a generalization that “emphasis on safety is proportionate to the size of the company.” It has previously been demonstrated that it is less common for small companies than for large companies to use formal practices. It is more common for small companies to use informal or non-systematic OHS systems than advanced ones [2]. Strategic management concepts based on large business conditions do not fit small companies very well [30], and formal practices are less frequent in smaller companies [12]. Companies spend about the same percentage of their turnover on internal projects regardless of company size, but being a small-sized company means undertaking small-sized projects and therefore being less likely to use project management and project management tools and techniques [37]. However, if small companies use formal practices, there are positive effects. Smaller companies that are subcontractors and affiliated with a large company, and which maintain a systematic OHS management with activities like health checkups, OHS committee meetings, and educational activities for OHS, have a worker health status not inferior to that of large companies [41].
Earlier studies have shown an inverse relationship between company size and injury frequency. The risk for occupational accidents is lower in large companies [31]. Injury occurrences are lower in larger building construction projects [20]. The injury frequency decreases as the company size increases [26]. The total number of accidents as well as the number of fatal accidents declines with the increase of company size, and there is an inverse relationship between the frequency of injuries and company size [11]. Smaller companies’ managers perceive that the main reason that large companies have fewer accidents is that they have better financial resources for safety, and more knowledge, since they can pay for full-time safety experts [32].
Larger companies tend to offer some employment advantages over small companies. Security against dismissal is strong in large companies, but declines correspondingly with a decrease in company size [13]. Paid training by the employer is more common as the size of the company increases [13]. Another difference related to company sizes is that the rate of absenteeism is lower in small companies [12]. It has also been shown that there are better opportunities to influence one’s own work situation in smaller companies than in large companies. The manager–employee relationship is better in small companies, and employees feel that they can influence the final decisions of managers [12]. Participation in decision-making is more common in smaller companies [13]. Employees in large companies experience less autonomy on the job [23]. Employees in small companies perceive greater job autonomy, job security, and organizational commitment as well as greater general well-being than employees in larger companies [12].
Previous studies have also demonstrated an inverse relationship between company size and job satisfaction.Lower levels of job satisfaction are found in larger companies and can be explained by inflexibilities in the structure of work [22]. Organizational size is inversely related to job satisfaction [4]. However, some factors do not appear to differ depending on company size. Intention to quit has not been found to differ between company sizes [15]. There is no difference between company sizes in how important human resource management is perceived to be [9]. For further reading, the situation for small companies’ OHS is well described in reviews by Mayhew [25] and Hasle and Limborg [19]. The main body of earlier studies demonstrates differences in work environment efforts between small and larger companies. However, the findings by Harms-Ringdahl et al.’s [17] do not align with this generalization. Rather, they indicate more similarities than differences between small and large companies when comparing variables of safety, health, and environment.
No earlier studies have explicitly investigated if there is an association between company size and perceptions of work environment prioritizations.
1.2Defining company sizes
A definition of company size set by the European Union divides companies into micro-, small-, and medium-sized enterprises (collectively termed SMEs) [6]. The main criterion for this definition is staff headcount, but balance sheet, and/or annual turnover is also used to classify a company to one of the size categories. The size categories are defined as follows: micro enterprise: staff <10, turnover < € 2 million, and/or balance sheet < € 2 million; small enterprise: staff <50, turnover < € 10 million, and/or balance sheet < € 10 million; medium-sized enterprise: staff <250, turnover < € 50 million, and/or balance sheet < € 43 million [6]. A large enterprise is then a company with more staff, turnover, and/or balance sheet than an SME. SMEs employ two-thirds of the European Union’s population and constitute 99% of the companies in the EU countries [10].
The examined studies under the previous heading were similar, in that they found differences attributed to company size. They differed, however, in the ways they defined company size as a variable in the analysis. Table 1 lists the examined studies with their definitions of company size. To define company size as number of employees was the most commonly used approach (27 out of 29 studies). One study used number of man-labor years as definition. One study used the contractors’ annual volume of business in dollars as the definition. Most commonly, the ordinal scale was used to measure company size (23 out of 29 studies). Three studies used ratio scales. Three studies did not specify scale of measurement.
For the present study, we used the definition of small- (10–49 employees) and medium-sized (50–249 employees) enterprises, and ordinal scale to measure company size [6].
1.3Objective
A previous study [27] on perceptions of work environment prioritizations demonstrated that those in professional roles within the organization have different views on how much their company prioritizes the work environment, whereby, within the same companies, managers believe that the work environment gets greater priority than the safety delegates believe. The present study analyzes the dataset from that earlier study, in relation to whether company size can be linked to perceptions of work environment prioritizations. The present study should be considered a pilot study in this aspect, to serve as an initial exploration of this objective. The objective of this study was to investigate if there is an association between company size and perceptions of work environment prioritizations.
2Methods
2.1Study population and sample
The study population was all small (10–49 employees) and medium-sized (50–249 employees) companies from a county in central Sweden engaging in manufacturing as their main industry (N = 210). These companies were selected with the help of the Swedish industry branch classification (SNI) from Statistics Sweden (which in turn is based on NACE, the European Union Classification), and a self-service credit-reporting bureau database (www.uc.se, 2008). It was possible to locate addresses and contact information of the companies in the study population by using the credit-reporting bureau database using selection criteria: main industry, number of employees, and geographical area. The companies (N = 210) were each sent two postal questionnaires in separate envelopes, one of which was to be answered by either the executive manager or the personnel manager of the company, which depended on the size of the company. The other envelope containing a questionnaire was addressed to the senior safety delegate or the safety delegate of the company, which depended on the size of thecompany.
Managers and safety delegates represent two different professional roles in Sweden that have particularly good insight into the work environment and occupational health and safety of their company, and who have direct or partial responsibility for the work environment. They are linked in cooperation when the work environment is managed, for example, when regular safety audits are conducted. The senior manager, or equivalent, is responsible for OHS and for ensuring that the work environment management is carried out systematically in the workplace, but can also delegate tasks to staff in the organization. Managers have been found to play a pivotal role in the safety performance of the workplace [16]. The safety delegate represents the employees on health and safety issues and is elected by the union members. By regulation, every workplace with more than five employees should have one or more safety delegates [33].
The two questionnaires sent to the companies were the same in every respect, since the main purpose was to get two answers from representatives of a company with direct or partial responsibility for the work environment management. Filled out questionnaires were returned in a response envelope which had been included when they were sent out. After two reminder letters and phone calls as reminders, returned questionnaires from both managers and safety delegates were received from 106 companies (50%), which were used for analysis. For the other 104 companies, no or incomplete pairs of answers were received. The response rate was what is to be expected according to previous studies with postal questionnaires [3, 7]. In a non-response analysis it was established that there were no systematic differences in size between the responding and the non-responding companies, and that they were proportionally distributed geographically among the ten municipalities in the county studied. We therefore believe that the results are representative for the study population county, and for companies with manufacturing as their main industry in similar counties.
2.2Data material
The material used in this study was collected using a 43-item questionnaire regarding the prioritizations of work environment factors at companies, during a few months around the turn of 2008–2009. The 43 items were designed to cover the overall aspects of occupational health and safety in work environments that companies have control over, not only aspects concerning legislative expectations. A review of scientific reference databases, gray literature, and legislation on work environment preceded the compiling of possible items to use in order to measure work environment prioritizations. No existing instrument was judged as satisfactory to use for the study aim. More information on the development of the questionnaire and procedure of the data collection have been described in Nordlöf et al. [27], where the questionnaire is included as an appendix. Prior to data collection the questionnaire was validated in a pilot to adjust for face validity, and the reliability of the index constructs were satisfactory, as checked by Cronbach’s alpha (range: 0.77–0.91).
The questions were answered with a horizontal visual analogue scale (VAS) with two endpoints. The VAS is considered to be relatively quick for respondents to handle [36]. The lower endpoint of the scale was labeled no priority whatsoever (left side) and the higher endpoint was labeled highest possible priority (right side). Respondents answered each question by marking an X somewhere on the scale to indicate how much the respondent’s respective company prioritized the issue currently. Each question was also posed concerning the same condition one year earlier.
Forty-two of the items were grouped into seven work environment prioritization indexes consisting of six questions each, where the indexes scores were calculated as the average of the six questions. The seven work environment prioritization indexes were 1) physical working conditions, 2) psychosocial working conditions, 3) organizational improvements, 4) work environment routines, 5) communication and interaction, 6) management and 7) health and prevention. The forty-third question in the questionnaire was about ranking different company interests and was not used in the present study.
The data used in this study, and the analyses conducted, are therefore based on fourteen indexes, seven representing the condition now, and seven representing the condition one year ago. Each question began with the introductory phrase To what extent does your company.... Two examples of the 42 phrases that completed the question are... promote development of worker competency and... engage in continuous riskassessments.
2.3Analysis
Data for the present study were analyzed with PASW Statistics 18.0 (SPSS Inc., Chicago, IL). Level of significance was set to p < 0.05. Before the analysis, the responses from the VAS (markings on the scale) were divided and classified into ten response options ranging from 1 to 10. Ratings were aggregated to a summary statistic for each company before analysis, in that the analogue scale readings (range 1–10) of both respondents’ (managers’ and safety delegates’) ratings of every company were averaged to get a mean valuerating for each of the 106 companies. With this ecological study design, the two groups to compare in the analysis on the fourteen indexes were small-sized companies (n = 79) and medium-sized companies (n = 27). Company size was the independent variable and the work environment prioritization indexes were the dependent variables in analysis. Differences in index scores due to company size were tested with the Kruskal–Wallistest.
The consensus or the extent of agreement in rating between pairs of respondents from companies was measured by Spearman’s rank correlation. Then the effect of company size could be analyzed by conducting a ranking test of the obtained correlation coefficients, using the Mann–Whitney U test.
3Results
3.1Differences due to company size
Comparison of the ratings between the two groups, small companies (n = 79) and medium-sized companies (n = 27), showed no significant differences for any of the 14 work environment prioritization indexes (p = range: 0.997–0.193, Kruskal–Wallis) (Fig. 1). Dividing the group of small companies into two new groups for a further analysis, examining small-1 (10–19 employees), small-2 (20–49 employees), and medium (50–249 employees), also showed no significant results (p = range: 0.936–0.139, Kruskal–Wallis). In addition, analyses comparing the company sizes with managers’ and safety delegates’ ratings separately did not show any significant differences (p = range: 0.957–0.113, Kruskal–Wallis).
3.2Consensus within company size
The degree of consensus in ratings between the pairs of respondents from each company, that is, manager and safety delegate, as measured by Spearman’s rank correlation coefficient, was generally low, ranging from 0.39 to –0.06, with 16 of the 28 coefficients being less than 0.2 (Table 2). However, ordering the coefficients by size showed that small companies had significantly higher rank correlation coefficients than medium-sized companies (p = 0.017, Mann–Whitney) (Table 2 and Fig. 2). These results signify a greater consensus when rating work environment prioritization within the small-sized companies than within the medium-sized companies.
4Discussion
4.1Differences in OHS between company sizes
Based on knowledge from earlier studies about differences between company sizes, the expected result was that there would be an association between company size and perceptions of work environment prioritizations. The findings of the present study did not support that notion, and in line with Harms-Ringdahl et al. [17], who with descriptive statistics demonstrated more similarities than differences in health, safety, and environment variables, we as well found no significant differences due to company size on the work environment prioritization variables. We therefore believe it is important to distinguish between the perceptions that representatives at companies hold of their organizations’ work environment prioritizations, and the objective, factual differences that can be documented about companies’ work environment prioritizations, i.e. management systems in place, formal practices, and activities (audits, checkups, meetings). The Harms-Ringdahl study, like the present one, used questionnaire as the method and did not focus on objective differences between company sizes in the variables. That our results and those of Harms-Ringdahl et al. [17] do not indicate effects due to company size may therefore instead point at the differences between subjective and objective information, and the importance of distinguishing between the two. Findings from an earlier study help to highlight this. Holte and Kjestveit [21] found that regardless of company size it was perceived that practical training was an important part in introducing young workers to OHS, but that at the same companies there were differences between small and large companies in their actual performance of practical training. The large companies had “more formalized routines and systems for receiving and training young workers”. Another study found that managers in small and large firms seemed to be equally committed in their perceptions of the importance of health and safety for workers [16].
The paradox is that between the small- and medium-sized companies of the present study, there possibly exist objective differences in their work environment priorities on the one hand, and that there are no significant differences between the company sizes in perceptions of work environment priorities on the other hand. One possible explanation is that the representatives rate their companies’ prioritizations considering themselves and their own situation, and do not consider their companies’ work environment efforts in relation to those of other companies; rather, they make a within-company assessment in light of the efforts already taken and possible future efforts for the work environment. Measurements of companies’ work environment priorities may differ in outcome depending on whether perceptual or objective data are studied. Like DeArmond et al. [8], we suggest that future research should attempt to study objective data on companies’ OHS performance. A future study should preferably investigate both objective and subjective priority of the work environment at companies to determine how the two measures are related to one another. For future research it is also recommended to consider what definition and scale of measure to use when studying associations between company size and OHS.
Turner et al. [37] demonstrated that regardless of size, companies spend about the same percentage of their turnover on internal projects, but that smaller company size means that projects are smaller, and project management and related tools and techniques therefore are less likely to be used. Applying this circumstance to the sample of small- and medium-sized companies of the present study, and considering it with respect to the priorities of OHS, one could imagine that companies of various sizes spend an equal amount of their financial resources, as a percentage, on OHS, and that this therefore is reflected in the subjective ratings of prioritizations. In reality, however, the objective circumstance may be that small companies make less use of formal practices and activities for OHS.
4.2Consensus of the ratings within small companies
In this study the managers and safety delegates were both asked to rate the same aspects of their companies’ work environment prioritizations. The consensus as measured by Spearman’s rank correlation coefficient was low for several indexes. Ordering correlation coefficients according to size displays significant differences, depending on company size (Table 2). Respondents in small companies showed overall greater consensus than respondents in medium-sized companies did. A plausible explanation would be that respondents with different roles have closer contact in smaller companies than in larger ones. We know from earlier findings that there is a better manager–employee relationship in smaller companies [12].
The exception to smaller companies showing greater consensus was the index Work environmental routines now where respondents in medium-sized companies showed the greatest consensus, and for which the highest correlation coefficient was found. For two indexes, Work environmental routines now and Organizational improvements year ago (Table 2), the respondents of both small- and medium-sized companies showed a relatively high consensus (r = 0.30–0.39).
The present study shows that work environment prioritizations were rated similarly regardless of company size, but it is not known whether the respondents of the small- and medium-sized companies feel equally satisfied with the efforts taken for the work environment. The questionnaire did not ask the respondents to specifically evaluate their satisfaction with the work environment prioritizations. It is, however, not unlikely that satisfaction to some extent implicitly is reflected in the respondents’ ratings. In earlier research on job satisfaction, though, the employees of large companies showed a lower job satisfaction [22].
4.3Limitations
Results should be interpreted with caution, keeping the regular limitations of cross-sectional and ecological study designs in mind. This study handled aggregated data, while investigating perceptions on an ecological (company) level. The summary statistic for each company was based on the ratings by the two respondents of the company. Even though the respondents were a manager and a safety delegate, it is not known what specific work tasks were assigned to these job titles in the different companies and whether it was similar or not between companies, which introduces some uncertainty in the data. Another uncertainty is that we assume that the respondents did not discuss the questionnaire with one another, and that they filled it out independently. This is something we cannot be sure about, even though we find no reason to believe that it would not be the case.
The company size variable was divided into the categories of small- (10–49 employees) and medium-sized (50–249 employees) for the main analysis. This variable could have been divided into more categories (than just small and medium). In an additional sensitivity analysis we divided the category of small into two other categories (10–19 employees and 20–49 employees), with results in line with the main analysis.
5Conclusions
The objective of this study was to investigate if there is an association between company size and perceptions of work environment prioritizations, which earlier studies had not done before explicitly. No significant differences between company size and perceptions of work environment prioritization could be demonstrated. This is in contrast to earlier studies of objective differences. Company size does not appear to have a link to perceptions of work environment prioritizations. However, the respondents of the small companies had greater consensus within their ratings than did the respondents of the medium-sized companies.
This study should be viewed as an initial exploration to serve as direction for future academic work. Measurements of companies’ work environment priorities may differ in outcome depending on whether perceptual or objective data are studied. A future study could investigate both subjective and objective data at companies to determine how the two measures are related to one another. Company size is a proxy variable to study further in order to improve understanding of the factors that enable and obstruct safe and healthy workplaces.
The literature review performed in conjunction with the present study showed that number of employees was the most commonly used approach to define company size. It also showed that ordinal scales was most commonly used to measure company size. We suggest that it is important to carefully consider what definition and scale of measure to use for the sake of studying the effects of company size on OHS. The choice of size definition and scale of measure should be made to facilitate comparisons between studies.
References
1 | AFS 2001:01 (2001) Systematic Work Environment Management Provision: Swedish Work Environment Authority |
2 | Arocena P, Nunez I (2010) An empirical analysis of the effectiveness of occupational health and safety management systems in SMEs Int Small Bus J 28: 4 398 419 |
3 | Baruch Y (1999) Response rate in academic studies–A comparative analysis Hum Relations 52: 4 421 38 |
4 | Beer M (1964) Organizational size and job satisfaction Acad Manag J 7: 1 34 44 |
5 | Champoux D, Brun J-P (2003) Occupational health and safety management in small size enterprises: An overview of the situation and avenues for intervention and research Saf Sci 41: 4 301 18 |
6 | Commission of the European Communities (2003) Commission recommendation of 6 May concerning the definition of micro, small and medium-sized enterprises, Document number C(2003)1422 Off J L 124 20.05 1 12 |
7 | Cummings SM, Savitz LA, Konrad TR (2001) Reported response rates to mailed physician questionnaires Health Serv Res 35: 6 1347 1355 |
8 | DeArmond S, Huang Y-H, Chen PY, Courtney TK (2010) Corporate financial decision makers’ perceptions of their company’s safety performance, programs and personnel: Do company size and industry injury risk matter? Work A J Prev Assesment Rehabil 37: 1 3 13 |
9 | Deshpande SP, Golhar DY (1994) HRM practices in large and small manufacturing firms: A comparative study J Small Bus Manag 32: 2 49 |
10 | European Network for Workplace Health Promotion 594 (ENWHP). ENWHP: The Lisbon statement on workplace 595 health in SMEs. ENWHP Network Meeting (pp. 4). Lisbon, 596 Belgium. 2001 |
11 | Fabiano B, Currò F, Pastorino R (2004) A study of the relationship between occupational injuries and firm size and type in the Italian industry Saf Sci 42: 7 587 600 |
12 | Forth J, Bewley H, Bryson A (2006) Small and medium-sized enterprises: Findings from the workplace employment relations survey Department of Trade and Industry, United Kingdom 1 127 |
13 | Gallie D (2003) The quality of working life: Is Scandinavia different? Eur Sociol Rev 19: 1 61 79 |
14 | Garcia AM, Boix P, Canosa C (2004) Why do workers behave unsafely at work? Determinants of safe work practices in industrial workers Occup. Environ Med 61: 3 239 247 |
15 | García-Serrano C (2011) Does size matter? The influence of firm size on working conditions, job satsisfaction and quit intentions Scott J Polit Econ 58: 2 221 247 |
16 | Gillen M, Kools S, McCall C, Sum J, Moulden K (2004) Construction managers’ perceptions of construction safety practices in small and large firms: A qualitative investigation Work A J Prev Assesment Rehabil 23: 3 233 243 |
17 | Harms-Ringdahl L, Jansson T, Malmán Y (2000) Safety, health and environment in small process plants–Results from a European survey J Safety Res 31: 2 71 80 |
18 | Hasle P, Bach E, Sørensen OH, Roepstorff C (2005) Arbejdsmiljø i små virksomheder [Work environment in small enterprises] Denmark Arbejdsmiljøinstituttet - National Institute of Occupational Health 1 44 |
19 | Hasle P, Limborg HJ (2006) A review of the literature on preventive occupational health and safety activities in small enterprises Ind Health 44: 1 6 12 |
20 | Hinze J, Raboud P (1988) Safety on large building construction projects J Constr Eng Manag 114: 2 286 293 |
21 | Holte KA, Kjestveit K (2012) Young workers in the construction industry and initial OSH-training when entering work life Work A J Prev Assesment Rehabil 41 Suppl 1: 4137 4141 |
22 | Idson TL (1990) Establishment size, job satisfaction and the structure of work Appl Econ 22: 1007 1018 |
23 | Kalleberg AL, Van Buren ME (1996) Is bigger better? Explaining the relationship between organization size and job rewards Am Sociol Rev 61: 1 47 66 |
24 | Ma Q, Yuan J (2009) Exploratory study on safety climate in Chinese manufacturing enterprises Saf Sci 47: 7 1043 1046 |
25 | Mayhew C (2002) OHS challanges in Australian small businesses: Old problems and emerging risks Saf Sci Monit 6: 1 26 37 |
26 | McVittie D, Banikin H, Brocklebank W (1997) The effects of firm size on injury frequency in construction Saf Sci 27: 1 19 23 |
27 | Nordlöf H, Wijk K, Lindberg P (2012) A comparison of managers’ and safety delegates’ perceptions of work environment priorities in the manufacturing industry Hum Factors Ergon Manuf Serv Ind 22: 3 235 247 |
28 | Nunes IL (2011) Safer and healthier workplaces Work A J Prev Assesment Rehabil 39: 4 355 356 |
29 | OSH Act. Occupational Safety and Health Act of 1970:Washington, DC: U.S. Congress. Public Law 91-596. 1970;(1) |
30 | Rantakyrö L (2000) Strategic management in small metal job shops in Sweden and the U.S. Eng Manag J 12: 2 15 21 |
31 | Salminen S (1993) The effect of company size on serious occupational accidents Nielsen R, Jorgensen K Adv. Ind. Ergon. Saf. Vol. 5 507 514 London Taylor & Francis |
32 | Salminen S (1998) Why do small company owners think larger companies have fewer accidents? J Occup Heal Saf-Aust New Zeal 14: 6 607 614 |
33 | SFS. 1977:1160 Swedish Work Environment Act: Swedish Ministry of Employment. 1977 |
34 | Sönderstrup-Andersen HHK, Flöcke T, Mikkelsen KL, Roepstorff C (2010) Measuring enterprise proactiveness in managing occupational safety Saf Sci Monit 14: 1 1 8 |
35 | Torp S, Moen BE (2006) The effects of occupational health and safety management on work environment and health: A prospective study Appl Ergon 37: 6 775 783 |
36 | Torrance GW, Feeny D, Furlong W (2001) Visual analog scales: Do they have a role in the measurement of preferences for health states? Med Decis Mak 21: 4 329 334 |
37 | Turner JR, Ledwith A, Kelly J (2009) Project management in small to medium-sized enterprises: A comparison between firms by size and industry Int J Manag Proj Bus 2: 2 282 296 |
38 | Ukai H, Ohashi F, Samoto H, Fukui Y, Okamoto S, Moriguchi J (2006) Relation of average and highest solvent vapor concentrations in workplaces in small to medium enterprises and large enterprises Ind Health 44: 2 267 273 |
39 | Wilson JMJr, Koehn E (2000) Safety management: Problems encountered and recommended solutions J Constr Eng Manag 126: 1 77 79 |
40 | Wilson MG, DeJoy DM, Jorgensen CM, Crump CJ (1999) Health promotion programs in small worksites: Results of a national survey Am J Heal Promot 13: 6 358 365 |
41 | Yamataki H, Suwazono Y, Okubo Y, Miyamoto T, Uetani M, Kobayashi E (2006) Health status of workers in small and medium-sized companies as compared to large companies in Japan J Occup Health 48: 3 166 174 |
42 | Øystein Saksvik P, Torvatn H, Nytrø K (2003) Systematic occupational health and safety work in Norway: A decade of implementation Saf Sci 41: 9 721 738 |
Figures and Tables
Fig.1
No significant differences between the company sizes. Notes: No significant differences were found between the company sizes (p = range: 0.997–0.193, Kruskal–Wallis). The 14 work environment prioritization indexes are arranged in descending order of the small companies’ ratings. Small-sized companies (n = 79) compared with the medium-sized (n = 27) on the 14 work environment prioritization indexes (total n = 106).
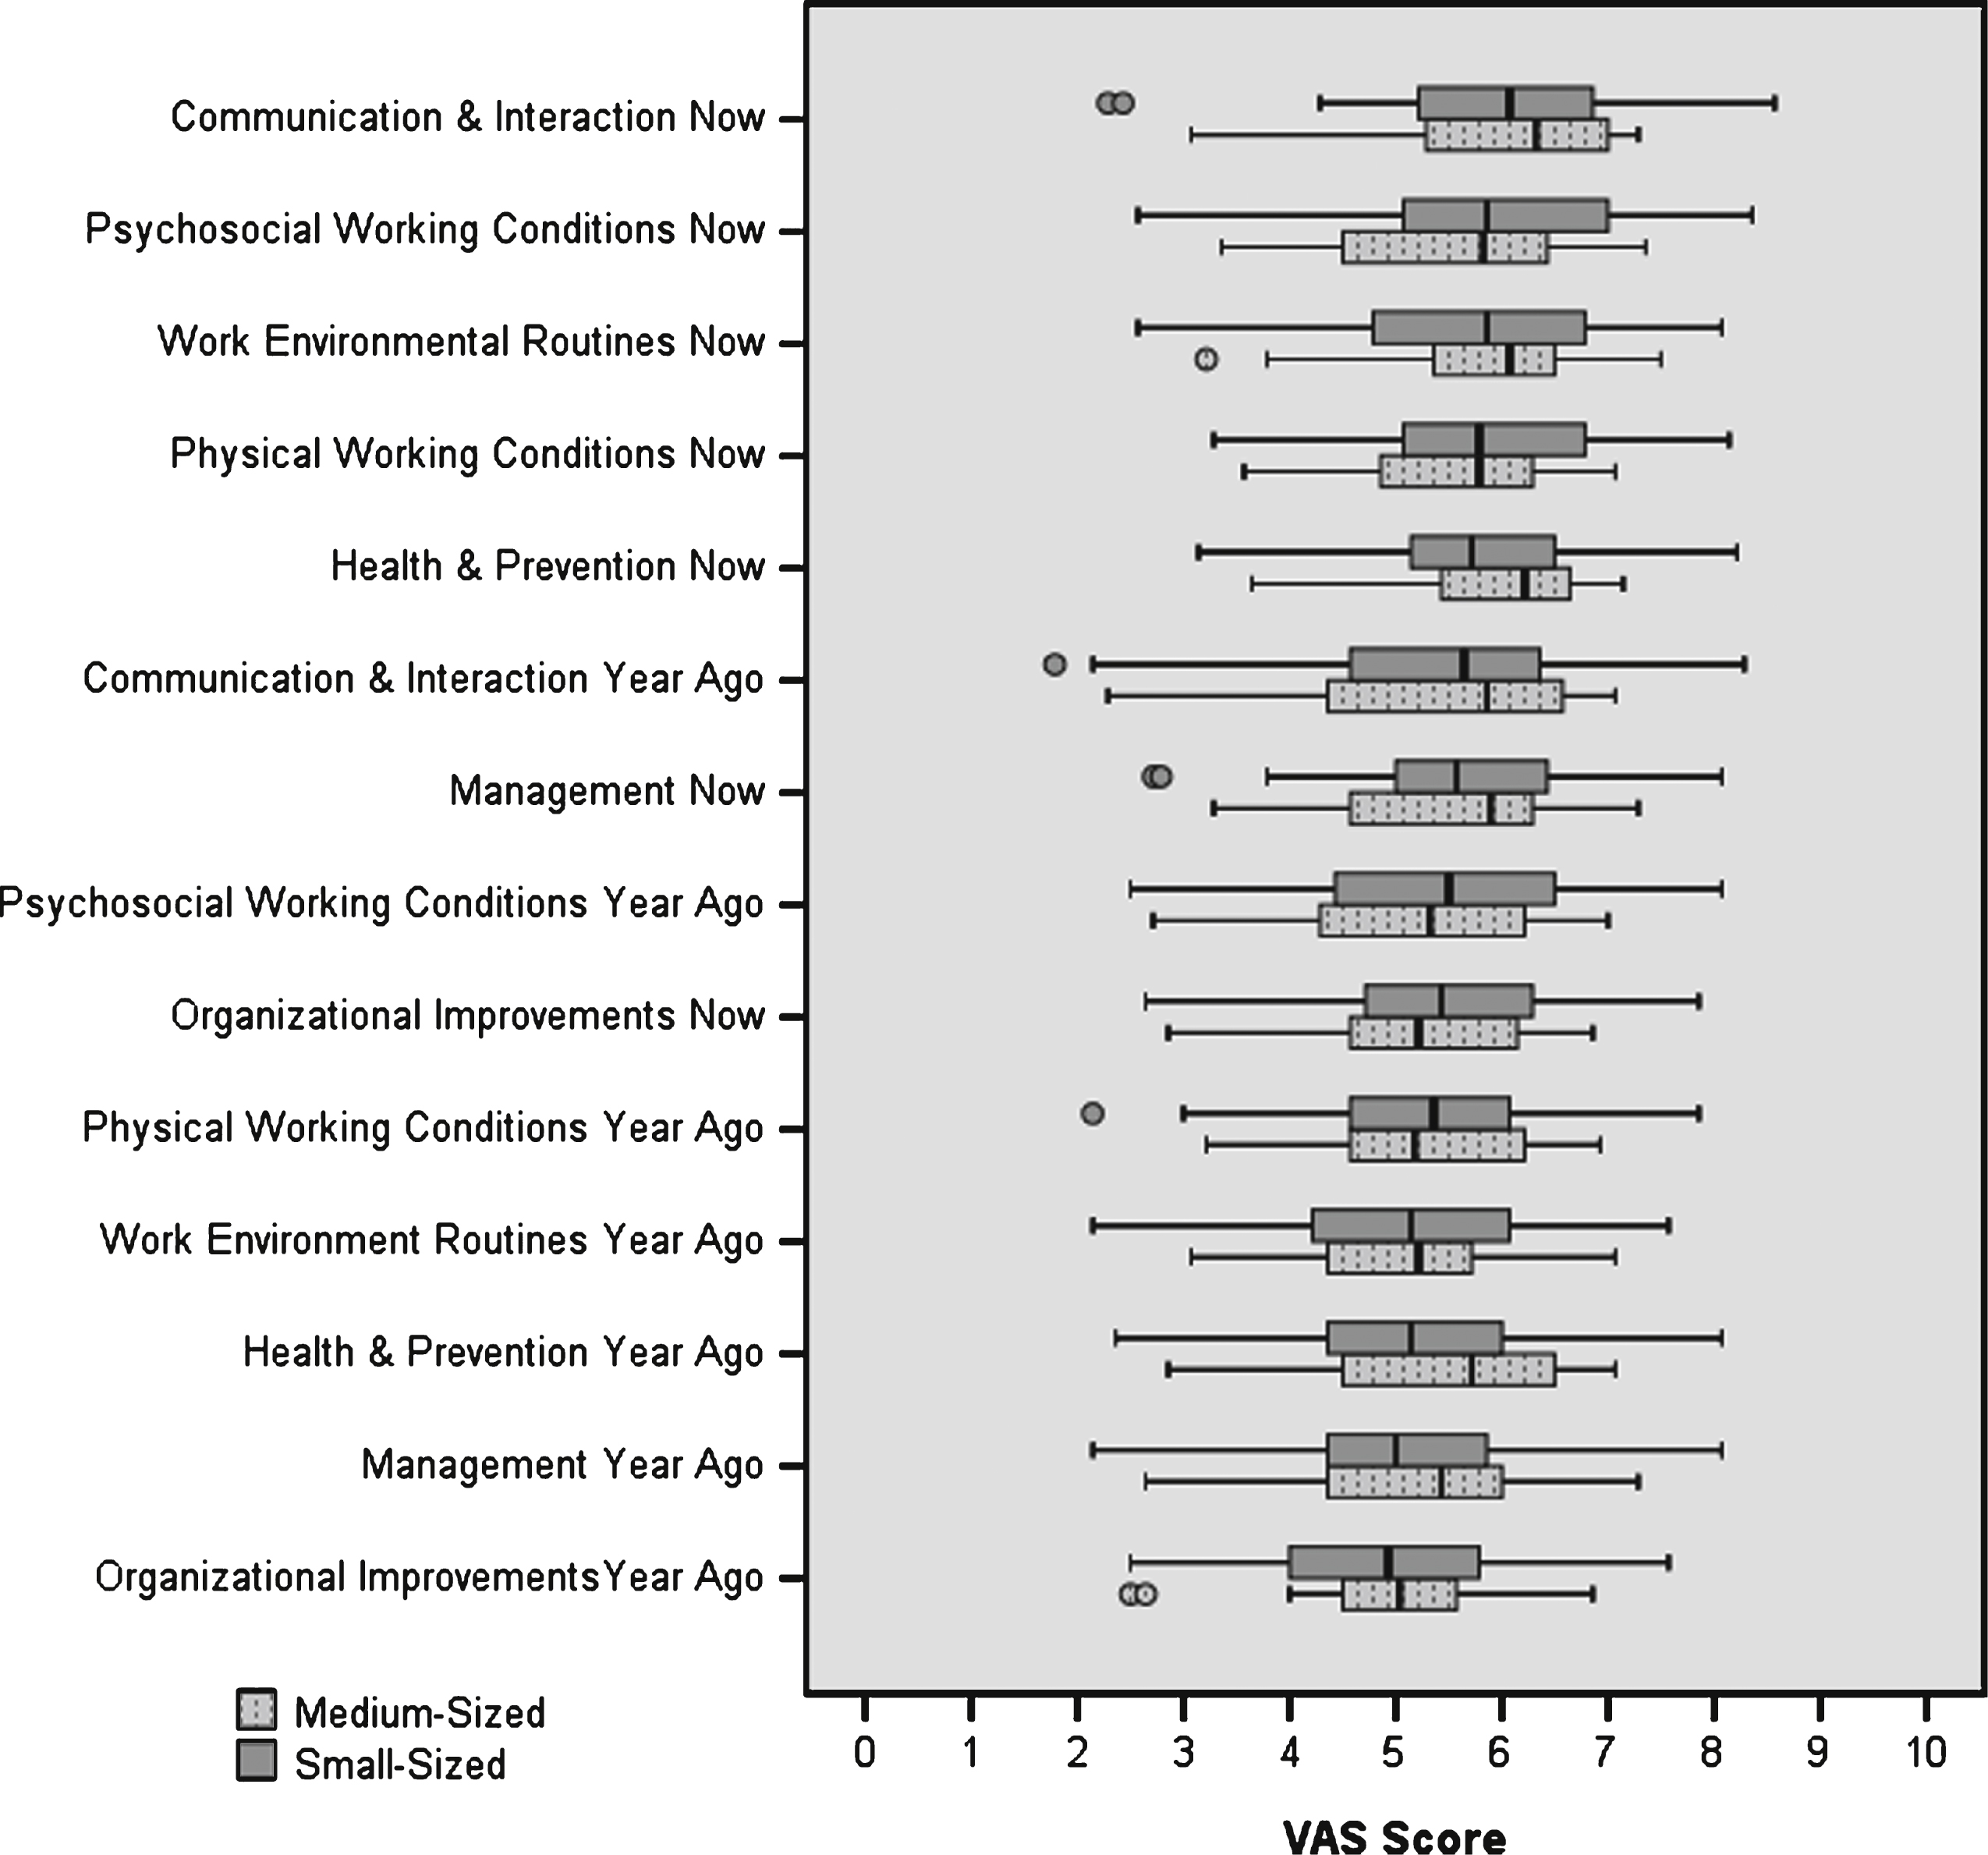
Fig.2
Rank correlation coefficients for the 14 work environment prioritization indexes. Notes: Small-sized (n = 79) and medium-sized (n = 27) companies (total n = 106).
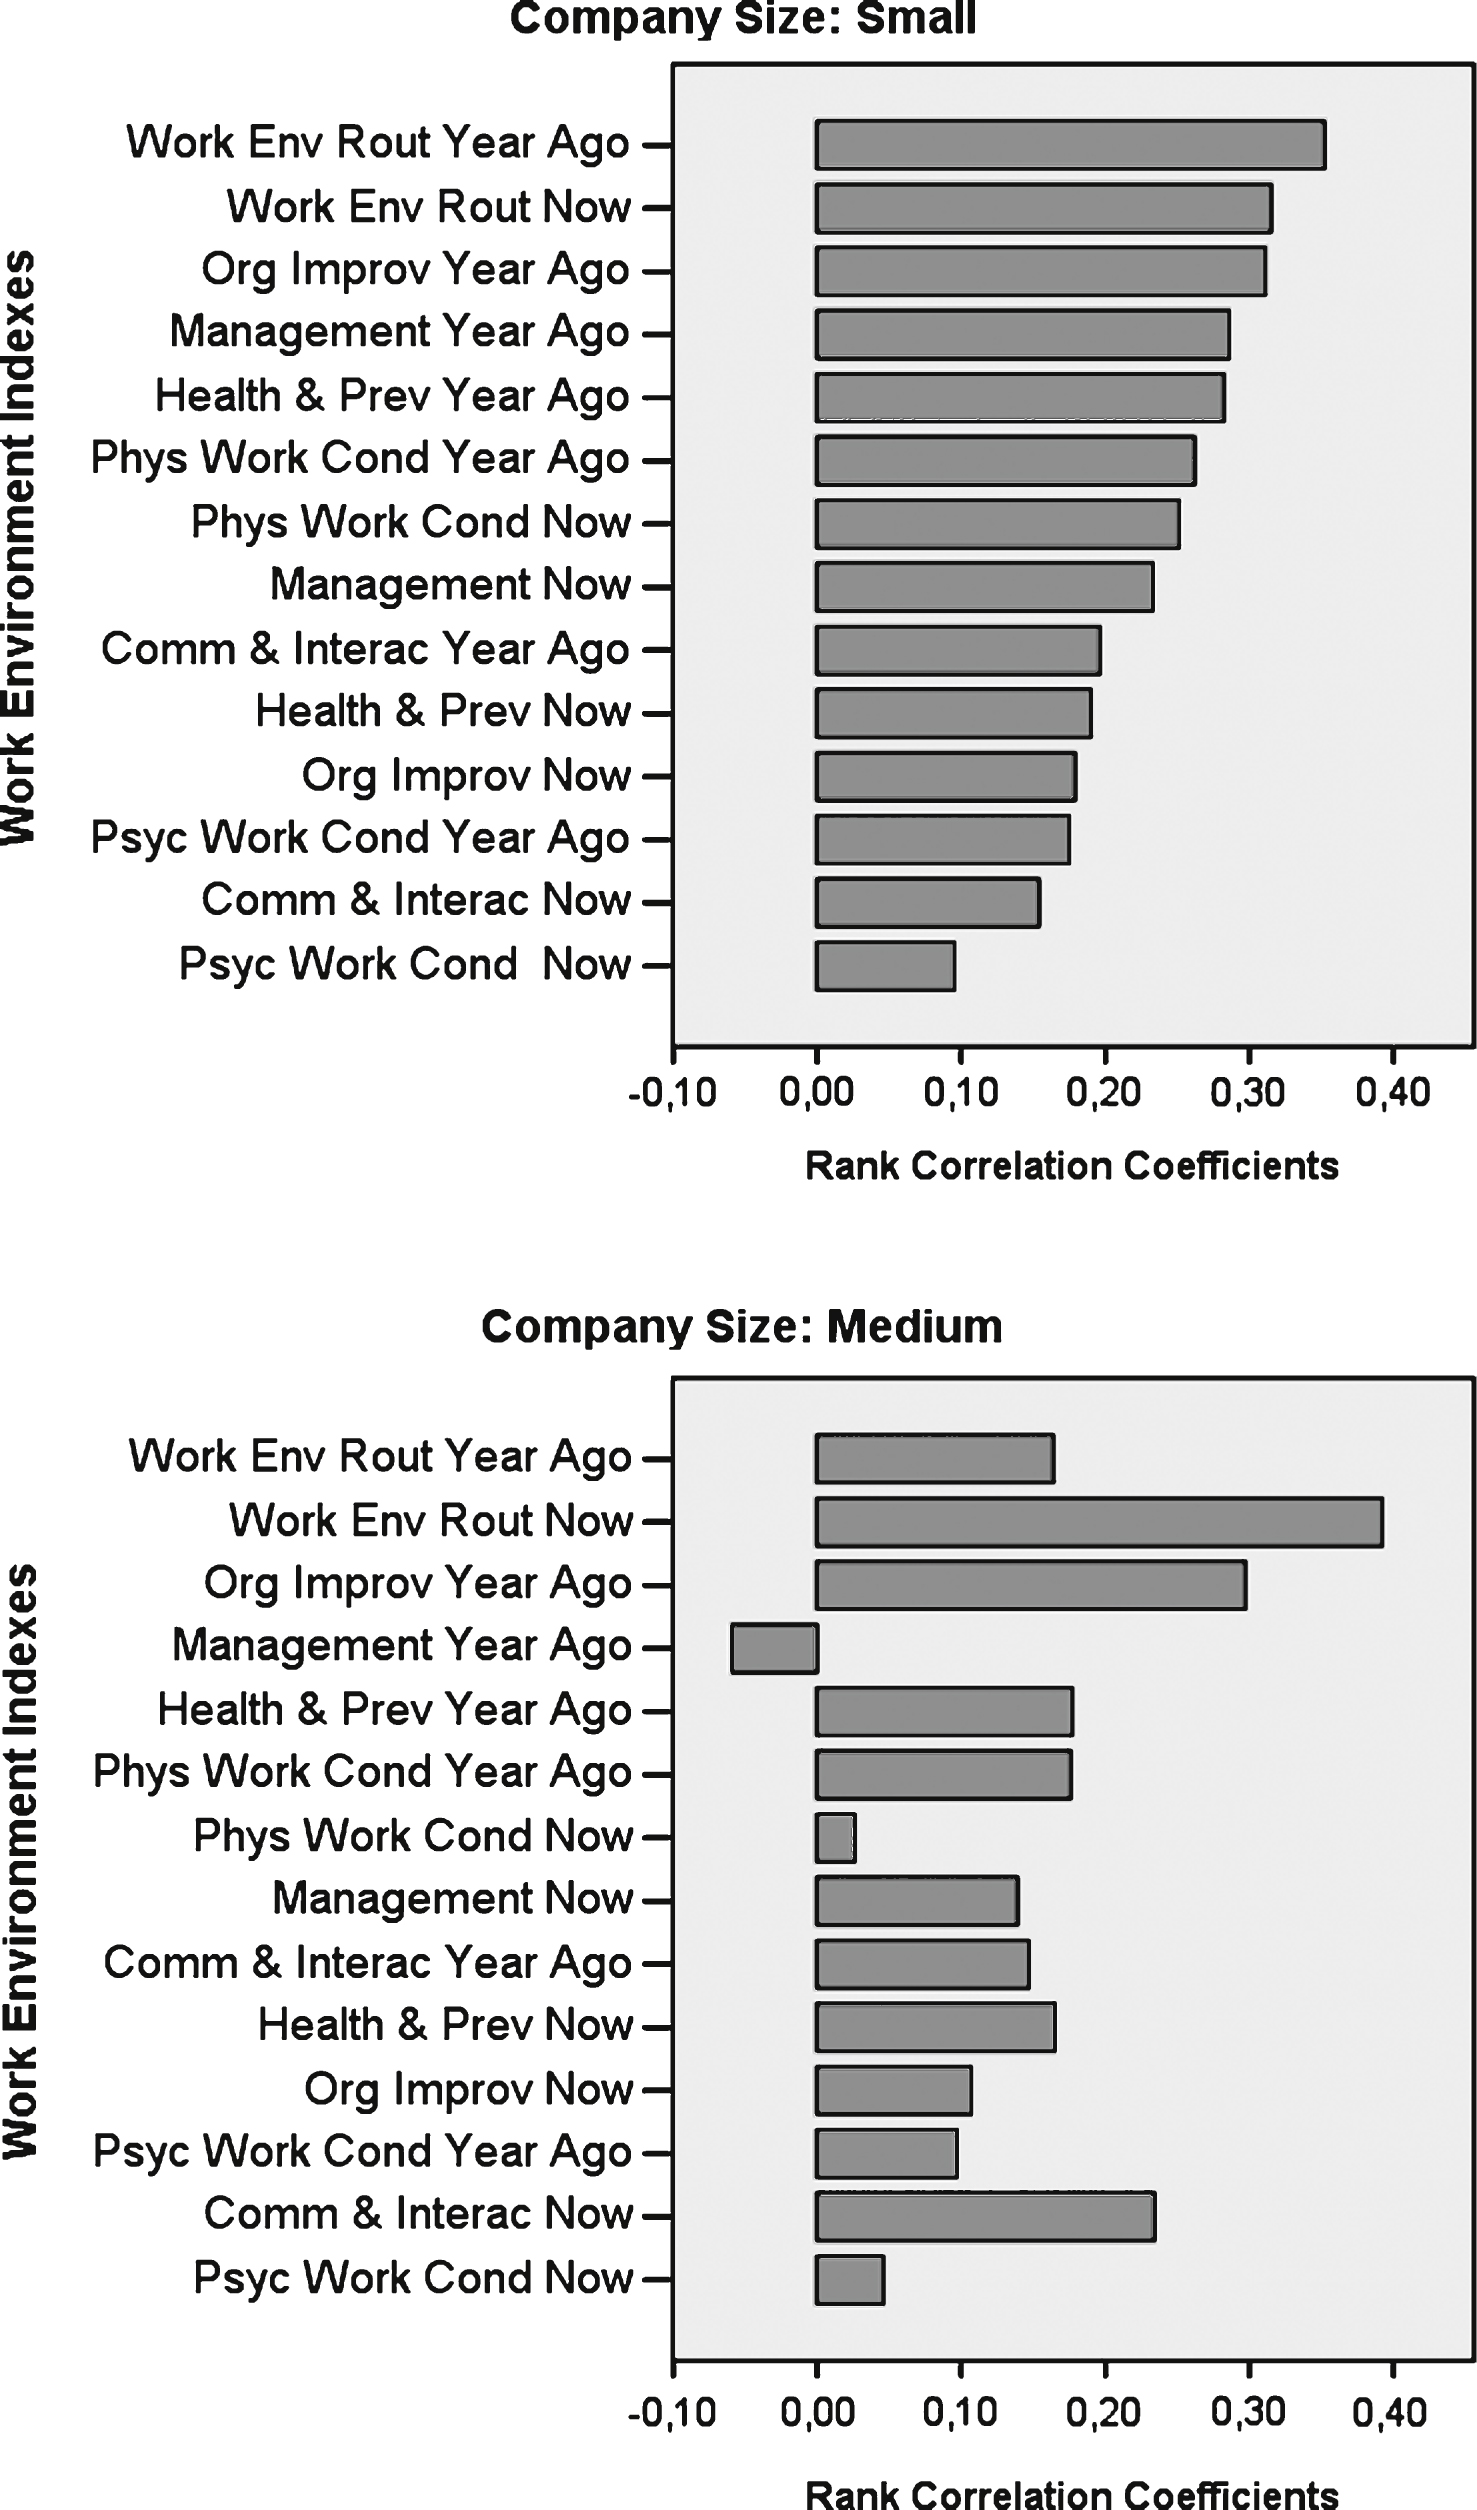
Table 1
Different ways of defining company size for study purposes
| Author | Definition | |
| Ordinal data variable, named categories of number of employees | ||
| Arocena &Nunez, 2010 [2] | Small = <50 | |
| Medium = 50–250 | ||
| Champoux &Brun, 2003 [5] | Small = <50 | |
| Forth et al., 2006 [12] | SMEs = <250 | |
| Small = <50 | ||
| Medium = 50–249 | ||
| Large = >250 | ||
| Deshpande &Golhar, 1994 [9] | Small = <500 | |
| Large = >500 | ||
| Garcia et al., 2009 [14] | Small = <50 | |
| Medium = 51–200 | ||
| Large = >200 | ||
| Hasle &Limborg, 2006 [19] | Small = <50 | |
| Mayhew, 2002 [25] | Micro = <5 | |
| Small = <20 | ||
| Rantakyrö, 2000 [30] | Small = 3–50 | |
| Salminen, 1998 [32] | SMEs = <250 | |
| Small = <250 | ||
| Large = >250 | ||
| Torp &Moen, 2006 [35] | SMEs = used, not defined | |
| Small = <10 | ||
| Medium = 10–29 | ||
| Large = >30 | ||
| Turner et al., 2009 [37] | SMEs = <250 | |
| Micro = <10 | ||
| Small = <50 | ||
| Medium = <250 | ||
| Ukai et al., 2006 [38] | Small to Medium (SM) = <300 | |
| Large = >300 | ||
| Wilson et al., 1999 [40] | Small = 15–99 | |
| Large = >100 | ||
| Yamataki et al., 2006 [41] | Small = 1–49 | |
| Medium = 50–299 | ||
| Large = 300–1,000 &1,000–2,999 | ||
| Ordinal data variable, range of categories of number of employees | ||
| Fabiano et al., 2004 [11] | SmallLarge = 1–30, 31–100, 101–250, >250 | |
| García-Serrano, 2011 [15] | SmallLarge = 10–49, 50–99, 100–499, >500 | |
| Harms-Ringdahl et al., 2000 [17] | Small = <100 | |
| Range within Small presented = 0–20, 21–40, 41–60, 61–80, 81–100, 101–110 | ||
| Large = not presented, maybe >100 | ||
| Hasle et al., 2005 [18] | Small = <50 | |
| SmallLarge=1–4, 5–19, 20–49, 50–99, 100–249, >250 | ||
| Kalleberg &Van Buren, 1996 [23] | SmallLarge = 1–9, 10–49, 50–99, 100–499, 500–999, 1,000–4,999, >5,000 | |
| McVittie et al., 1997 [26] | Range in SmallLarge = <1, 1–3, 4–7, 8–15, 16–25, 26–50, 51–100, >100 | |
| Salminen, 1993 [31] | SmallLarge = 1–9, 10–49, 50–199, 200–499, 500–999, >1000 | |
| Fixed categories used as well: | ||
| Small = <10 | ||
| Medium = 10–499 | ||
| Large = >500 | ||
| Sönderstrup-Andersen et al., 2010 [34] | SmallLarge = 1–4, 5–19, >20 | |
| Ordinal data variable, range of categories of man-labor years | ||
| Øystein Saksvik et al., 2003 [42] | SmallLarge = <5, 5–10, 11–20, 21–50, 51–100, >100 | |
| Ratio data variable, range of number of employees | ||
| Gallie, 2003 [13] | Named categories used as well: | |
| Small = <50 | ||
| Large = >50 | ||
| Idson, 1990 [22] | Definition used as well: | |
| Range of Small-Large | ||
| Ratio data variable, range of contractors’ annual volume of business | ||
| Hinze &Raboud, 1988 [20] | Range = $60,000,000–$1 billion (Canadian Dollars) | |
| Other: Small and Large, number of employees not specified | ||
| Beer, 1964 [4] | Small and Large | |
| Ma &Yuan, 2009 [24] | Small and Large | |
| Wilson, Jr. &Koehn, 2000 [39] | Small and Large | |
Table 2
Comparison of the rank correlation coefficients for the 14 work environment prioritization indexes, for small-sized and for medium-sized companies (n = 106)
| Index1 | Size2 | RCC3 |
| Work Environmental Routines Now | M | 0.39 |
| Work Environmental Routines Year Ago | S | 0.35 |
| Work Environmental Routines Now | S | 0.32 |
| Organizational Improvements Year Ago | S | 0.31 |
| Organizational Improvements Year Ago | M | 0.3 |
| Management Year Ago | S | 0.29 |
| Health &Prevention Year Ago | S | 0.28 |
| Physical Working Conditions Year Ago | S | 0.26 |
| Physical Working Conditions Now | S | 0.25 |
| Communication &Interaction Now | M | 0.23 |
| Management Now | S | 0.23 |
| Communication &Interaction Year Ago | S | 0.2 |
| Health &Prevention Now | S | 0.19 |
| Organizational Improvements Now | S | 0.18 |
| Health &Prevention Year Ago | M | 0.18 |
| Physical Working Conditions Year Ago | M | 0.18 |
| Psychosocial Working Conditions Year Ago | S | 0.18 |
| Health &Prevention Now | M | 0.17 |
| Work Environmental Routines Year Ago | M | 0.16 |
| Communication &Interaction Now | S | 0.15 |
| Communication &Interaction Year Ago | M | 0.15 |
| Management Now | M | 0.14 |
| Organizational Improvements Now | M | 0.11 |
| Psychosocial Working Conditions Year Ago | M | 0.1 |
| Psychosocial Working Conditions Now | S | 0.1 |
| Psychosocial Working Conditions Now | M | 0.05 |
| Physical Working Conditions Now | M | 0.03 |
| Management Year Ago | M | –0.06 |
Notes: Small companies had significantly higher rank correlation coefficients compared to the medium-sized companies (p = 0.017, Mann–Whitney). 1Work environment prioritization indexes = 28 = 7 indexes×2 (now and year ago)×2 (small and medium). 2Company size, S = small, M = medium. 3RCC = Rank correlation coefficients.


