
Desktop lighting for comfortable use of a computer screen
Abstract
BACKGROUND:
The contrast between a bright computer screen and a dark ambient environment may influence comfort of the users, especially on their eyes.
OBJECTIVE:
The objective of this research is to identify the optimal desktop lighting for the comfortable use of the computer screen in a dark environment.
METHODS:
An experiment was designed where seven illumination setups were introduced for the users to perform their leisure tasks on a computer screen. Fifteen healthy subjects participated in the experiments. During each session, durations of the eye blinks, fixations and saccades of the user were recorded by an eye tracker. His/her neck and trunk movements were recorded by a motion tracking system as well. The comfort/discomfort questionnaire, localized postural discomfort questionnaire, NASA task load index and computer user questionnaire were used to record the overall comfort/discomfort, the local perceived physical discomfort, the cognitive workload, and general/eye health problems, respectively.
RESULTS:
Subjective and objective measurement results indicated that users felt more comfortable with high intensity warm lights using a computer screen. We also identified that the eye fixation durations, as well as the scores of two questions in the computer user questionnaire, have significant negative correlations with comfort. On the other side, the durations of blinks and the scores of three questions in the computer user questionnaire, were significantly correlated with discomfort.
CONCLUSION:
The warm (3000K) and high intensity (1500 lux) light reduced the visual and cognitive fatigue of the user and therefore improve the comfort of the user during the use of a computer screen.
1Introduction
Using a computer/a laptop/a mobile phone is be-coming a daily activity of many people in both working and leisure. For instance, Europeans spent two to three hours in front of a screen per day outside of work [1]. In the U.S., an individual uses a computer for leisure about 1.5 hours on an average weekday and 2.33 hours per day on weekends [2]. During the weekdays, the 1.5 hours was spent mostly in the evening. This is especially true for the younger generation, e.g. in a study on the use of screen-based media devices within 1 hour before the sleep, 71.5% adolescents reported the use of at least one type of such a device at night time [3].
People perform different activities on the computer screen in their leisure time: playing video games, online shopping, chatting with friends, reading/sending emails, viewing social media, reading news, etc [4]. And many of them also work at evening due to the tendency of less rigid norms in regard to the (full-time) working day and week [5]. For young adults, research indicated that the use of social media and computer gaming are the two dominating leisure time activities [6].
In daytime, the artificial light in public places, either as the primary or the secondary sources, are more likely to be designed for people to stay alert or enhance their working efficiency [7]. However, in the evening, the artificial light and bright computer screens become the primary light source for the usage of computers. And the purposes of the usage and the contents displayed on the screen are also more diverse compared to the usage in the daytime. These post challenges on the design of lighting for the comfortable use of computer screens in the evening.
Good lighting conditions could improve productivity, while in contrast, inappropriate lighting conditions may cause discomfort, decrease task performance, lead to feelings of fatigue and even result in health problems [8]. Many researchers studied the influence of the quality of light on humans in different conditions, for instance, Juslén and Tenner [9] investigated the influence of different lighting conditions in workplaces, e.g. factories and offices, regarding the performance of workers. They concluded that the light intensity and the color temperature of the light may affect human’s mood, alertness and may lead to differences in their performance. However, extensive literature search did not reveal enough studies about the comfortable illumination setup for using a computer screen in the dark environment, especially in the leisure time.
The objective of this research is to identify the optimal desktop lighting for the comfortable use of the computer screen in a dark environment. For this, two research questions were defined as: 1) What types of desktop lights are proper for the comfortable use of a computer screen in a dark environment? and 2) What are the factors that influence the comfort/discomfort of users in this condition? It is expected that the answers to these questions may highlight the focuses of artificial light design for the comfortable use of computer screens in the context of performing leisure tasks in the dark environment.
The remainder of the paper is arranged as follows: In Section 2, we briefly reviewed different aspects of the ideal lighting, comfort/discomfort and related subjective and objective measures. Section 3 presents the materials and methods of the experiment, and the experiment results are shown in Section 4. Section 5 discusses results regarding comfort/discomfort of different illumination setups and the relations among different measures. Finally, a short conclusion is drawn in Section 6.
2Literature review
2.1Ideal lighting
According to EN 12464 [10], the recommended illuminance of typical office tasks varies from 200 lux to 750 lux. For tasks such as writing, typing, reading, data processing and workstation, the suggested illuminance is around 500 lux. In bedrooms, the suggested illuminance is between 75 lux and 150 lux. The temperature of lights has 3 categories: warm (<3300K), intermediate (3300K to 5300K), and cool (>5300k). Other than workplaces for specific tasks, the living and working environment is suggested to have warm or intermediate lighting. In office, lighting is an important factors regarding the well-being and performance of the users [11]. A previous study suggested that [12]: 1) users feel an indirect lighting system is more comfort; 2) users prefer individual control of light and 3) there were no simple main effects of lighting quality on the performance of any task. CIE 213:2014 [13] also addresses that different visual needs, visual tasks and usage durations need an individual control of the illumination condition.
Besides illumination, the contrast between the task area and the surrounding may also influence the comfort of the user. Shen et al. [14] found that the human visual system needs to adjust its sensitivity rapidly to adapt to different luminance levels when the luminance values of the background and the task area are very different, and this transient adaption will introduce visual discomfort. They also pointed out that participants had the highest level of comfort when the background is slightly darker than the task area. EN 12464 [10] also suggested that the illuminance on the task area can be 1.3 to 1.7 times brighter than the surrounding areas.
2.2Comfort and discomfort
In the past decades, researchers investigated the concept of comfort/discomfort and developed many theories/models. Despite different descriptions and application scenarios, one of the consensus is that comfort is a construct of a subjectively defined personal nature, i.e. the user decides whether a product is comfort/discomfort [15]. In this paper we adopted the definition of comfort as “a pleasant state or relaxed feeling of a human being in reaction to its environment” and discomfort as “an unpleasant state of the human body in reaction to its physical environment” [16]. These definitions indicate that comfort consists of more factors [17] than discomfort, which is mainly caused by the physical interactions. For instance, Zhang et al. [18] identified the factors that may influence comfort included relaxation, neutral feeling, well-being, energy, environmental and social/psychological considerations. On the other side, though discomfort is more connected to pain, soreness and numbness, fatigue, environmental factors and anxiety, it can also be influenced by other factors, e.g. Hiemstra-Van Mastrigt et al. [19] identified that passengers can be distracted from feeling discomfort when food and drinks are provided.
During the use the computer screen, the feeling of comfort of a subject can be influenced by multiple factors, e.g. the context, the emotion, the expectations, the content on the screen, the design of the chair, the height of the table. This is especially true for a long-term usage where fatigue may happen. Fatigue can be an important factor that contributes a decreased level of comfort and an increased level of discomfort. It could be induced by physical and physiological causes [20, 21] and in the context of using computer screens, fatigue can be categorized to three types: the physical, the visual and the cognitive fatigue. The physical fatigue was defined as “the reduction in capacity to perform physical work” [22]. Performing activities that requiring physical efforts may lead to physical fatigue, e.g., maintaining certain postures and continuously moving the mouse for playing a computer game. The World Health Organization (WHO) defined visual fatigue, or visual strain, as a subjective visual disturbance [23]. Visual fatigue often occurs after a long period visual activity, featured by pain around the eyes, blurred vision or hea-dache [23]. Cognitive fatigue and mental fatigue sometimes can be replaced by each other. In behavioral studies, cognitive fatigue can be described as “the unwillingness of alert, motivated subjects to continue performance of mental work” [24]. A long duration of cognitive activities will contribute to mental fatigue which results in a decrement of cognitive and behavioral performance [25]. The physical, the visual and the cognitive fatigue are not isolated phenomena [26], e.g. a little physical exertion is likely to improve the mental performance while heavy physical exertion may reduce it [27].
2.3Measures of comfort/discomfort
A variety of evaluation methods have been used to assess the comfort of users for a better understanding of the ergonomics in different context. For evaluating the effectiveness of efficiency of Human Computer Interactions (HCI), Gao et al. [28] categorized the measurement methods to four types: subjective measures, performance measures, psychophysiological measures and analytical measures. In the context of reading a computer screen in the dark environment at the leisure time, the contents displayed on the screen are diverse and most of tasks do not have clear task objectives, e.g. browsing news website. It is difficult to evaluate the performance of tasks and/or make an analytical model for comparison. Therefore, subjective measures and psychophysiological measures will be addressed in this study.
Subjective measures are designed to collect the opinions from the users regarding different tasks in different contexts. In spite of different criticisms on its validity and vulnerability to personal bias, subje-ctive measures with the low cost and ease of administration, as well as adaptability, have demonstrated their advantages in a variety of domains, including healthcare, aviation, etc [29]. For instance, in the evaluation of comfort, 10-point scale comfort/dis-comfort questionnaires were proven to be effective in many studies for assessing the overall feeling of comfort/discomfort [30, 31]. The Localized Postural Discomfort (LPD) body map [32] is also a widely adopted instrument in many applications for subjectively evaluating the physical discomfort of different parts of the body. For visual fatigue, questionnaires designed to evaluate users’ feeling after using a com-puter screen includes the 10-item questionnaire about symptoms of vision [33], the Computer User Questionnaire (CUQ) [34], Computer Vision Syndrome Questionnaire (CVS-Q) [35], etc. Regarding tasks with clear objectives, the perceived comfort/discomfort might also be assessed by indirect methods, e.g. measuring the cognitive load regarding serious tasks. The NASA-Task Load Index (NASA-TLX) [36] is an typical example. It was designed to measure the perceived workload of the subject within six dimensions: mental demand, physical demand, effort, performance, temporal demand, and frustration, and has demonstrated a high reliability and sensitivity in many studies [37].
Psychophysiological measures are physiological measures used to index psychological constructs [38]. For instance, Goldberg and Kotval [39] were among the pioneers of investigating the usage of eye tracking measures when browsing different types of web-pages. In this research, we broaden psychophysiological measures to objective measures [40] as physical activities are important indicators of comfort/discomfort as well, e.g. Brachynskyi et al. [41] evaluated the comfort of sitting postures while using a touchscreen by 1) a motion capture system and 2) a custom built chair which measured the forced applied by the user in various directions. For visual fatigue, the length of saccades, the fixation durations, and features related to blinking collected from eye tracking devices were often used as indicators [42]. In the evaluation of cognitive workload/fatigue, Shriram et al. [43] discovered that electroencephalography (EEG) measures were useful in finding and evaluating the relative contributions of workload that were not detected by other indexes.
In summary, many subjective and objective measures have been applied to identify different issues and proposed design suggestions regarding comfort/discomfort, and outcomes of those measures are often interrelated [40]. However, selecting the proper measures and combining the outcomes of those measures for choosing proper lighting for the comfortable use of computer screens are still challenging questions.
3Materials and methods
3.1Experiment setup
For identifying an optimal lighting setup for the comfortable use of computer screen in a dark environment, an experiment was designed where different illumination conditions can be provided. The experiment was carried in a dark room where the (natural) light was shielded by curtains. The light sources are restricted to the screen of laptop and the light of a desktop lamp. During the experiment, only a researcher and the participant stayed in the room where the researcher gave instructions and adjusted light setups following the protocol. The humidity and temperature of the room were kept same throughout the experiment. The height of the desk is 720 mm, which was the height that participants were used to. The average reflectivity of the surface of the desk was measured as 0.57. The brightness of the 15.6-inch laptop screen was set at 220 cd/m2 and the angle of the screen was adjusted perpendicular to the eyesight of the user. The lamp was placed at the front left (50 cm away) of the laptop and the height of the center of the lamp to the desk was 50 cm. The angle between the lamp and the desk was set as 15 degree to avoid direct viewing of the light source from the user as Fig. 1. Following the suggestions of EN 12464 [10], we adjust the light intensity of the lamp from 375 lux, 675 lux to 1500 lux with warm (3000K) and intermediate (5000K) temperatures, resulting in 6 possible combinations. Besides, we use the dark environment as a control setup. Those 7 setups as listed in Table 1. For each setup, the illuminance near the participants’ eyes were measured by a Benetech GM1020 Digital LUX Meter and the results are also shown in Table 1. The luminance of the screen with a typical task and the luminance of the surrounding area in different setups was measured by High Dynamic Range (HDR) photos from the eye position of the participants using the method developed by Inanici [44]. The ratios between the measured two luminance levels in each setup are presented in Table 1 as well.
Fig. 1
Setup of the experiment, where the user, the lamp, the laptop and measurement equipment are indicated.
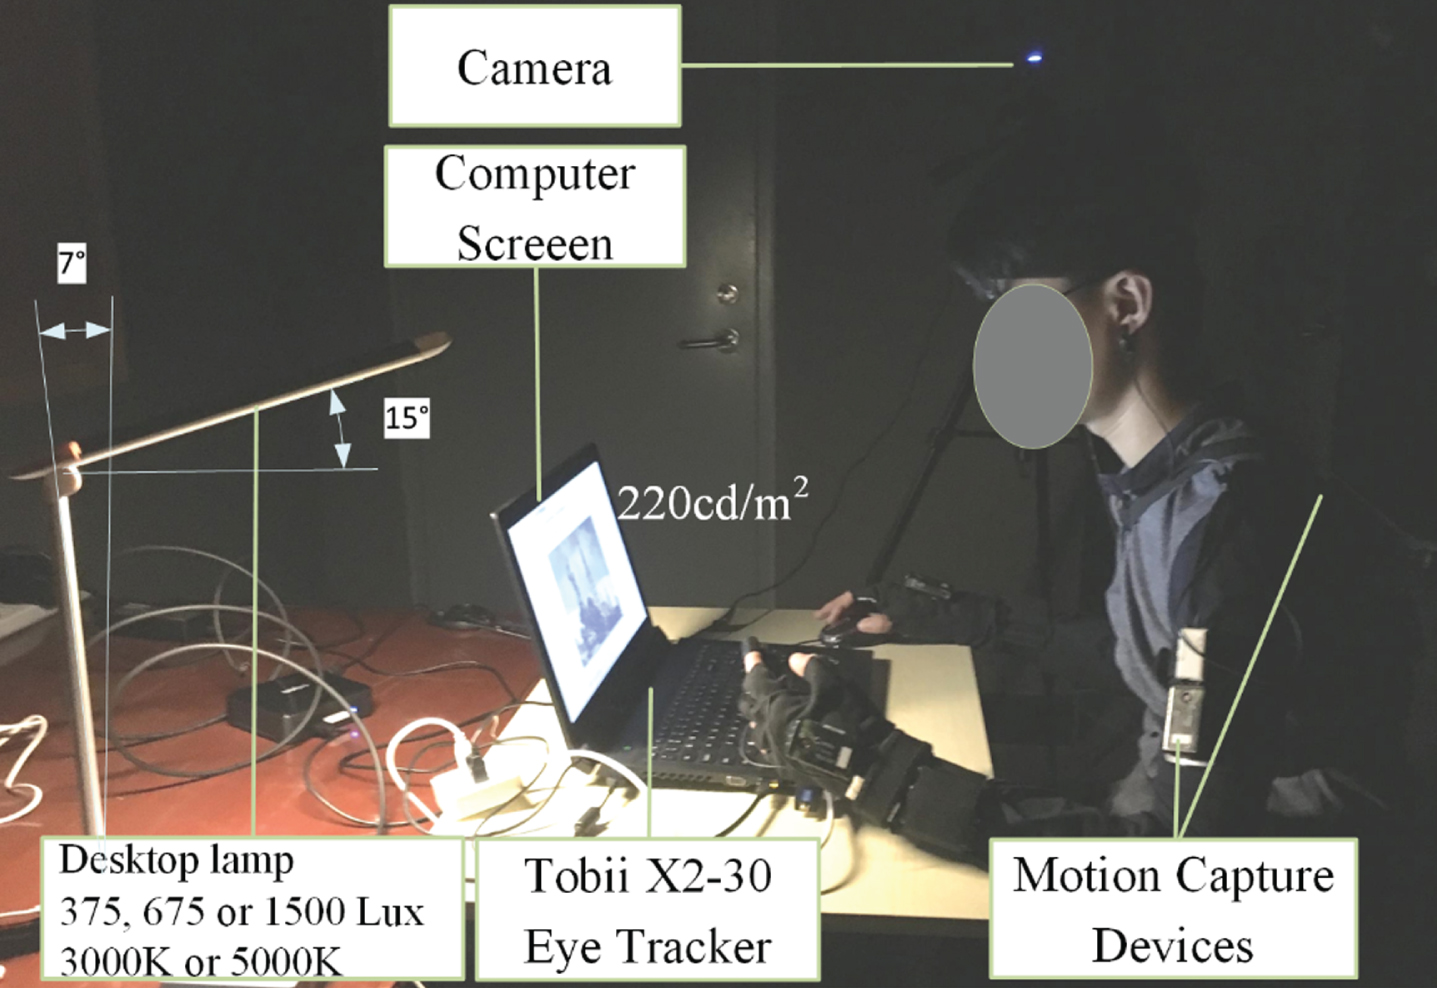
Table 1
Seven light setups and the measured illumination conditions
| Setup | 1 | 2 | 3 | 4 | 5 | 6 | 7 |
| Color temperature (K) | N/A | 5000 | 3000 | 5000 | 3000 | 5000 | 3000 |
| Light intensity (lux) | 0 | 1500 | 1500 | 375 | 375 | 675 | 675 |
| Measured illuminance around the eye of the percipient (lux) | 3.92 | 125.24 | 100.36 | 27.22 | 25.36 | 52.12 | 44.24 |
| Illuminance ratio between the screen &the surrounding areas | 7.12 | 1.74 | 1.83 | 3.07 | 3.22 | 2.46 | 2.64 |
3.2Participants
Fifteen healthy subjects (mean age = 23±3.2) joined the experiments. Among them, 6 were males and 9 were females. All participants’ dominant hand was the right hand and their native language was Chinese. Besides, they met the following criteria: 1) in good health condition (without mental or physical disorder); 2) with normal visual acuity (with or without vision correction equipment); 3) experienced with using laptops; 4) had enough rest before the experiments; 5) were able to read and comprehend both Chinese and English texts.
3.3Evaluation measures
3.1.1Objective measures
Three objective measures were used to measure the use of the computer screen in a dark environment. The ProMove® MINI [45], which is a body movement tracking device, was used to record the movements (rotation) of the neck and the trunk of users during the experiments. Durations of eye blinks, fixations and saccades were measured by a Tobii® X2-30 eye tracker [46]. A camera was deployed next to the user to record the experiment scenario as well as the postures of the participants.
3.1.2Subjective measures
In the experiment, each participant was asked to complete a set of questionnaires using the same com-puter. Among those questionnaires, the Comfort/Dis-comfort questionnaire [30] was used to evaluated the overall feeling of users regarding their comfort/dis-comfort experience. The LPD body map [47] allowed users to point out the levels of discomfort regarding different parts of their body. The NASA-TLX [37] was used for assessing cognitive workload on the use of the computer screen regarding cognitively intensive tasks among the leisure tasks. The users were also able to report general and eye health problems by the CUQ [34]. A laptop was used for performing reading tasks and filling in questionnaires electronically utilizing the ErgoLAB3.0 platform as Fig. 1.
3.4Protocols
A pilot test was conducted to verify the setups and guarantee that all materials in the same task had a similar cognitive complexity, the colour saturation and the brilliance. Prior to the experiment, the informed consent was acquired from the participant. The participant was then asked to adapt himself/herself to the lighting environment for 5 minutes. Meanwhile, with the help of the researcher(s), he/she wore the motion capture modules. Each experiment consisted of 7 sessions in a randomized order regarding the 7 illumination setups (Table 1), respectively. And every subject completed all of the 7 sessions.
Before the first session, the researcher(s) introduced the experiment and the procedure. Each session had 4 reading/watching tasks to simulate activities in the leisure time. Those tasks were presented to the user in a fixed sequence, however, the contents of the reading/watching tasks were different for each session, but with similar difficulty. This differentiation of the content was done to eliminate the learning effect, as each session repeated all 4 of the reading/watching tasks. The first one was reading a recent news in Chinese, covering the fields of science and technology, health/medicine, or culture/history. All chosen news was recent news, they had similar length (∼4000 Chinese characters), amount of illustrations and difficulty, which was evaluated by the researchers in the pilot. In the reading task, each page of the news was played for 20 seconds, then the next page was displayed automatically. In total it costed approx. 180 seconds to display every page of the news automatically. Then the respondents were asked to fill the first NASA TLX. The second task was to read comics. The comics were excerpted from Peanuts by Charlie Schutz (10 pages). Each page included one comic strip and it was played for 10 seconds (in total 100 sec. for 10 pages). In the third task, the participants were asked to read a piece of scientific article in English, which has 300 words and displayed in 3 pages (in total 180 seconds). Similar to Task 1, those (pieces of) scientific articles were selected by the researchers to guarantee that the participants were familiar with the topics, the length and the difficulties of them were similar as well. After this task the participants were asked to finish the second NASA TLX questionnaire. The last task was to watch a part of the BBC documentary movie “The Planet” for 180 seconds. After finishing this task, participants were asked to finish two questionnaires: the comfort/discomfort questionnaire and the CUQ. It is worth mentioning that the set time can be overridden by the users, i.e. there were able to pause the automatic forward function at their wish.
After finishing a session, the participant was given 10 minutes to take a rest while the researchers were finishing administrative tasks, changing the illumination setup and the content in the computer, and preparing the next session. Then the participant continued with the next session. This procedure iterated until all 7 sessions were finished. During the break. Eyewash was made available for the participant to prevent serious eye fatigue during the experiment.
3.5Data processing methods
All collected subjective data were preprocessed before analysis. Using the MinMaxScaler [48], we normalized data in the same category to a range from 0 and 1 regarding each subject, i.e., for a score on the level of comfort, 0 is the minimal and 1 is the maximal level of comfort. The Student t-test was used to identify the statistically significance between two sets of data and the Pearson correlation coefficient was used to determine the linear correlation between them. Linear regression is used to model the relations between predictors and a criterion variable, e.g. the level of comfort [49]. A self-developed Python program was developed to achieve the aforementioned analysis and visualize the data. In the data visualization, the violin plot, which is combination of boxplot and kernel density estimate [50], was introduced to present the statistical distribution of the acquired data.
4Experiment results
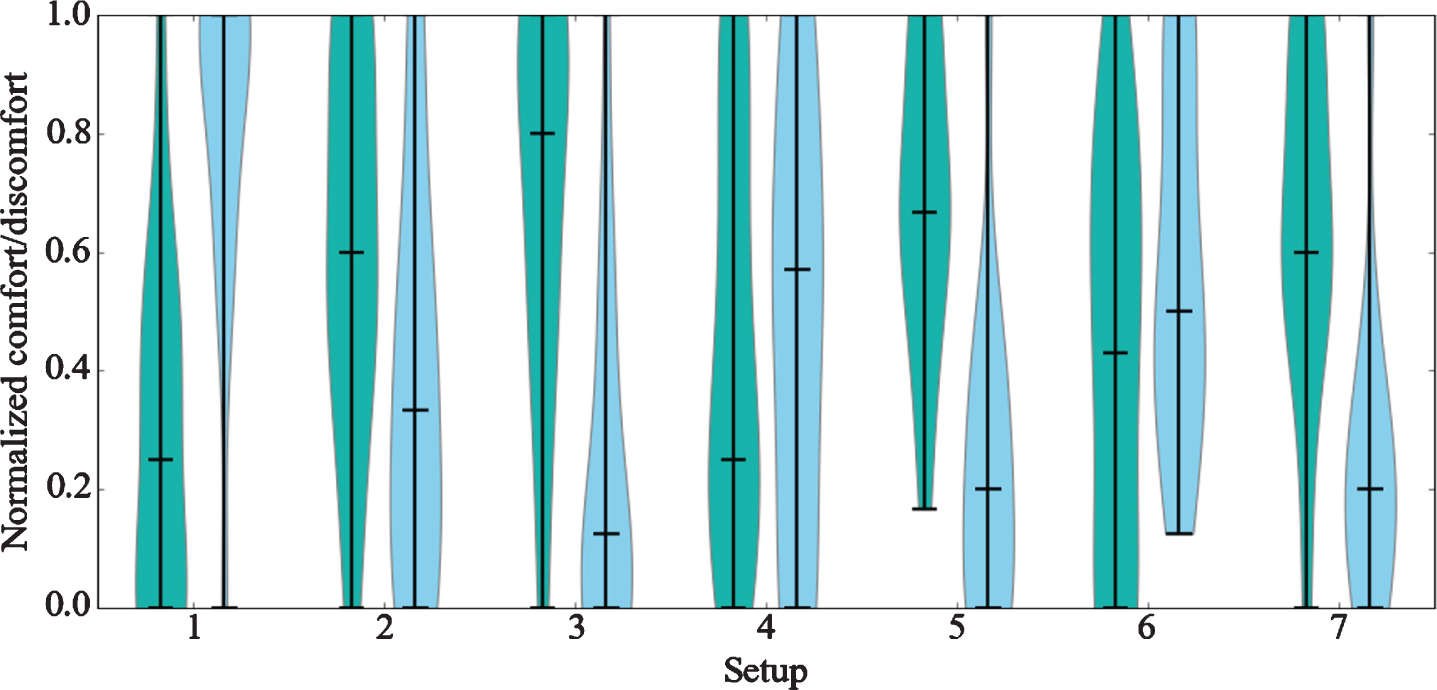
The results of comfort/discomfort questionnaire indicated the overall comfort/discomfort feelings of the participants for each setup. In Fig. 2, the violin plot of comfort/discomfort of the users regarding 7 setups is presented where the comfort/discomfort scores were normalized to a value between 0 and 1. Regarding comfort, it was found that Setup 2 (mean =0.61±0.32), Setup 3 (mean = 0.71±0.32), Setup 5 (mean = 0.68±0.26) and Setup 7 (mean = 0.65±0.29) scored higher, and they were statistically significantly better (p = 0.001, 0.009, 0.004 and 0.007, respectively) compared to Setup 1 (pure dark environment, mean = 0.28±0.31). For discomfort, similar results were observed where Setup 2 (mean =0.37±0.34), Setup 3 (mean = 0.22±0.30), Setup 5 (mean = 0.24±0.28) and Setup 7 (mean = 0.24±0.25) were statistically significantly better than Setup 1 (mean = 0.82±0.29).
Fig. 2
Comfort (Green) and Discomfort (Blue) of participants in 7 setups, for comfort, the vertical axis stands for the level of comfort (0 = no comfort, 1 = high comfort), for discomfort, the vertical axis stands for the level of discomfort (0 = no discomfort, 1 = high discomfort).
In all 7 setups, the color temperature and the light intensity have 2 and 3 variations, respectively. Figure 3 presents comfort/discomfort scores regarding these variations. Participants felt more comfort and less discomfort with the warm light (3000K) than using the cold light (5000K) as illustrated at the left of Fig. 3 (comfort: p = 0.004; discomfort: p = 0.001). For the light intensity, participants preferred strong light (1500 lux, Setup 2 and 3) more than the medium (675 lux, Setup 6 and 7) and low light (375 lux, Setup 4 and 5) setups as the right of Fig. 3.
Fig. 3
Comfort /discomfort regarding color temperature and light intensity of the lamp (Vertical axis: Comfort - 0 = no comfort, 1 = high comfort; Discomfort –0 = no discomfort, 1 = high discomfort).
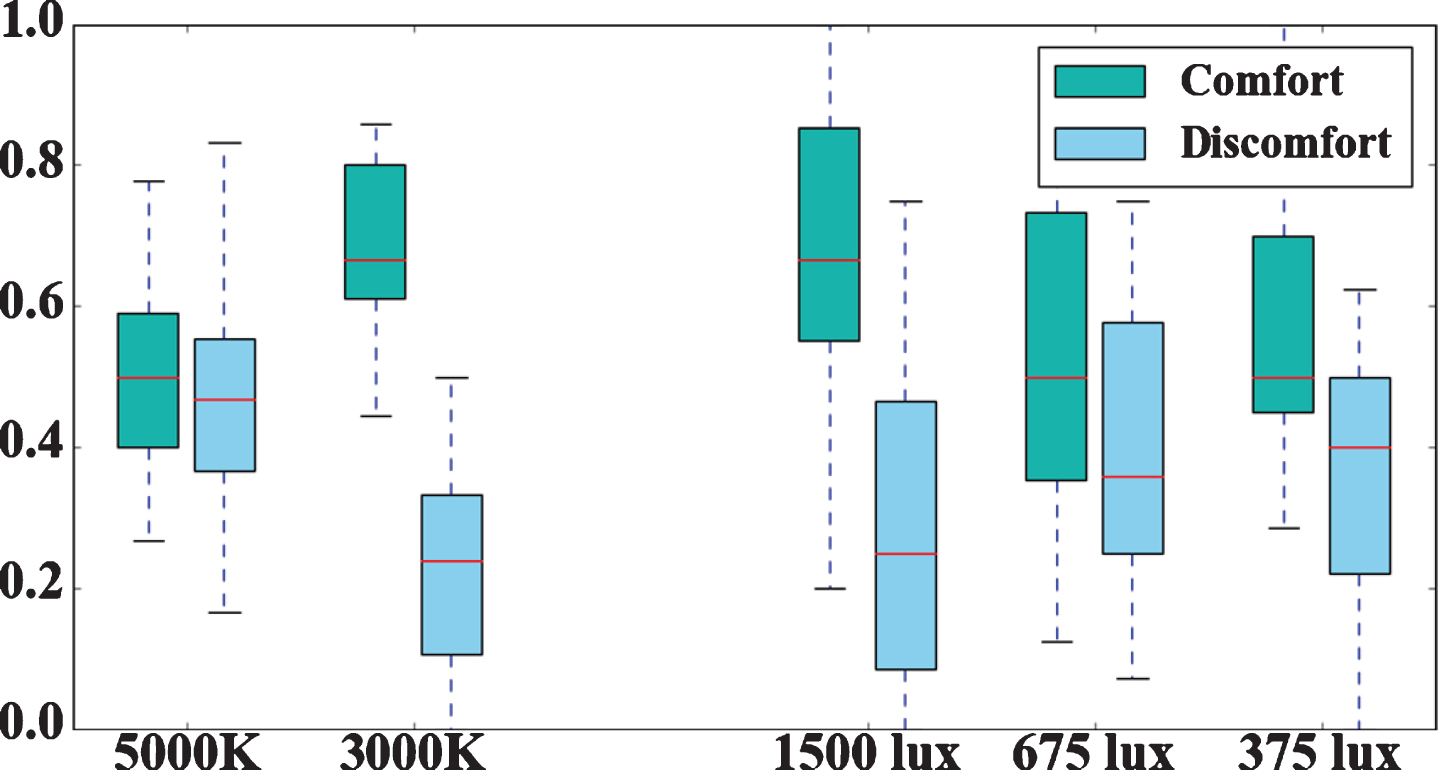
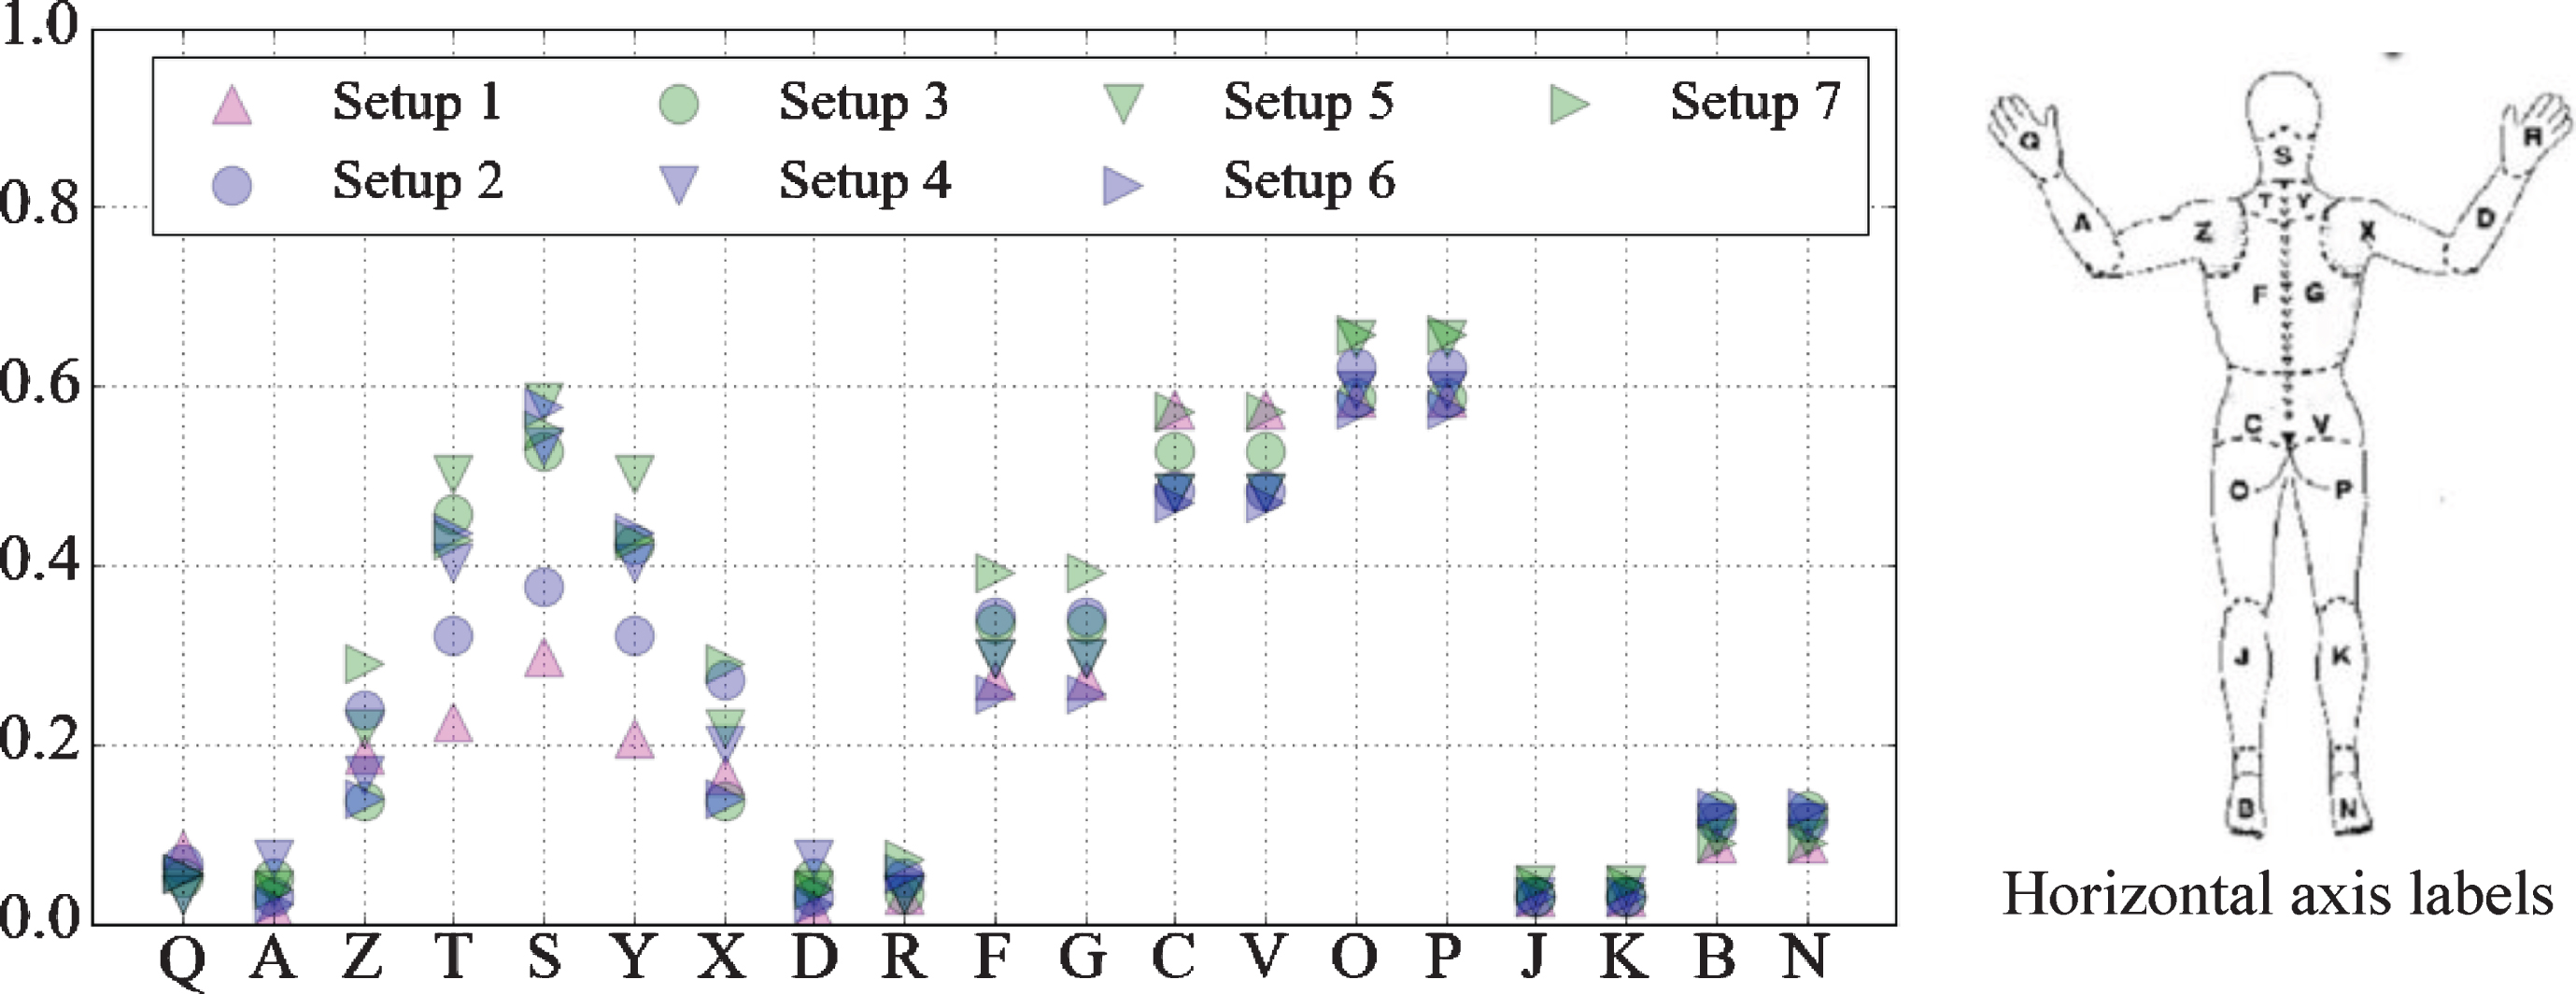
Figure 4 presents the normalized mean score of the LPD body map regarding 7 setups. It can be found that participants experienced similar discomfort of each part of the body regarding 7 setups. Nearly all users reported discomfort of the buttock (O, P), the hip (C, V), the neck (S) and the shoulder (T, Y). Though Setup 1 and Setup 2 performed slightly better regarding the neck (S) and the shoulder (T, Y), they were not statistically significant.
Fig. 4
The mean normalized scores of the LPD questionnaire regarding the 7 illumination setups (right: the corresponding part of the body reagrding each letter, vertical axis: 0 = no discomfort and 1 = high discomfort).
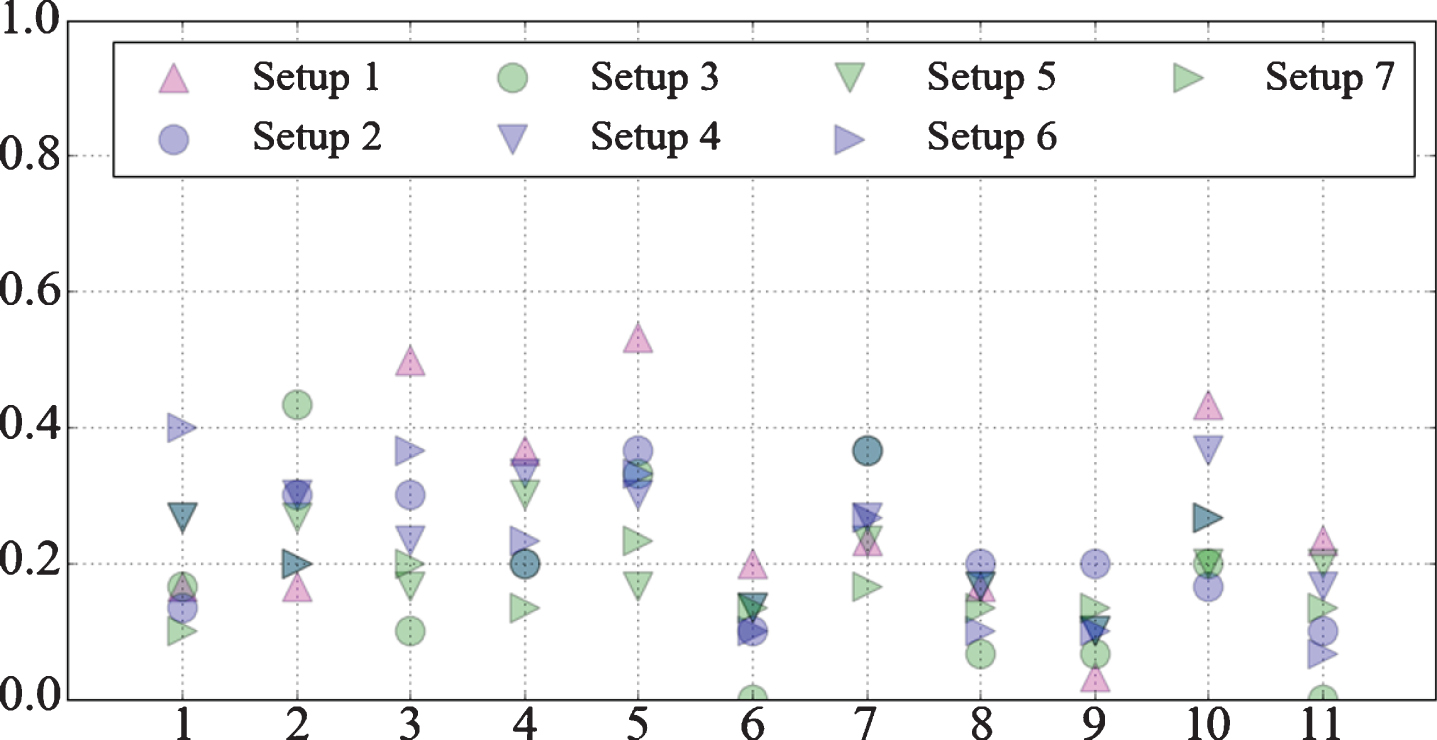
The normalized results of CUQ (Fig. 5) indica-ted the users’ subjective feeling regarding different aspects of using the computer screen in the 7 Setups, especially on their eyes. Based on the figure, it can be found that Setup 1 gave the users the most negative feelings except for question 2 (Overall bodily fatigue or tiredness) and 9 (Letters on the screen run together). Regarding question 3 (Burning eyes) and 6 (Squinting helps when looking at the computer), Setup 3 was statistically significantly better than Setup 1 (p≤0.05). The users appreciated Setup 3, 4 and 5 more than Setup 2, 4 and 6, which can be observed that the green markers are lower than purple markers in nearly all answers.
Fig. 5
The mean normalized scores of the computer vision questionnaire (Vertical axis: Normalized scores of CUQ where 1 = high discomfort; Horizontal axis: 1. Headaches during or after working at the computer; 2.Overall bodily fatigue or tiredness; 3.Burning eyes; 4.Distance vision is blurry when looking up from the computer; 5.Dry, tired, or sore eyes; 6.Squinting helps when looking at the computer; 7.Neck, shoulder, or back pain; 8.Double vision; 9.Letters on the screen run together; 10.Driving/night vision is worse after computer use; 11.“Halos” appear around objects on the screen).
Two reading tasks were conducted by participants in the experiment, one was reading a Chinese news (native language: Task News) and another is reading (part of) an English article (secondary language: Task Article). For all participants, the cognitive workloads regarding two tasks were different as Fig. 6. In the figure, it can be observed that participants agreed that Task News had less mental demand, had less physical demand, they read it faster, performed better, spent less effort and had less frustration. Regarding the cognitive workloads in 7 different Setups, participants rated Task News and Task Article differently as Fig. 6 (a) and (b), respectively. Generally, for Task News, all participants rated that Setup 2, 3, 4, 5, 6 and 7 better than Setup 1 and except the physical demand, those differences were statistically significant. Among Setup 2 to 7, Setup 3, 5 and 7 (green markers) were slight less demanding than Setup 2, 4 and 6. For Task Article, there was no statistically significant difference among all setups. Setup 3, 5 and 7 (green markers) were slight less demanding regarding mental demand and physical demand, and participants considered they performed slight better and had less frustration.
Fig. 6
The mean normalized scores of the NASA TLX questionaire reagrding Task News and Task Article (Vertical axis: 0 = lowest and 1 = highest regarding the question).
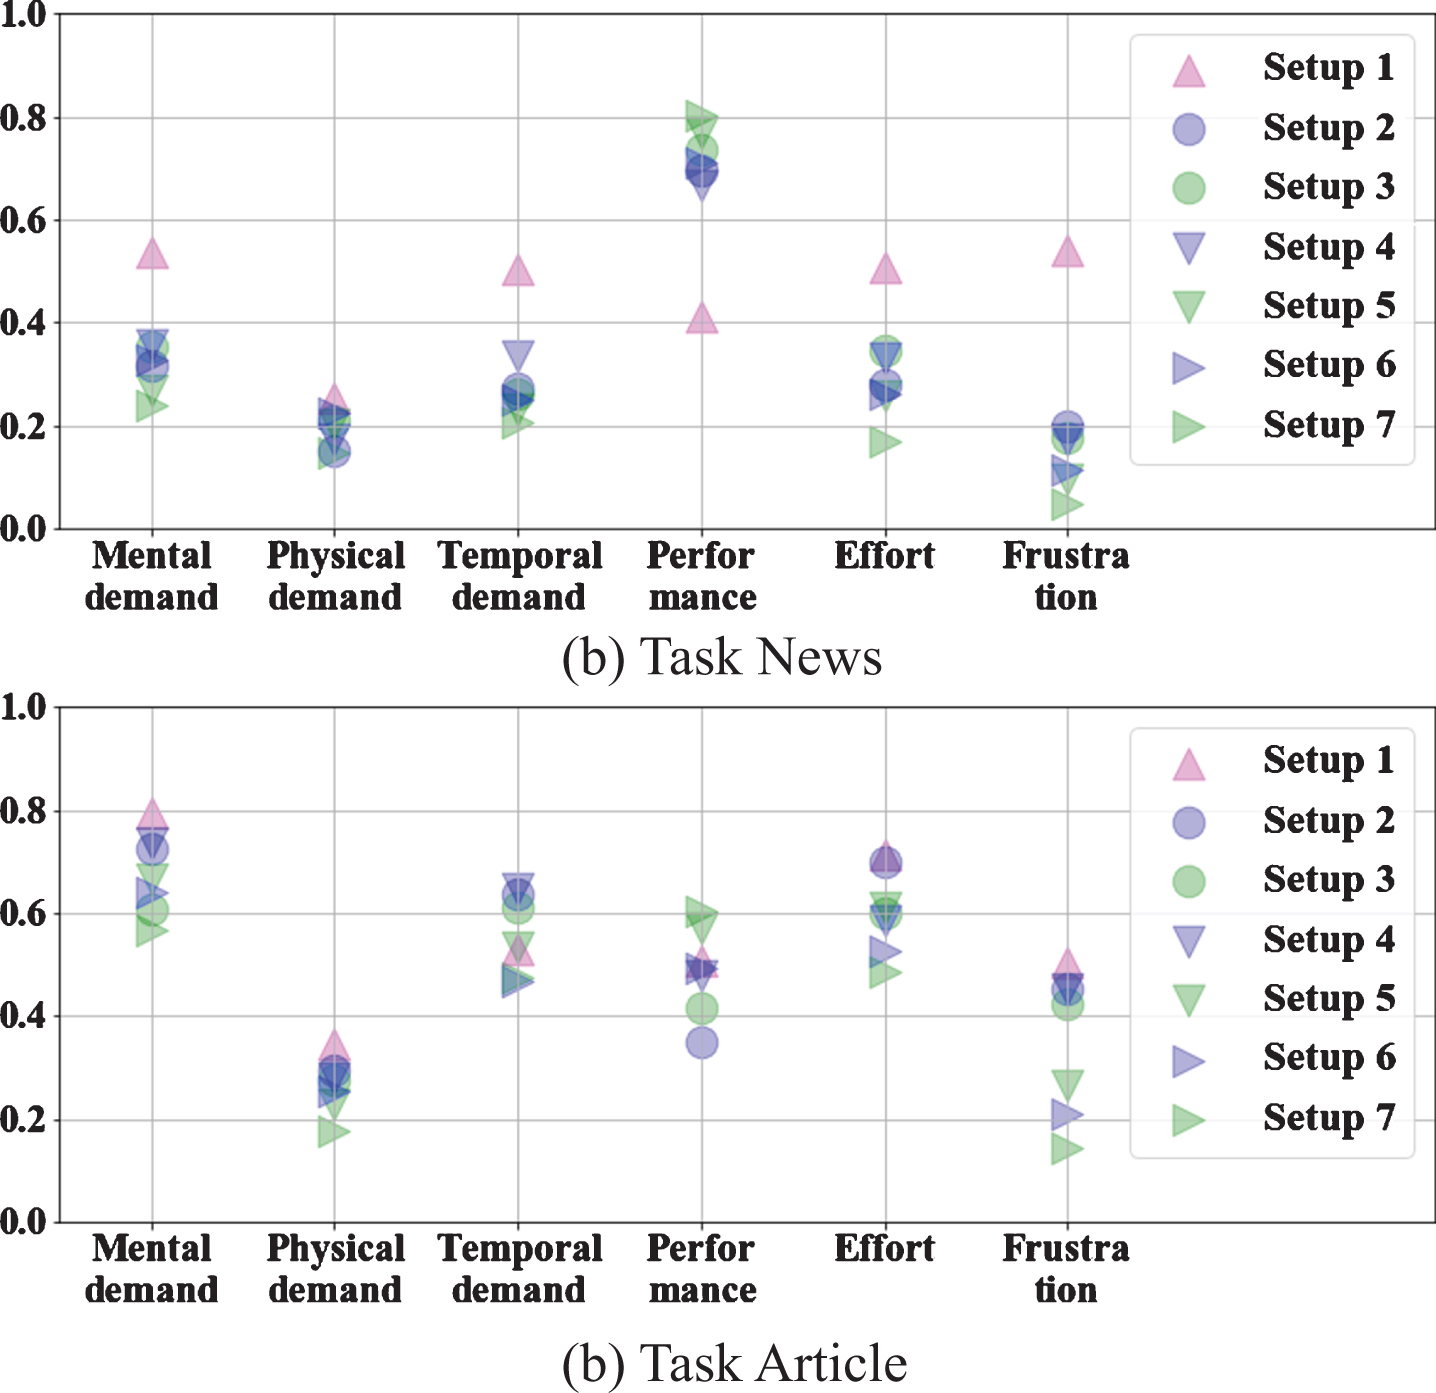
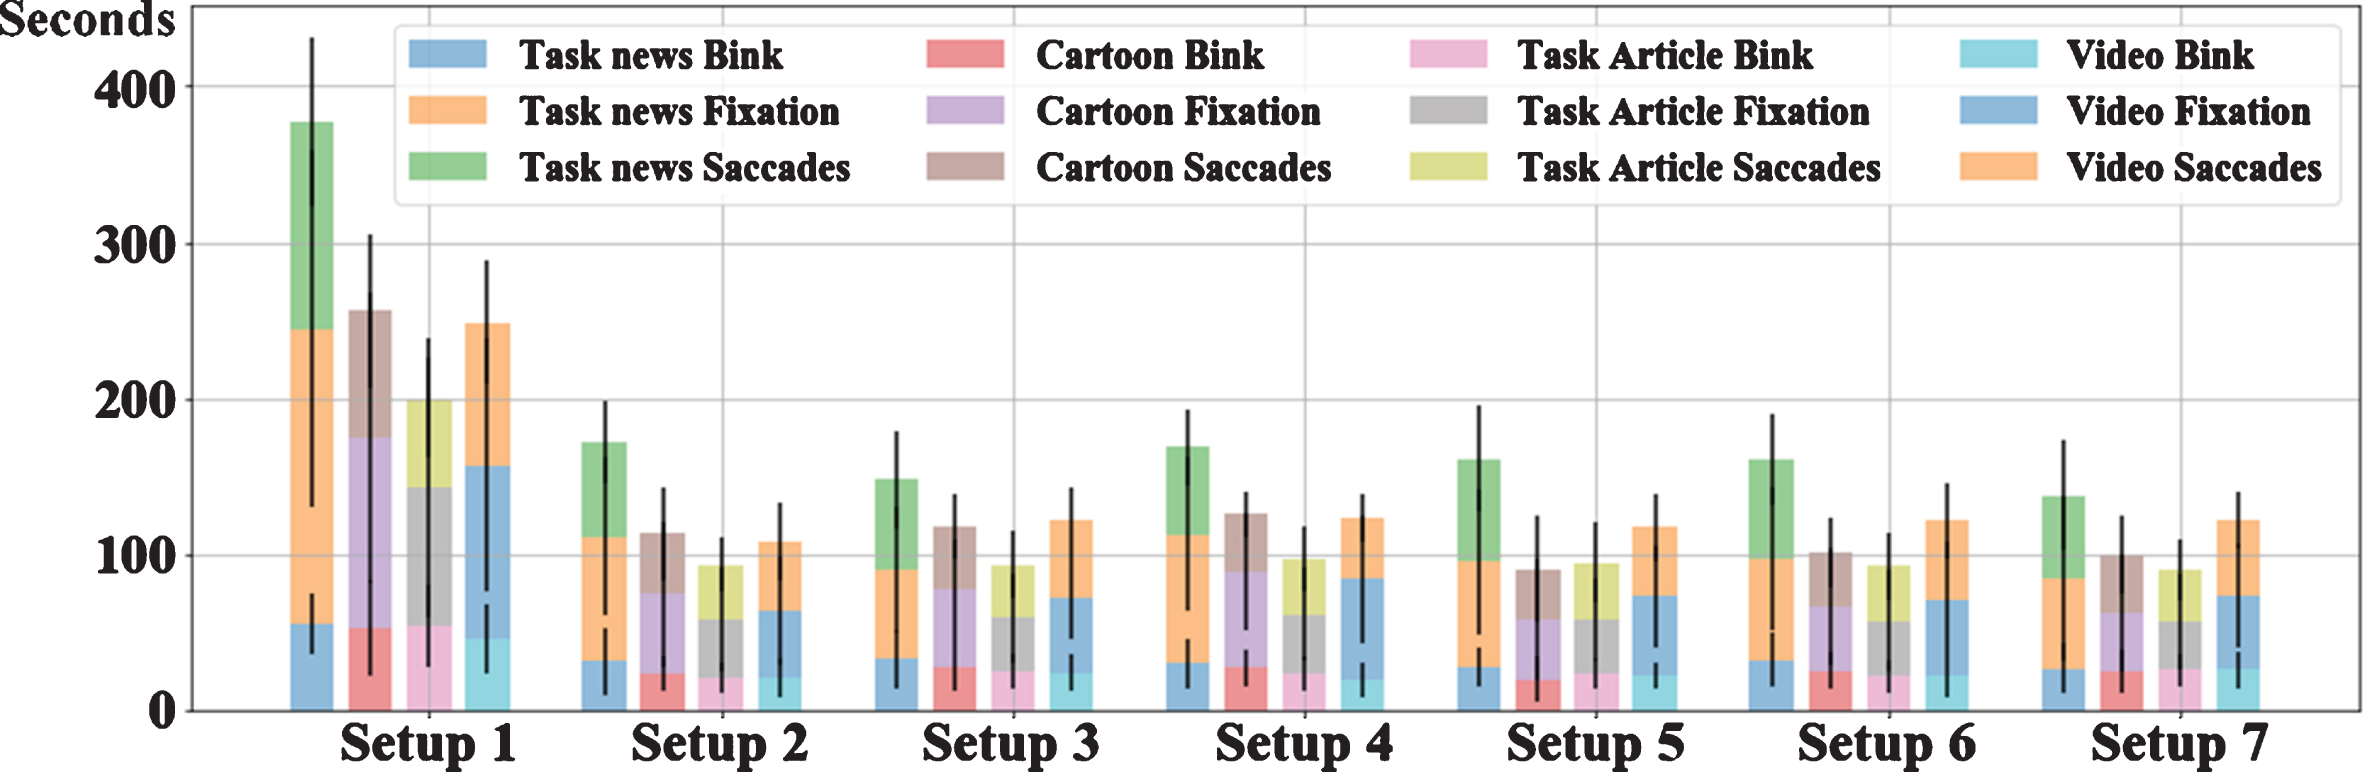
Figure 7 presents the mean rotation speed (in degree/second) of the neck and the trunk of the users during the experiments regarding 7 Setups, respectively. The users moved their neck much more than the trunk. Regarding different setups, users moved slightly more in Setup 3, followed by Setup 5. However, the differences were not statistically significant. Eye tracking data (Fig. 8) also indicated that during the experiment, participants had similar proportion of eye blink, fixation and saccade durations. But in Setup 1, users often paused the automatic forward function in order to maintain their cognitive performance, which made it statistically significant longer than others. We did not observe any pause actions in other setups.
Fig. 7
The mean rotation speeds of different parts of body reagrding the 7 illumination setups.
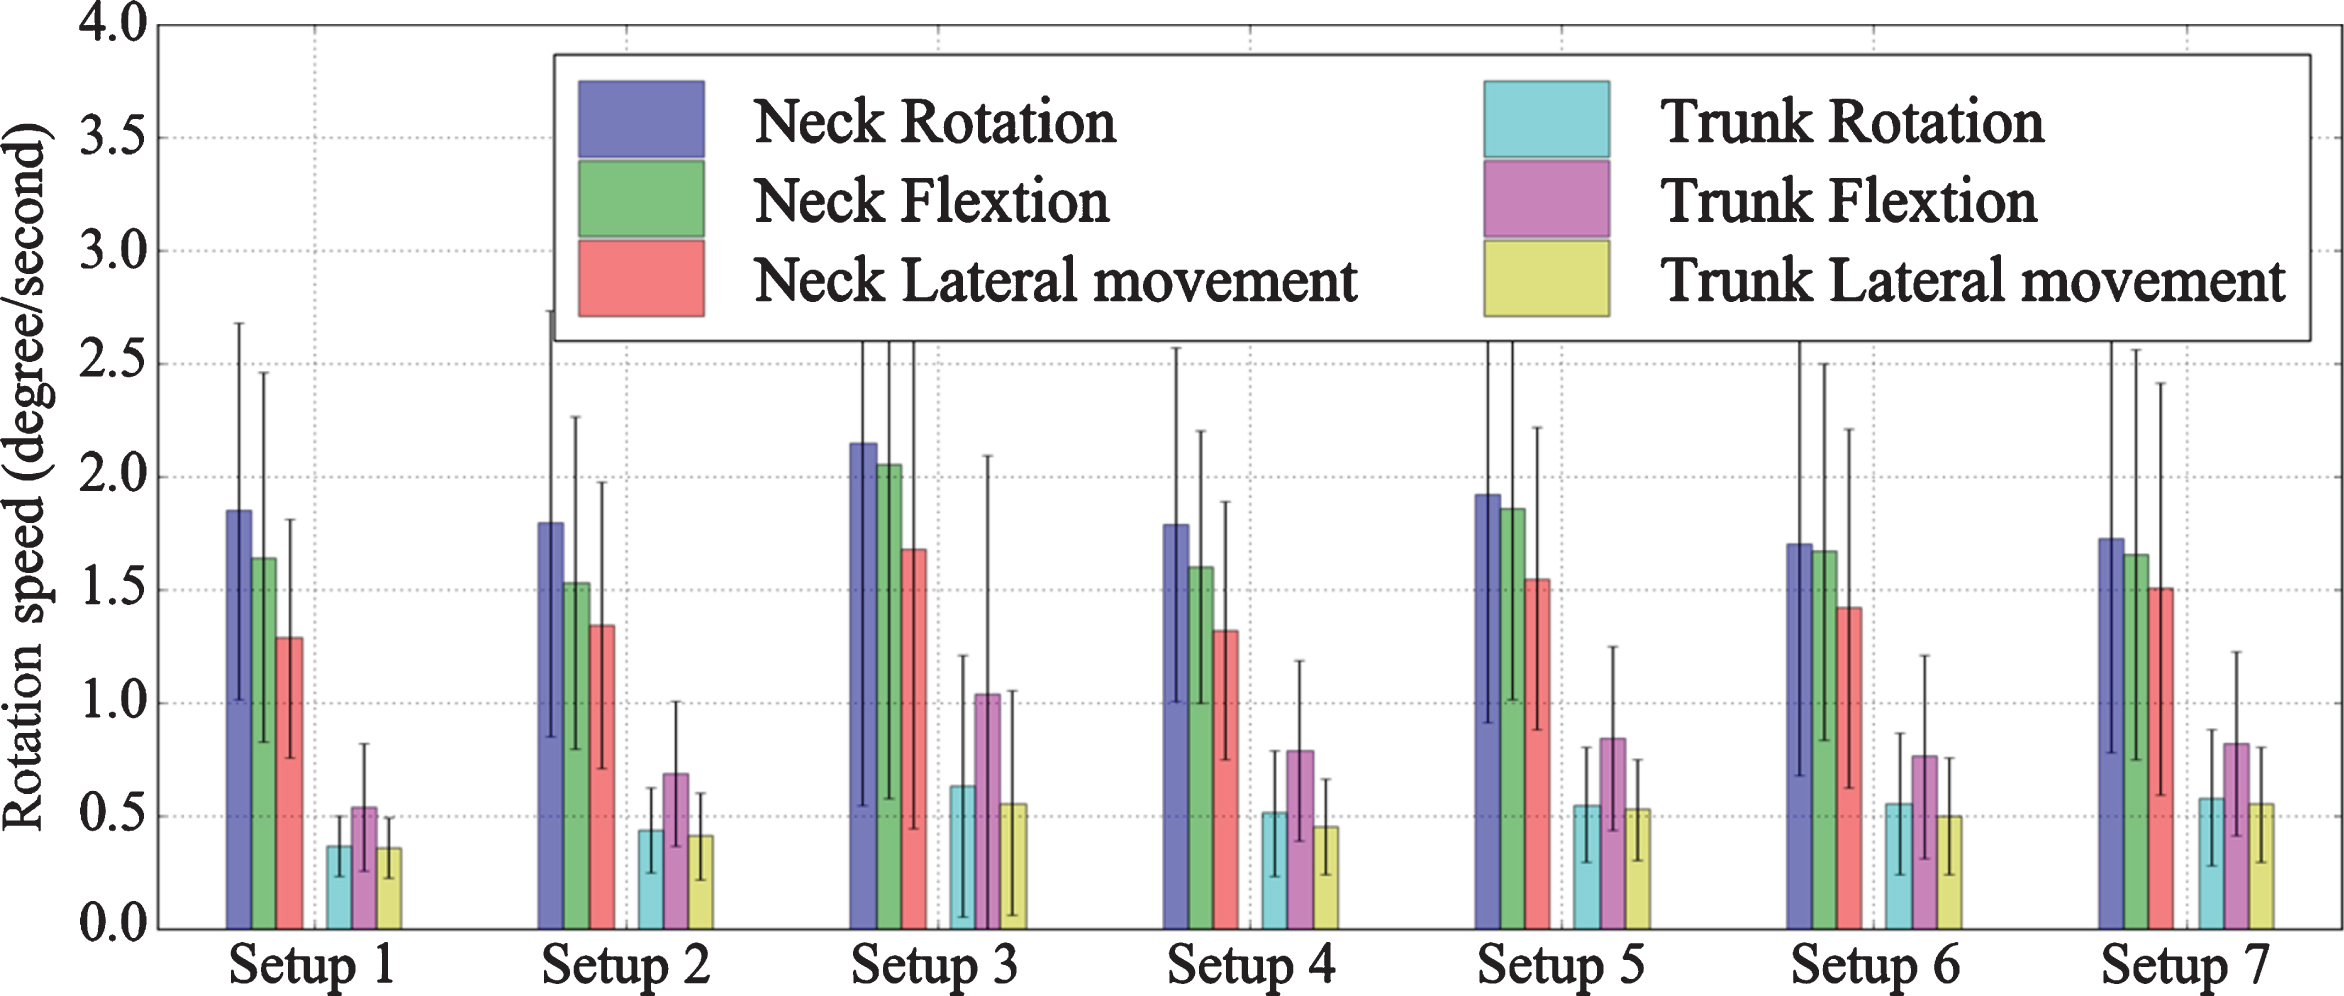
Fig. 8
The mean blink, fixation and saccades durations of 7 setups. In each setup, four diffrent tasks were presented. For each task, the durations of the blink, the fixation and the saccades were stacked.
5Discussions
In the process of reading on the laptop screen under different illumination setups, three types of fatigues, namely body fatigue, visual fatigue and cognitive fatigue, may have influenced the comfort of the user. In the design of the experiment, regarding the body fatigue, we utilized the LPD body map to detect subjective feelings of discomfort and motion sensors to detect the movements of the body. Visual fatigue and cognitive fatigue can be difficult to separate in terms of human perception. We utilized the CUQ to detect the subjective feeling of visual fatigue, and eye tracking was used to detect the activities of eyes. In the cognitive side, the NASA TLX was used to subjectively evaluate the cognitive demand of the tasks. Finally, the comfort/discomfort questionnaire was used to acquire the overall comfort feeling of the participants in the process.
5.1General comfort/discomfort
Fifteen participants experienced using computer screen in 7 different illumination setups. Regarding general comfort, Setup 1 (dark environment) was the least preferred choice of all participants. In the rest setups, Setup 3, 5 and 7 performed (slightly) better than Setup 2, 4 and 6. By grouping all setups according to the color temperature and the light intensity, we identified that participants preferred the warm light (3000K) and strong light intensity (1500 lux) with measured luminance ratio 1.84 between the task area and surrounding area.
5.2Body fatigue
The LPD body map did not show significant differences of discomfort for different parts of the body among different setups. This can be explained that in the experiment, the ergonomics setups of the chair, the table and the computer were fixed and the duration of the experiment was limited as well (10 minutes). Though discomfort increases with time has been replicated [51], it might be too short to be realized by the participants. Another discovery is that participants reported less discomfort in Setup 1 (dark environment) regarding the shoulder, the back, the hip and the buttock. This interesting phenomenon will be explained in the section Relations of measures. Regarding the physical movements of the body, we found that the average rotation speed of the head was three times more than the trunk in reading task. However, we did not find significant differences regarding different illumination setups.
5.3Visual fatigue
Illumination is more likely to directly affect visual fatigue. Participants encountered problems regarding 3. Burning eyes and 5. Squinting helps when looking at the computer in Setup 1, where no illumination was provided. Color temperature of light also influences the visual fatigue of the participants. In Setup 3 and 5 (warm light, medium and high intensity), participants had less eye fixation durations than other setups, which indicated that warm light with high intensity helped the user finishing the reading process in shorter time. Regarding different tasks, we found there were few differences between videos and Task Article regarding blinks, fixation and saccades durations. However, they were more fixation and saccades durations in reading comics than reading text and watching video, which is in accordance with the literature [52].
5.4Cognitive fatigue
Cognitive fatigue has more correspondence with the content of reading materials (the language, the difficulty and the fields it covered). In the experiments, Task News and Task Article had different cognitive workloads, where the latter was heavier. This can be explained that in Task Article, participants were using their secondary language where in Task News, they were using their native language.
Participants also reported differences on these two types of cognitive workloads regarding the 7 setups. For the Task News, all participants reported that in Setup 1, the mental and temporal demands were higher. It took more effort, they performed less good and had more frustration. However, this effect was not observed in the Task Article. Considering the cognitive workload, it might be explained that: 1) Setup 1 increased the cognitive load regarding easy tasks; 2) for difficult task, participants fully concentrated on digesting the content and they were not fully aware of the influence of the illumination conditions.
5.5Relations of measures
Setup 1 (dark environment) was the least comfortable among all setups, however, in the LPD body map, participants reported that Setup 1 was better regarding discomfort in the shoulder, the back, the hip and the buttock. Meanwhile in the CUQ, participants reported that they encountered problems with Burning eyes and Squinting helps when looking at the computer in Setup 1. This phenomenon can be explain by that “Pain will emerge over other demands for attention” [53]. The participants reported less discomfort as they experienced more problems with their eyes. This finding is in accordance with the literature [54] where passengers felt less discomfort when food and drinks were provided.
Parts of the results of CUQ were correlated with the results of the comfort/discomfort questionnaire. Scores of Question 3. Burning eyes and 10. Driving/night vision is worse after computer use had statistically significant negative correlations with the values of comfort, scores of 3. Burning eyes, 5. Dry, tired, or sore eyes; and 10. Driving/night vision is worse after computer use, had statistically significant positive correlations with discomfort. Details of the correlations are presented in Table 2.
Table 2
Correlations between scores of CUQ and the scores of comfort/discomfort (*p≤0.05)
| CUQ | 1 | 2 | 3 | 4 | 5 | 6 | 7 | 8 | 9 | 10 | 11 |
| Comfort | –0.33 | 0.623 | –0.904* | –0.665 | –0.740 | –0.647 | 0.239 | –0.209 | 0.457 | –0.856* | –0.469 |
| Discomfort | 0.289 | –0.588 | 0.937* | 0.662 | 0.813* | 0.614 | –0.144 | 0.222 | –0.449 | 0.800* | 0.442 |
Using the linear regression method, we modelled the relationships between the comfort/discomfort and the scores of CUQ. In the regression, the scores of Questions 3, 5 and 10 (p≤0.05) were used as predictors, and scores of comfort and discomfort were used as criterion variables. Eq.1 presents the model where the coefficients in column 1 to 3 are associated with CUQ question 3. Burning eyes, 5. Dry, tired, or sore eyes and 10. Driving/night vision is worse after computer use, respectively. Column 4 is the constant of the model. Based on the values of the coefficients, it can be found that Question 3 in the CUQ has the largest influence on the level of both comfort and discomfort, followed by Question 10 and Question 5, which indicates that burning eyes is the major reason of the lower level of comfort levels and higher level of discomfort levels, respectively. It is worth mentioning that the absolute values of coefficients regarding discomfort are higher than that of the comfort, which is in accordance with the conclusion made by Vink and Hallbeck [16] that the causes of discomfort are mainly physical factors where for comfort, the causes can be more complicated.
5.6Subjective and objective measures
Subjective and objective measures were used in the experiment to measure different types of fatigue influenced by various elements. For instance, we measured the cognitive process using eye tracking and NASA TLX, and the overall process was measured by comfort/discomfort questionnaires. In Table 3, the correlations between the blink, fixation and saccade durations, the comfort/discomfort scores, and scores in NASA TLX are presented. It shows that the longer the fixation durations are, the lower the comfort is. A similar phenomenon was identified between blink durations and discomfort. As blinks can be an indicator of visual fatigue [55], this result verified that visual fatigue is a component of discomfort.
Table 3
Correlations between blinks, eye fixation, saccade duration and the values of comfort/discomfort and NASA TLX questionnaire (*p≤0.05)
| Blink durations | Eye fixation durations | Saccade duration | |
| Comfort/Discomfort | |||
| Comfort | –0.702 | –0.762* | –0.549 |
| Discomfort | 0.761* | 0.814 | 0.610 |
| NASA TLX | |||
| Mental demand | 0.835* | 0.846* | 0.672 |
| Physical demand | 0.778* | 0.727 | 0.647 |
| Temporal demand | 0.630 | 0.599 | 0.384 |
| Performance | –0.717 | –0.693 | –0.456 |
| Efforts | 0.805* | 0.775* | 0.678 |
| Frustration | 0.821* | 0.785* | 0.614 |
Eye blink and fixation durations were also correlated to the scores in the NASA TLX. The blink duration was correlated to Mental demand, Physical Demand, Efforts and Frustration and for the fixation duration, it is correlated to Mental demand, Efforts and Frustration. The difference on the physical demand indicates that eye blinks is more a physical activity, which again verifies the relations between eye blinks and discomfort. Regarding the saccade duration, we did not find any statistically significant correlations.
5.7Reading materials
Based on literature, we classified different types of computer tasks for leisure time to activities related to reading/processing texts (sending emails, reading news, chatting with friends), activities related to digital graphics (reading comics, watching movies and streamlines, playing video games) and activities related to both (shopping online, using social media website). During our pilot, we found out that for activities that have a higher level of mental engagement, e.g. video games, it was difficult for the participant to report the levels of comfort/discomfort regarding different light conditions. This is in accordance with literature which indicated that the effect of lighting on task performance is much lower than the difficulty of the task itself [56]. Summarizing the findings, we selected two typical text-relate tasks: reading Chinese news (low cognitive demand) and reading English articles (high cognitive demand) to simulate all text-relate activities including reading news, chatting with friends, sending emails and so on. We designed the task “watch comics” to simulate the activities related to both text and graph, for example, shopping online, using social media websites. We used the task of watching a video (documentary clips) to simulate activities related to watching motion pictures. In the results, the findings in the literature were also verified, e.g. users did not complain illumination conditions in the cognitive intensive task (reading English news).
5.8Gender and age
Six males and nine females joined the experiment, we did not find statistically significant differences between these two groups. This is in accordance with the literature [57] where the researchers also did not observe gender differences in environmental satisfaction or lighting quality. Meanwhile, the mean age (23±3.2) of the participants was young. Schlangen [58] discovered that the visual acuity of 60 + group is 36% lower than that of the 30–40 years old group, and the older group also prefers brighter illumination conditions than the younger group. This implicates that for the older group, the preferred illumination condition might be brighter.
5.9Limitations
In this study, we investigated the comfort experience using a computer screen in a dark environment. Using screens in the evening with different illumination conditions has different impacts on the users, e.g. it influences the cognitive performance [59, 60]. However, in this paper we only focused on visual comfort [61] rather than discussing other issues, e.g. the effects on the circadian phase [60]. Regarding the setup of the study, we did not allow subjects to adjust the brightness and the color temperature of the screen for highlighting the effects introduced by desktop lights. Currently, many laptops can adjust the brightness automatically according to different illumination conditions, and previous research also indicated that users prefer personalized setups [11, 12]. Further study is needed regarding different user preferences regarding different illumination conditions and screen setups.
For simulating the use of computers in the leisure time (evening), the designed tasks were easy and without a clear objective, tests on the content [62] were not arranged as well. Considering that the real reading setup can be more complicated, there are more factors to be investigated in a natural environment, e.g. colors of the environment, ergonomics of the chair and the table, ambient noises. Besides, in order to prevent eye fatigues of participants, we limited our experiments to 7 discontinuous sessions, which may also influence the comfort/discomfort of the users. Additionally, it is known that with longer durations comfort reduces further and discomfort increase [63], but it is also known that humans move more when they are longer in one position [64]. This means that it is hard to extrapolate these results under laboratory setups to natural environments and further research is needed on how this can be translated to daily life. On the other hand, it is clear that there are preferred setups like warm light and not completely dark, which are easy to implement in daily life.
6Conclusion
Using subjective and objective measures, the overall comfort/discomfort of the users in 7 different lighting setups was recorded as well as three types of fatigues: the body fatigue, the visual fatigue as well as the cognitive fatigue. The results indicated that the strong warm light (1500 lux, 3000 K) illumination setup reduced the visual fatigue and the cognitive workload of the users, and it is correlated to the improved the comfort of the user. Regarding the measures, we identified that the eye fixation and blink durations, and scores of some questions in the CUQ are significantly correlated with comfort/discomfort, which cast a new lens on investigating the comfort/discomfort experience of the users.
Conflict of interest
None to report.
Acknowledgments
The authors wish to acknowledge Kingfar International Inc., for supporting us with experimental equipment (eye tracker and motion tracking devices) and ErgoLab 3.0 platform, and Nation Lighting Company for the illuminator and support in optical and lighting technology.
References
[1] | Eurostat. Time spent watching TV or other media, playing computer games and any similar screen activities (as main or secondary activity) [Internet]. 2018 [cited 2019 Dec 1]. Available from: http://data.europa.eu/88u/dataset/tXd0yi5T4bbzIe3iTcKKA |
[2] | Dong H , Cirillo C , Diana M . Activity involvement and time spent on computers for leisure: an econometric ana lysis on the American Time Use Survey dataset. Transportation (Amst) [Internet]. (2018) ;45: (2):429–49. Available from: http://link.springer.com/10.1007/s11116-017-9789-8 |
[3] | Mireku MO , Barker MM , Mutz J , Dumontheil I , Thomas MSC , Röösli M , et al. Night-time screen-based media device use and adolescents’ sleep and health-related quality of life. Environ Int [Internet]. (2019) ;124: :66–78. Available from: https://doi.org/10.1016/j.envint.2018.11.069 |
[4] | López-Sintas J , Rojas-DeFrancisco L , García-Álvarez E . Home-based digital leisure: Doing the same leisure activities, but digital. Bara D, editor. Cogent Soc Sci [Internet]. (2017) ;3: (1). Available from: https://www.cogentoa.com/article/10.1080/23311886.2017.1309741 |
[5] | Plantenga J , Remery C . Flexible working time arrangements and gender equality [Internet]. Publications Office of the European Union. 2010. pp. 128. Available from: http://llrc.mcast.edu.mt/digitalversion/Table_of_Contents_135508.pdf |
[6] | Thomée S , Lissner L , Hagberg M , Grimby-Ekman A . Leisure time computer use and overweight development in young adults – a prospective study. BMC Public Health [Internet]. (2015) ;15: (1):839. Available from: http://bmcpublichealth.biomedcentral.com/articles/10.1186/s12889-015-2131-5 |
[7] | The Low Vision Design Committee. Design Guideline for the Visual Environment: Version 4.3 October 2, 2013 ©National Institute of Building Sciences. National Institute of Building Sciences; 2013. |
[8] | Lin CJ , Feng WY , Chao CJ , Tseng FY . Effects of VDT workstation lighting conditions on operator visual workload. Ind Health. (2008) ;46: (2):105–11. |
[9] | Juslén H , Tenner A . Mechanisms involved in enhancing human performance by changing the lighting in the industrial workplace. Int J Ind Ergon. (2005) ;35: (9):843–55. |
[10] | European Committee for Standardization. European Standaed - EN 12464-1: Light and lighting - Lighting of work places - Part 1: Indoor work places. Vol. 1. 2020. |
[11] | Veitch J , Newsham G , Boyce P , Jones C . Lighting appraisal, well-being and performance in open-plan offices: A linked mechanisms approach. Light Res Technol [Internet]. (2008) ;40: (2):133–51. Available from: http://journals.sagepub.com/doi/10.1177/1477153507086279 |
[12] | Boyce PR , Veitch JA , Newsham GR , Jones CC , Heerwagen J , Myer M , et al. Lighting quality and office work: two field simulation experiments. Light Res Technol [Internet]. (2006) ;38: (3):191–223. Available from: http://journals.sagepub.com/doi/10.1191/1365782806lrt161oa |
[13] | Commission Internationale de L’Eclairage. CIE 213:2014 Guide to Protocols for Describing Lighting. 2014. |
[14] | Shen Y , Kuai SG , Zhou WX , Peng S , Tian M , Liu KJ , et al. Study of preferred background luminance in watching computer screen in children. Chin Med J (Engl). 2014; |
[15] | Mansfield N , Naddeo A , Frohriep S , Vink P . Integrating and applying models of comfort. Appl Ergon. (2019) ;82: (September 2019). |
[16] | Vink P , Hallbeck S . Editorial: Comfort and discomfort studies demonstrate the need for a new model. Appl Ergon. (2012) ;43: (2):271–6. |
[17] | Vink P , Bazley C , Jacobs K . Modeling the relationship between the environment and human experiences. Work. (2016) ;54: (4):765–71. |
[18] | Zhang L , Helander MG , Drury CG . Identifying Factors of Comfort and Discomfort in Sitting. Hum Factors J Hum Factors Ergon Soc. (2006) ;38: (3):377–89. |
[19] | Hiemstra-Van Mastrigt S , Meyenborg I , Hoogenhout M . The influence of activities and duration on comfort and discomfort development in time of aircraft passengers. Work. (2016) ;54: (4):955–61. |
[20] | Shahid A , Shen J , Shapiro CM . Measurements of sleepiness and fatigue. J Psychosom Res. (2010) ;69: (1):81–9. |
[21] | Kennedy HG . Fatigue and fatigability. British Journal of Psychiatry. 1988;153:1-5. |
[22] | Gawron VJ . Overview of Self-Reported Measures of Fatigue. International Journal of Aviation Psychology. 2016;26:120-131. |
[23] | Benedetto S , Drai-Zerbib V , Pedrotti M , Tissier G , Baccino T . E-readers and visual fatigue. PLoS One. (2013) ;8: (12). |
[24] | Subramanyam Malini , Muralidhara Prajwal , Muralidhara P . Mental Workload and Cognitive Fatigue A Study. IUP J Manag Res. (2013) ;XII: (2):29–39. |
[25] | Boksem MAS , Meijman TF , Lorist MM . Effects of mental fatigue on attention: An ERP study. Cogn Brain Res. 2005; |
[26] | Aryal A , Ghahramani A , Becerik-Gerber B . Monitoring fatigue in construction workers using physiological measurements. Autom Constr. (2017) ;82: :154–65. |
[27] | Davey CP . Physical exertion and mental performance. Ergonomics. 1973;16:595-9. |
[28] | Gao Q , Wang Y , Song F , Li Z , Dong X . Mental workload measurement for emergency operating procedures in digital nuclear power plants. Ergonomics. (2013) ;56: (7):1070–85. |
[29] | Ramkumar A , Dolz J , Kirisli HA , Adebahr S , Schimek-Jasch T , Nestle U , et al. User Interaction in Semi-Automatic Segmentation of Organs at Risk: a Case Study in Radiotherapy. J Digit Imaging. (2016) ;29: (2):264–77. |
[30] | Vink P , Bazley C , Kamp I , Blok M . Possibilities to improve the aircraft interior comfort experience. Appl Ergon [Internet]. (2012) ;43: (2):354–9. Available from: http://dx.doi.org/10.1016/j.apergo.2011.06.011 |
[31] | Bazley C , Nugent R . Patterns of Discomfort. J Ergon. (2016) ;5: (1):1–7. |
[32] | Corlett EN , Bishop RP . A technique for assessing postural discomfort. Ergonomics. (1976) ;19: (2):175–82. |
[33] | Hayes J r. , Sheedy J e. , Stelmack J a. , Heaney C a. , Computer use, symptoms, and quality of life. Optom Vis Sci. 2007; |
[34] | Babizhayev MA , Burke L , Micans P , Richer SP . N-acetylcarnosine sustained drug delivery eye drops to control the signs of ageless vision: Glare sensitivity, cataract amelioration and quality of vision currently available treatment for the challenging 50,000-patient population. Clin Interv Aging. (2009) ;4: (1):31–50. |
[35] | Seguí MDM , Cabrero-García J , Crespo A , Verdú J , Ronda E . A reliable and valid questionnaire was developed to measure computer vision syndrome at the workplace. J Clin Epidemiol [Internet]. (2015) ;68: (6):662–73. Available from: http://dx.doi.org/10.1016/j.jclinepi.2015.01.015 |
[36] | Hart SG , Staveland LE . Development of NASA-TLX (Task Load Index): Results of Empirical and Theoretical Research. Adv Psychol. 1988;52:139-183. |
[37] | Ramkumar A , Stappers PJ , Niessen WJ , Adebahr S , Schimek-Jasch T , Nestle U , et al. Using GOMS and NASA-TLX to Evaluate Human–Computer Interaction Process in Interactive Segmentation. Int J Hum Comput Interact [Internet]. (2017) ;33: (2):123–34. Available from: http://dx.doi.org/10.1080/10447318.2016.1220729 |
[38] | Lewis-Beck M , Bryman A , Futing Liao T . The SAGE Encyclopedia of Social Science Research Methods [Internet]. Sage Publications, Inc.; 2004. Available from: http://methods.sagepub.com/reference/the-sage-encyclopedia-of-social-science-research-methods |
[39] | Goldberg JH , Kotval XP . Computer interface evaluation using eye movements: Methods and constructs. Int J Ind Ergon. 1999; |
[40] | Kuijt-Evers LFM , Bosch T , Huysmans MA , de Looze MP , Vink P . Association between objective and subjective measurements of comfort and discomfort in hand tools. Appl Ergon. (2007) ;38: (5):643–54. |
[41] | Bachynskyi M , Palmas G , Oulasvirta A , Steimle J , Weinkauf T . Performance and Ergonomics of Touch Surfaces. Proc 33rd Annu ACM Conf Hum Factors Comput Syst - CHI ’15 [Internet]. (2015) ;(May 2016):1817–26. Available from: http://dl.acm.org/citation.cfm?doid=2702123.2702607 |
[42] | Yamada Y , Kobayashi M . Detecting mental fatigue from eye-tracking data gathered while watching video: Evaluation in younger and older adults. Artif Intell Med. (2018) ;91: :39–48. |
[43] | Shriram R , Sundhararajan M , Daimiwal N . EEG Based Cognitive Workload Assessment for Maximum Efficiency. IOSR J Electron Commun Eng [Internet]. 2018;2278-834. Available from: https://pdfs.semanticscholar.org/8643/08072431db6fda1268548ab93255c53ab5a5.pdf |
[44] | Inanici MN . Evaluation of high dynamic range photography as a luminance data acquisition system. Light Res Technol. (2006) ;38: (2):123–36. |
[45] | Inertia Technology B.V. ProMove MINI [Internet]. 2019. Available from: http://inertia-technology.com/product/motion-capture-promove-mini/ |
[46] | Tobii. Tobii Pro X2 eye tracker [Internet]. 2019. Available from: https://www.tobiipro.com/product-listing/tobii-prox2-30/ |
[47] | Bronkhorst RE , Krause F . Designing comfortable passenger seats. In: Vink P , editor. Comfort and Design: Principles and Good Practice. CRC Press; (2005) . pp. 155–68. |
[48] | Scikit-learn. MinMaxScaler [Internet]. 2019. Available from: https://scikit-learn.org/stable/modules/generated/sklearn.preprocessing.MinMaxScaler.html |
[49] | Ramkumar A , Stappers PJ , Niessen WJ , Adebahr S , Schimek-Jasch T , Nestle U , et al. Using GOMS and NASA-TLX to Evaluate Human–Computer Interaction Process in Interactive Segmentation. Int J Human–Computer Interact. (2017) ;33: (2):123–34. |
[50] | Seaborn. violinplot [Internet]. Available from: https://seaborn.pydata.org/generated/seaborn.violinplot.html |
[51] | Mansfield N , Sammonds G , Darwazeh N , Massoud S , Patel T , Sehdev A . Movement analysis to indicate discomfort in vehicle seats. Proc. 1st International Comfort Congress. 2017;1-6. |
[52] | Hughes A , Wilkens T , Wildemuth BM , Marchionini G . Text or pictures? An eyetracking study of how people view digital video surrogates. Lect Notes Comput Sci (including Subser Lect Notes Artif Intell Lect Notes Bioinformatics). (2003) ;2728: :271–80. |
[53] | Eccleston C , Crombez G . Pain demands attention: A cognitive-affective model of the interruptive function of pain. Psychol Bull. (1999) ;125: (3):356–66. |
[54] | Hiemstra-van Mastrigt S . Comfortable Passengers Seats. Recommendation for design and Research. Doctoral thesis, TU Delft. 2015. pp. 307. |
[55] | Schleicher R , Galley N , Briest S , Galley L . Blinks and saccades as indicators of fatigue in sleepiness warnings: looking tired? Ergonomics [Internet]. (2008) ;51: (7):982–1010. Available from: https://www.tandfonline.com/doi/full/10.1080/00140130701817062 |
[56] | Berman S . Comment 2 on ‘The impact of spectral power distribution on the performance of an achromatic visual task’ by PR Boyce,YAkashi,CMHunter and JD Bullough. Light Res Technol [Internet]. (2003) ;35: (2):157–9. Available from: http://journals.sagepub.com/doi/10.1177/136578280303500210 |
[57] | Veitch JA , Newsham GR . Preferred luminous conditions in open-plan offices: research and practice recommendations. Light Res Technol [Internet]. (2000) ;32: (4):199–212. Available from: http://lrt.sagepub.com/cgi/doi/10.1177/096032710003200404 |
[58] | Schlangen L . Workplace illumination effects on acuity corgnitive performance and well-being in older and young people. Proc 28th CIE Sess (CIE 2162015). (2015) ;(August):87–95. |
[59] | Cajochen C , Frey S , Anders D , Späti J , Bues M , Pross A , et al. Evening exposure to a light-emitting diodes (LED)-backlit computer screen affects circadian physiology and cognitive performance. J Appl Physiol [Internet]. (2011) ;110: (5):1432–8. Available from: https://www.physiology.org/doi/10.1152/japplphysiol.00165.2011 |
[60] | Sheppard AL , Wolffsohn JS . Digital eye strain: prevalence, measurement and amelioration. BMJ Open Ophthalmol. (2018) ;3: (1):e000146. |
[61] | Linhart F , Scartezzini JL . Evening office lighting - visual comfort vs. energy efficiency vs. performance? Build Environ. (2011) ;46: (5):981–9. |
[62] | Dillon A . Reading from paper versus screens: A critical review of the empirical literature. Ergonomics. (1992) ;35: (10):1297–326. |
[63] | Smulders M , Berghman K , Koenraads M , Kane JA , Krishna K , Carter TK , et al. Comfort and pressure distribution in a human contour shaped aircraft seat (developed with 3D scans of the human body). Work. (2016) ;54: (4):925–40. |
[64] | Sammonds GM , Fray M , Mansfield NJ . Effect of long term driving on driver discomfort and its relationship with seat fidgets and movements (SFMs). Appl Ergon. (2017) ;58: :119–27. |


