
Employment effects for people with disabilities after participation in vocational training programmes: A cohort analysis using propensity score matching
Abstract
BACKGROUND:
Vocational rehabilitation (VR) aims to help people with disabilities to return to the labour market. Though, there is not much evidence on its effectiveness.
OBJECTIVES:
We explore the effect of vocational training programmes in VR and the VR status itself on employment outcomes.
METHODS:
Using two samples from administrative data by the German Federal Employment Agency, we applied propensity score matching. We followed rehabilitants commencing VR in 2009/2010 (N = 7,905) for four years (comparison I) and general training participants with and without VR status completing training in 2012/2013 (N = 21,020) for one year (comparison II). For harmonisation purposes, we only considered individuals aged between 25 and 40 and excluded those in employment at the beginning of VR or training.
RESULTS:
Concerning the effect of training in VR (comparison I), we observe a lock-in effect during training (p < 0.001) due to an involvement in VR; after training, participants are more likely to obtain unsubsidised employment (0.05, p < 0.05) than non-participants, but there is no statistically significant income difference after four years. Regarding the effect of the VR status (comparison II), rehabilitants are more likely to take up (un-)subsidised employment (0.04, p < 0.01; 0.02, p < 0.001) after training, exhibit longer employment durations (19 days, p < 0.001) and achieve higher average incomes (2,414 euro/year, p < 0.001) compared to non-rehabilitants.
CONCLUSIONS:
Training participation helps to improve employment participation of rehabilitants. However, a longer observation period is recommended. Furthermore, the VR status itself leads to more sustainable and better-paid employment. This is due to more comprehensive support and longer-term subsidised employment opportunities.
1Introduction
People with disabilities are highly disadvantaged in terms of labour force participation compared to people without disabilities. Besides the positive (economic and health-related) effects of employment for people with disabilities, like e.g. social security contributions, feelings of belonging and societal purpose [1, 2], there is additional evidence for organisations that hiring people with disabilities can have positive effects on, e.g. firm profitability, work culture and competitiveness [3].
In this context, vocational rehabilitation (VR) is designed to develop and restore the ability to work and increase employment prospects for people with disabilities in Germany. However, there are very few studies that confirm that VR improves employment chances [4, 5], though VR and especially vocational training programmes are very cost-intensive for the welfare state and time intensive for the participants.
1.1Study focus
In this study, we focused on the VR clientele of the Federal Employment Agency (FEA) as one of the main financers of VR in Germany.
Furthermore, we focused on persons with disabilities, who participated in VR and had at least three years of working experience. The biggest part of them experienced illness or disability during their working lives and they need support to continue their occupation or find a new one [6].
Within a prior paper, we discussed for whom and when vocational training programmes helped to bring persons with disabilities into (sustainable) employment [7]. Based on event history analyses, the results showed that 70 percent of training participants in VR found (sustainable) employment often directly after VR completion. However, persons with psychological disabilities showed in comparison to people with other disabilities the lowest employment level after VR. Furthermore, sex, age, labour market status at the beginning of VR and the regional labour market were relevant predictors of individual employment chances.
In order to extent these results and to identify an effect of participation in vocational training programmes and of VR status on employment chances, we focused within the present study explicitly on vocational training programmes as one of the most cost- and time-intensive and widely used programme for unemployed persons inside and outside of VR.
We constructed two comparison groups. On the one hand, vocational training is used as a central programme within VR. Thus, we could compare persons in VR who participated in vocational training programmes to those that did not participate (comparison I). Furthermore, as unemployed with and without disabilities receive vocational training programmes, we had the opportunity to compare training participants in and outside of VR (comparison II). In the first case, we were interested in the effect of participation in vocational training programmes of persons in VR on their employment chances in terms of taking up unsubsidised or marginal employment, employment duration and income level. In the second case, we were interested in the effect of VR status of unemployed in vocational training programmes on individual employment chances where additionally subsidised employment is considered.
In the following sections, we define our understanding of disability, describe the quite complex German system of VR and characterise vocational training programmes. In this context, we give some background information regarding our two comparison groups.
1.2VR process: Financers, eligibility and programme determination
In Germany, the (financial) responsibility for VR is shared by mainly three federal institutions: the Statutory Pension Insurance (SPI), the Statutory Accident Insurance and the Federal Employment Agency. The following analyses focused on the FEA, which is mainly responsible for people who have been in employment covered by social security contributions for less than 15 years and for others who cannot be financed by other institutions.
1.3Eligibility for VR and recognition procedure
Eligibility for VR is connected to the definition of disability found in Section 2 [1] of Book IX of the German Social Code:
“[...] a person has a disability if they have a physical, psychological, intellectual or sensory impairment that, in interaction with attitudinal and environmental barriers, is highly likely to impair their equal participation in society for longer than six months. A person has an impairment if their physical and health condition falls short of that typical for their age. A person is at risk of disability if such an impairment is to be expected.” (8, p. 36)
The medical or psychological service of the FEA first must assess the individual need for VR. These disability-specific needs are known as the VR status. The person granted VR status is called a vocational rehabilitant. Based on medical and psychological reports, a VR counsellor at the FEA - specialised in the placement of ill or disabled people - verifies whether a person is eligible to be granted VR status due to having a health issue and corresponding limitations that prevent him or her from practising their occupation and performing the tasks involved – whether they are currently employed or not [5, 9]. To be eligible for VR, it is not necessary to have disability status, though a person with disability status has a better chance of receiving VR status [9]. Participation in VR is voluntary for the person, but if they are eligible and willing to participate in VR, the VR counsellor is legally obliged to assert the VR status [9].
When the VR status has been confirmed by the VR counsellor, the most promising programme for labour market integration should be chosen, e.g. technical assistance, such as ramps or braille keyboards, programmes in sheltered workshops, supported employment, vocational orientation programmes and/or vocational training. Depending on the level of support required and the regional labour market situation, the VR counsellor makes decisions regarding additional disability-specific support within qualifying programmes, like vocational training programmes, and the type of service provider to be involved [7, 10].
1.4Non-participation in VR
The FEA supports unemployed with and without health issues. Unemployed without disabilities are counselled and placed by general departments of the FEA, persons with disabilities and chronic illnesses need to be directed to VR departments within the FEA. Therefore, in many cases, no application for VR may have been submitted because general case managers at the FEA were unaware that the client might be a case for the VR department [9, 11]. Furthermore, general case managers might have been aware of health limitations but did not assess the chances of the individual being accepted into VR as particularly high; for example health limitations might not be serious enough in that they comprehensively hinder employment participation or the client’s health might not be stable enough to participate in VR [9]. Besides, there is qualitative evidence for Germany suggesting that despite a disability or health impairment, some individuals refrain from applying for VR either to avoid stigma or income loss, or because suitable programmes are unavailable or inaccessible [11].
1.5Vocational training programmes
At the FEA vocational training programmes are widely used instruments to place unemployed persons with and without disabilities into the labour market. The strategic goal for unemployed with and without disabilities is somehow different. Unemployed without disabilities mainly seek improvement in their cultural capital – because their qualifications might be out-dated or too low and they might lack certain certificates that are required by the labour market [12].
While rehabilitants moreover require a new occupational perspective and a task that is compatible with their illness. Within VR, first, within assessment programmes rehabilitants’ strengths and interests are identified; second, vocational training programmes are implemented that are based on these assessments. Certificates prove the acquisition of new occupational skills and in-firm internships provide promoted with contacts to companies where labour market integration can be achieved [7].
In general, vocational training programmes for both groups can be differentiated into those that are available to all clients of the FEA (unemployed and rehabilitants) (“general programmes”) and those that are “disability-specific”, i.e. vocational training programmes intended solely for rehabilitants. Disability-specific training programmes often have the same curriculum as general training programmes but provide additional disability-specific support (e.g. psychological, socio-educational support; are organised at service providers that are specialised for persons with (specific) disabilities) [7].
Furthermore, there are different types of vocational training programmes with different learning objectives and differences in certification. Further training (certified and uncertified) refers to programmes to refresh existing basic and occupational skills or to adapt them to new technical developments, while occupational retraining encompasses all types of skill development in a completely new occupation. Retraining is often certified and can be compared to the three-year vocational training programme in the context of initial vocational education in Germany; however, it is usually reduced to about two years since the participants already have vocational skills to build on. Further training is considerably shorter and varies in duration, content and objective, but does not usually last longer than one year [7]. Both types of vocational training may be conducted by service providers specialised in training people with and without disabilities. The participants generally learn theoretical and practical skills at these institutions and undergo on-the-job training; on-the-job training is furthermore organised in the form of internships at companies in order to get in contact with potential employers. However, there are many different constellations for training arrangements, for example when the service provider is responsible for psychological and socio-educational support and the actual training is undertaken at a company in cooperation with a vocational school [10]. In the following, the different types of training are summarized as “training programmes”.
1.6Relevant structural developments in VR funded by the FEA
For the FEA context, there have been some changes in the population structure of VR in recent years that are worth mentioning. The numbers particularly refer to the comparison groups we have constructed in the context of our study design, enhance the practical relevance of the study and give the reader an idea of the population supported within VR.
An increasing number of rehabilitants were accepted: in 2010, 21,552 individuals were accepted into VR. This number increased continuously to 26,312 persons in 2015 [6].
More rehabilitants accepted into VR did not subsequently participate in any programme: in 2010 they accounted for 24 percent of those accepted into VR, whereas by 2015 there were already 30 percent not taking part in a programme afterwards [6].
Fewer rehabilitants participated in training programmes: 29 percent of rehabilitants in the 2010 VR-cohort were training participants, compared to 23 percent in 2015 [6].
2Current state of research
Concerning our first study aim to identify the employment effect of participation in training programmes, previous studies have shown that training programmes improve the employment prospects of displaced workers and the unemployed [12, 13]. However, there is no general understanding of how effective training programmes are for people with disabilities and why they are effective. Some studies have observed the employment transitions of people with disabilities after VR, but many of them focused on programmes that did not involve training, e.g. supported employment [14, 15], or did not identify a causal effect [7]. Furthermore, some studies from Sweden and Norway identify causal effects for VR and rank the effectiveness of specific programmes. Fröhlich et al. [16] for Sweden and Markussen [17] for Norway find more positive employment effects of workplace training than for vocational training that is not organised at a company or workplace. In this context, there are two studies for Germany that focus specifically on training programmes and a causal framework. One of these studies compared different training arrangements, in terms of duration and certification [18] and found that one-year training was superior to two-year training arrangements. No general effect of training was identified. In order to determine the effect of training participation compared to discontinued training, another recent study [4] identified a positive employment and income effect for those who completed their training. Despite the existence of these studies, they are difficult to compare to our study. First, the studies set a different focus with their comparison groups, as they compare participants in different types of training programmes and individuals dropping out of training to those completing the training programmes. Second, both studies focus on people whose VR was funded by the SPI. It is important to note that there are considerable differences between people in programmes funded by the FEA and those funded by the SPI: rehabilitants supported by the FEA are younger, better educated and are more likely to start VR following a period of unemployment. They are also more often diagnosed with psychological health issues and less frequently with musculoskeletal illnesses. Rehabilitants supported by the FEA are mainly allocated to vocational training programmes, whereas the SPI generally provides rehabilitants with technical assistance [19].
In contrast to those studies mentioned above, we focus on rehabilitants supported by the FEA and use rehabilitants who did not participate in any programme as a comparison group.
Furthermore, we add to the discussion of the VR effect itself. Concerning this second study aim, to our knowledge no study has yet investigated the effect of being granted VR status on employment outcomes (or other outcomes), as none compares participants in the same programme with different privileges as in our case. There are studies that evaluate VR and compare the employment effects of different programmes to non-participation in VR. Some of these studies find no differences [16] and some find no effect for men but cautious positive effects for women [20]; others find positive employment effects for granted VR status compared to those rejected/withdrawn from the VR application [5]. Due to differences in methodological approaches, data and sample restrictions, time frames and the rehabilitation systems surveyed, the results of these studies are not easy to compare with those obtained in our study.
3Material and methods
3.1Study design
This study had two aims. First, we aimed to compare effects of participation in training programmes on rehabilitants’ employment outcomes. Second, we aimed to clarify the effect of VR status for participants in training programmes. To assess the effects of participation in training programmes, we first compared rehabilitants that participated in training to rehabilitants who were not participating in any programme during VR (comparison I). Second, to identify the effect of VR status for participants in training programmes, we compared rehabilitants to unemployed who had health impairments but did not apply for VR status (comparison II). Participants in training programmes with VR status were eligible for additional support including intensive counselling and generous employment subsidy provided by the local employment agency.
To identify the effects of training (comparison I)/VR status (comparison II) on employment outcomes, we would ideally compare different states of the same person at the same point in time, for example the likelihood of being employed with training/VR status and the likelihood of being employed without training/VR status. However, it is clearly not possible to observe the person in two mutually exclusive states [18]. We addressed this issue by applying the method of propensity score matching (PSM) [21] to rich and representative administrative data of the FEA. By using PSM, we can identify non-participants who are comparable in observed characteristics to participants. As outcomes we used the take up of (un-)subsidised and marginal employment, the duration of employment and the level of income.
3.2Data
To achieve the two study aims, we used representative VR-specific administrative data (German Reha-Process Data Panel (RehaPro)) which allowed to evaluate various VR programmes. RehaPro was established within a large research project financed by the German Federal Ministry of Labour and Social Affairs [22, 23]. RehaPro combined different sources from the different FEA-registers (employment register, unemployment register, VR register) and contained information on time spent in (un-)employment, in long-term illness, and participating in labour market programmes and included specific information on the VR process. The data set comprised all individuals who applied to the FEA for VR between 2006 and 2015 [24].
3.3Comparison groups
The choice of comparison groups is one crucial part of every evaluation, influencing the focus of the analysis and the interpretation of the results. We used two comparison groups as shown in Fig. 1.
Fig.1
Overview of observed comparison groups.
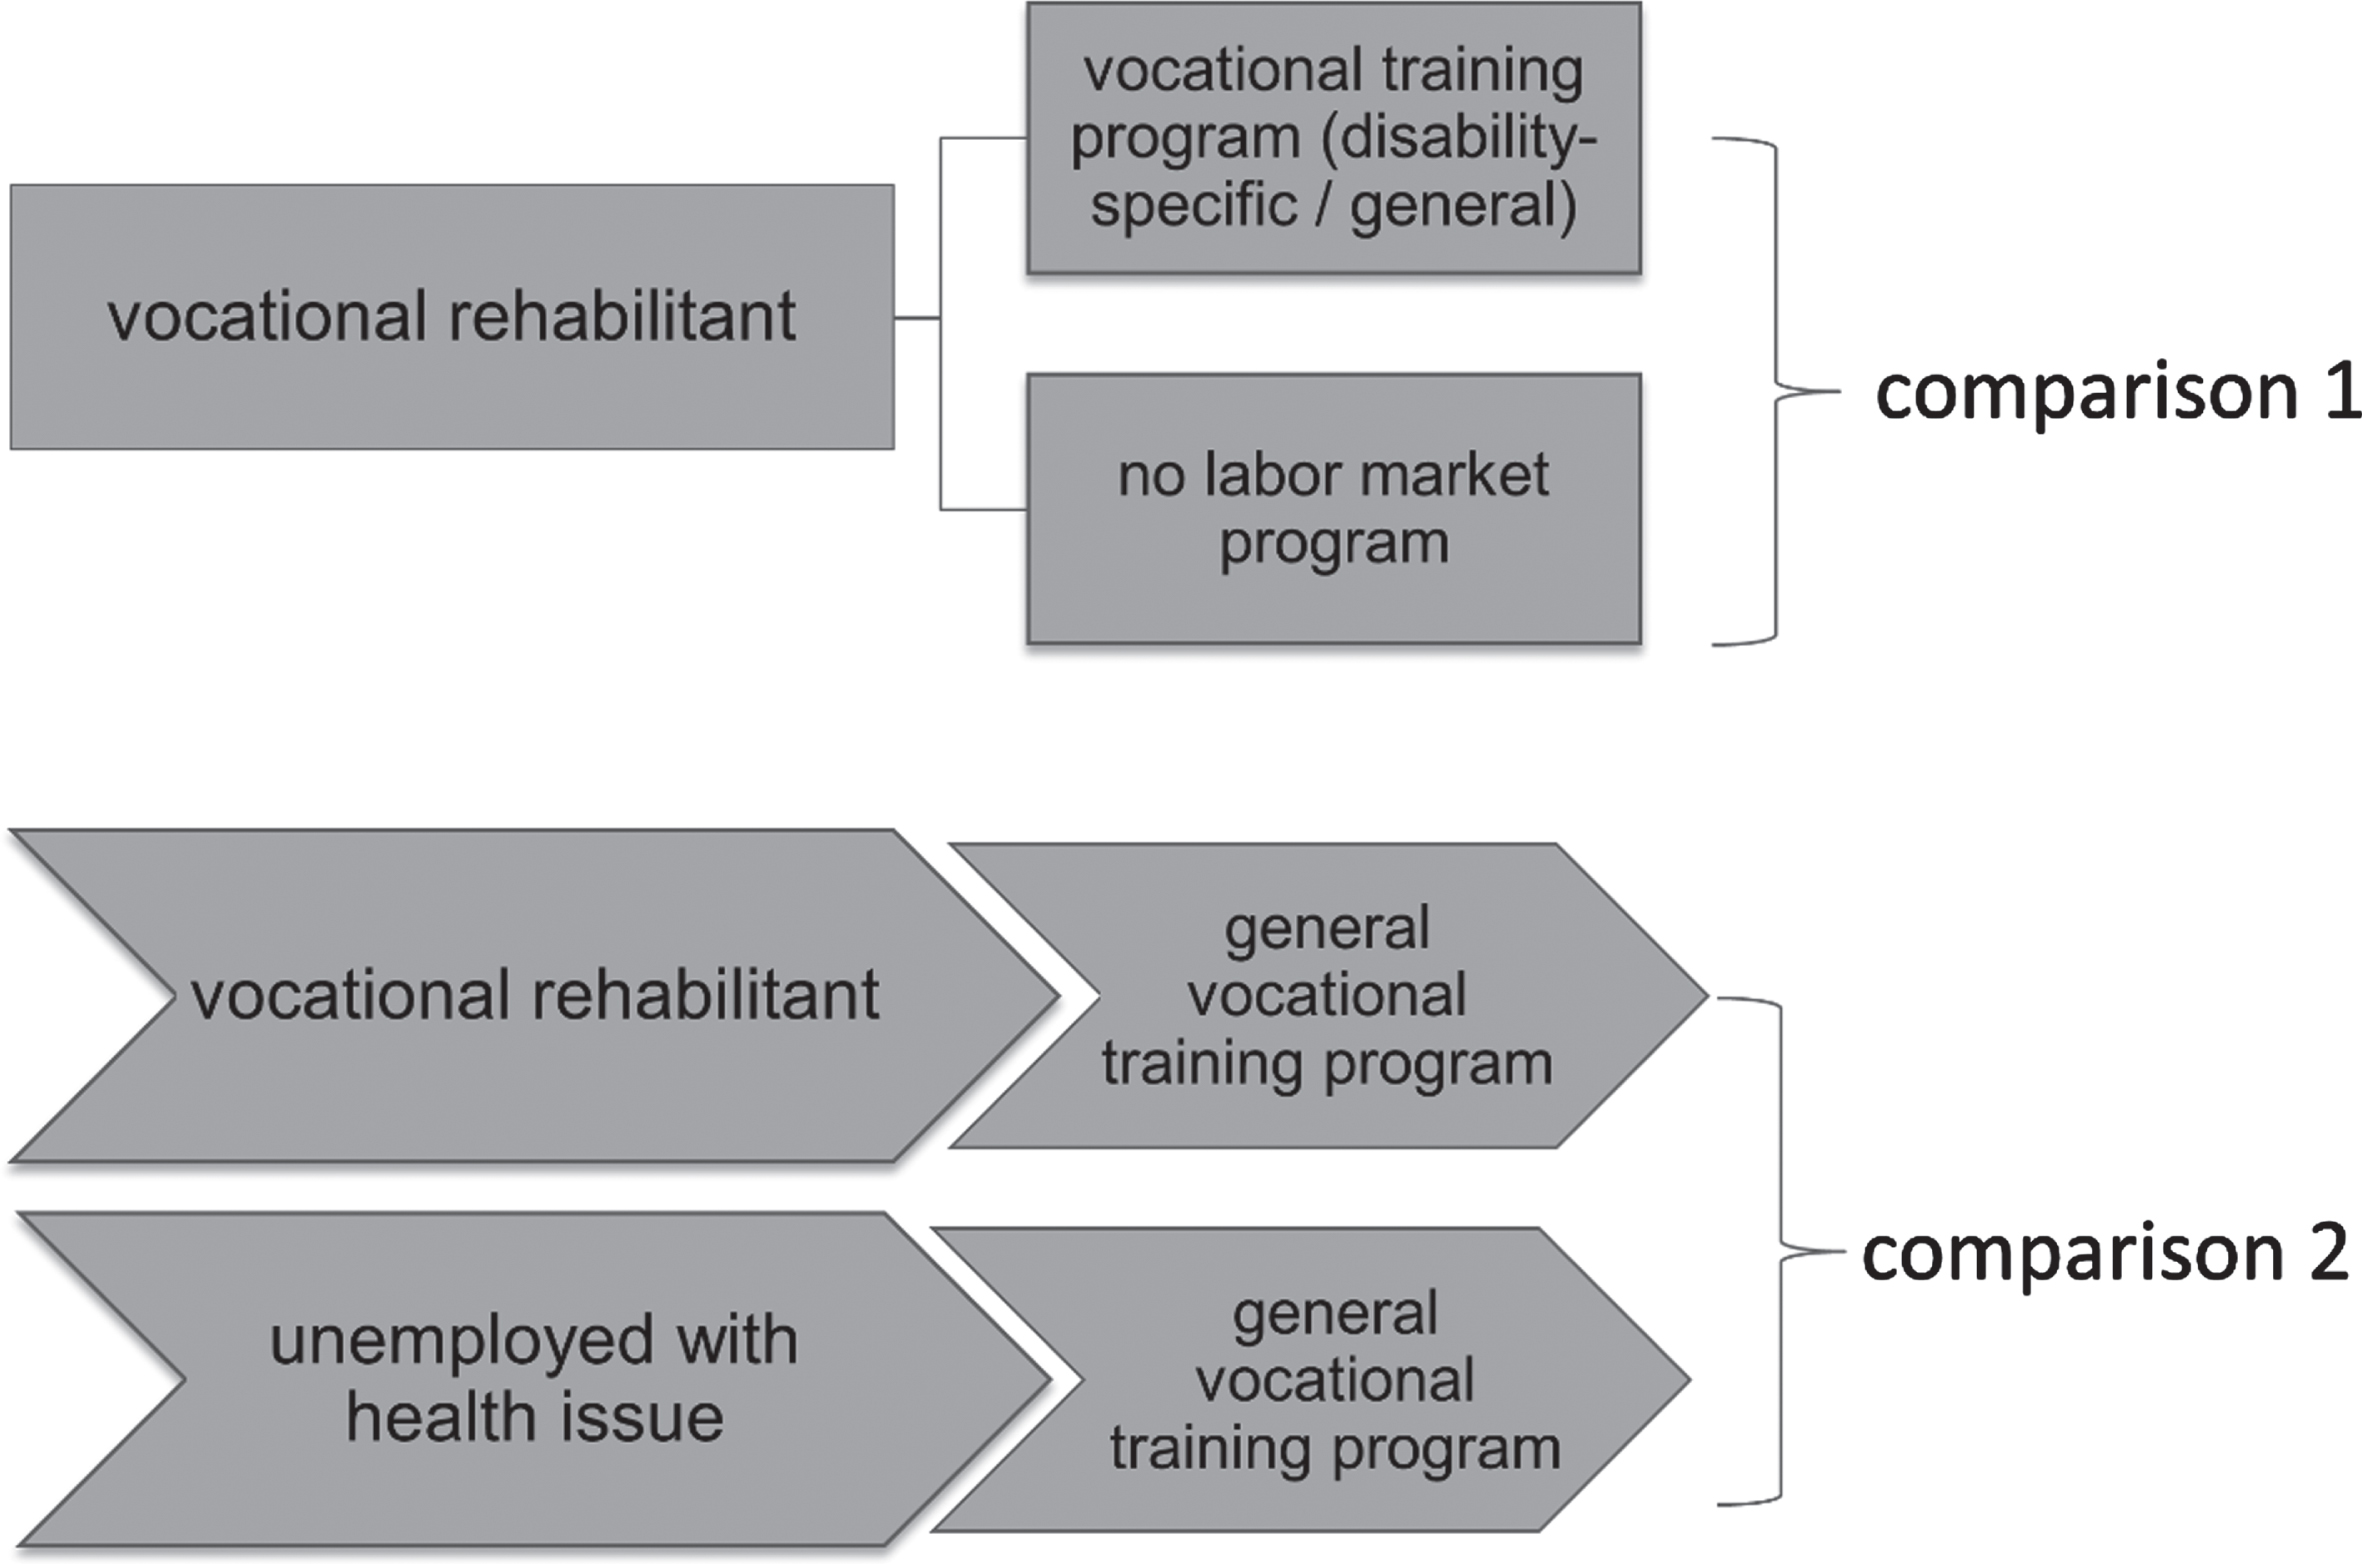
In the first comparison group we compared rehabilitants participating in general or disability-specific training programmes to rehabilitants not participating in any programme. The treatment and comparison groups, each comprising people who were granted VR status between 2009 and 2010, differed with regard to their programme participation. We were therefore able to identify the effect of programme participation.
With the second comparison group, participants in general training programmes (completed between 2012 and 2013) with and without VR status were compared. To form the second comparison group, we added persons who were registered with the FEA as unemployed and were participating in the same training programmes as people with VR status by linking the RehaPro data set with the “general” administrative records of the FEA, the Integrated Employment Biographies (IEB) [25]. Thus, individuals who had applied for VR and been granted VR status were compared with unemployed people who had not applied for VR (non-rehabilitants) but participated in the same programme. In order to include some health characteristics for the control group in comparison II, those without VR status were restricted to those that were marked by the general case manager as person with “health conditions relevant for placement”. As explained in section 1, there is reason to believe that some people with such health conditions may be entitled to VR but lack information about entitlement or are unwilling to participate in VR or that general case managers do not assess their chances of acceptance into VR to be particularly high. In fact, these people with registered health conditions have never applied for VR. This second comparison identifies the effect of the VR status on employment participation.
3.4Sample restrictions
With respect to both comparison groups, we only considered individuals aged between 25 and 40 for two reasons: first, to avoid individuals for whom disability pensions are an alternative option after job loss, and second, because the average age of the second comparison group was significantly higher. To harmonise the two samples and ensure homogeneity to a certain extent, we also excluded individuals who were employed in a job covered by social security when participating in VR or a training programme. This restriction is necessary in order to ensure that we do not observe rehabilitants who were not taking part in programmes because they had returned to their previous employer. This would bias the results. Furthermore, we restricted the analysis and both comparison groups to those that had finished the training programme successfully and did not drop-out earlier.
Table 1
Population description (before matching); quality of balancing in comparison I (rehabilitants with and without participation in training)
| Covariates | Categories | Comparison I | |||||
| Means (before matching) | Standardised differences | Variance ratio | |||||
| Control | Treated | Raw | Matched | Raw | Matched | ||
| Sex | Male | 0.55 | 0.62 | 0.134 | 0.003 | 0.953 | 0.999 |
| Age (at time of acceptance) | 30.34 | 29.89 | –0.116 | –0.028 | 0.863 | 0.989 | |
| Age^2 | 936.66 | 907.32 | –0.120 | –0.027 | 0.844 | 0.982 | |
| Local unemployment rate | 9.02 | 9.74 | 0.189 | –0.007 | 1.071 | 1.040 | |
| Days of long-term sickness | 106.61 | 93.00 | –0.091 | –0.010 | 0.933 | 1.198 | |
| Labour market status | On job search / in programme | 0.16 | 0.17 | ||||
| Household on basic income support | 0.25 | 0.31 | 0.120 | –0.009 | 1.123 | 0.993 | |
| Unemployment benefit recipient | 0.40 | 0.41 | 0.021 | 0.006 | 1.008 | 1.002 | |
| Marginally employed | 0.19 | 0.11 | –0.221 | –0.020 | 0.641 | 0.952 | |
| Vocational education | No qualification | 0.07 | 0.04 | ||||
| Vocational training | 0.73 | 0.76 | 0.060 | 0.037 | 0.934 | 0.958 | |
| Technical / vocational school | 0.11 | 0.12 | 0.036 | –0.024 | 1.089 | 0.947 | |
| College / university | 0.09 | 0.09 | –0.002 | –0.033 | 0.994 | 0.910 | |
| Place of residence Disability status | Living in eastern Germany | 0.20 | 0.28 | 0.193 | –0.011 | 1.268 | 0.990 |
| Severely disabled (or equivalent status) | 0.01 | 0.01 | –0.018 | –0.011 | 0.850 | 0.906 | |
| Women#east | 0.10 | 0.11 | 0.050 | –0.012 | 1.140 | 0.971 | |
| Age#men | 47.02 | 48.34 | 0.083 | –0.008 | 0.941 | 0.998 | |
| Local unemployment rate#east | 11.81 | 13.65 | 0.199 | –0.004 | 1.195 | 1.023 | |
| N (total; control + treated) | 7,905 (raw) | 13,164 (matched) | |||||
| N (control) | 1,323 (raw) | 6,582 (matched from 1,185 observations) | |||||
| N (treated) | 6,582 (raw) | 6,582 (matched) | |||||
| Mean bias (after matching) | 1.6 | ||||||
Data source: RehaPro, own calculations.
3.5Outcomes
We used different outcomes to measure labour force participation. In the first comparison group (effect of programme participation), we distinguished between two types of employment: unsubsidised (regular employment) and marginal employment (part-time employment with a salary not exceeding 450 euro per month). Second, we compared the number of days worked (per year) and the mean yearly income (both from paid work and social benefits) for participants and non-participants. The outcomes were measured one, two, three and four years after the individual received VR status.
The same outcome variables were used in the second comparison (effect of VR status). Furthermore, subsidised employment (where wage subsidies - a type of labour market programme - are paid by the FEA) was used as an additional outcome. However, we only started comparing the individuals after they had completed the training programme. First, we could not identify a date of acceptance among non-rehabilitants, and second, we were interested in the effects of VR status on training programme participants. Hence, we followed participants for one year after programme completion.
3.6Confounders
Based on results from previous studies on VR acceptance and rehabilitants’ selection into training programmes and the description of their employment outcomes [7, 9], we considered the following confounders as relevant explanatory variables for the selection to VR and the selection to training programmes: sex, age, vocational education, disability status, employment status before VR or training programme, place of residence, days in longer illness before VR or training programme (> 6 weeks: in Germany, sick pay is paid by the employer for the first six weeks. For sick leave exceeding six weeks, health insurance covers approximately 70 percent of the usual income [26]) and the local unemployment rate.
Table 2
Population description (before matching) and quality of balancing in comparison II (rehabilitants and non-rehabilitants with health conditions participating in the same general training programme)
| Covariates | Categories | Comparison II | |||||
| Means (before matching) | Standardised differences | Variance ratio | |||||
| Control | Treated | Raw | Matched | Raw | Matched | ||
| Sex | Men | 0.63 | 0.59 | –0.083 | 0.008 | 1.039 | 0.997 |
| Age (at time of acceptance) | 33.29 | 30.53 | –0.665 | 0.012 | 0.774 | 1.012 | |
| Age^2 | 1127.48 | 947.01 | –0.672 | 0.013 | 0.705 | 1.011 | |
| Local unemployment rate | 9.10 | 8.79 | –0.081 | –0.010 | 1.048 | 1.045 | |
| Days of long-term sickness | 106.96 | 91.64 | –0.100 | 0.061 | 0.706 | 0.966 | |
| Labour market status | No prior status | 0.48 | 0.64 | ||||
| On job search | 0.11 | 0.08 | –0.097 | –0.013 | 0.769 | 0.963 | |
| Household on basic income support | 0.18 | 0.08 | –0.289 | –0.012 | 0.508 | 0.963 | |
| Unemployment benefit recipient | 0.24 | 0.19 | –0.100 | –0.022 | 0.870 | 0.968 | |
| Marginally employed | 0.03 | 0.01 | –0.131 | 0.011 | 0.424 | 1.101 | |
| Programme participation | 0.02 | 0.02 | 0.067 | –0.011 | 1.604 | 0.934 | |
| Vocational education | No qualification | 0.38 | 0.03 | ||||
| Vocational training | 0.54 | 0.78 | 0.516 | 0.042 | 0.690 | 0.947 | |
| Technical / vocational school | 0.04 | 0.12 | 0.293 | –0.031 | 2.636 | 0.932 | |
| College / university | 0.03 | 0.07 | 0.169 | –0.017 | 2.086 | 0.943 | |
| Place of residence Disability status | Living in eastern Germany | 0.24 | 0.23 | –0.012 | 0.010 | 0.986 | 1.013 |
| Severely disabled (or equivalent status) | 0.14 | 0.08 | –0.184 | –0.021 | 0.623 | 0.937 | |
| Men#east | 0.09 | 0.10 | 0.047 | 0.001 | 1.138 | 1.004 | |
| Age#men | 54.33 | 48.54 | –0.344 | 0.015 | 0.831 | 1.016 | |
| Age#east | 41.10 | 37.65 | –0.243 | 0.016 | 0.865 | 1.035 | |
| East#severely disabled | 0.20 | 0.22 | 0.035 | 0.015 | 1.051 | 1.022 | |
| Status before programme start#age | 47810.85 | 33161.10 | –0.234 | –0.018 | 0.914 | 0.987 | |
| N (total; control + treated) | 21,020 (raw) | 13,530 (matched) | |||||
| N (control) | 14,255 (raw) | 6,765 (matched) | |||||
| N (treated) | 6,765 (raw) | 6,765 (matched) | |||||
| Mean bias (after matching) | 1.3 | ||||||
Data source: RehaPro; IEB, own calculations.
3.7Statistical analysis
We applied PSM methods to conduct the comparison. PSM identifies the most similar comparison partners within the treatment and comparison groups with respect to factors influencing the probability of the treatment. Our analysis consisted of three steps. First, the probability of rehabilitants being assigned to training programmes (comparison I) and the probability of participants being granted VR status (comparison II) were calculated by means of probit regression models. The confounders described above served as predictors in the probit regressions. In accordance with Rosenbaum and Rubin [27], we applied an iterative approach to specify our propensity score model and modified it to avoid important residual systematic differences between the treatment and control groups. For this purpose, we conducted several probit models, cf., adding different interaction terms until systematic differences in the confounders of the treatment and control groups were reduced to an acceptable level [28–30]. We used bivariate statistics and compared the bias of the matched and unmatched samples to check the balancing of the comparison populations. Tables 1 and 2 show the standardised differences and the respective variance ratio for the raw and matched samples for comparisons I and II. The differences for each covariate for the matched samples are practically zero, and the variance is practically 1. This suggests a well-balanced sample for both comparison groups [31].
In a second step, the obtained propensity scores were used to identify the most similar partners in the comparison group (nearest neighbour 1 to 1 match; with replacement). We matched each member of the treatment group with the most similar member of the respective control group in terms of their estimated probability of participation/status recognition (propensity score). Matching with replacement reduces bias to a greater extent (compared to the use of matching without replacement) and entails that each case or observation from the comparison group can be matched more than once [32]. Matching with replacement should not pose a problem in comparison II, where the control group is much bigger than the treatment group, but may lead to an increase in measurement error in comparison I, because the control group is much smaller than the treatment group. In order to test the sensitivity of the results, we also estimated an inverse probability weighting model, where the observations are weighted according to their propensity score. The results suggest that our results are reasonably robust and we achieved a good balance of covariates.
Furthermore, we experimented with different caliper sizes - the maximum distance for which two observations from the treatment and the control group are potential neighbours [32]. At the end, we applied a very small caliper of 0.005, to avoid matching with nearest neighbours whose propensity scores still differed considerably (by more than the caliper) from those of the treated individuals. Correspondingly, we excluded a small number of outliers for whom no comparison partners could be found (in comparison I, less than 1 percent was excluded; in comparison II, the threshold was approximately 4 percent).
In the final step, the average treatment effect on the treated participants was identified, i.e., “the mean effect for those who actually participated in the programme” (33: p. 605).
The matching analyses as well as the post-esti-mation and balancing were conducted using the teffects psmatch command in Stata 15 (College Station, TX, USA). We used teffects psmatch instead of psmatch2 as the teffects psmatch command accounts for the circumstance that propensity scores are not known but are estimated when standard errors are calculated [31, 34]. Before matching, the members of the treatment and control groups differed significantly from each other. These differences disappeared after applying PSM. The mean bias after matching was identified using the psmatch2 command; for the first comparison group it was 1.3 and for the second comparison group it was 1.6 (Tables 1 and 2) [21].
3.8Characteristics of the two populations
The first comparison group consisted of 7,905 individuals who had been granted VR status in 2009 or 2010. The treatment group comprised 6,582 rehabilitants who started training programmes afterwards. The programmes lasted approximately two years on average. The control group comprised 1,323 rehabilitants who did not participate in any programme. After matching, 1,185 persons from the control group had to serve as matches several times (see 3.7) in order to match 6,582 individuals from the treatment group to 6,582 individuals from the control group (Tables 1 and 3).
Table 3
Base levels and effect of programme participation in comparison I (rehabilitants with and rehabilitants without participation in any programme)
| Outcomes | Comparison I | ||||||
| Rehabilitants with programme participation (treated) | Rehabilitants without programme participation (control) | Difference | s.e. | Significance level | |||
| Taking up unsubsidised employment | 1 year after VR acceptance | Unmatched | 7% | 44% | –0.37 | (0.01) | |
| ATT | 7% | 42% | –0.35 | (0.02) | *** | ||
| 2 years after VR acceptance | Unmatched | 18% | 53% | –0.35 | (0.01) | ||
| ATT | 18% | 51% | –0.33 | (0.02) | *** | ||
| 3 years after VR acceptance | Unmatched | 49% | 58% | –0.09 | (0.02) | ||
| ATT | 49% | 55% | –0.07 | (0.02) | ** | ||
| 4 years after VR acceptance | Unmatched | 65% | 62% | 0.03 | (0.01) | ||
| ATT | 65% | 60% | 0.05 | (0.02) | * | ||
| Taking up marginal employment | 1 years after VR acceptance | Unmatched | 12% | 16% | –0.04 | (0.01) | |
| ATT | 12% | 15% | –0.03 | (0.01) | * | ||
| 2 years after VR acceptance | Unmatched | 14% | 18% | –0.04 | (0.01) | ||
| ATT | 14% | 17% | –0.03 | (0.02) | * | ||
| 3 years after VR acceptance | Unmatched | 10% | 17% | –0.07 | (0.01) | ||
| ATT | 10% | 18% | –0.09 | (0.01) | *** | ||
| 4 years after VR acceptance | Unmatched | 9% | 19% | –0.10 | (0.01) | ||
| ATT | 9% | 19% | –0.11 | (0.02) | *** | ||
| Mean (yearly) income in euro | 1 years after VR acceptance | Unmatched | 3,733.0 | 8,307.9 | –4,574.9 | (172.5) | |
| ATT | 3,733.0 | 7,595.1 | –3,862.1 | (271.6) | *** | ||
| 2 years after VR acceptance | Unmatched | 4,725.6 | 11,642.6 | –6,916.9 | (242.8) | ||
| ATT | 4,725.6 | 10,986.9 | –6,261.2 | (378.1) | *** | ||
| 3 years after VR acceptance | Unmatched | 9,134.3 | 14,020.5 | –4,886.2 | (315.3) | ||
| ATT | 9,134.3 | 13,452.6 | –4,318.3 | (444.8) | *** | ||
| 4 years after VR acceptance | Unmatched | 14,879.8 | 15,632.4 | –752.6 | (369.3) | ||
| ATT | 14,879.8 | 15,248.4 | –368.6 | (498.1) | n.s. | ||
| Number of days worked within | 1 years after VR acceptance | Unmatched | 55.2 | 163.0 | –107.8 | (3.3) | |
| ATT | 55.2 | 147.7 | –92.4 | (4.7) | *** | ||
| 2 years after VR acceptance | Unmatched | 90.9 | 236.9 | –146.0 | (4.2) | ||
| ATT | 90.9 | 225.7 | –134.8 | (5.8) | *** | ||
| 3 years after VR acceptance | Unmatched | 161.6 | 263.9 | –102.3 | (4.5) | ||
| ATT | 161.6 | 258.2 | –96.6 | (5.9) | *** | ||
| 4 years after VR acceptance | Unmatched | 240.6 | 275.1 | –34.5 | (4.4) | ||
| ATT | 240.6 | 272.2 | –31.6 | (5.8) | *** | ||
| N (total; control + treated) | 7,905 (raw) | 13,164 (matched) | |||||
| N (control) | 1,323 (raw) / | 6,582 (matched from 1,185 observations) | |||||
| N (treated) | 6,582 (raw) | 6,582 (matched) | |||||
Data source: RehaPro, own calculations; the table shows average treatment effects on the treated (standard error) obtained by propensity score matching (with replacement); *p < 0.05; **p < 0.01; ***p < 0.001; nearest neighbour: 1; caliper: 0.005.
Before matching, the treatment group contained more men (62 vs. 55 percent), more individuals from households in receipt of basic income support (31 vs. 25 percent) and more people living in eastern Germany (28 vs. 20 percent), but fewer people entering VR from marginal employment (11 vs. 19 percent). The treatment group exhibited fewer days of sickness (93 vs. 107 days) (Table 1).
For the second comparison (a total of 21,020 persons), we took another sample and compared rehabilitants completing general training in 2012 and 2013 (n = 6,765, treatment group) with non-rehabilitants who had registered health conditions and were also participating in general training outside of VR in the same time frame (n = 14,255, control group). After matching, the 6,765 persons of the treatment group were matched to 6,765 persons from the control group (Table 4).
Table 4
Base levels and effect of VR status in Comparison II (rehabilitants and non-rehabilitants with health conditions participating in the same general training programme)
| Outcomes | Comparison II | ||||||
| Rehabilitants in general training (treated) | Non-rehabilitants in general training (control) | Difference | s.e. | Significance | |||
| Taking up unsubsidised employment | 6 months after programme completion | Unmatched | 43% | 36% | 0.07 | (0.01) | |
| ATT | 43% | 42% | 0.01 | (0.01) | n.s. | ||
| 1 year after programme completion | Unmatched | 51% | 42% | 0.09 | (0.01) | ||
| ATT | 51% | 47% | 0.04 | (0.01) | ** | ||
| Taking up marginal employment | 6 months after programme completion | Unmatched | 7% | 9% | –0.02 | (0.00) | |
| ATT | 7% | 8% | –0.01 | (0.00) | * | ||
| 1 year after programme completion | Unmatched | 6% | 8% | –0.02 | (0.00) | ||
| ATT | 6% | 8% | –0.02 | (0.00) | ** | ||
| Taking up subsidised employment | 6 months after programme completion | Unmatched | 7% | 3% | 0.04 | (0.00) | |
| ATT | 7% | 3% | 0.04 | (0.01) | *** | ||
| 1 year after programme completion | Unmatched | 4% | 2% | 0.02 | (0.00) | ||
| ATT | 4% | 2% | 0.02 | (0.00) | *** | ||
| Mean (yearly) income in euro | 1 year after programme completion | Unmatched | 13,482.4 | 9,466.6 | 4,015.8 | 151.8 | |
| ATT | 13,482.4 | 11,068.7 | 2,413.8 | 264.9 | *** | ||
| Number of days worked within | 1 year after programme completion | Unmatched | 183.6 | 142.4 | 41.2 | 2.1 | |
| ATT | 183.6 | 164.7 | 18.9 | 3.7 | *** | ||
| N (total; treated + control) | 21,020 (raw) | 13,530 (matched) | |||||
| N (control) | 14,255 (raw) | 6,765 (matched) | |||||
| N (treated) | 6,765 (raw) | 6,765 (matched) | |||||
Data source: RehaPro, IEB, own calculations; the table shows average treatment effects on the treated (standard error) [confidence interval] obtained by propensity score matching (with replacement); *p < 0.05; **p < 0.01; ***p < 0.001; nearest neighbour: 1; caliper: 0.005.
Before matching, the treatment group contained fewer men (59 vs. 63 percent), the participants in that group were also slightly younger (31 vs. 33 years), had experienced fewer days of illness (92 vs. 107 days), were less likely to come from a household receiving basic income support and were less likely to lack a vocational qualification (3 vs. 38 percent). Furthermore, there were fewer people with a severe disability (or equal status) in the treatment group (8 vs. 14 percent) (Table 2).
4Results
4.1Comparing employment effects of rehabilitants with and without participation in training (comparison I)
The first comparison group consisted of individuals who had been granted VR status but differed in training programme participation. The PSM results showed that up to three years after VR started, participants in training were less likely to enter unsubsidised employment (effect sizes in the 1st and 2nd year: –0.35 and –0.33, p < 0.001; 3rd year: –0.07, p < 0.01). In the first year after VR acceptance, only seven percent of the treated were employed in unsubsidised employment compared to 42 percent in the control group. The effects of the initial years reversed after four years, when participants were more likely to find unsubsidised employment than non-participants (0.05, p < 0.05). Here, the share of employed increased to 65 percent in the treatment group and 60 percent in the control group.
With respect to marginal employment, non-participants remained more likely to be employed after four years (–0.11, p < 0.001). Marginal employment was taking up by 12 percent of the treatment group in the first year after VR acceptance and by 15 percent in the control group. This share reduced to nine percent in the treatment and rose to 19 percent in the control group.
Comparisons of the number of days worked and yearly income showed that in the first year of (potential) programme participation, moderate differences between participants and non-participants existed (participants worked on average 92 fewer days (p < 0.001), and their yearly income was 3,862 euro lower (p < 0.001)). In the first year, the treatment group earned on average 3,733 euro and worked 55 days compared to 7,595 euros that was earned by the control group, who worked 148 days. These differences increased in the second year (135 days (p < 0.001); 6,261 euro/year) but diminished again in the third year (97 days (p < 0.001); 4,318 euro/year (p < 0.001)). After four years, the groups differed by approximately 32 days (p < 0.001) and their income differences were no longer statistically significant. In the fourth year, the treatment group worked 241 days and earned 14.880 euros and the control group worked 272 days and earned 15,248 euros (Table 3).
4.2Comparing employment effects of participants in training programmes with and without VR status (comparison II)
For the second comparison, we took another sample and compared rehabilitants completing general training in 2012 and 2013 with non-rehabilitants who had registered health conditions and were also participating in general training outside of VR in the same time frame.
Table 4 summarises the PSM results. One year after participating in the same training programme, rehabilitants were more likely than non-rehabilitants to be employed. Both unsubsidised and subsidised employment was more common among rehabilitants (0.04, p < 0.01; 0.02, p < 0.001), and rehabilitants were less likely to be only marginally employed one year after training (–0.02, p < 0.01). One year after programme completion, 51 percent was employed in unsubsidised employment compared to 47 percent in the control group, four percent was employed in subsided employment compared to two percent in the control group and six percent of the treated were employed in marginal employment compared to eight percent in the control group. Moreover, rehabilitants exhibited longer employment durations during the first year after training (19 days, p < 0.001) –184 days in the treatment and 165 days in the control group – and their average incomes were higher than those of non-rehabilitants (2,413 euro/year, p < 0.001) – the treated earned a mean yearly income of 13,482 euro vs. 11,069 euro in the control group.
5Discussion
The present study identified the employment effects of training programmes (comparison I) and the VR status (comparison II) for people with disabilities in VR in Germany.
Even after rehabilitants have been granted VR status, approximately a quarter of rehabilitants do not participate in any programme (comparison I). When a training programme has been chosen, approximately half of the rehabilitants participate in general training. Furthermore, similar general programmes are offered to unemployed people with no VR status. We focused on those who had health limitations that affect their placement in employment but did not apply for VR (comparison II). With respect to general training, rehabilitants and non-rehabilitants completed the same type of training. The only difference their legal status. Rehabilitants may be entitled to additional support and benefits (e.g. longer-term subsidised employment after completion of training) and are supervised by specially trained personnel.
To determine the effect of programme participation, we applied PSM to two different comparison groups. First, we focused on the effect of training, comparing rehabilitants who participated in training to those who did not (comparison I). Second, we determined the effect of the VR status by comparing rehabilitants and non-rehabilitants in the same general training programmes (comparison II).
To sum up, comparison I reveals the lock-in effects of training participation. That means that individuals participating in training are “locked” within the training and, thus, are less likely to find employment during the training programme. This lock-in effect has also been observed in other studies on the return to work (e.g. 35, 36). In terms of training, this lock-in effect is desired and makes it necessary for our analysis to have a long observation period. Therefore, four years after the start of VR, when most participants should have finished VR – even if other programmes followed training –, the employment prospects of training participants exceeded those of non-participants. Similar positive employment outcomes after training participation were also found for the unemployed [12] and for rehabilitants supported by the SPI [4].
However, the effects on income are less positive than those on employment. In the first three years, non-participants earn more than those in training. In the fourth year, the income differences disappear. Though this is a positive development compared to the effects for the initial years after training commenced, this means that even after four years the income of those participating in training did not differ from that of the non-participants. Furthermore, non-participants show statistically significant longer employment durations, although the difference was small. Thus, to a certain extent participation in training involves opportunity costs (in terms of income and employment duration) that are not offset shortly after training participation but evolve over time. Therefore, the changes in the effect year on year indicate that this is very likely to balance out in the longer term. Even longer analyses are therefore necessary to detect the long-term effects of training participation [36–40]. This is particularly reasonable since the population supported by the FEA is relatively young [19].
Furthermore, the type of occupation and its suitability regarding the health limitation or disability might serve as an important additional outcome for this first comparison group [41]. It is possible that non-participants may be more likely than training participants to take up employment not suited to their disability. If this is the case, especially (psychological) health is more likely to be affected and might result in sickness periods and shorter employment durations in the long run [42]. This would call into question the definition of successful VR in the context of most previously conducted studies and should therefore also be addressed in future research.
Comparison II analysed the effects of the VR status. The results indicate positive effects of persons holding VR status compared to non-rehabilitants with regard to taking up employment, income and employment duration. Since comparison II only differs according to the VR status, these positive effects are primarily driven by disability-specific support by specific VR counsellors and access to disability-specific services during the programmes. For instance, subsidised employment – which is also found in other studies [17] – seems to integrate rehabilitants into the labour market after training but is only available (in the long term) to individuals who have been granted VR status. A study by Wang et al. [35] supports this explanation, though they refer to the disabled worker status and its associated advantages for recipients. Nivorozhkin [5] is another example of a study supporting this result, although this study uses a different comparison group (applicants for VR whose application was not approved). Subsidised employment accounts for the fact that employers are more willing to employ people with disabilities if they are compensated for additional costs that are associated with their return to work [43].
5.1Strengths and study limitations
There is still little evidence of the employment effects of vocational training for people with disabilities. Furthermore, there are no studies identifying the effect of the VR status itself. This is due to the fact that comparison groups are hard to find. Our study addressed this issue and carefully chose two comparison groups. Based on representative, large-scale administrative data, our study is the first to examine the employment effects of training programmes and of the VR status for people with disabilities in Germany supported by the FEA. The availability of longitudinal data enabled us to follow participants with regard to their medium-term employment outcomes. Further research is necessary to investigate long-term effects. The available data used in this study would also be suitable for such research in the future as the data is to be updated at the end of 2021 to cover an even larger time frame until December 2020.
However, the administrative data also come with constraints. We were unable to take the severity of health conditions into consideration (as most studies on VR do), so we could not rule out the possibility that people with more severe health conditions may more often be assigned to special programmes. However, the study by Nivorozhkin [5] using the same data set and similar outcomes applied a simulation that showed that the labour market outcomes are not substantially affected by unobserved information, such as the type of disability. Furthermore, we already mentioned above that in comparison I matching with replacement may lead to an increase in measurement error, because the control group is much smaller than the treatment group. Also in comparison I, the confounders “local unemployment rate”, “disability status” and “days in longer sickness” were measured at VR acceptance and might change over time/after programme implementation. Finally, although we can measure income on a reliable and daily basis, we cannot control for the hours worked per day.
6Conclusion
On the one hand, participating in training is associated with a programme lock-in effect lasting approximately three years for rehabilitants; thus, keeping rehabilitants from job search for the sake of programme participation. However, in the fourth year when VR is completed for most of the participants employment prospects improve considerably showing positive effects. However, training participation does not lead directly to higher incomes and longer employment durations. We interpret this finding that participation in training therefore constitutes an investment for social security institutions as well as for participants, but are confident from the observed effect development over the prior years that income effects may well become positive after a longer observation period. On the other hand, the VR status is associated with positive employment and income opportunities. This is due to the intensive support and access to long-term subsidised employment, which boosts participants’ employment prospects and increases their ability to return to an independent life. At this point, further research must examine why individuals with health issues do not apply for VR in order to formulate actions to overcome barriers to entering VR.
Ethics approval and consent to participate
All procedures performed in this study were in accordance with the code of ethics of the German Sociological Association and with the 1964 Declaration of Helsinki and its later amendments or comparable ethical standards.
Consent for publication
Since administrative data refer to social security data, formal individual consent is not required.
Availability of data and materials
The data that support the findings of this study are particularly protected social data. According to §75 Book X of the German Social Code, the data are available on request from The Federal Ministry of Labour and Social Affairs via the Institute for Employment Research (department DIM). Data may only be analysed at the Institute for Employment Research or one of its locations outside Germany.
Conflict of interest
The authors declare that they have no competing interests.
Funding
This work was supported by the German Federal Ministry of Labour and Social Affairs. The funding party had no involvement in the study whatsoever.
Author contributions
Both authors analysed and interpreted the data and wrote the manuscript together. All authors read and approved the final manuscript.
Acknowledgments
The authors thank Dr Anton Nivorozhkin and Angela Rauch for valuable remarks on the analyses and the manuscript.
References
[1] | Coduti WA , Eissenstat SJ , Conyers LM Linking hope factors, barriers to employment and health outcomes for individuals living with Human Immunodeficiency Virus (HIV). Work. (2018) ;62: (2), 225–36. |
[2] | JahodaM Employment and unemployment: a social-psychological analysis. Cambridge, UK: Cambridge University Press; (1982) . |
[3] | Lindsay S , Cagliostro E , Albarico M , Mortaji N , Karon L A systematic review of the benefits of hiring people with disabilities. Journal of Occupational Rehabilitation. (2018) ;28: (4), 634–55. |
[4] | Echarti N , Schüring E , O’Donoghu C Effects of vocational re-training on employment outcomes among persons with disabilities in Germany: A quasi-experiment. Journal of Occupational Rehabilitation. (2019) ;30: (2), 221–34. |
[5] | Nivorozhkin A Overcoming barriers: Effects of entering vocational rehabilitation on labour market outcomes. International Journal of Social Welfare. (2018) ;0: :1–11. |
[6] | Reims N , Nivorozhkin A , Tophoven S Personen mit gesundheitlichen Einschränkungen - Berufliche Rehabilitation zielt auf Prävention und passgenaue Förderung [Adults with disabilities and health limitations: vocational rehabilitation aims at prevention of unemployment and at tailored re-employment support]Nürnberg: IAB; 2017. |
[7] | Reims N , Tophoven S Eine Längsschnittstudie zu Arbeitsmarktübergängen und Beschäftigungsnachhaltigkeit nach beruflichen Weiterbildungsmaßnahmen im Rahmen von Leistungen zur Teilhabe am Arbeitsleben [A longitudinal study on labour market transitions and sustainability of employment after further taining measures in the context of vocational rehabilitation]. Rehabilitation.. (2018) ;57: (3), 184–92. |
[8] | Federal Ministry of Labour and Social AffairsSocial Security at a glance 2020. Berlin: Federal Ministry of Labour and Social Affairs, 2020. |
[9] | Reims N Take-up and non-take-up of vocational rehabilitation: the role of employment status. Alter. 2020;online first. |
[10] | Reims N , Rauch A , Tophoven S , Jahn K , Neumann K , Nivorozhkin A , et al. Perspektive der Leistungserbringer - Modul 4 des Projekts „Evaluation von Leistungen zur Teilhabe behinderter Menschen am Arbeitsleben“ [Perspectives of service providers - module 4 of the project “evaluation of benefits for the inclusion of persons with disabilities in the working life”], Bundesministerium für Arbeit und Soziales, editor. Berlin: Bundesministerium für Arbeit und Soziales; 2020. |
[11] | Ekert S , Frank W , Gericke T , Matthes S , Sommer J Implementationsstudie 1 zur Evaluation von Leistungen zur Teilhabe behinderter Menschen am Arbeitsleben. Zusammenfassender Bericht (Teil B) [Implementation study 1 to evaluate benefits for the inclusion of persons with disabilities. Summary (Part B)]. In: Bundesministerium für Arbeit und Soziales, editor. Evaluation von Leistungen zur Teilhabe behinderter Menschen am Arbeitsleben. Forschungsbericht Berufliche Rehabilitation. 427. Berlin: BMAS; 2012. pp. 250–449. |
[12] | Kruppe T , Lang J Labour market effects of retraining for the unemployed. The role of occupations. Nürnberg: IAB; 2014. |
[13] | Cavaco S , Fougère D , Pouget J Estimating the effect of a retraining program on the re-employment rate of displaced workers. Empirical Economics. (2013) ;44: (1), 261–87. |
[14] | Wehman PH , Revel WG , Kregel J S KJ , Callahan M Banks I et al. Supported employment: alternative model for vocational rehabilitation of persons with severe neurologic, psychiatric or physical disability. Archives of Physical Medicine and Rehabilitation. (1991) ;72: :101–5. |
[15] | Ottomanelli L , Barnett SD , Goetz LL Effectiveness of Supported Employment for Veterans With Spinal Cord Injury: 2-Year Results. Archives of Physical Medicine and Rehabilitation.. (2014) ;95: (4), 784–90. |
[16] | Frölich M , Heshmati A , Lechner M A microeconometric evaluation of rehabilitation of long-term sickness in Sweden. Journal of Applied Econometrics.. (2004) ;19: :375–96. |
[17] | Markussen S , Røed K The impacts of vocational rehabilitation. Labour economics. (2014) ;31: :1–13. |
[18] | Bethge M , Streibelt M Sind Vollqualifizierungen wirklich besser als Teilqualifizierungen? Ergebnisse einer Propensity Score gematchten Analyse [Are two-year vocational retraining programs really better than one-year programs? Findings of a propensity score matched analysis]. Rehabilitation. (2015) ;54: (6), 389–95. |
[19] | Nivorozhkin A , Reims N , Zollmann P , Bethge M Leistungen zur Teilhabe am Arbeitsleben –Rehabilitanden der Bundesagentur für Arbeit und der Deutschen Rentenversicherung im Vergleich [Vocational rehabilitation –Comparing clients of the Federal Employment Agency and the German Pension Insurance]. Rehabilitation.. (2018) ;57: :149–56. |
[20] | Campolieti M , Gunderson MKL , Smith JA The effect of vocational rehabilitation on the employment outcomes of disability insurance beneficiaries: new evidence from Canada. IZA Journal of Labor Policy. (2014) );3: (10). |
[21] | Caliendo M , Kopeinig S Some practical guidance for the implementation of propensity score matching. Journal of Economic Surveys. (2008) ;22: (1), 31–72. |
[22] | Dony E , Gruber S , Jasim A , Rauch A , Schmelzer P , Schneider A , et al. Basisstudie zur Evaluation von Leistungen zur Teilhabe behinderter Menschen am Arbeitsleben. Basisstudie Reha-Prozessdatenpanel. Zusammenfassender Bericht (Teil A) [Base study to evaluate benefits for the inclusion of persons with disabilities. Base study RehaPro. Summary (Part A)]. In: Bundesministerium für Arbeit und Soziales, editor. Evaluation von Leistungen zur Teilhabe behinderter Menschen am Arbeitsleben. Forschungsbericht Berufliche Rehabilitation. 427. Berlin: BMAS; 2012. pp. 6–256. |
[23] | Reims N , Tophoven S , Tisch A , Jentzsch R , Nivorozhkin A , Köhler M , et al. Aufbau und Analyse des LTA-Rehaprozessdatenpanels. Eine Prozessdatenbasis zur Untersuchung beruflicher Rehabilitation in Träagerschaft der Bundesagentur für Arbeit. Modul 1 des Projekts „Evaluation von Leistungen zur Teilhabe behinderter Menschen am Arbeitsleben“ [Establishment and analysis of the German Reha-Process Data Panel. A process-produced data base to analyse vocational rehabilitation financed by the Federal Employment Agency.]. Bundesministerium für Arbeit und Soziales, editor. Berlin BMAS; 2018. pp. 1–127. |
[24] | Tophoven S , Reims N , Tisch A Vocational rehabilitation of young adults with psychological disabilities. Journal of Occupational Rehabilitation. (2019) ;29: :150–62. |
[25] | Zimmermann R , Kaimer S , Oberschachtsiek D Dokumentation des “Scientific Use Files der Integrierten Erwerbsbiographien” (IEBS-SUF V1) Version 1.0 [Documentation of the scientific use file of the integrated employment biographies]. FDZ-Datenreport. (2007) );01: (2007):62. |
[26] | Kraemer B Absence from Work –Germany. Dublin: Euro–found; 2010. |
[27] | Rosenbaum P , Rubin D Reducing bias in observational studies using subclassification on the propensity score. Journal of the American Statistical Association.. (1984) ;79: :516–24. |
[28] | Austin P An introduction to propensity score methods for reducing the effects of confounding in observational studies. Multivariate Behavioral Research. (2011) ;46: (3), 399–424. |
[29] | RubinD For objective causal inference, design trumps analysis. Annals of Applied Statistics. (2008) ;2: :808–40. |
[30] | AustinP Balance diagnostics for comparing the distribution of baseline covariates between treatment groups in propensity-score matched samples. Statistics in Medicine. (2009) ;28: :3083–107. |
[31] | Propensity Score Matching in Stata using teffects 2015 [Available from: https://www.ssc.wisc.edu/sscc/pubs/stata_psmatch.htm.] |
[32] | LeiteW Practical propensity score methods using R:SAGE; (2017) . |
[33] | WooldridgeJM Econometric analysis of cross section and panel data. Cambridge: MIT Press; (2002) . |
[34] | Abadie A , Imbens GW Matching on the estimated propensity score. Harvard University and National Bureau of Economic Research. 2012. |
[35] | Wang V , Fort E , Beaudoin–Gobert M , Ndiaye A , Fischer C , Bergeret A , et al. Indicators of long-term return to work after severe traumatic brain injury: A cohort study. Annals of Physical and Rehabilitation Medicine. (2019) ;62: (1):28-34. |
[36] | Heuser C , Halbach S , Kowalski C , Enders A , Pfaff H , Ernstmann N Sociodemographic and disease-related determinants of return to work among women with breast cancer: a German longitudinal cohort study. BMC Health Services Research. (2018) 18: (1000). |
[37] | Deeke A , Dietrich H , Kruppe T , Lott M , Rauch A , Stephan G , et al. Geförderte Qualifizierungsmaßnahmen in Deutschland. Aktuelle Evaluationsergebnisse im Überblick [Subsidised qualification programmes in Germany. An overview over recent evaluation results]. Sozialer Fortschritt. . (2011) ;60: (9), 196–203. |
[38] | Beutel ME , Zwerenz R , Bleichner F , Vorndran A , Gustson D , Knickenberg RJ Vocational training integrated into inpatient psychosomatic rehabilitation - short and long-term results from a controlled study. Disability and Rehabilitation. (2005) ;27: (15), 891–900. |
[39] | Lechner M , Miquel R , Wunsch C Long-run effects of public sector sponsored training in West Germany. Journal of the European Economic Association. (2011) ;9: (4), 742–84. |
[40] | Ahlgren Å , Bergroth A , Ekholm J , Schüldt K Work resumption after vocational rehabilitation: A follow-up two years after completed rehabilitation Work ((2007) ;28: (4), 343–54. |
[41] | Young AE An exploration of alternative methods for assessing return-to-work success following occupational injury. Disability and Rehabilitation. (2014) ;36: (11), 914–24. |
[42] | Reims N , Bauer U Labour market status and well-being in the context of return to work after vocational rehabilitation in Germany. Journal of Occupational Rehabilitation. (2015) ;25: (3), 543–56. |
[43] | Soklaridis S , Cassidy JD , van der Velde G , Tompa E , Hogg-Johnson S The economic cost of return to work: an employer’s perspective. Work. (2012) ;43: :255–62. |


