
E-worker postural comfort in the third-workplace: An ergonomic design assessment
Abstract
BACKGROUND:
Biomechanical simulation is an important tool in human-centred design, allowing for the assessment of comfort interactions between user, product and space, to optimize design features from an ergonomics perspective.
OBJECTIVE:
The aim of this study was to develop a biomechanical model for the evaluation of postural comfort levels.
METHODS:
The study used the scenario-based method to focus on the electronic-worker (e-worker) sedentary tablet tasks at public workplace (third-workplace) configurations. An empirical method determined work-related musculoskeletal disorders (WMSDs) risk levels. The experimental method was based on a motion-capture marker-based laboratory protocol and biomechanical model. Body postures were analysed to determine the WMSDs risk to the joints, and were compared to subjective questionnaires.
RESULTS:
Posture was affected by the tablet target location and workplace setting. The findings confirmed our hypothesis, that neutral-position cost functions govern human motion. Almost half of the time, the e-workers’ joints tended to remain in the neutral position range; of the three third-workplaces, high-risk variability was less significant between the ‘restaurant’ and ‘lounge’ settings, compared to the ‘anywhere’ configuration.
CONCLUSIONS:
This evaluation model can contribute to optimizing comfort level in design for third-workplace settings and other sedentary work activities; it can be used to develop guidelines for minimizing work-related strain and health hazards.
1Introduction
The human worker performs an important role in modern systems. Many aspects of work are of a physical nature, including tasks with a manual component, e.g., when the worker must lift a component or engage with different technological devices. Musculoskeletal disorders (MSDs) caused by manual tasks represent a large part of all work-related MSDs (WMSDs), [1, 2], and are central to issues of public well-being in the workplace.
In line with global advances in communication, mobile workers are increasingly interacting with information and communication technology (ICT) systems in the third workplace [3]. This development is the consequence of the increasing need for work collaboration in a globalized world, as well as its contribution to reducing property costs and enhancing work productivity. The third place is separate and distinct from the two usual social environments, home (first place) and the workplace (second place).
Third workplaces, such as cafés, waiting lounges, restaurants, or indeed literally ‘anywhere’ are evolving into work sites, ‘semi-offices’, where mobile workers can meet with colleagues and customers, or work alone [4, 5].
A mobile electronic worker, or the e-worker, is defined as a person who works at least ten hours per week away from home or from the main office, and who uses portable system connections (such as a tablet computing device) when working [6]. Hence, ‘media tablet computers’ have become the next generation ICT device for the e-worker, an increasingly ubiquitous substitute for the laptop computer [7].
According to a Pew Research Center study [8], 53% of American adults own a tablet computer. Another global consumer survey research obtained [9], aggregating studies from more than 22,500 sources, presenting global sale rates for tablets between 2010 to 2019, predicts the sale of 122.1 million tablets worldwide in 2023.
One major difference between tablets, desktop and laptop computers is that the tablet functionally integrates the display and the user input via a touch-screen, thus making it highly portable, with many potential display positions and locations [10]. These factors may elicit a unique form of usage behavior contributing to posture transformation, not necessarily that adopted for the use of desktop or laptop computers. The ergonomics of desktop-based interfaces have been intensively researched [11–13]. However, interactions with portable systems (PSs), which often require the adoption of novel postures and movement types for input, require more research attention [14, 15].
Current ergonomic design postural-behavior assessments indicate that such case studies of the e-worker at the third-workplace are unrepresentative, irrelevant, or contingent upon subjective estimations by health sector professionals [16].
1.1The e-worker’s ‘neutral-comfort-position’ and WMSD studies
Activities away from the office, along with the rapid global adoption of PSs, has precipitated awkward, constrained or prolonged postures and sustained muscle loading by e-workers, working in third-workplace locations not designed for office work tasks. There is the concomitant concern that this activity could increase the incidence of WMSDs, and hinder recovery from such conditions [1]. Generally, WMSDs are recognized as playing a role in comfort health issues, given the established link between discomfort and the functioning of the musculoskeletal system.
Studies on the ‘neutral comfort position’ of joint angles have demonstrated a relationship between self-reported discomfort and WMSDs, and how these disorders affect perceptions of comfort [1, 17–19] Research has also established a connection between the growing number of reported cases of carp metacarpal (CMC) arthritis, tendonitis and tenosynovitis, and individuals who send a high volume of text messages [20–22]. Several small-scale studies have identified an association between neck, shoulder or hand discomfort symptoms, and the daily number of text messages sent or the duration of manual mobile device usage [15, 23, 24].
The definition of comfort/discomfort, as used in the current paper, is based on the comfort models presented in De Looze et al. [25], Helander and Zhang [26] and Zhang [27]. Comfort, for the purposes of the present study, is determined as ‘a pleasant feeling of being relaxed and free from pain’ (The Cambridge Advanced Learner’s Dictionary, (https://dictionary.cambridge.org/dictionary/english/comfort). Researchers have agreed [25] on some defining characteristics of comfort: comfort is a construct of a subjectively defined personal nature; comfort is affected by factors of various forms (physical, physiological, psychological); comfort is a reaction to the environment. Discomfort is affected by biomechanical factors (such as fatigue) and physical elements as a part of the physical environment and task performances, interacting and influenced by the discomfort ‘physical elements’ (human-product-space).
Researchers recommend that focusing on the neutral-tendency of body segments can contribute to postural comfort during dynamic tasks for design applications [28].
With regard to e-worker tablet tasks, it is unclear what specific postures match the ‘neutral-tendency’ recommendation. Consequently, dynamic postures adopted by the e-worker at the third-workplace require ergonomic assessment, in order to avoid the increased incidence of physical discomfort and WMSDs [1, 2].
1.2Postural assessment methods
Different methods and tools exist for the ergonomic assessment of manual tasks. These assessment methods can be classified into scenario-based methods, empirical methods and experimental methods [29, 30]
In the current paper, a scenario-based method was first adopted. The e-worker tablet tasks at the third-workplace, provided the underlying database for the research model’s development.
Empirical methods were then used to determine WMSD risk levels, and included a guidelines database (e.g., [31] military standard MIL-STD 1472G); statistics and tabulations, and two-dimensional static anthropometry database, which measures postures when standing upright or sitting, unlike dynamic anthropometry which measures distances measured when the body is in motion.
Experimental methods consisted of three-assessing techniques: self-reporting, observations techniques, and motion-capture (MoCap) systems. Self-reporting generally consists of worker diaries, interviews and questionnaires. In the current study, we utilized e-workers questionnaires, including socio-technical and health questionnaires; the Comfort Evaluation Checklist (CEC), modified according to Helander and Zhang, [26]; Borg’s Locally Perceived Discomfort (LPD), modified according Van der Grinten and Van der Smitt [32]; and a general comfort evaluation, modified according to Helander and Zhang [26].
Observational techniques are a means of evaluating worker behavior in pro-forma tasks, through direct observation and recorded videos. These research studies usually videotape work sequences, and assess different kinds of manual tasks with specific software [33–35].
The Rapid Upper Limb Assessment index (RULA) [36] is one of the most cited observational methods. Due to its near-ubiquitous presence in the research literature, we decided to base most of the range of motion (ROM) research database used in the current study on the RULA (Appendix A. Table 1). The RULA tool is based on posture observation during a defined task, recording outputs of biomechanical and postural load values on the body with particular attention paid to the neck, trunk and upper limbs. Observational methods are affordable and practical for use across a wide range of situations [29]. However, the scoring system may be open to question, given that a limited number of joints are recorded, and there is no specific learning qualification process for different professions.
Table 1
Definition of segments and joint rotations, according to International Society of Biomechanics (ISB) recommendations (modified from Wu et al. [61, 62] refers to Fig. 2; ‘Fig. no.’ refers to Appendix A. Figure 1). Abbreviations: GCS*- ‘Global Coordinate System’; ext (extension), flex (flexion), L (left), R (right), rot (rotation), add (adduction), abd (abduction), In (inwards rotation), Out (Outwards rotation), Hor (horizontal), Supin (supination), Pron (pronation)
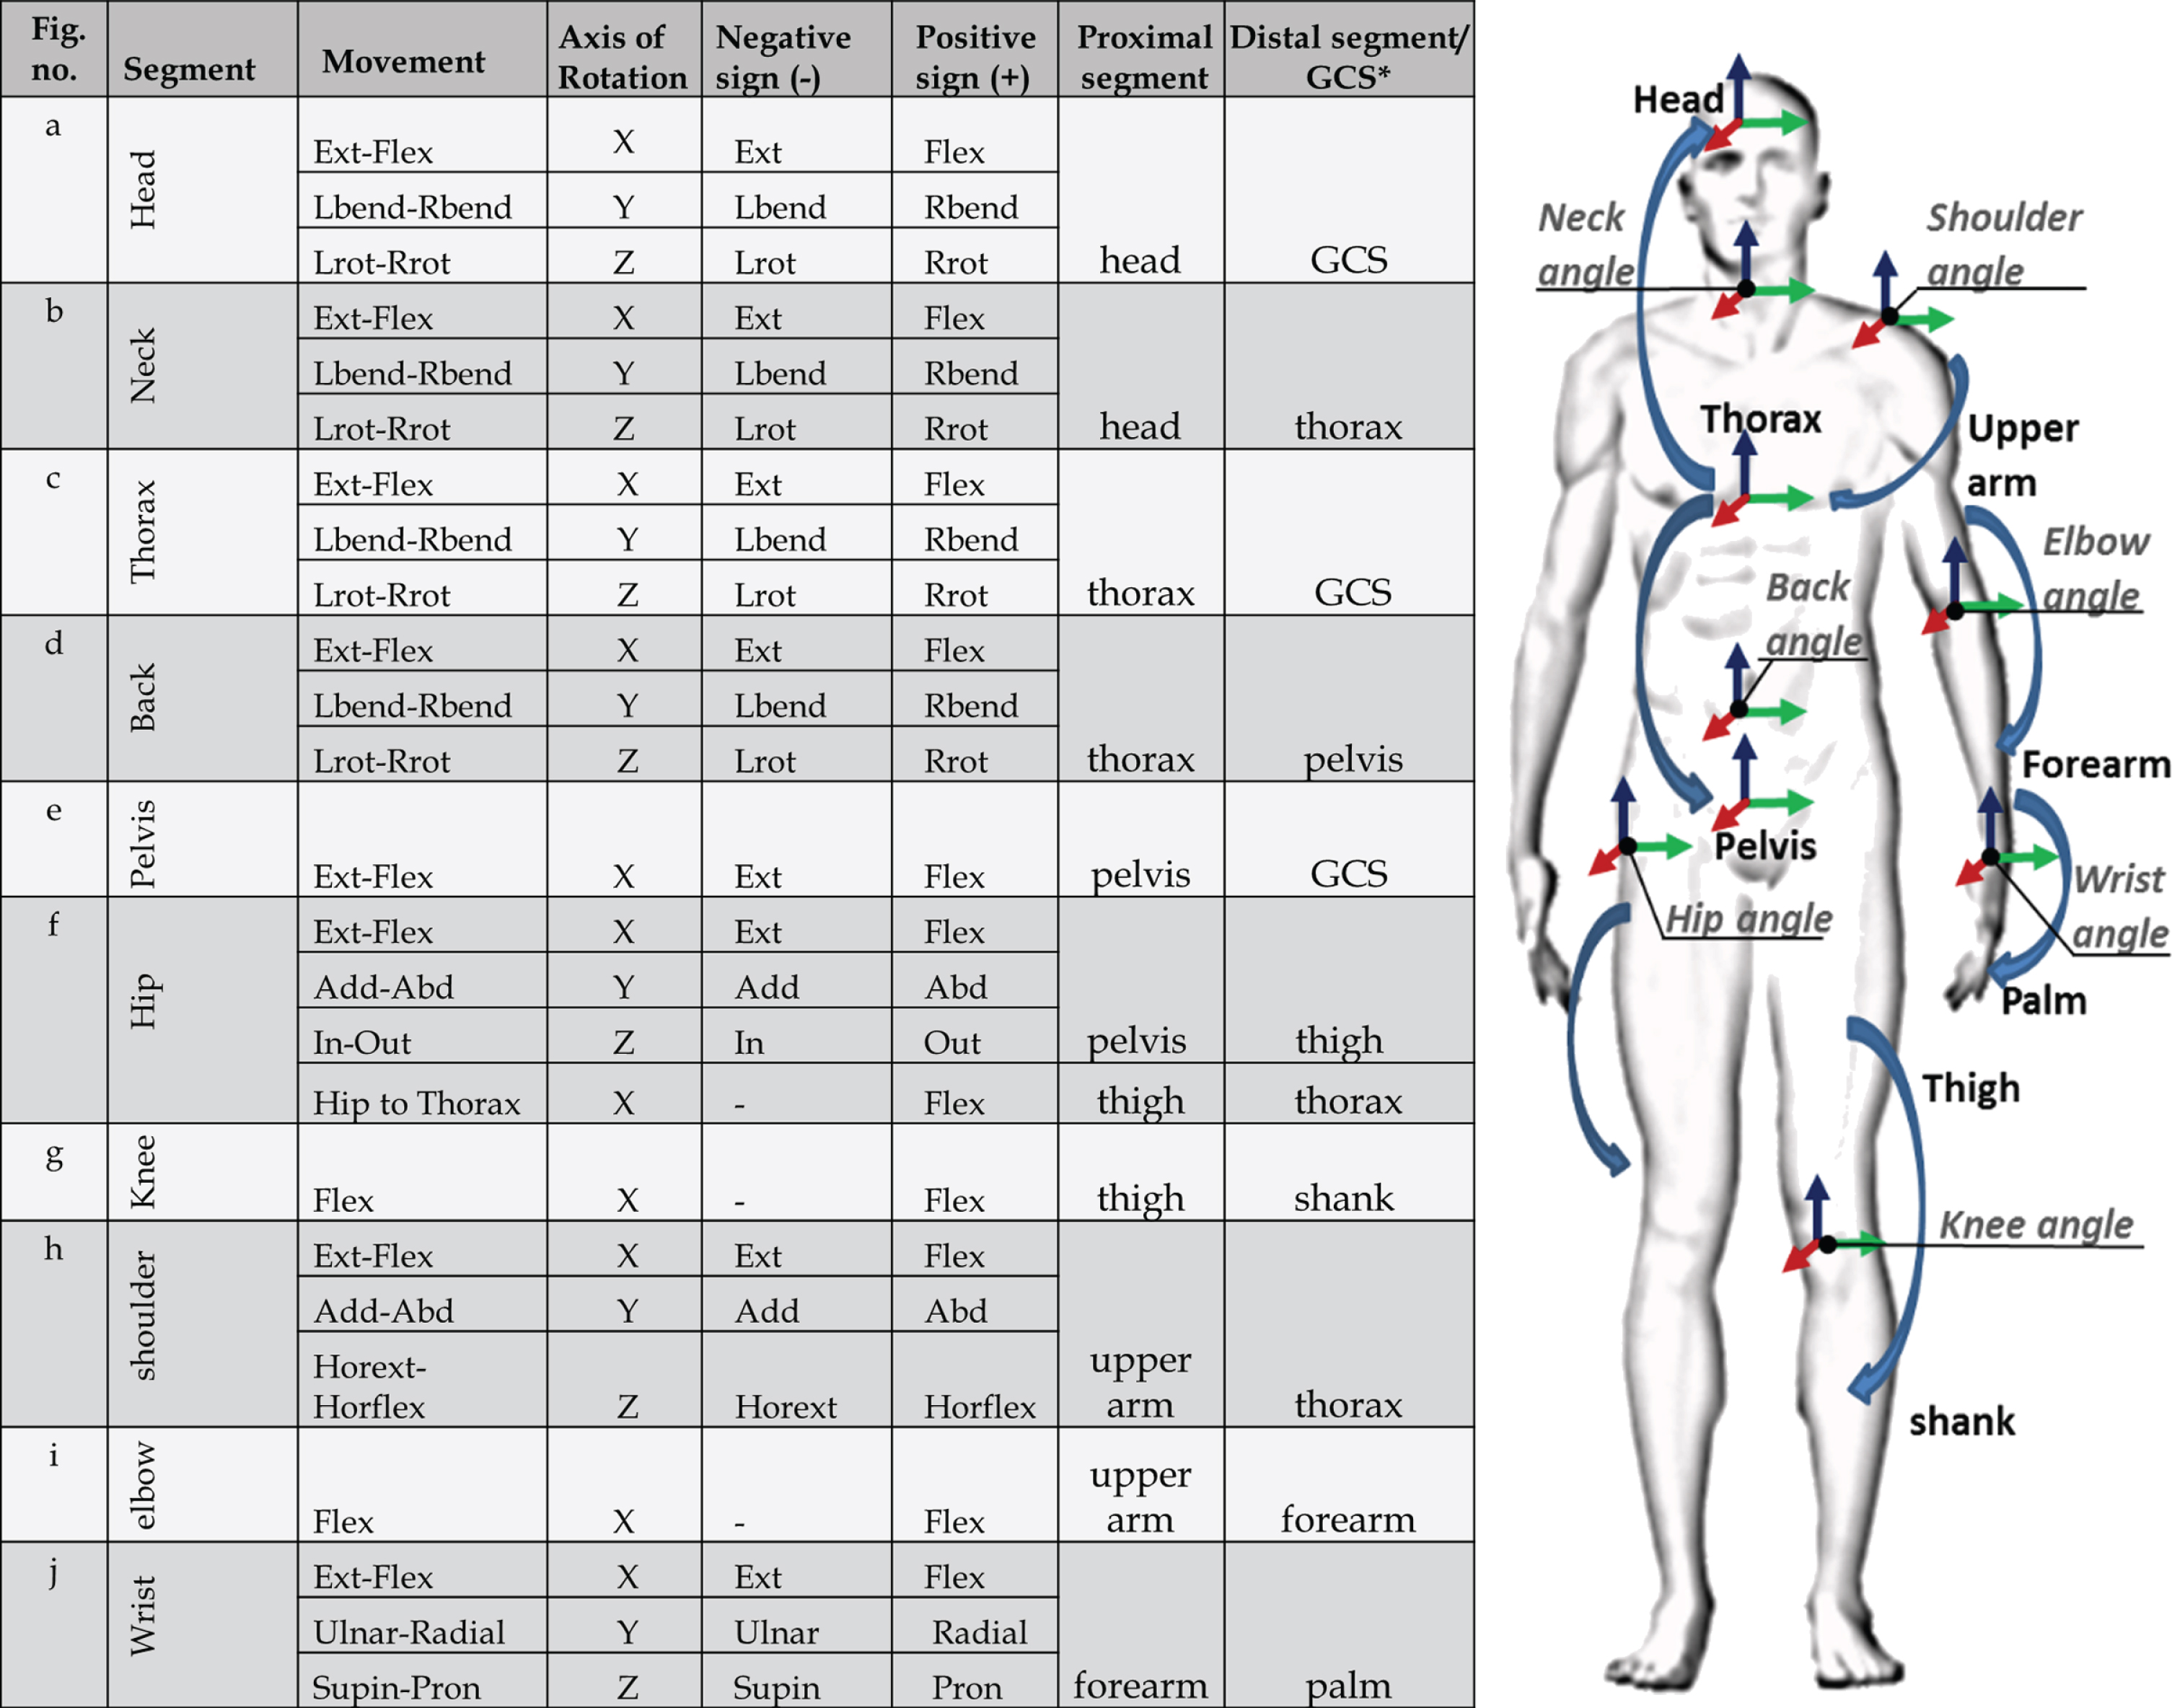 |
Fig. 2
The current assessment database is based on the experimental technique –the motion-capture (MoCap) systems. In contrast to other systems, the MoCap measures the risk of exposure in real-time, through the use of sensors attached directly to the worker’s body (e.g., Vicon system [37]), or through a marker-less system (e.g., Simi system [38] and Xsens system [39]). Some of these methods have been used to study the motion of upper limbs [40, 41].
We employed the Vicon optical-based MoCap system because it is the most commonly-used method across various applications [42, 43], and also has the highest capture rate and a high validity [44]. The MoCap application, which is popular in the entertainment and life sciences, imitates human motion, calculating joint centres and segment orientations by optimizing skeletal parameters [45]. It has the ability to handle posture, reports accurate data, and avoids self-reported and observer bias because body movements can be recorded without the presence of an observer.
Nevertheless, MoCap methods, particularly the marker-based systems, e.g., Vicon system [37], require a complex and cost-intensive hardware setup, with a huge amount of effort required to analyse and interpret recorded data in real-time [29].
In the abovementioned scenario-based method, the e-worker’s movements were recorded by a depth-camera sensor network (Vicon system [37]), linked to a biomechanical model (the valid Vicon Oxford ‘Plug-in-Gait’; PIG) full-body protocol; (https://docs.vicon.com/display/Nexus25/Modeling+with+Plug-in+Gait).
Hence, the paper introduces a biomechanical model approach, directed towards evaluating the postural comfort levels of mobile e-workers engaged in tablet tasks in the public third-workplace, and for use in ergonomic design applications.
1.3The third-workplace configurations
Studying the evolving work patterns of the e-worker and physical conditions in the third-workplace can influence the development of designed elements, by presenting potential solutions as to how third-workplace configurations can respond to these changes.
One contemporary example of third-workplace solutions are Bryant Park in Manhattan [46] and the Urban Station hybrid design [47], both of which have adopted conventional outdoor furniture solutions, known as ‘office or leisure settings’ [5, 48].
However, it seems that there is still a distinct lack in the ergonomic design practice crucial for identifying and addressing e-worker postural comfort needs and preferences. Third-workplace furniture tends to be affixed permanently to the floor or wall; too heavy to move; designed to be ‘vandalism-proof’; non-adjustable; or‘one-size-fits-all’. As a result, the e-worker cannot adjust the workplace settings to match one’s specific physical and ergonomic needs [49, 50].
Tablet technology (small, mobile, integrating a range of functions in a single unit) allows for the e-worker to adopt several postural positions, including pulling back the tablet from a desk while in use, holding the device in one’s hands, placing it on the lap, or using a stand case cover on a table to prop up the tablet. The e-worker reclines and draws the device closer to the body to maintain an optimal focal length, or brings elbows close to his body to stabilize arm movement. The user may, however, become fatigued if the device is held for long periods without arm support. In addition, if the third-workplace chair is designed primarily for other principal functions –eating at a restaurant or waiting in a lounge, for instance –it will not offer continuous lumbar support in a reclined posture, which could lead to the e-worker to experience back pain [51].
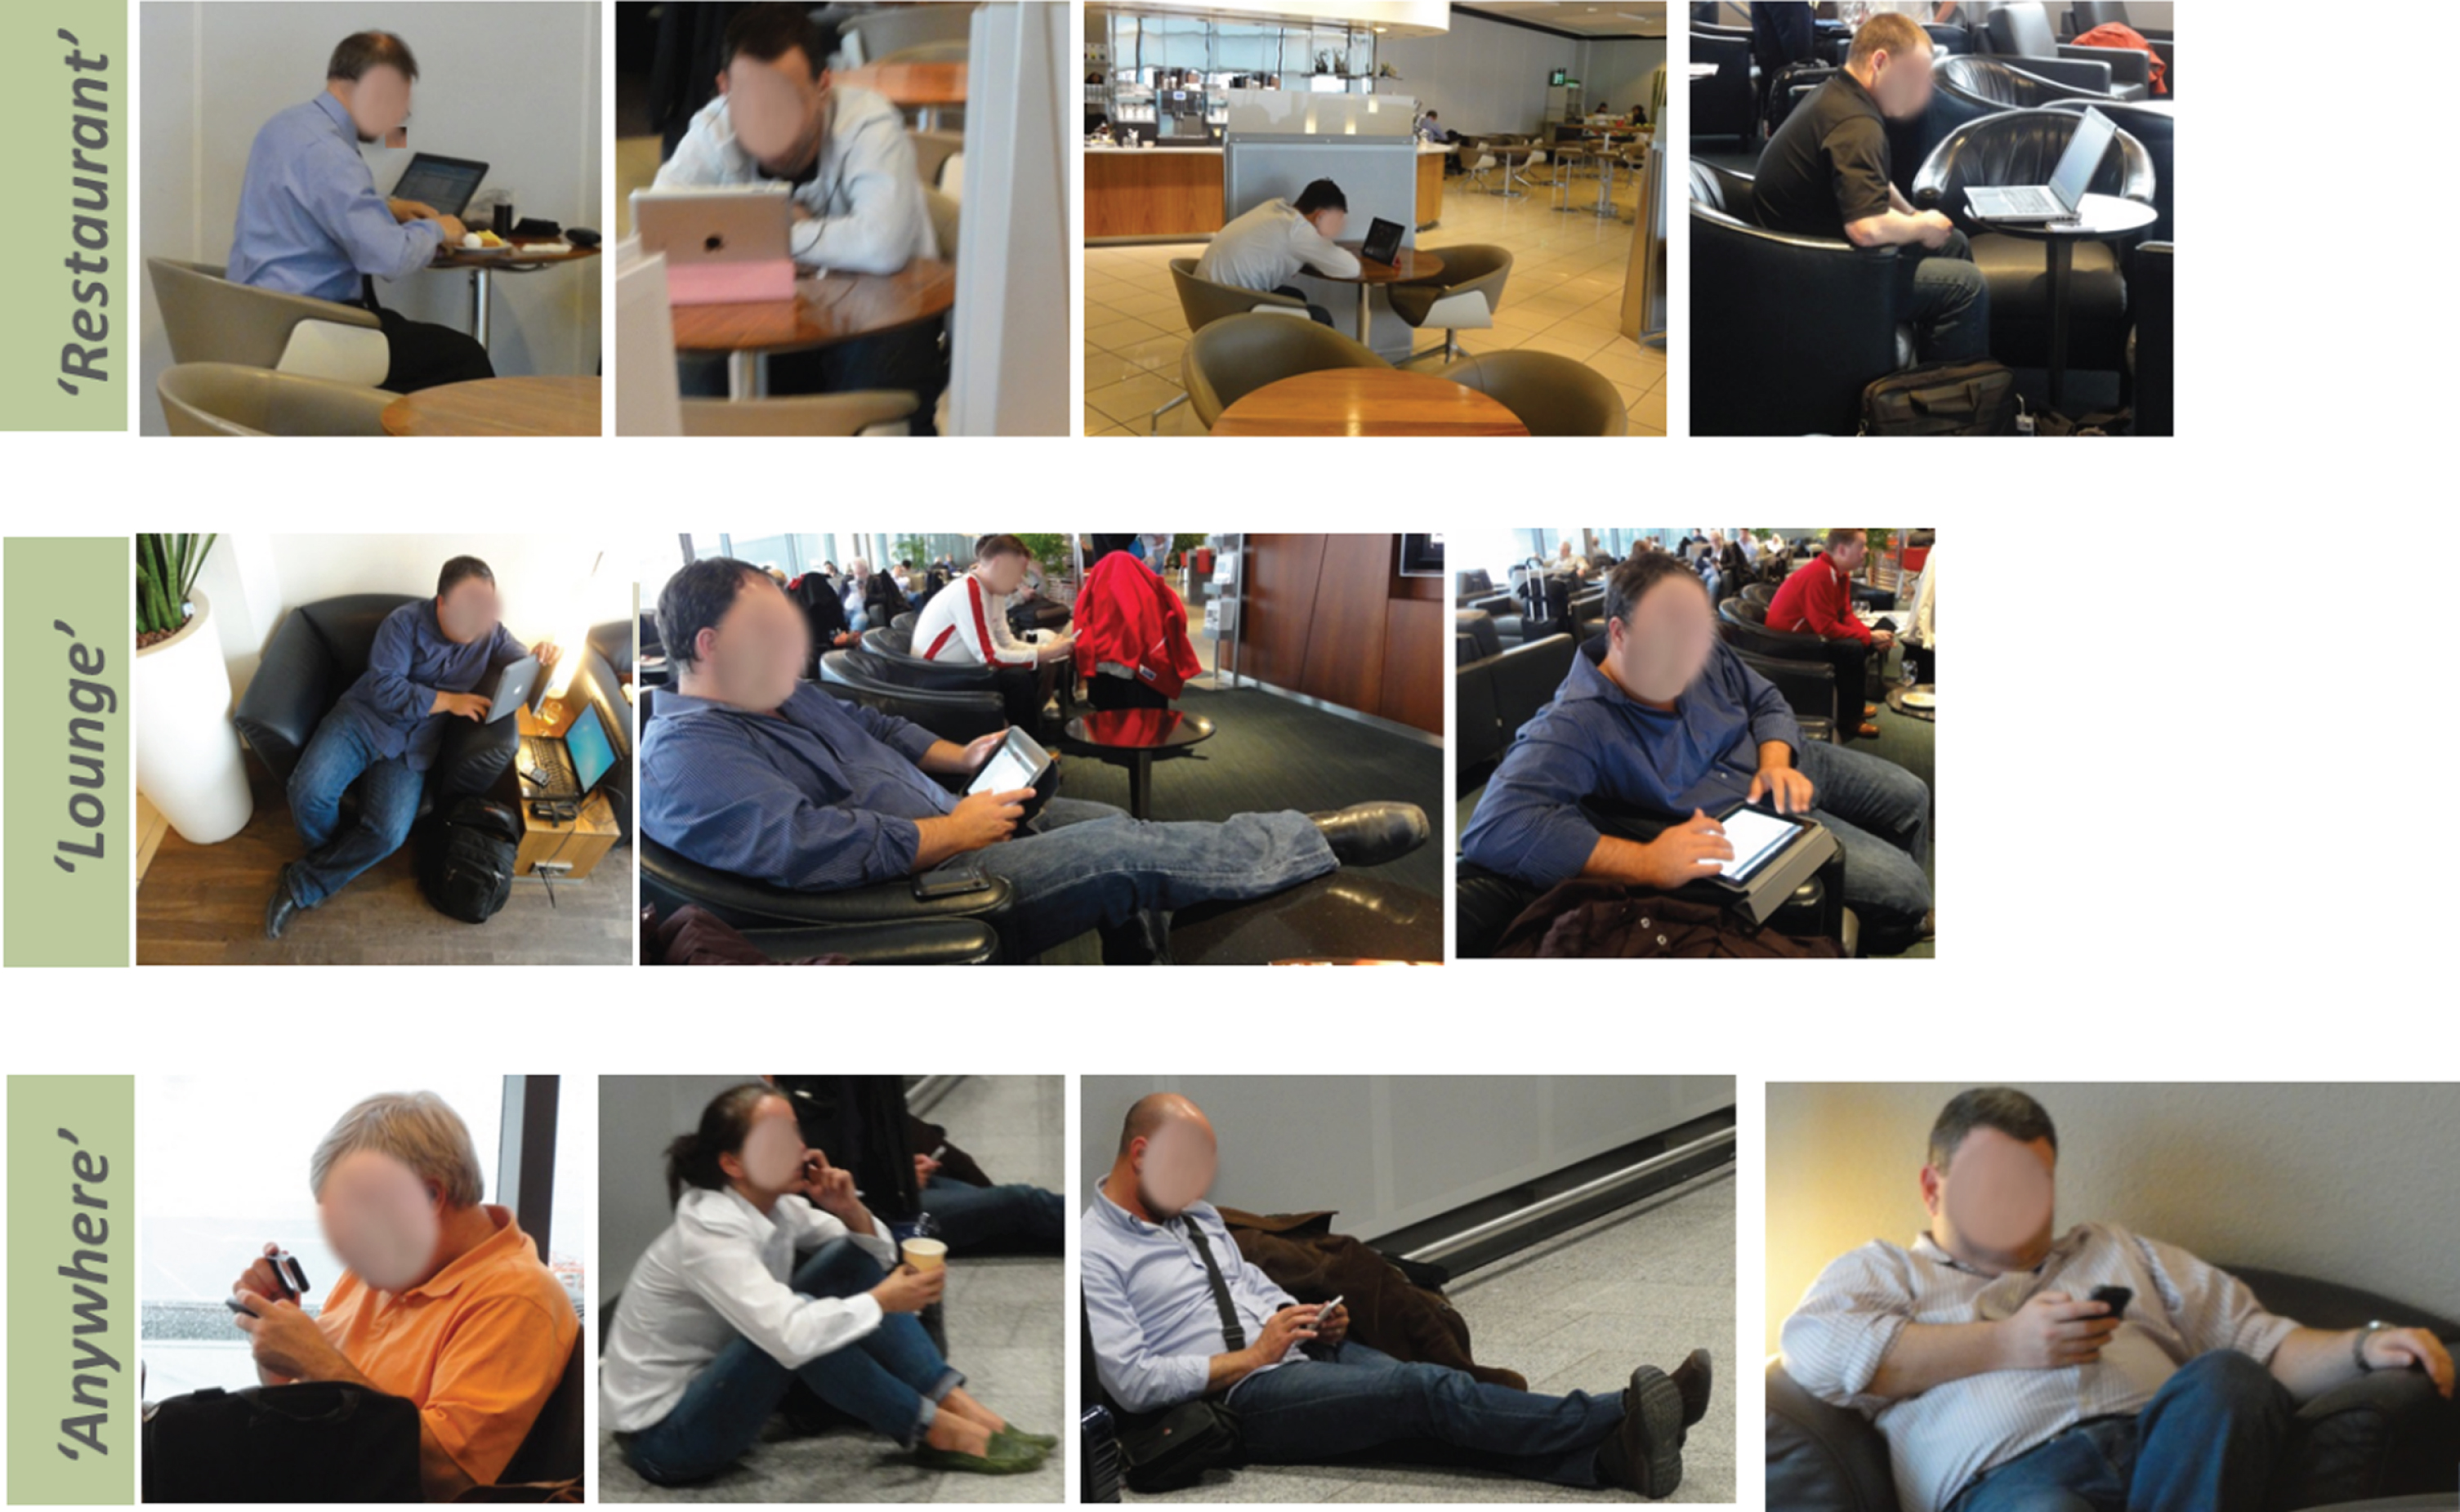
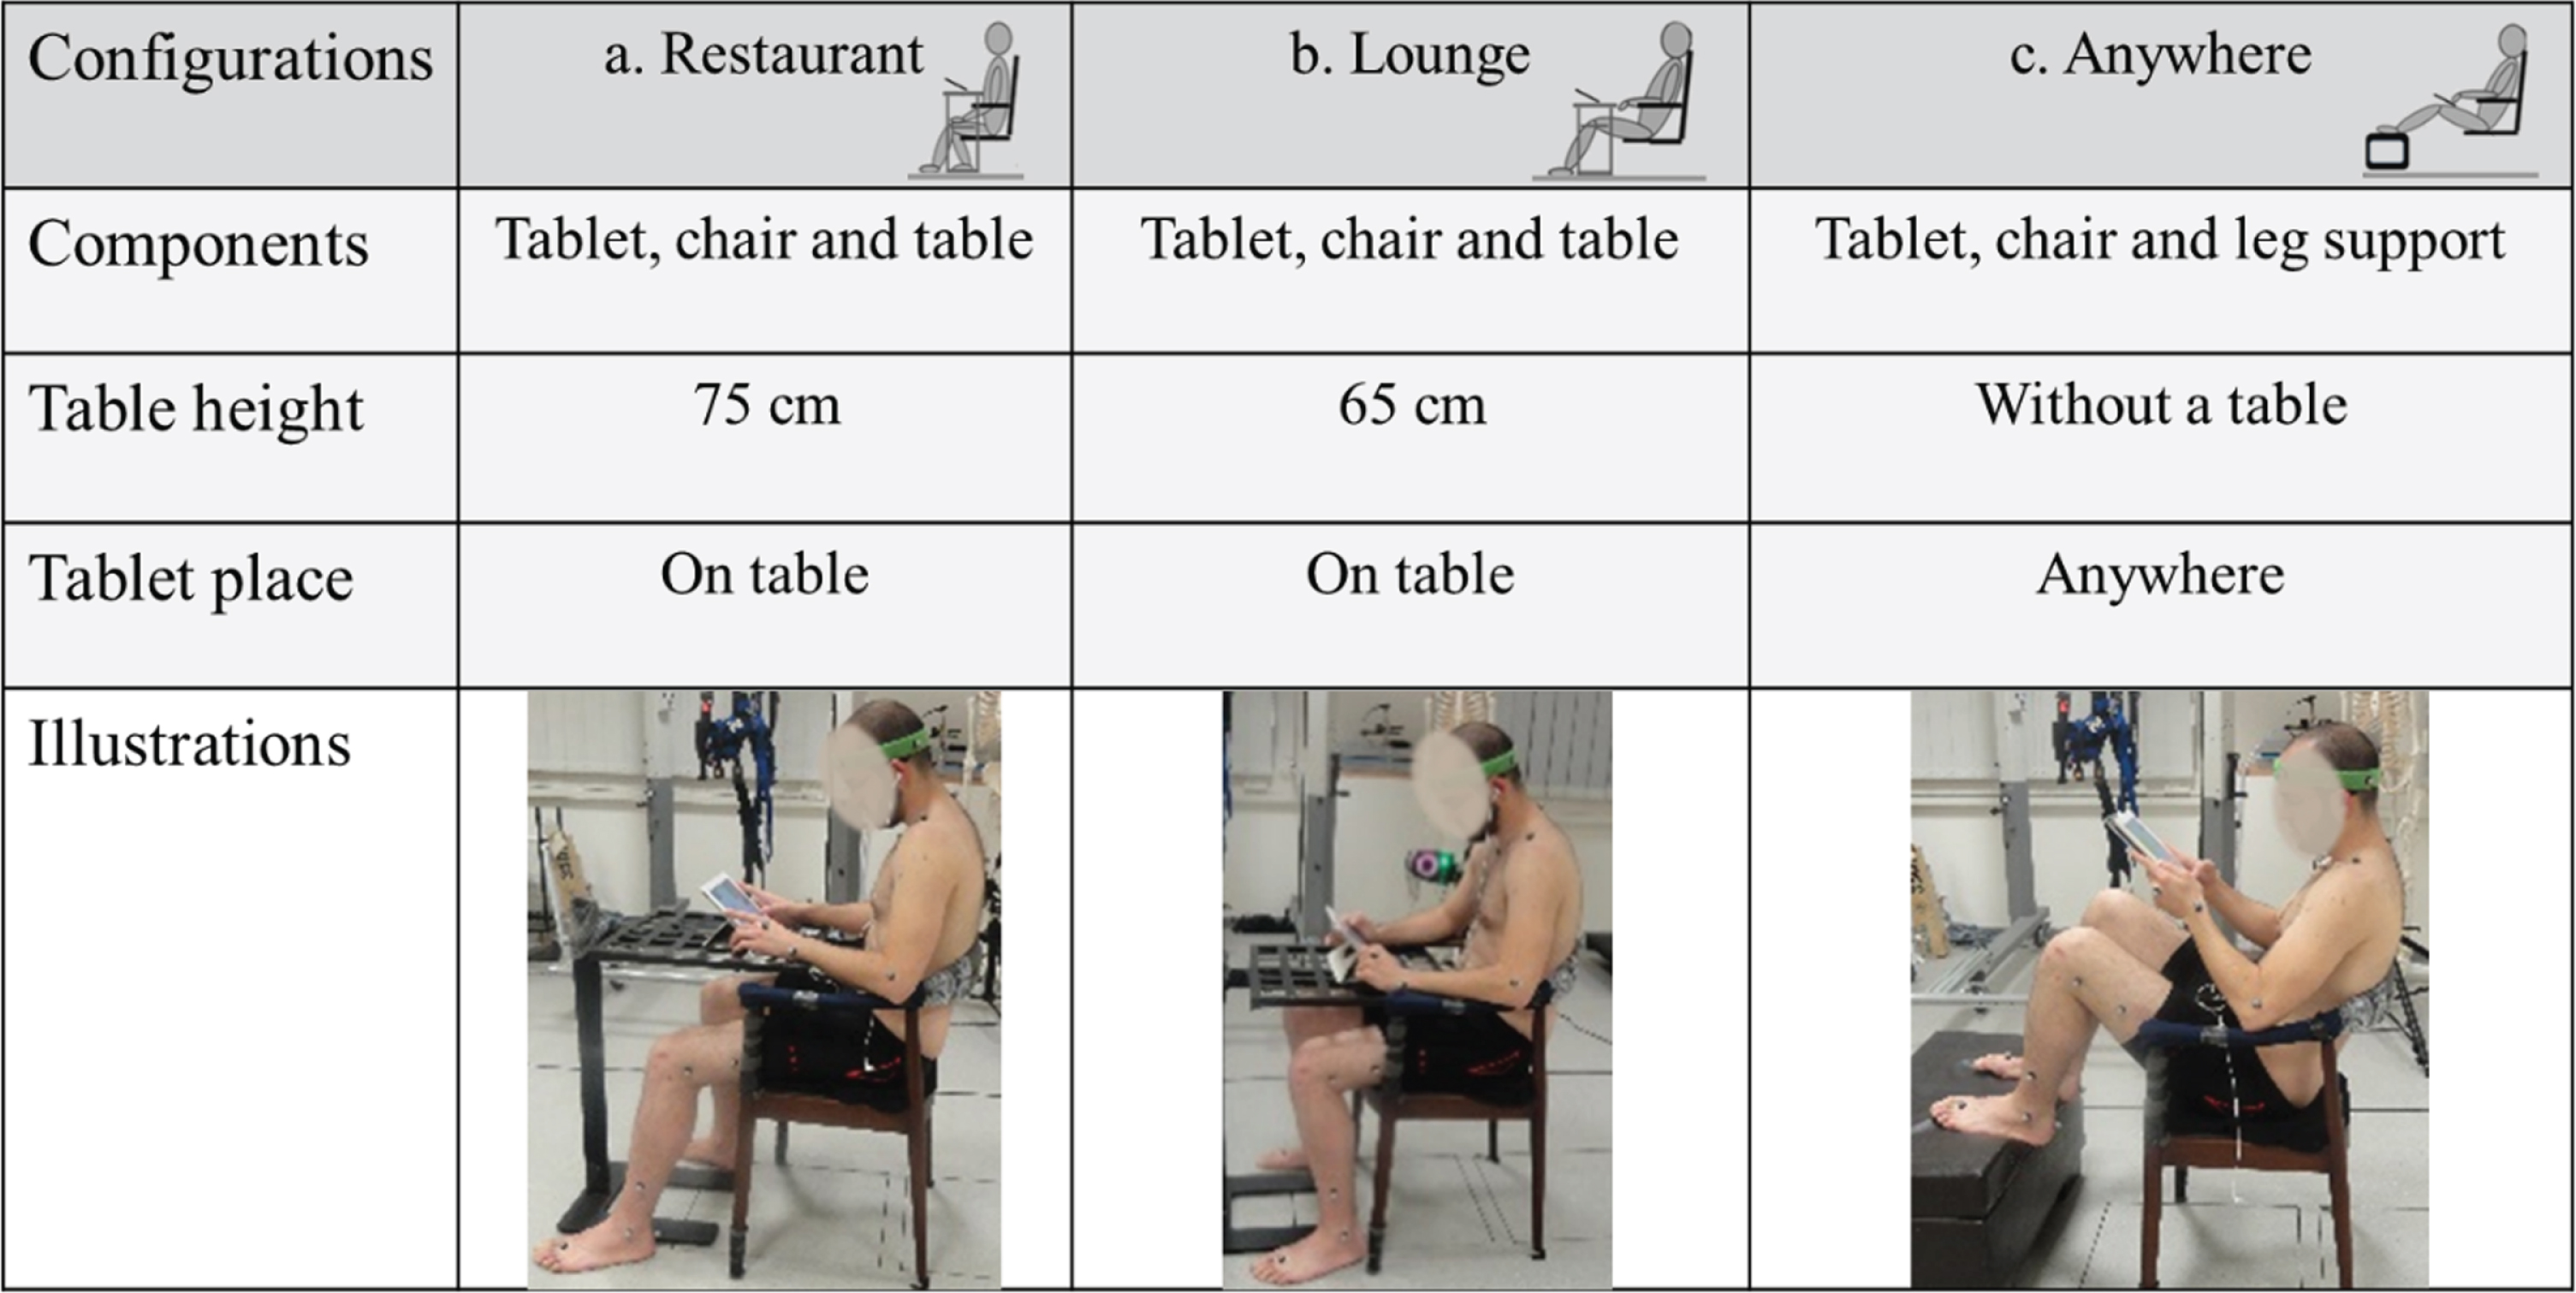
Figure 1 presents configurations of e-worker ITC tasks in the three most common third-workplaces configurations: restaurants, lounges and ‘anywhere’ in the public realm (e.g., sitting on the floor or sitting in a chair without a table).
Fig. 1
Third-workplaces and portable system devices tasks (photographs taken by the author).
The decision to select the three types of workplace configurations used in the current research (Table 2) were based on the following:
• Relevant literature surveys [28, 52, 53];
• Bryant Park third-workplace [48] and the Urban Station hybrid design [47];
• Walzer’s mapping theory (cited in Rogers [54]), defining the three ‘open-minded-spaces’–the ‘restaurant type’, ‘lounge type’, and ‘anywhere type’ (defined as river, hill or lake) –where knowledge may be generated and shared;
• Cranz’s book ‘The Chair’ [55], which challenged the ‘new ergonomics’ forcing the worker into a ‘table and chair culture’. (Note that in the research experiment, with the ‘anywhere’ configuration a table was not provided (Table 2 and Fig. 3).
2Objective and hypothesis
2.1Objective
The objective of this research work is to develop conceptual approach for a biomechanical model for evaluating the postural-comfort levels of mobile e-worker tablet tasks in the public third-workplace.
The research approach was to compare e-worker postural behavior and comfort levels during tablet usage, including:
(1) An interrelation between three assessment methods, using a scenario-based method, an empirical method and an experimental method;
(2) Comparing e-worker postural comfort across three different third-workplace configurations whilst engaged in tablet tasks;
(3) Determining the relative time in which e-worker joints and specified body segments (head, neck, limbs and trunk) were allocated into in the three WMSD risk categories (as based on published data): low-, moderate-, and high-risk levels;
(4) Presenting the research findings in the form of complementary tabulation data;
(5) Determining the extent to which the subjective evaluation of comfort levels related to the objective findings regarding postural behavior as recorded during the study.
2.2Postural behavior hypothesis
Our principal hypothesis was that postural behavior is affected by workplace setting (tablet, table, chair, and leg support) and configuration (restaurants, lounges and ‘anywhere’).
Following the main hypothesis, the specific postural behavior sub-hypotheses were:
(1) Human performance measures (neutral-position cost functions) govern human motion;
(2) Some variability, with regards to postural behavior ROM and comfort, will occur in third-workplace configurations during tablet usage. The variability between the restaurant and the lounge configurations will be less significant than that for the ‘anywhere’ configuration, due to the absence of a table and additional leg support in the last configuration;
(3) Non-neutral postures of the head, neck and elbow will increase during tablet use at the ‘anywhere’ workplace configuration, compared with tablet usage on a table (i.e., in the restaurant and lounge configurations);
(4) The rotation or lateral tilt of the subject’s neck and trunk will be less significant than the subject’s flexion and extensions motions, because the e-worker will often choose to place the tablet directly in front of his body;
(5) Subjective evaluations of comfort will correlate, to some extent, with objective variability.
3Methods
Based on the objective of establishing the database, scenario-based simulated tablet tasks were completed by three e-workers in a MoCap laboratory-based experiment, across three configurations representing typical third-workplaces.
3.1Subject recruitment and selection
The main experiment (n = 3) was based on conclusions drawn from a literature review and pilot study (n = 1) carried out at the Biomechanics Laboratory ([56] http://brml.technion.ac.il/), Technion - Israel Institute of Technology. Three healthy right-handed males, identified as e-workers, were recruited through electronic advertisements published by the Technion-Israel Institute of Technology and through the laboratory administration.
Subjects were not chosen at random, but were selected on the basis of the anthropometric dimensions of an average male (height 175±3 cm, weight 76±3 kg and elbow height from seat 25±1 cm [57]); and age, between 25 to 45 years old, thus ensuring skeletal maturity and limited degenerative changes. The subjects’ profile was 27.5±0.5 years, height 177.5±2.5 cm, weight 76.5±3.5 kg, elbow height from seat 25±1 cm.
Potential research participants were asked to complete two exclusion questionnaires, sent by electronic mail. The first was a socio-technical questionnaire [58, 59] to determine experimental eligibility. The e-worker criterions were based on Hyrkkänen and Nenonen’s [6] definition of an e-worker: a person who works at least ten hours per week away from home and from the main office, i.e., public spaces (named third-workplace), and who uses portable system connections (such as a tablet) when working.
Exclusion criterion included working for less than ten hours per week at a third-workplace, and for less than five of these ten hours with portable systems. Working in other places (not an office or home; i.e. customer site, but not in an office), was included in the ten hours.
The second exclusion criterion was a health questionnaire [60], to screen for WMSDs and determine experimental eligibility. The exclusion criterion included reporting any pain in any part of the body within the last month; this was to ensure that joint ROM, comfort and self-selected postures would not be confounded by WMSD symptoms. Each subject signed an informed consent prior to beginning the research study and paid basis. The Behavioral Sciences Research Ethics Committee at the Technion institute of technology, approved all protocols and consent forms.
The experiment was based on a preliminary pilot study conducted with one research subject, which established the proposed research process and deliverables. To validate the anthropometric data sent by electronic mail, an ergonomic expert confirmed all anthropometric measurements before the start of the research study. The Technicon’s research administration approved all protocols and consent forms.
3.2Equipment and measurements tools
Eight infrared cameras, using the MoCap system (Vicon system; [37] http://www.vicon.com) and with a sampling rate of 100 per minute, tracked and recorded 42 passive reflective markers. A valid Oxford ‘Plug-in gait’ (PIG) full-body protocol, associated with segment ROM (Table 1 and Fig. 2) and WMSD risk levels (Appendix A. Table 1 and Appendix A. Figure 1) was used. Two video cameras (Sanyo digital camera Xacti CA100), placed to the front and side of the subject, were used to determine the interfaces between the body segments and workplace settings. A digital video image was simultaneously photographed, for data quality control purposes.
The subjective measurement tools consisted of five self-reported questionnaires:
(1) A socio-technical questionnaire, adapted from the National Institute for Working Life, the Department of Occupational and Environmental Medicine [58, 59], used to screen subject eligibility and to classify an e-worker according to Hyrkkänen and Nenonen’s definition [6];
(2) A health questionnaire, adapted from the ‘Standardized Nordic questionnaires for the analysis of musculoskeletal symptoms’ [60], to screen for WMSDs;
(3) A Comfort Evaluation Checklist questionnaire (CEC; modified according to Helander and Zhang, [26]), to measure the subjects’ perceived experience of comfort. The CEC was partially funded by the IBM Corporation, based on Kansei Engineering [26];
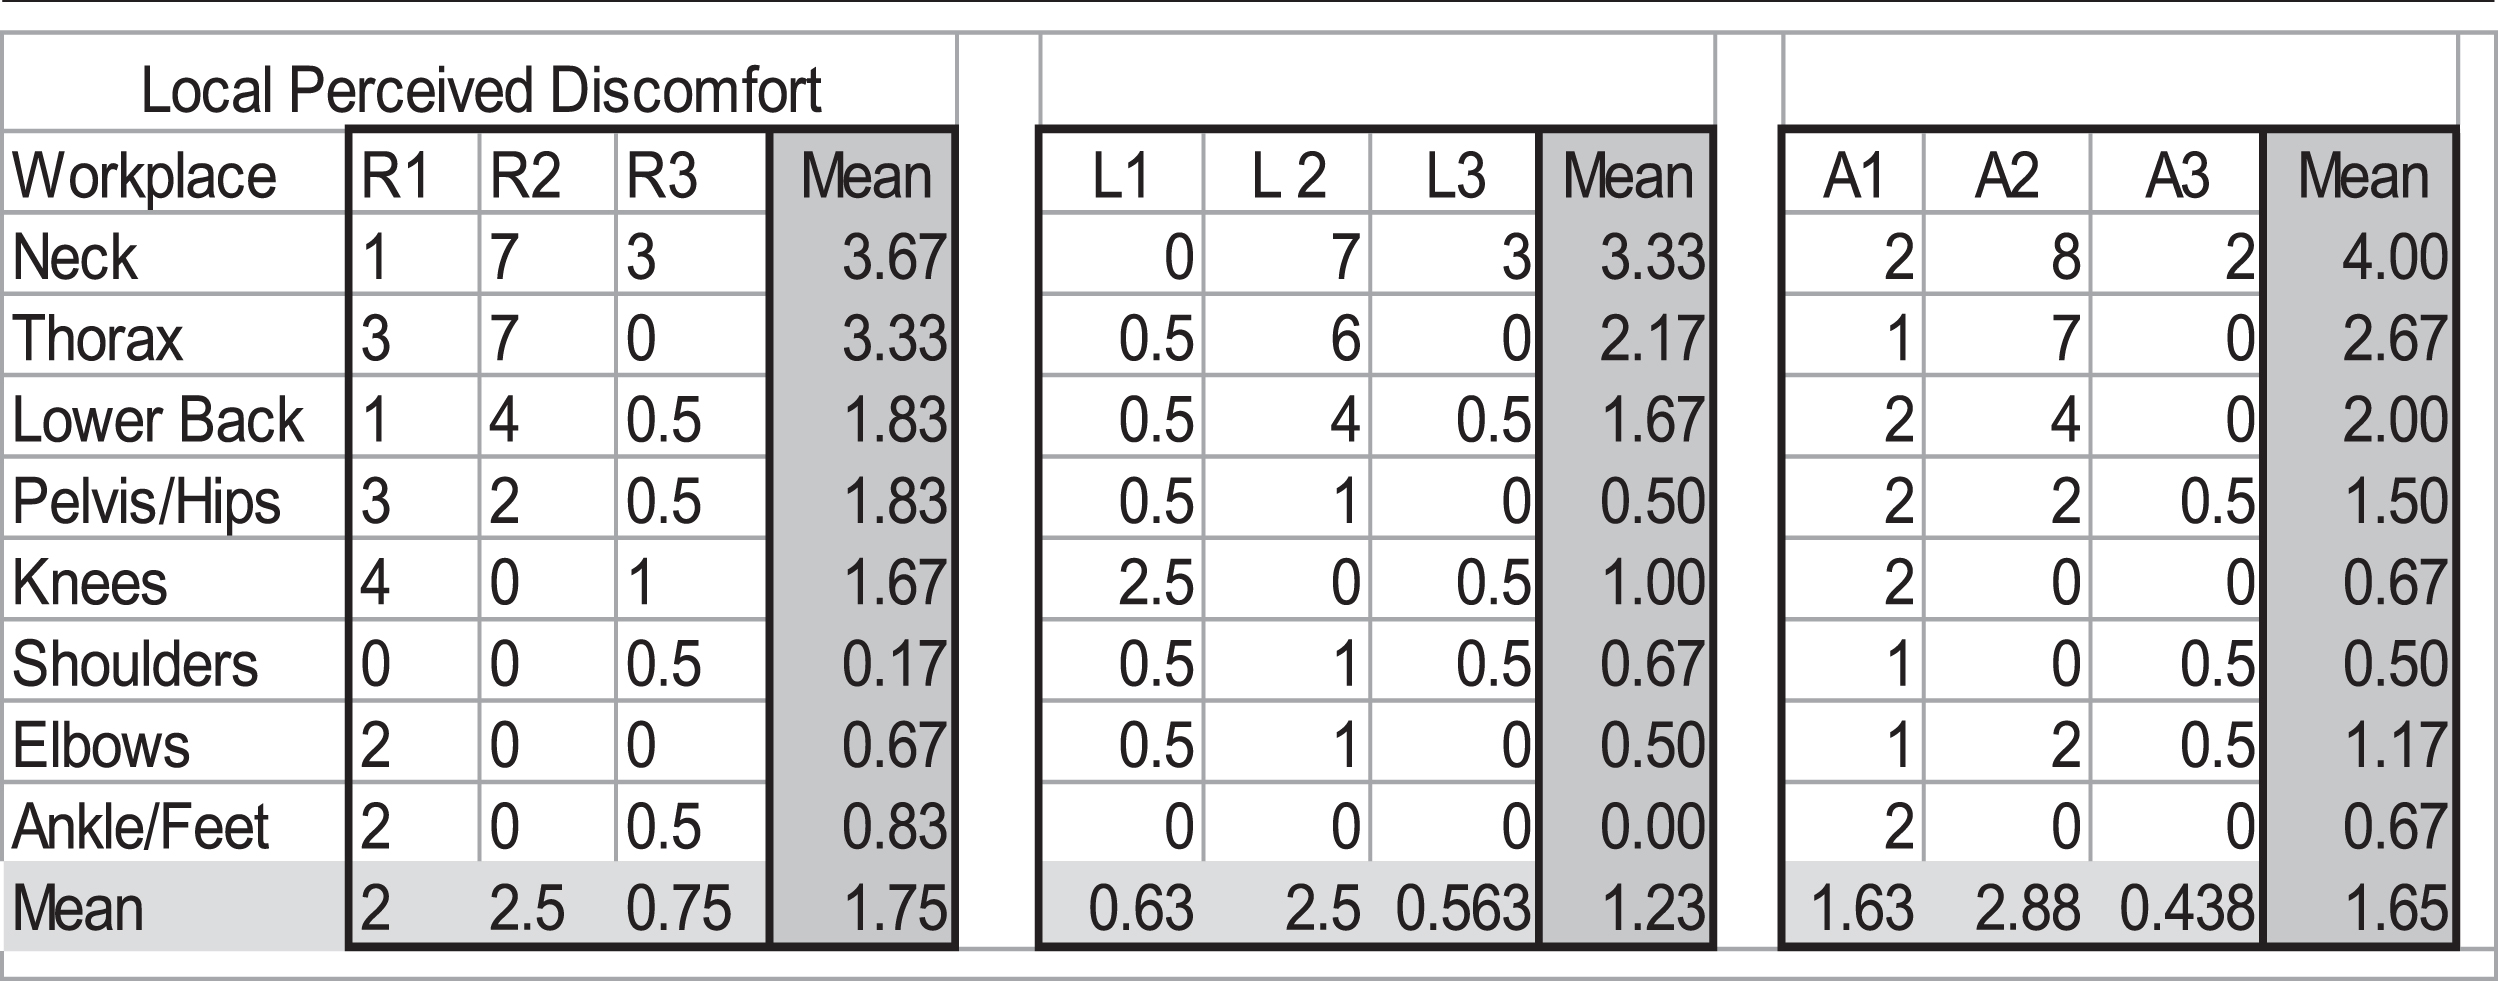
(4) A Locally Perceived Discomfort Questionnaire by Borg (LPD; modified according Van der Grinten and Van der Smitt [32]), to determine discomfort experienced in different areas of the body. Based on Borg’s category, the LPD’s ratio scale from 1 to 10 defines the intensity of discomfort. A high score signified a higher degree of discomfort in that area of their body;
(5) A General Comfort Evaluation Questionnaire (modified according to Helander and Zhang, [26]), which deploys a scale from 1 to 9, like the CEC questionnaire (3) above.
3.3The principles of the biomechanical model
The whole body of the research participants was replicated in the form of a biomechanical model, composed of joints and rigid segments connected by anatomically restricted articulations. This model was based on the valid Oxford PIG full-body protocol [61–63]; (Appendix A. Table 1 and Appendix A. Figure 1).
Angular kinematics were captured by a gap filling (Woltring filter by Nexus 1.8.2 software; [37] https://www.vicon.com/products/software/nexus) and were then exported to a C3D format, for CAD software and text fills for statistical analysis. Joint angle calculations were performed by Vicon Bodybuilder (Vicon Peak, Oxford, UK; [37] https://www.vicon.com/downloads/software/bodybuilder), assigning a coordinate frame to every major body segment, comparing the relative movements of distal segments to their proximal segments as presented in Table 1 and Fig. 2.
3.4Experiment protocol
Presumption that a seated e-worker can be represented by a system of links, a valid Oxford PIG full-body protocol ([37] http://www.vicon.com/), defined by 42 passive reflective markers, was tracked and recorded for each research subject. An ergonomics professional and laboratory engineer placed the 42 markers on the subject’s body and captured a T-pose position. Each marker was labelled and the relevant body segments were reconstructed accordingly. The vertices for each segment were defined by the relative positions of the reflective markers. Using a Cartesian coordinates system (CCS, e.g., X/Y/Z axes, Table 1 and Fig. 2), the locations and orientations of segments were determined for the three-workplace configurations.
3.4.1Workplace configurations
The three third-workplace simulated configurations (Table 2 and Fig. 3): ‘restaurant configuration’, ‘lounge configuration’, and ‘anywhere configuration’ were tested in a randomized order.
Table 2
Three third-workplace configurations: ‘Restaurant’, ‘Lounge’ and ‘Anywhere’ (refers to Fig. 3)
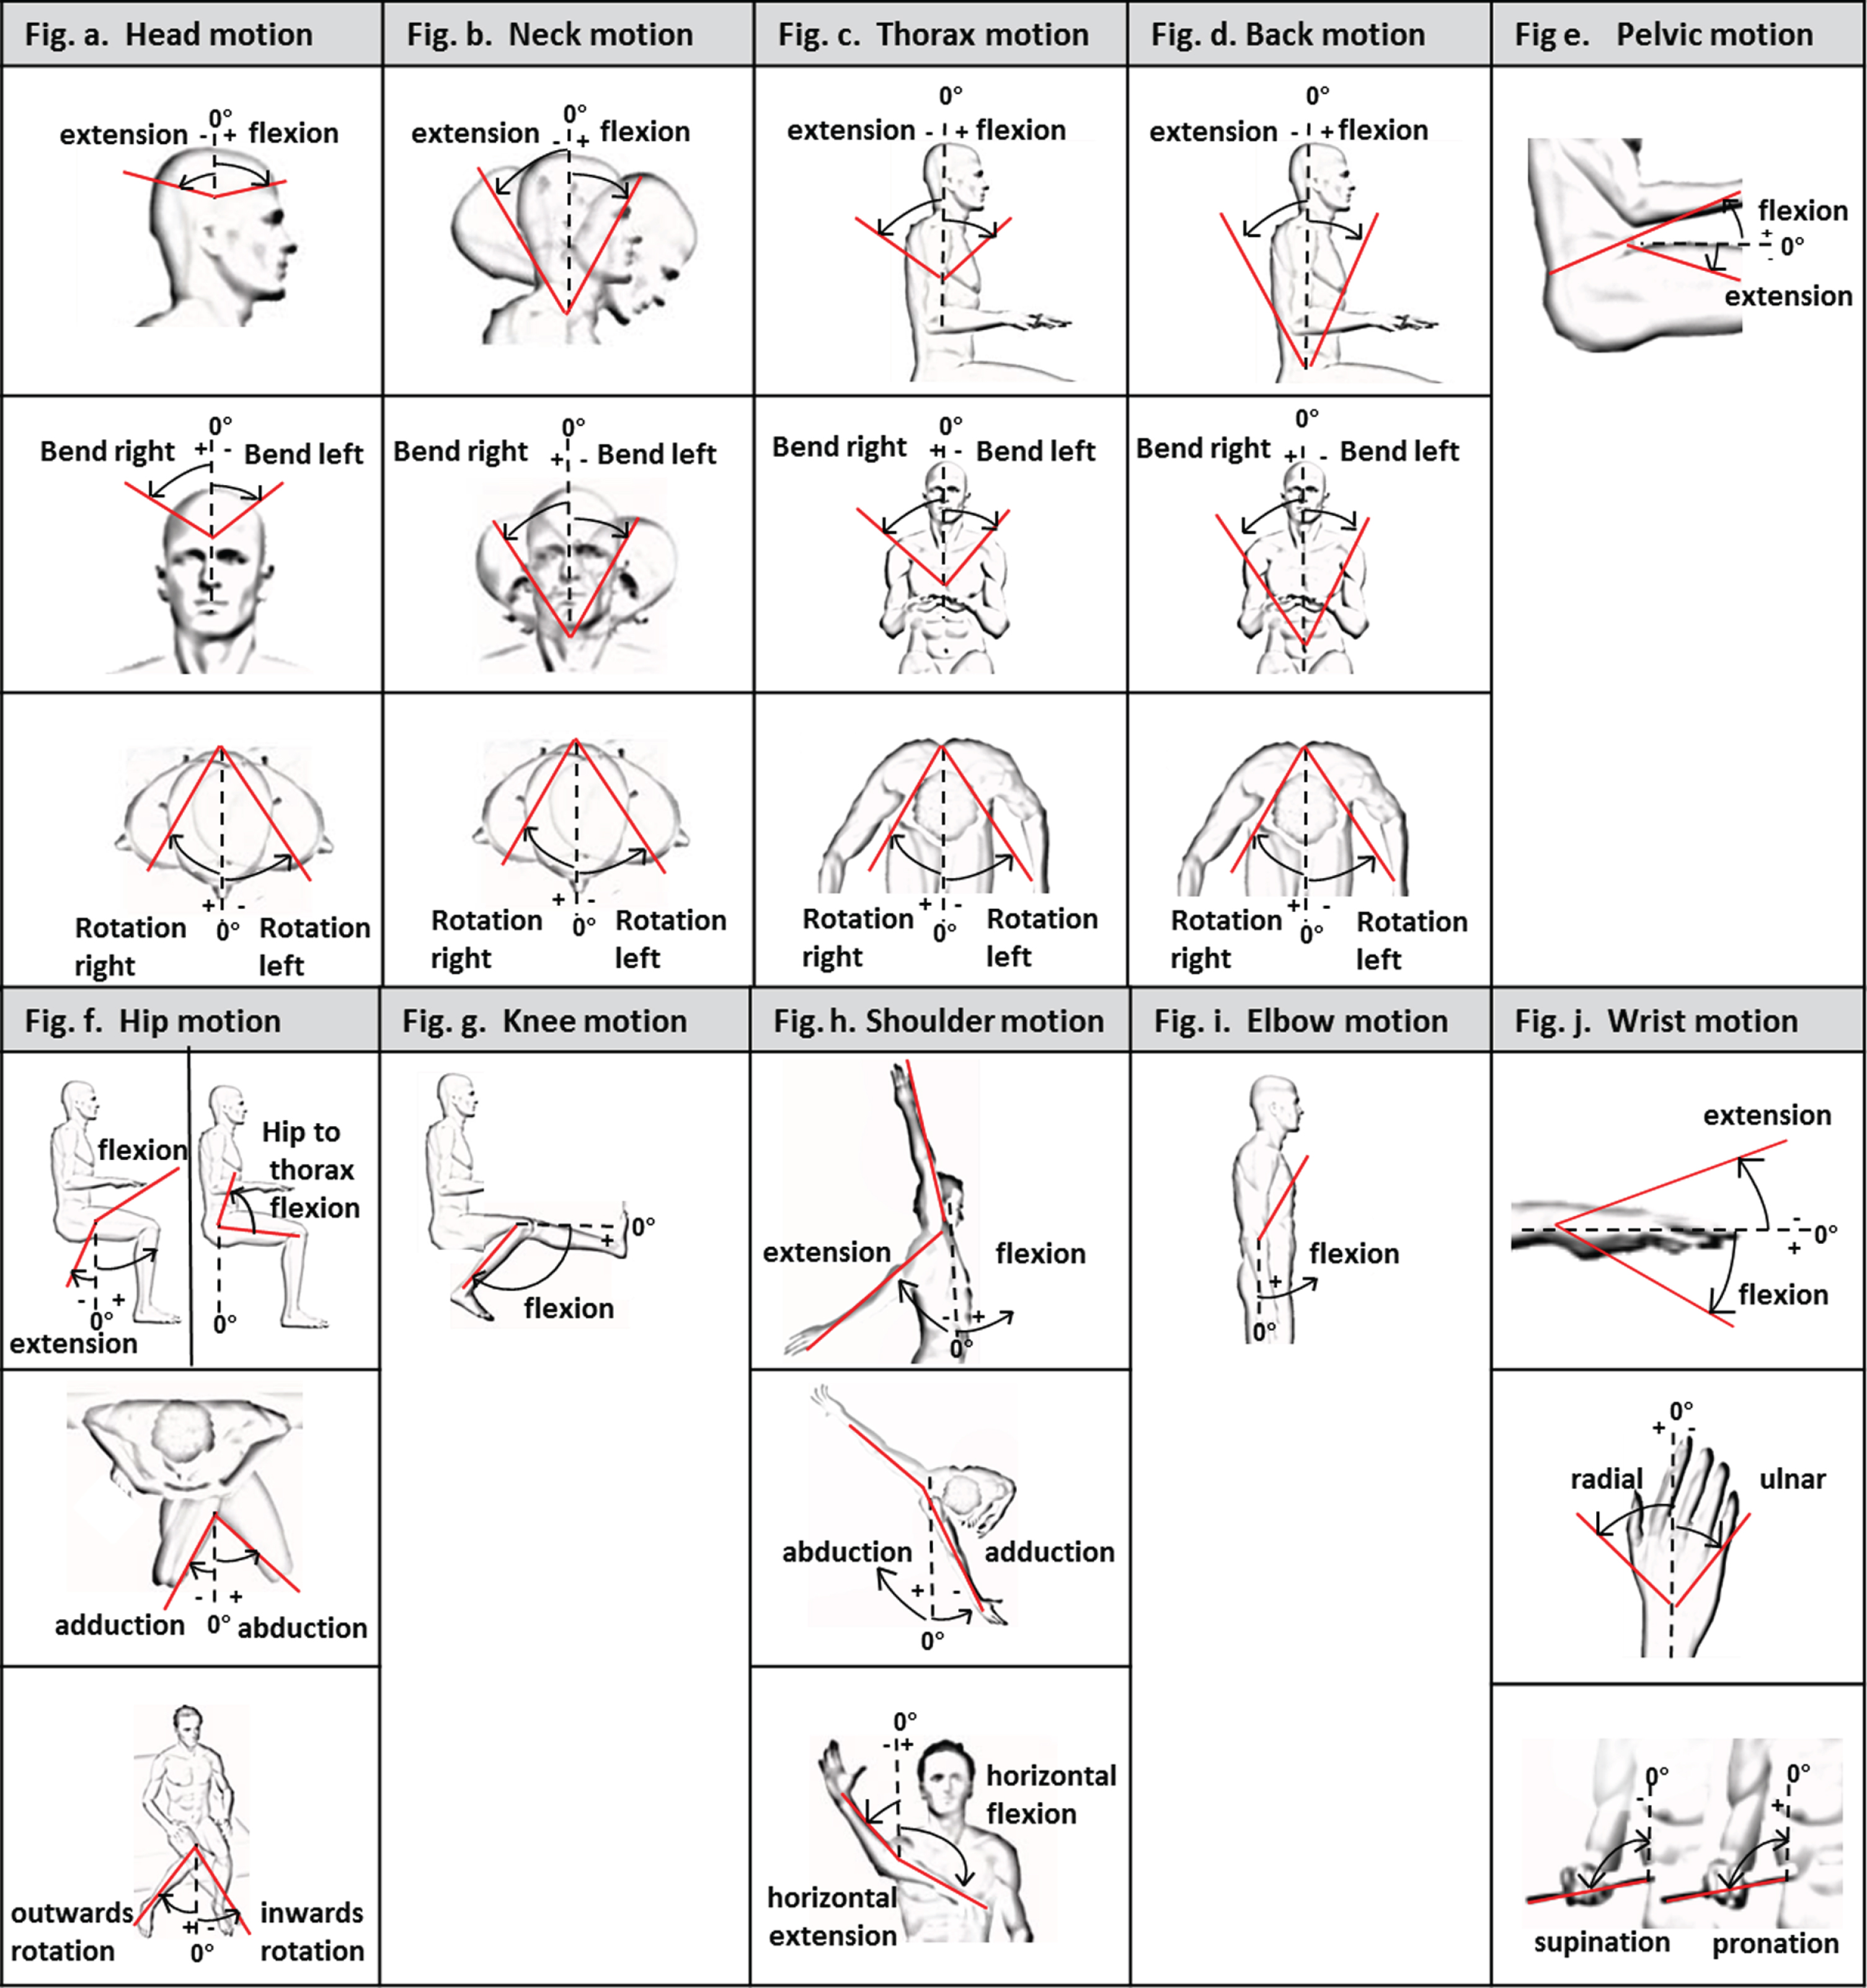 |
Fig. 3
Three third-workplaces setting dimensions (in cm or degrees): a. leg support, b. table, c. chair (refers to Table 2).
All experiment-setting dimensions were based on recommendations from Panero and Zelnik [57], except the lounge table height, as no relevant data was found.
In the laboratory, there was indirect lighting, and the settings were positioned to minimize glare on the tablet screens. Background noises appropriate to the three workplaces, and the smell of coffee, was provided at each configuration. The subjects all used a 10.1 inch tablet computer at each of the three configurations (Samsung Galaxy Tab A, 32 gigabyte, main display: 255 milimeters, weight 525 grams; https://www.samsung.com/).
3.4.2Procedures
The subjects worked on the tablet for eight-minute periods at the three randomized workplace configurations (e.g., the restaurant, lounge and anywhere configuration). Data was recorded only for the last six minutes of each trial, providing a total of 18 minutes of recorded data for each research participant across the three workplace configurations. For each configuration, the subjects completed a pre-determined simulated e-worker tablet task. The simulated task involved a combination of typing text, pointing, clicking on icons and a comprehensive reading exercise. The tasks were designed to require relatively equal amounts of tablet-keyboard interaction and inactivity (e.g., reading text from the screen).
Instructions were drawn from the pre-study conclusions, based on the e-workers’ free choices and habits and designed to maximize comfort and natural behavior. Each subject was instructed to take a two-minute break before the start of each configuration trial, and a further two minutes to adjust to the workplace setting. The aim was to ensure that they manifested natural behavior and comfort feelings, i.e. holding or placing the tablet in a comfortable position.
After beginning to work at each configuration, no further adjustments or modifications were allowed. External input peripherals devices were not provided for any of the configurations, except for a headset. Subjects were instructed to use the tablet’s case on the table at the restaurant and lounge configurations. During the experiment, the crossing of arms and legs was not allowed, for technology limitation reasons.
Before each configuration trial, the subjects were instructed as to the nature of the task to follow. If a problem arose, such as a marker falling off, the trial was repeated. After each configuration trial, the subject completed two questionnaires (Appendix B. Table 2):
the CEC and Borg’s LPD questionnaire. After working at the three laboratory configurations, each subject completed the General Comfort Evaluation Questionnaire (Appendix B. Table 2).
3.4.3Postural comfort classifications and database composition
Comfort level and WMSD ROM classifications were based on the most cited Rapid Upper Limb Assessment (RULA, [36]), and the Novel Ergonomic Postural Assessment Method (NERPA) [64]; based on RULA classifications. The risk levels are (Appendix A. Table 1 and Appendix A. Figure 1):
(1) Low-risk level –neutral ROM: Preferred zone for most movements. ROM presents complete comfort or minimal discomfort to the joint and adjacent body segments. Subject completely relaxed, with no stress on muscles and joints;
(2) Moderate-risk level: ROM can be achieved, but with some discomfort to the joint and adjacent body segments and with some stress on the muscles and joints;
(3) High-risk level: An extreme ROM position for limbs, creating greater strain on muscles and joints, which could lead to WMSDs and should be avoided, if possible.
To evaluate the readability of the research source data, some findings were based on or compared against the American Academy of Orthopaedic Surgeons (AAOS) source data [65] https://www.aaos.org/, Tilley’s book [66], clinical sources [66, 67], the latest MIL-STD 1472G [31], and the drivers’ ROM recommendations [68]. The RULA study [36] and the NERPA study [64] are both based on the AAOS [65] gold standards.
Database composition (Appendix A, Table 1 and Fig. 1): The assessment was based on WMSDs risk levels categories, as derived from different literature sources. The main source database was the RULA [36] and the NERPA Method [64] based on RULA, for completion and comparisons. For joints and articulations (e.g., hips, pelvis and knee), the risk-level categories were based on other sources, as the RULA and the NERPA does not refer to them.
The RULA method has previously been used for laptop work posture analysis [69]; therefore, it was deemed applicable for portable devices in relation to sedentary tasks, including back support and shoulder support [70].
The RULA scoring system: The research study’s ROM risk-category levels were based on the RULA scoring of the back and shoulders support factor [36].
Three ergonomics experts reviewed the video films recorded over the course of the study, and found that for almost 95% of the working time recorded during the laboratory trials, all three research participants leaned on the chair back for support, and that both arms were supported on the armrests, with both their legs supported. Hence, according to the RULA recommendations, all risk level categories for the back and thorax were scored as at low-risk level. With regards to the shoulders, according to the RULA recommendations, if the shoulder ROM was rated as a high-risk level but were mostly supported, then the score category should be at the moderate-risk level. For moderate- and low-risk levels but with supported shoulders, the risk level was scored as low-risk. For leg support, no relevant recommendations were provided.
The RULA ‘load-ranking factor’ and the ‘muscle-use factor regarding static posture’ did not coincide with the laboratory tablet tasks. The RULA force-ranking system focuses on loads of between two to ten kilograms. In the current laboratory study, the only weight the subject held was the tablet, which weighed 525 grams. The RULA muscle-ranking system focuses on repetitive action occurring more than four times per minute, or more than one minute of static muscle use. In the present study, the six-minute analysis of diverse laboratory tablet tasks was not significant enough to justify this evaluation. Further analysis is recommended.
Following the RULA risk level categories and factors, the model database and statistical analysis was calculated and presented for further developments.
4Results
4.1Statistical analyses
Statistical analyses were performed (Excel and Access software, Microsoft, Tables 3 and 4, Appendix B. Tables 1 and 2) focusing on the research objective and hypotheses, based on the MoCap experiment and the self-reported questionnaires. Mean joint ROM angles (maximum–minimum and standard-deviation), taken during a six-minute trial of each joint, were calculated. Differences in the prevalence of WMSDs between each of the three required workplaces were established by the percentage of the experiment time line, according to the three postural comfort classifications.
Table 3
Comparison of the mean values across the participants’ research study: determining the relative time (percentage) during which the e-worker’s joints and segments were distributed across the three WMSDs risk categories, at each of the three configurations: Restaurant (R), Lounge (L) and Anywhere (A) (refers to Appendix A. Table 1)
| Field | Head | Neck | Thorex | Back | Pelvis | Hip | Knee | Shoulder | Elbow | Wrist | AVR |
| Low level A | 48% | 57% | 100% | 100% | 67% | 25% | 33% | 100% | 34% | 47% | 58% |
| Moderate level A | 23% | 25% | 0% | 0% | 0% | 50% | 1% | 0% | 66% | 53% | 22% |
| High level A | 28% | 18% | 0% | 33% | 33% | 25% | 65% | 0% | 0% | 0% | 20% |
| Low level L | 69% | 78% | 100% | 100% | 29% | 37% | 26% | 100% | 84% | 23% | 64% |
| Moderate level L | 4% | 13% | 0% | 0% | 71% | 38% | 60% | 0% | 16% | 77% | 28% |
| High level L | 27% | 9% | 0% | 0% | 0% | 25% | 14% | 0% | 0% | 0% | 8% |
| Low level R | 64% | 72% | 100% | 100% | 28% | 37% | 47% | 100% | 66% | 34% | 25% |
| Moderate level R | 8% | 9% | 0% | 0% | 72% | 38% | 28% | 0% | 34% | 66% | 26% |
| High level R | 28% | 19% | 0% | 0% | 0% | 25% | 25% | 0% | 0% | 0% | 10% |
Table 4
Comparison between the three workplaces: Hip angle comparisons between three subjects (left table); neck flexion-extension (middle table) and rotation (right table), determined by the percentage of the experiment time line (refers to Appendix A. Table 1)
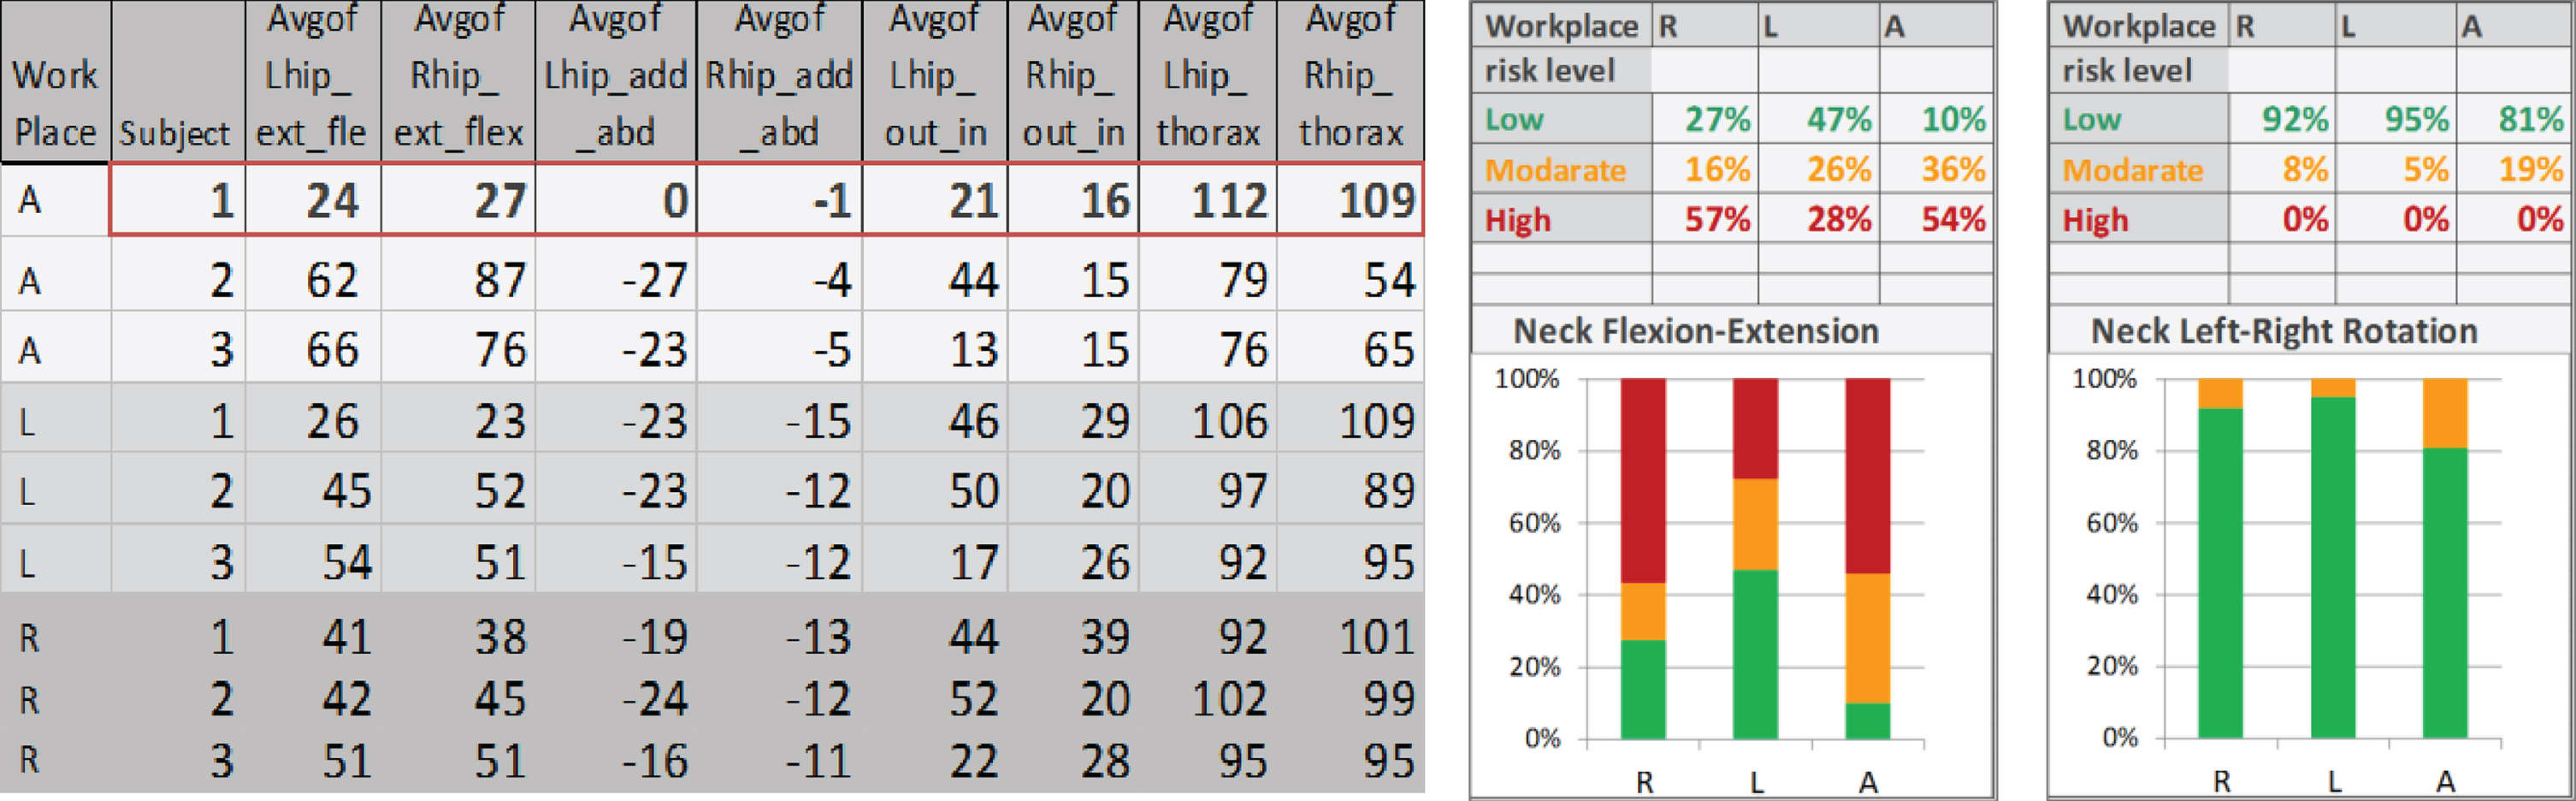 |
Abbreviations: A (Anywhere), L (Lounge), R (Restaurant), ext (extension), flex (flexion), L (left), R (right), add (adduction), abd (abduction), In (inwards rotation), Out (Outwards rotation), Avg (average).
The MoCap numerical data may be presented in a number of ways.
(1) Comparison of all the joints and segments, determining the relative time (percentage) during which the e-worker’s joints and segment were placed into the three WMSDs risk categories at each of the three configurations (Table 3);
(2) Comparison between the three workplace configurations, focusing on specific joints, as determined by the ROM angles measured (Table 4, left);
(3) Comparison between the three workplace configurations, focusing on specific joints, determined by risk level categories over time (Table 4, middle and right).
In order to accommodate the numerical tabulations with regard to the biomechanical model, color-coding schemes were utilized (e.g., Table 4, middle and right table). The ‘traffic light symbolism’ (green, orange and red), relating to the three risk level categories at each joint (low, moderate and high, respectively), was then utilized.
4.2Preferred postures according to three WMSDs risk levels categories
Differences in the prevalence of comfort between the three workplaces configured were determined by the percentage of the experiment time line that reflected the three WMSDs risk levels categories outlined in the literature (Appendix A. Table 1). There was no significant average ROM appearance in the neutral range) low-risk level) between the three configurations, or in the average ROM between the three risk levels for the restaurant and the lounge configurations (Table 3). These findings confirm our first sub-hypothesis, that human performance measurements (neutral-position cost functions) govern human motion generally; nearly 62% of the time on average, across the three configurations, the e-workers’ joints and segments tended to remain in the neutral position range.
Furthermore, as we assumed (second sub-hypothesis), the high-risk variability was less significant between the restaurant and the lounge workplace (a 10% high-risk level in the restaurant configuration, and an 8% high-risk level in the lounge configuration) compared to the anywhere place (a 20% high-risk level). One possible explanation for this is the use of the table in the restaurant and the lounge configurations, which enhanced the tablet tasks. Moreover, and in relation to the third sub-hypothesis, the percentage of the head, neck, elbows and hips angles had more of a neutral tendency in the restaurant and lounge configurations than the anywhere configuration. Again, one explanation for this may be the lack of table support and additional leg support in the anywhere configuration.
A specific analysis of the pelvis and the wrist showed some advantage with regards to the neutral tendency in the anywhere configuration; nevertheless, the highest risk level was for the pelvis in the anywhere configuration. Following the RULA scoring factors, the risk levels of the thorax, the back and the shoulders were low across all three workplace configurations, as most of the time the e-workers leaned on the chair back support and hand rests.
For subject 1 (Table 4, at the left, row number 1), it was assumed (second sub-hypothesis), that the anywhere configuration might offer higher variability of postural behaviors and preferences. Subject 1 chose different postures to the other two subjects.
4.3Analysis of the questionnaires
As opposed to the fifth sub-hypothesis, e.g., subjective evaluations of comfort will correlate, to some extent, with objective variability, an analysis of the CEC and the LPD questionnaires (Appendix B. Table 2) demonstrated no significant values or correlations with regards to the objective findings (Appendix B. Table 2). Nevertheless, from the pilot trial conducted with one subject, noteworthy subjective values were determined. This may be explained by technical difficulties encountered in the laboratory setting, which necessitated several repetitions of each of the three configurations –leading to more than eight minutes of ‘work’ at each of the three workplace configuration.
The evidence literature supports the assertion that the design of workplace configurations and settings has an effect on user perceptions of comfort [1, 17–19].
We suggest that the CEC questionnaire discrepancy, with regards to the laboratory environment, may have emanated from the 42 marker-base system and lengthy setup process, which possibly hindered the subjects’ neutral behavior and patience. An ongoing alternative development of a marker-less system (e.g., Simi system [38]; Xsens system [39]), may improve the issue described above.
We assume that longer trials, with a wider range of e-worker research participants third-workplaces (e.g., a chair without an armrest, or a configuration including just a chair), will produce significant comfort values and some correlation with the study’s objective findings.
5Discussion
The study of postural behavior during the performance of tablet tasks: The experiment demonstrated that the scenario-based case study process typically involves multiple variables, including workplace factors, body joints and different postural behaviors. These were compared and analyzed, determining the relative time during which the e-worker’s joints and segments were allocated into the three WMSD risk categories, as determined by empirical published data and compared against subjective self-reported questionnaires.
5.1Limitations
This was a laboratory study of simulated tablet tasks, with a small and homogeneous e-worker male research participant group, and with a large amount of instrumentation. The workplace settings and subjects’ postures were adapted to laboratory environments and technology limitations. As a result, subjects may have altered their short-term behavior from the natural interactions that would manifest over a longer period.
Future MoCap based model applications: The current developed technology permitted interactive, real-time simulation and evaluation through human input via MoCap technologies. However, MoCap for ergonomics requires the use of expensive equipment (such as the Vicon system; [37] http://www.vicon.com/) and the creation of props or settings to represent the environment or product. The latter was occasionally impossible, difficult to obtain or artificial (as would be the case, for example, with conveyer belts in an assembly line, or in different natural conditions).
Moreover, the Vicon marker-based system was cumbersome, time-consuming and expensive, and reliant on professional expertise. It took a significant amount of time to attach the 42 markers to each subject. It seemed that the research subjects were, to some extent, not moving naturally or not moving enough, due to their self-consciousness about the markers.
6Conclusions and recommendations for the future
The experiment findings demonstrated that the postural comfort assessment model can serve as a useful assessment tool to determine factors relevant to e-worker body postures and preferences.
Assuming that the design of workplace configurations and settings (e.g., table height) affects postural behavior (corresponding to the main hypothesis), some findings and recommendations for future MoCap experiments and assessment tool are suggested:
(1) The subjects were instructed not to cross their arms and legs, due to technological limitations. Additional research effort should be invested in permitting such positions;
(2) A fourth configuration, a chair alone, is recommended, given that this is assumed to be the position with the highest neck risk. This will confer some validity to the current postural comfort process;
(3) It is recommended that the analysis should be of the six minutes following ten minutes of tablet tasks at each trial configuration; two minutes of work might be not sufficient. This recommendation is made in light of previous studies, showing that stable posture, muscle load and productivity measurements are obtained after the first ten minutes of work [53];
(4) More accurate assessments must be made relating to the relevant data for research purposes, such as the left and right segments and joints readability (comparing the data of each side separately), along with a deeper understanding of the gaps –if any –between each side;
(5) The additional RULA factors (e.g., load-ranking, muscles-use and body support) should be included in the WMSD risk factors assessment, to enrich the tool’s capabilities.
In general, for future postural assessment models we recommend facilitating the process by using more sophisticated measurement devices and techniques, such as a marker-less system, e.g., the Simi or Xsens system [38, 39].
We believe that with a marker-less system, it will be possible to achieve a significant reduction in setup time (as no markers are attached to the subject’s body, furniture or tablet), and a reduction in costs (more affordable and available for designers and other professionals). This, additionally, may enable the subjects to work more naturally than with the Vicon system.
Conflict of interest
No potential conflict of interest was reported by the authors.
Funding
This research did not receive any specific grant from funding agencies in the public, commercial, or not-for-profit sectors.
Appendices
Appendix A
Appendix A. Table 1.
Ergonomic evaluations based on ROM categories from different literature sources (in degrees; Refers to Appendix A. Figure 1)
| Fig. no. | Segment | Movement | Low level (Neutral position) | Moderate level | High level | Source |
| A | Head | Ext-Flex | 0–10 | 10–20 | <0°/>20 | 1 |
| Lbend-Rbend | (–)10–10 | (–)10 < />10 | 1,2 | |||
| Lrot-Rrot | (–)10–10 | (–)10 < />10 | 1,2 | |||
| B | Neck | Ext-Flex | 0–10 | 10–20 | <0°/>20 | 1 |
| Lbend-Rbend | (–)10–10 | (–)10 < />10 | 1,2 | |||
| Lrot-Rrot | (–)10–10 | (–)10 < />10 | 1,2 | |||
| C | Thorax | Ext-Flex | (–)20–0 | 0–20 | 20–60 | 1 |
| Lbend-Rbend | (–)10–10 | (–)10 < />10 | 1,2 | |||
| Lrot-Rrot | (–)10–10 | (–)10 < />10 | 1,2 | |||
| D | Back | Ext-Flex | (–)20–0 | 0–20 | 20–60 | 1 |
| Lbend-Rbend | (–)10–10 | (–)10 < />10 | 1,2 | |||
| Lrot-Rrot | (–)10–10 | (–)10 < />10 | 1,2 | |||
| E | Pelvis | Ext-Flex | 35–50 | 10–35 | <10/>50 | 3 |
| F | Hip | Ext-Flex | 95–110 | 110–125 | <95/>125 | 4 |
| Add-Abd | (–)20–(–)13 | < (–)20 < /> (–)13 | 4 | |||
| In-Out | 10–18 | <10/>18 | 4 | |||
| Hip to Thorax | 90–135 | 135–160/90–50 | <50 | 5,6 | ||
| G | Knee | Flex | 80–100 | 30–80/110–120 | >120/<30 | 7 |
| H | shoulder | Ext-Flex | (–)20–20 | < (–)20/20–60 | >60 | 1 |
| Add-Abd | 0–20 | 20–60 | >60 | 1,2 | ||
| Horext-Horflex | 0–15 | 15–60/<0 | 1,2 | |||
| I | elbow | Flex | 60–100 | 0–60/>100 | 1 | |
| J | Wrist | Ext-Flex | (–)15–0/0–15 | (–45)–(–15)/15–45 | 2 | |
| Ulnar-Radial | (–10)–0/0–10 | < (–)10/>10 | 1,2 | |||
| Supin-Pron | 0–70 | >70 | 2 |
Abbreviations: ext (extension), flex (flexion), L (left), R (right), rot (rotation), add (adduction), abd (abduction), In (inwards rotation), Out (Outwards rotation), Hor (horizontal), Supin (supination), Pron (pronation). Source: 1. McAtamney and Corlett [36]; 2. Sanchez-Lite et al. [64] 3. Harrison et al. [69]; 4. Johnston and Smidt, [67] 5. Harrison et al. [70]; 6. Keegan [71]; 7. Laubenthal [68].
Appendix A. Figure 1.
Segment and joins postures and their anatomical angles (refers to Appendix A. Table 1)
 |
Appendix B
Appendix B. Table 1.
Statistical analysis (in angles) of all body joints and segments
| No. | Work Place | Avg of Head_ext_flex | Avg of Head_Lbend_Rbend | Avg of Head_Lrot_Rrot | StDev of Head_ext_flex | StDev of Head_Lbend_Rbend | StDev of Head_Lrot_Rrot | Max of Head_ext_flex | Max of Head_Lbend_Rbend | Max of Head_Lrot_Rrot | Min of Head_ext_flex | Min of Head_Lbend_Rbend | Min of Head_Lrot_Rrot |
| 1 | A | –10.71 | 4.79 | –6.64 | 10.26 | 7.05 | 8.00 | 28.55 | 39.72 | 33.55 | –26.02 | –21.64 | –56.46 |
| 2 | L | –12.51 | 3.81 | –1.86 | 10.47 | 4.62 | 4.15 | 17.88 | 18.00 | 42.11 | –33.53 | –22.88 | –21.87 |
| 3 | R | –6.94 | 1.52 | 0.42 | 7.73 | 5.16 | 7.19 | 19.21 | 31.83 | 35.76 | –37.10 | –28.91 | –42.96 |
| Work Place | Avg of Neck_ext_flex | Avg of Neck_Lbend_Rbend | Avg of Neck_Lrot_Rrot | StDev of Neck_ext_flex | StDev of Neck_Lbend_Rbend | StDev of Neck_Lrot_Rrot | Max of Neck_ext_flex | Max of Neck_Lbend_Rbend | Max of Neck_Lrot_Rrot | Min of Neck_ext_flex | Min of Neck_Lbend_Rbend | Min of Neck_Lrot_Rrot | |
| 4 | A | 17.76 | –1.70 | 3.45 | 7.80 | 6.63 | 7.60 | 29.14 | 20.00 | 54.42 | –19.80 | –25.62 | –42.29 |
| 5 | L | 5.86 | –2.10 | 0.47 | 8.79 | 6.28 | 5.66 | 26.60 | 18.66 | 21.57 | –29.60 | –16.77 | –47.13 |
| 6 | R | –0.26 | 1.37 | 3.22 | 8.42 | 5.22 | 6.03 | 26.57 | 34.20 | 38.77 | –28.80 | –29.59 | –24.13 |
| Work Place | Avg of Thorax_ext_flex | Avg of Thorax_Lbend_Rbend | Avg of Thorax_Lrot_Rrot | StDev of Thorax_ext_flex | StDev of Thorax_Lbend_Rbend | StDev of Thorax_Lrot_Rrot | Max of Thorax_ext_flex | Max of Thorax_Lbend_Rbend | Max of Thorax_Lrot_Rrot | Min of Thorax_ext_flex | Min of Thorax_Lbend_Rbend | Min of Thorax_Lrot_Rrot | |
| 7 | A | –6.93 | 4.41 | –1.15 | 4.51 | 3.40 | 5.26 | 3.14 | 13.39 | 5.29 | –14.18 | –3.19 | –11.79 |
| 8 | L | 6.64 | 1.77 | –0.86 | 4.23 | 3.21 | 3.03 | 32.60 | 9.54 | 5.33 | –5.34 | –4.11 | –5.76 |
| 9 | R | 7.16 | 2.88 | 3.55 | 3.74 | 5.28 | 8.68 | 20.64 | 11.61 | 21.23 | –4.29 | –7.92 | –8.65 |
| Work Place | Avg of Back_ext_flex | Avg of Back_Lbend_Rbend | Avg of Back_Lrot_Rrot | StDev of Back_ext_flex | StDev of Back_Lbend_Rbend | StDev of Back_Lrot_Rrot | Max of Back_ext_flex | Max of Back_Lbend_Rbend | Max of Back_Lrot_Rrot | Min of Back_ext_flex | Min of Back_Lbend_Rbend | Min of Back_Lrot_Rrot | |
| 10 | A | 40.87 | –1.41 | 0.19 | 3.22 | 2.59 | 7.07 | 46.79 | 4.05 | 10.30 | 29.09 | –7.15 | –12.18 |
| 11 | L | 39.57 | 0.37 | –0.04 | 5.98 | 1.67 | 4.02 | 65.77 | 12.40 | 8.71 | 25.56 | –6.63 | –8.99 |
| 12 | R | 39.73 | 1.34 | –0.15 | 5.75 | 1.77 | 3.52 | 55.27 | 10.64 | 9.35 | 29.00 | –6.70 | –6.95 |
| Work Place | Avg of Pelvis_ext_flex | StDev of Pelvis_ext_flex | Max of Pelvis_ext_flex | Min of Pelvis_ext_flex | |||||||||
| 13 | A | –47.42 | 6.02 | –38.70 | –54.78 | ||||||||
| 14 | L | –32.90 | 8.52 | –24.44 | –48.61 | ||||||||
| 15 | R | –32.04 | 3.48 | –26.33 | –39.85 | ||||||||
| Work Place | Avgof Lhip_ext_flex | Avgof Rhip_ext_f lex | Avgof Lhip_add_ abd | Avgof Rhip_add_ abd | Avgof Lhip_out_i n | Avgof Rhip_out_i n | StDevof Lhip_ext_f lex | StDevof Rhip_ext_f lex | StDevof Lhip_add_ abd | StDevof Rhip_add_ abd | StDevof Lhip_out_i n | StDevof Rhip_out_i n | |
| 16 | A | 48.90 | 61.03 | –15.31 | –3.33 | 25.61 | 15.33 | 19.46 | 26.60 | 12.51 | 4.30 | 12.76 | 1.70 |
| 17 | L | 42.73 | 43.59 | –20.40 | –12.81 | 36.98 | 24.52 | 11.59 | 13.06 | 4.29 | 2.38 | 15.30 | 4.37 |
| 18 | R | 44.68 | 44.86 | –19.79 | –11.99 | 39.47 | 28.40 | 5.33 | 5.51 | 3.53 | 1.56 | 12.73 | 7.97 |
| Work Place | Maxof Lhip_ext_flex | Maxof Rhip_ext_f lex | Maxof Lhip_add_ abd | Maxof Rhip_add_ abd | Maxof Lhip_out_i n | Maxof Rhip_out_i n | Minof Lhip_ext_f lex | Minof Rhip_ext_f lex | Minof Lhip_add_ abd | Minof Rhip_add_ abd | Minof Lhip_out_i n | Minof Rhip_out_i n | |
| 19 | A | 87.73 | 97.10 | 12.36 | 6.66 | 46.46 | 20.24 | 23.13 | 26.50 | –29.25 | –15.67 | 9.32 | 6.69 |
| 20 | L | 58.97 | 60.64 | –10.27 | –2.28 | 56.47 | 47.03 | 24.35 | 22.13 | –29.17 | –22.18 | 13.84 | 14.05 |
| 21 | R | 56.37 | 55.36 | –10.96 | 1.55 | 64.99 | 44.07 | 34.14 | 34.67 | –28.70 | –16.32 | 12.64 | 14.01 |
| Work Place | Avgof Lhip_thorax | Avgof Rhip_thor ax | StDevof Lhip_thora x | StDevof Rhip_thor ax | Maxof Lhip_thora x | Maxof Rhip_thor ax | Minof Lhip_thora x | Minof Rhip_thor ax | |||||
| 22 | A | 90.61 | 78.48 | 17.06 | 24.28 | 113.65 | 110.84 | 54.22 | 49.91 | ||||
| 23 | L | 97.72 | 96.87 | 6.28 | 8.37 | 110.18 | 112.39 | 70.38 | 76.83 | ||||
| 24 | R | 96.12 | 98.36 | 5.51 | 9.23 | 111.09 | 138.59 | 82.45 | 78.32 | ||||
| Work Place | Avgof Lknee_flex | Avgof Rknee_fle x | StDevof Lknee_fle x | StDevof Rknee_fle x | Maxof Lknee_fle x | Maxof Rknee_fle x | Minof Lknee_fle x | Minof Rknee_fle x | |||||
| 25 | A | 43.44 | 69.42 | 57.20 | 49.19 | 131.57 | 119.33 | –1.70 | 0.32 | ||||
| 26 | L | 89.80 | 91.15 | 34.86 | 20.82 | 148.21 | 123.54 | 23.28 | 55.17 | ||||
| 27 | R | 9.93 | 82.20 | 93.95 | 23.37 | 118.01 | 124.62 | –168.50 | 23.58 | ||||
| Work Place | Avgof Lshoulder_ex t_flex1 | Avgof Rshoulder_ext_flex1 | Avgof Lshoulder_add_abd1 | Avgof Rshoulder_add_abd1 | Avgof Lshoulder_horext_h orflex1 | Avgof Rshoulder_horext_h orflex1 | StDevof Lshoulder_ext_flex | StDevof Rshoulder_ext_flex | StDevof Lshoulder_add_abd | StDevof Rshoulder_add_abd | StDevof Lshoulder_horext_h orflex | StDevof Rshoulder_horext_h orflex | |
| 28 | A | 25.17 | 16.24 | 42.25 | 34.05 | 32.87 | 27.53 | 7.49 | 10.43 | 7.81 | 3.53 | 8.11 | 11.21 |
| 29 | L | 27.52 | 30.68 | 35.88 | 31.27 | 18.64 | 27.67 | 13.50 | 9.10 | 5.80 | 6.12 | 11.74 | 7.27 |
| 30 | R | 30.30 | 34.15 | 33.90 | 28.72 | 13.40 | 17.29 | 12.18 | 7.26 | 9.20 | 4.87 | 9.37 | 8.65 |
| Work Place | Maxof Lshoulder_ext_flex | Maxof Rshoulder_ext_flex | Maxof Lshoulder_add_abd | Maxof Rshoulder_add_abd | Maxof Lshoulder_horext_horflex | Maxof Rshoulder_horext_horflex | Minof Lshoulder_ext_flex | Minof Rshoulder_ext_flex | Minof Lshoulder_add_abd | Minof Rshoulder_add_abd | Minof Lshoulder_horext_horflex | Minof Rshoulder_horext_horflex | |
| 31 | A | 34.49 | 36.55 | 58.13 | 43.34 | 53.45 | 52.33 | 1.87 | –7.61 | 25.63 | 22.28 | –4.34 | –7.97 |
| 32 | L | 65.11 | 60.10 | 62.51 | 63.87 | 94.41 | 51.75 | –8.85 | 12.08 | 1.63 | 11.10 | –23.72 | –11.44 |
| 33 | R | 51.92 | 57.06 | 50.67 | 52.77 | 72.21 | 61.96 | 5.24 | –8.15 | 18.95 | 14.12 | –28.27 | –19.73 |
| Work Place | AvgOfLelbow_ext_flex | AvgOfRelb ow_ext_fl ex | StDevOfLe lbow_ext_ flex | StDevOfRe lbow_ext_ flex | MaxOfLelb ow_ext_fl ex | MaxOfRel bow_ext_f lex | MinOfLelb ow_ext_fl ex | MinOfRelb ow_ext_fl ex | |||||
| 34 | A | 93.87596924 | 107.91191 | 16.740346 | 13.322391 | 138.67357 | 147.43941 | 71.275764 | 77.047623 | ||||
| 35 | L | 99.54706857 | 84.155316 | 22.622773 | 12.410872 | 150.44968 | 138.5712 | 45.527557 | 50.514458 | ||||
| 36 | R | 97.91805501 | 101.24142 | 19.042296 | 20.943427 | 141.48094 | 145.2739 | 62.62875 | 61.917999 | ||||
| Work Place | AvgOfLwrist_ ext_flex | AvgOfRwri st_ext_fle x | AvgOfLwri st_ulnar_r adial | AvgOfRwri st_ulnar_r adial | AvgOfLWri st_supin_p ron | AvgOfRwri st_supin_p ron | StDevOfL wrist_ext_ flex | StDevOfR wrist_ext_ flex | StDevOfL wrist_ulna r_radial | StDevOfR wrist_ulna r_radial | StDevOfL Wrist_supi n_pron | StDevOfR wrist_supi n_pron | |
| 37 | A | –12.2737644 | 3.1900581 | 12.331519 | 12.694499 | 62.970011 | 112.78097 | 9.9083096 | 13.55561 | 14.226807 | 10.802672 | 19.174313 | 27.919557 |
| 38 | L | 5.914431613 | 17.826942 | 20.094028 | 27.116612 | 96.085313 | 126.34379 | 15.404225 | 16.03276 | 12.750213 | 8.592016 | 25.6509 | 22.214996 |
| 39 | R | 2.22471966 | 10.710075 | 13.86132 | 15.961617 | 105.15739 | 118.58103 | 12.364577 | 14.136142 | 14.548691 | 14.535792 | 24.966893 | 28.848167 |
| Work Place | MaxOfLwrist_ ext_flex | MaxOfRwr ist_ext_fle x | MaxOfLwri st_ulnar_r adial | MaxOfRwr ist_ulnar_r adial | MaxOfLWr ist_supin_ pron | MaxOfRwr ist_supin_ pron | MinOfLwri st_ext_fle x | MinOfRwri st_ext_fle x | MinOfLwri st_ulnar_r adial | MinOfRwri st_ulnar_r adial | MinOfLWri st_supin_p ron | MinOfRwri st_supin_p ron | |
| 40 | A | 58.822994 | 46.710972 | 56.213043 | 47.117649 | 151.73436 | 148.63741 | –39.03291 | –45.5378 | –32.08171 | –22.5614 | 18.939169 | 31.51549 |
| 41 | L | 44.163559 | 54.713367 | 46.966454 | 54.65802 | 143.96823 | 160.65173 | –18.87877 | –42.28951 | –44.33745 | –22.2364 | 20.823118 | 44.184505 |
| 42 | R | 74.395592 | 52.151985 | 48.771187 | 50.666573 | 156.66272 | 158.46419 | –30.2777 | –37.85872 | –52.08813 | –35.56153 | 24.459541 | 16.689964 |
Index: Avg (average) St (standard deviation) Max (maximum ROM) Min (Minimum Rom). ext (extension), flex (flexion), L (left), R (right), rot (rotation), ad (adduction), ab (abduction), Out (outwards rotation) In (inwards rotation), horext (horizontal extension, horflex (horizontal flexion), Supin (supination) Pron (pronation). Restaurant (R), Lounge (L), Anywhere (A).
Appendix B. Table 2.
Questionnaire results of the MoCap laboratory experiment: Comfort Evaluation Checklist (CEC) questionnaire and Local Perceived Discomfort (LPD) questionnaire
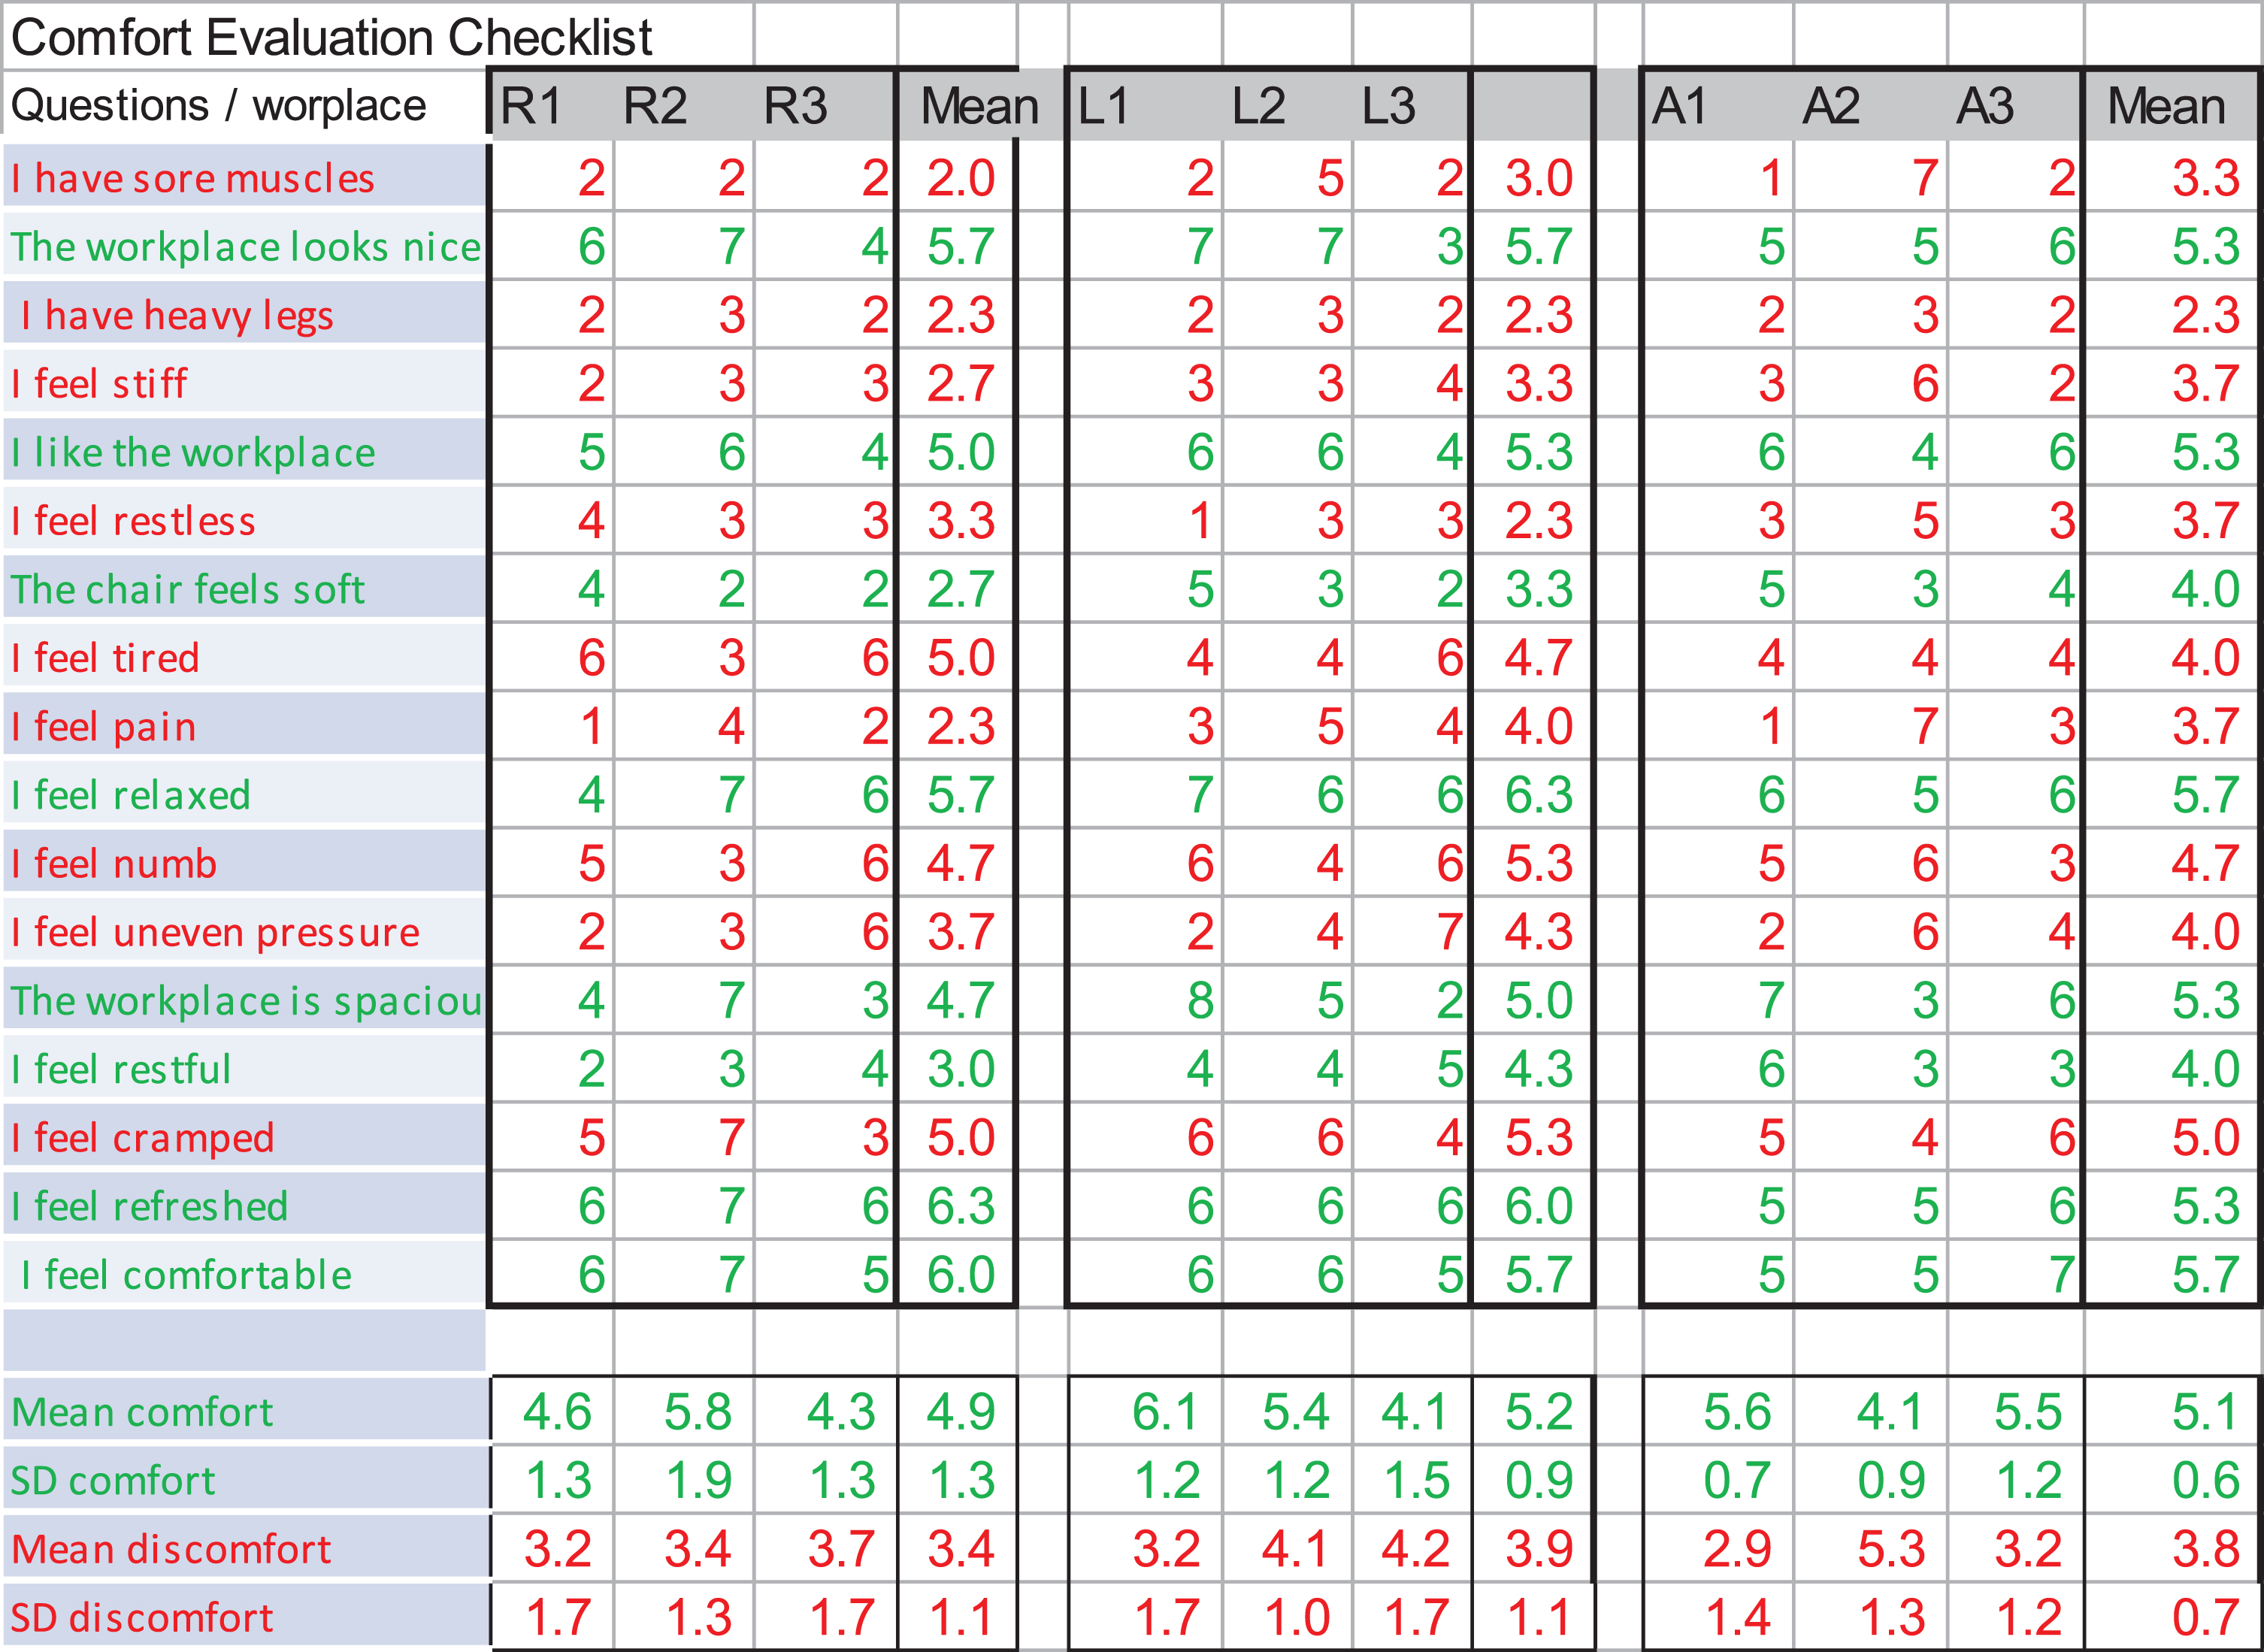 |
| Comfort Evaluation Checklist: Red font determines discomfort questions; Green font determines comfort questions Abbreviations. |
| R (restaurant); L (lounge); A (anywhere workplace). Numbers determine the participant’s identification: 1=not at all, 9=extremely. |
| —————————————————————————————————————– |
 |
Acknowledgments
The authors would like to thank Dr. Deborah Alperovitch-Najenson, of the Department of Environmental and Occupational Health, Sackler Faculty of Medicine, Tel-Aviv University; and Prof. Moshe Ayalon of the Biomechanics Laboratory, Zinman College of Physical Education and Sport Sciences, Wingate Institute, Netanya, Israel, for their professional support. Thank also to Prof. Alon Wolf and Oded Solomon of the Biomechanics laboratory, Technicon –Israel Institute of Technology, for their assistance in the motion-capture laboratory and experiment.
References
[1] | Reenen-van Hamberg HH . Physical capacity and work-related musculoskeletal symptoms. |
[2] | Chaffin DB . Digital human modelling for workspace design. Reviews of human factors and ergonomics. (2008) ;4: (1):41–74. 10.1518/155723408X342844 |
[3] | Vartiainen M . Analysis of multilocational and mobile knowledge workers’ work spaces. InInternational Conference on Engineering Psychology andCognitive Ergonomics 2007 Jul 22 (pp. 194-203). Springer, Berlin, Heidelberg. 10.1007/978-3-540-73331-7_21 |
[4] | Hardy B , Graham R , Stansall P , White A , Harrison A , Bell A , Hutton L . Working beyond walls: The government workplace as an agent of change. Office of Government Commerce. 2008. |
[5] | Nguyen TVT , Han H , Sahito N , Lam TN . The Bookstore-Café: Emergence of a New Lifestyle as a “Third Place” in Hangzhou, China. Space and Culture. (2019) ;22: (2):216–33. 10.1177/1206331218795832 |
[6] | Hyrkkänen U , Nenonen S . The Virtual Workplace of a Mobile Employee–How Does Vischer’s Model Function in Identifying Physical, Functional and Psychosocial Fit? InInternational Conference on Human-Computer Interaction 2011 Jul 9 (pp. 69-75). Springer, Berlin, Heidelberg. |
[7] | Young JG , Trudeau M , Odell D , Marinelli K , Dennerlein JT . Touch-screen tablet user configurations and case-supported tilt affect head and neck flexion angles. Work. (2012) ;41: (1):81–91. 10.3233/WOR-2012-1337 |
[8] | Pew Research Center, [https://www.pewinternet.org/]. U.S: the Pew Research Center study [updated in February 2018]. Available from: https://www.pewinternet.org/fact-sheet/mobile/) |
[9] | Statista – global consumer survey research comply [https://www.statista.com], Shipment forecast of laptops, desktop PCs and tablets worldwide from 2010 to 2023 [updated at 2019]. Available from: https://www.statista.com/statistics/272595/global-shipments-forecast-for-tablets-laptops-and-desktop-pcs/ |
[10] | Straker L , Burgess-Limerick R , Pollock C , Murray K , Netto K , Coleman J , Skoss R . The impact of computer display height and desk design on 3D posture during information technology work by young adults. Journal of electromyography and kinesiology. (2008) ;18: (2):336–49. 10.1016/j.jelekin.2006.09.015 |
[11] | De Croon E , Sluiter J , Kuijer PP , Frings-Dresen M . The effect of office concepts on worker health and performance: a systematic review of the literature. Ergonomics. (2005) ;48: (2):119–34. 10.1080/00140130512331319409 |
[12] | Pheasant S , Haslegrave CM . Bodyspace: Anthropometry, ergonomics and the design of work. CRC Press; (2018) Dec 19. |
[13] | Duffy F , Powell K . The new office. London: Conran Octopus; 1997. |
[14] | Plank T , Jetter HC , Rädle R , Klokmose CN , Luger T , Reiterer H . Is Two Enough?:! Studying Benefits, Barriers, and Biases of Multi-Tablet Use for Collaborative Visualization. In Proceedings of the 2017 CHI Conference on Human Factors in Computing Systems 2017 May 2 (pp. 4548-4560). ACM. 10.1145/3025453.3025537 |
[15] | Gold JE , Mohamed FB , Ali S , Barbe MF . Serum and MRI biomarkers in mobile device texting: a pilot study. Human factors. (2014) ;56: (5):864–72. 10.1016/j.jmpt.2017.11.001 |
[16] | Zhang B , Horváth I , Molenbroek JF , Snijders C . Using artificial neural networks for human body posture prediction. International Journal of Industrial Ergonomics. (2010) ;40: (4):414–24. 10.1016/j.ergon.2010.02.003 |
[17] | Vink P . Aircraft interior comfort and design. CRC press; (2016) Apr 19. |
[18] | Vink P , Hallbeck S . Comfort and discomfort studies demonstrate the need for a new model. 10.1016/j.apergo.2011.06.001 |
[19] | Vischer JC . The effects of the physical environment on job performance: towards a theoretical model of workspace stress. Stress and Health: Journal of the International Society for the Investigation of Stress. (2007) ;23: (3):175–84. 10.1002/smi.1134 |
[20] | Bhatia M , editor. Musculoskeletal Injections and Alternative Options: A practical guide to’what, when and how?’. CRC Press; (2019) Feb 14. |
[21] | Storr EF , de Vere Beavis FO , Stringer MD . Texting tenosynovitis. The New Zealand Medical Journal (Online). (2007) ;120: (1267). |
[22] | Ming Z , Pietikainen S , Hänninen O . Excessive texting in pathophysiology of first carpometacarpal joint arthritis. Pathophysiology. (2006) ;13: (4):269–70. 10.1016/j.pathophys.2006.09.001 |
[23] | Eapen C , Kumar B , Bhat AK , Venugopal A . Clinical and Ultrasonic Evaluation of the Thumb: Comparison of Young Adults With and Without Thumb Pain With Text Messaging. Journal of manipulative and physiological therapeutics. (2018) ;41: (3):199–207. 10.1016/j.jmpt.2017.11.001 |
[24] | Berolo S , Wells RP , Amick III BC . Musculoskeletal symptoms among mobile hand-held device users and their relationship to device use: a preliminary study in a Canadian university population. Applied Ergonomics. (2011) ;42: (2):371–8. 10.1016/j.apergo.2010.08.010 |
[25] | De Looze MP , Kuijt-Evers LF , Van Dieen JA . Sitting comfort and discomfort and the relationships with objective measures. Ergonomics. (2003) ;46: (10):985–97. 10.1080/0014013031000121977 |
[26] | Helander MG , Zhang L . Field studies of comfort and discomfort in sitting. Ergonomics. (1997) ;40: (9):895–915. 10.1080/001401397187739 |
[27] | Zhang L , Helander MG , Drury CG . Identifying factors of comfort and discomfort in sitting. Human factors. (1996) ;38: (3):377–89. 10.1518/001872096778701962 |
[28] | Gold JE , Driban JB , Yingling VR , Komaroff E . Characterization of posture and comfort in laptop users in non-desk settings. Applied ergonomics. (2012) ;43: (2):392–9. 10.1016/j.apergo.2011.06.014 |
[29] | David GC . Ergonomic methods for assessing exposure to risk factors for work-related musculoskeletal disorders. Occupational medicine. (2005) ;55: (3):190–9. 10.1093/occmed/kqi082 |
[30] | Li G , Buckle P . Current techniques for assessing physical exposure to work-related musculoskeletal risks, with emphasis on posture-based methods. Ergonomics. (1999) ;42: (5):674–95. 10.1080/001401399185388 |
[31] | MIL-STD DO. 1472G, Department of defense design criteria standard, Human engineering. Redstone Arsenal (AL): Department of Defense. 2012:237-59. |
[32] | Van der Grinten MP , Smitt P . Development of a practical method for measuring body part discomfort. Advances in industrial ergonomics and safety. (1992) ;4: :311–18. |
[33] | Radwin RG . Automated video exposure assessment of repetitive motion. InProceedings of the Human Factors and Ergonomics Society Annual Meeting 2011 Sep (Vol. 55, No. 1, pp. 995-996). Sage CA: Los Angeles, CA: SAGE Publications. 10.1177/1071181311551207 |
[34] | Chang CC , McGorry RW , Lin JH , Xu X , Hsiang SM . Prediction accuracy in estimating joint angle trajectories using a video posture coding method for sagittal lifting tasks. Ergonomics. (2010) ;53: (8):1039–47. 10.1080/00140139.2010.489963 |
[35] | Yen TY , Radwin RG . A video-based system for acquiring biomechanical data synchronized with arbitrary events and activities. IEEE transactions on Biomedical Engineering. (1995) ;42: (9):944–8. 10.1109/10.412663 |
[36] | McAtamney L , Corlett EN . RULA: a survey method for the investigation of work-related upper limb disorders. Applied ergonomics. (1993) ;24: (2):91–9. 10.1016/0003-6870(93)90080-S |
[37] | Vicon system [internet]. Available from: https://docs.vicon.com/display/Nexus25/Modeling+with+Plug-in+Gait |
[38] | Simi system [internet]. Available from: http://www.simi.com/ |
[39] | Xsens system [internet]. Available from: https://www.xsens.com/ |
[40] | Bernmark E , Wiktorin C . A triaxial accelerometer for measuring arm movements. Applied ergonomics. (2002) ;33: (6):541–7. 10.1016/S0003-6870(02)00072-8 |
[41] | Radwin RG , Lin ML . An analytical method for characterizing repetitive motion and postural stress using spectral analysis. Ergonomics. (1993) ;36: (4):379–89. 10.1080/00140139308967895 |
[42] | Gavrilova ML , Ahmed F , Bari AH , Liu R , Liu T , Maret Y , Sieu BK , Sudhakar T . Multi-Modal Motion-Capture-Based Biometric Systems for Emergency Response and Patient Rehabilitation. In Design and Implementation of Healthcare Biometric Systems 2019 (pp. 160-184). IGI Global. 10.4018/978-1-5225-7525-2.ch007 |
[43] | Wu Q , Boulanger P . Real-time estimation of missing markers for reconstruction of human motion. In 2011 XIII Symposium on Virtual Reality 2011May 23 (pp. 161-168). IEEE. 10.1109/SVR.2011.35 |
[44] | Duffell LD , Hope N , McGregor AH . Comparison of kinematic and kinetic parameters calculated using a cluster-based model and Vicon’s plug-in gait. Proceedings of the Institution of Mechanical Engineers, Part H: Journal of Engineering in Medicine. (2014) ;228: (2):206–10. 10.1177/0954411913518747 |
[45] | Charlton IW , Tate P , Smyth P , Roren L . Repeatability of an optimised lower body model. Gait & Posture. (2004) ;20: (2):213–21. 10.1016/j.gaitpost.2003.09.004 |
[46] | Bryantpark.org [internet]. Available from: https://bryantpark.org/blog/wireless-network |
[47] | Labarre S . Coffee Shop-Office Hybrids: The Workplace of the Future?, Fast company, New York; 2010. Available from: https://www.fastcompany.com/1662188/coffee-shop-office-hybrids-the-workplace-of-the-future |
[48] | Forlano L . Anytime? Anywhere?: Reframing Debates Around Municipal Wireless Networking. The Journal of Community Informatics. (2008) ;4: (1):128. |
[49] | Mark G , Su NM . Making infrastructure visible for nomadic work. Pervasive and Mobile Computing. (2010) ;6: (3):312–23. 10.1016/j.pmcj.2009.12.004 |
[50] | Vartiainen M , Hyrkkänen U . Changing requirements and mental workload factors in mobile multi-locational work. New Technology, Work and Employment. (2010) ;25: (2):117–35. 10.1111/j.1468-005X.2010.00243.x |
[51] | Steelcase.com[internet] available from: https://www.steelcase.com/content/uploads/2019/05/global-posture-study.pdf |
[52] | Asundi K , Odell D , Luce A , Dennerlein JT . Notebook computer use on a desk, lap and lap support: effects on posture, performance and comfort. Ergonomics. (2010) ;53: (1):74–82. 10.1080/00140130903389043 |
[53] | Moffet H , Hagberg M , Hansson-Risberg E , Karlqvist L . Influence of laptop computer design and working position on physical exposure variables. Clinical Biomechanics. (2002) ;17: (5):368–75. 10.1016/S0021-9290(02)00062-3 |
[54] | Rogers R . Cities for a small planet. Basic Books; 2008 Aug 1. |
[55] | Cranz G . The Chair: Rethinking Culture. Body, and Design (New York, 2000). 1998. |
[56] | The Biomechanics Laboratory [internet]. The Technion - Israel Institute of Technology. Available from: http://brml.technion.ac.il |
[57] | Panero J , Zelnik M . Human Dimension & Interior Space: A Source Book of Design Reference Standards. Watson-Guptill Publications: New York; (1979) . |
[58] | Toomingas A . WebPages on computer work. SwedishWork Environment Authority, Stockholm. 2008. http://www.it.uu.se/edu/course/homepage/contextuse/ht12/computer_work.pdf |
[59] | Toomingas A , Gavhed D . Workstation layout and work postures at call centres in Sweden in relation to national law, EU-directives and ISO-standards, and to operators’ comfort and symptoms. International Journal of Industrial Ergonomics. (2008) ;38: (11-12):1051–61. 10.1016/j.ergon.2008.02.010 |
[60] | Kuorinka I , Jonsson B , Kilbom A , Vinterberg H , Biering-Sørensen F , Andersson G , Jørgensen K . Standardised Nordic questionnaires for the analysis of musculoskeletal symptoms. Applied ergonomics. (1987) ;18: (3):233–7. 10.1016/0003-6870(87)90010-X |
[61] | Wu G , Siegler S , Allard P , Kirtley C , Leardini A , Rosenbaum D , Whittle M , D D’Lima D , Cristofolini L , Witte H , Schmid O . ISB recommendation on definitions of joint coordinate system of various joints for the reporting of human joint motion—part I: ankle, hip, and spine. Journal of biomechanics. (2002) ;35: (4):543–8. 10.1016/S0021-9290(01)00222-6 |
[62] | Wu G , Van der Helm FC , Veeger HD , Makhsous M , Van Roy P , Anglin C , Nagels J , Karduna AR , McQuade K , Wang X , Werner FW . ISB recommendation on definitions of joint coordinate systems of various joints for the reporting of human joint motion—Part II: shoulder, elbow, wrist and hand. Journal of biomechanics. (2005) ;38: (5):981–92. 10.1016/j.jbiomech.2004.05.042 |
[63] | Vaughan CL , Davis BL , O’connor JC . Dynamics of human gait Champaign. Illinois: Human Kinetics; 1992. |
[64] | Sanchez-Lite A , Garcia M , Domingo R , Sebastian MA . Novel ergonomic postural assessment method (NERPA) using product-process computer aided engineering for ergonomic workplace design. PloS one. (2013) ;8: (8):e72703. 10.1371/journal.pone.0072703 |
[65] | American Academy of Orthopaedic Surgeons (AAOS) source data 1965, [https://www.aaos.org/] |
[66] | Tilley AR . The measure of man and woman: human factors in design. John Wiley & Sons; 2001 Dec 31. |
[67] | Johnston RC , Smidt GL . 23 Hip Motion Measurements for Selected activities of Daily Living. Clinical Orthopaedics and Related Research®. (1970) ;72: :205–15. |
[68] | Laubenthal KN , Smidt GL , Kettelkamp DB . A quantitative analysis of knee motion during activities of daily living. Physical therapy. (1972) ;52: (1):34–43. 10.1093/ptj/52.1.34 |
[69] | Harrison DD , Janik TJ , Troyanovich SJ , Harrison DE , Colloca CJ . Evaluation of the assumptions used to derive an ideal normal cervical spine model. Journal of manipulative and physiological therapeutics. (1997) ;20: (4):246–56. |
[70] | Harrison DD , Harrison SO , Croft AC , Harrison DE , Troyanovich SJ . Sitting biomechanics part I: review of the literature. Journal of manipulative and physiological therapeutics. (1999) ;22: (9):594–609. 10.1016/S0161-4754(99)70020-5 |
[71] | Keegan JJ . Alterations of the lumbar curve related to posture and seating. JBJS. (1953) ;35: (3):589–603. |


