
Predicting drug-target interactions using matrix factorization with self-paced learning and dual similarity information
Abstract
BACKGROUND:
Drug repositioning (DR) refers to a method used to find new targets for existing drugs. This method can effectively reduce the development cost of drugs, save time on drug development, and reduce the risks of drug design. The traditional experimental methods related to DR are time-consuming, expensive, and have a high failure rate. Several computational methods have been developed with the increase in data volume and computing power. In the last decade, matrix factorization (MF) methods have been widely used in DR issues. However, these methods still have some challenges. (1) The model easily falls into a bad local optimal solution due to the high noise and high missing rate in the data. (2) Single similarity information makes the learning power of the model insufficient in terms of identifying the potential associations accurately.
OBJECTIVE:
We proposed self-paced learning with dual similarity information and MF (SPLDMF), which introduced the self-paced learning method and more information related to drugs and targets into the model to improve prediction performance.
METHODS:
Combining self-paced learning first can effectively alleviate the model prone to fall into a bad local optimal solution because of the high noise and high data missing rate. Then, we incorporated more data into the model to improve the model’s capacity for learning.
RESULTS:
Our model achieved the best results on each dataset tested. For example, the area under the receiver operating characteristic curve and the precision-recall curve of SPLDMF was 0.982 and 0.815, respectively, outperforming the state-of-the-art methods.
CONCLUSION:
The experimental results on five benchmark datasets and two extended datasets demonstrated the effectiveness of our approach in predicting drug-target interactions.
1.Introduction
Predicting drug-target interaction (DTI) is a crucial phase in drug discovery (DD) [1] and drug repositioning (DR) [2] for discovering novel targets of existing drugs [3, 4, 5]. The traditional methods for new DD are time-consuming and have a high failure rate; therefore, traditional new drug development is not a good choice [3, 6]. Various computer prediction methods have been proposed in recent years to improve the efficiency of new drug research and discovery, thus increasing the development efficiency and reducing expenditure to a certain extent. According to previous works [7, 8, 9], the current methods are mainly categorized into three groups [10, 11, 12, 13, 14, 15, 16, 17]: (1) molecular docking (MD) methods, (2) ligand-based methods, and (3) chemical genomics methods.
The MD methods involve simulation experiments based on the 3D structure drug and protein [11, 18]. However, the simulation of the 3D structure of massive ligands and targets, as well as their massive simulation calculation using MD-based methods, requires a lot of time and computing equipment [19, 20]. The ligand-based methods assume that drugs with similar functions have similar functional properties and may also have corresponding targets. They predict the drug target using ligand similarity. However, this approach suffers from unpredictable targets without known ligands. On the contrary, errors in chemical structure and physiological effects beyond structural relationships (e.g., the metabolites may be active molecules) may limit its use in drug repurposing. The chemical method facilitates rapid and large-scale DTI predictions to generate drug candidates and targets, making it the most efficient method in drug research [21, 22]. Adopting this method for DTI prediction has become a prominent research issue with the continuous increase in drug-related data and the launch of a large number of databases, such as DrugBank [23], KEGG [24], PubChem [25], BRENDA [26], and SuperTarget [27].
Recently, chemical genomics-based computational approaches for DTI prediction have advanced rapidly. They are mainly categorized into three groups: classification-based methods, network diffusion (network propagation), and matrix factorization (MF). The classification-based methods treat a DR prediction task as a binary classification task that whether has an association between drug and target. These methods are not yet proof with wet experimental. In 2008, Yamanishi et al. [28] established a bipartite network technique to predict DTIs for four target classes: G protein-coupled receptors, by combining chemical and genomic spaces (GPCRs), nuclear receptor (NR), ion channel (IC), and enzyme (E). Yamanishi’s dataset [28] is regarded as the gold standard by many researchers; several newly developed algorithms based on it have displayed better performance. Based on this benchmark dataset, Bleakley et al. [29] suggested a novel supervised inference method for predicting unknown DTIs based on benchmark datasets, namely, a kernel-based support vector machine (KN-SVM) model.
In recent years, the MF methods are widely used in many DR prediction works, which combines two low-rank matrices to factorize the matrix. Liu et al. [30] proposed a neighborhood regularized logistic MF model. Hao et al. [31] designed a logistic MF based on a dual network (DNILMF) approach to predict DTIs. Yang et al. [32] performed the nonlinear MF technique and the negative sampling technique for DR prediction. SPLCMF, a collaborative MF method combined with self-paced learning (SPL), is an efficient DTI prediction method proposed by Xia et al. [33]. Yang et al. [34] developed an MF method based on multi-similarities bilinear MF for DR prediction. Ding et al. [35] developed a multiple kernel-based triple collaborative MF method to predict DTIs. Wang et al. [36] used a neighborhood regularized logistic MF method based on extracted features from a neural tangent kernel to predict DTIs. These previous studies showed the feasibility of MF used in DR prediction tasks, but it still had two challenges. (1) The model easily fell into a bad local optimal solution due to the high noise and high missing rate in the data. (2) Single similarity information makes the learning power of the model insufficient in terms of identifying the potential associations accurately.
To cope with the aforementioned challenges, we propose a model named Self-Paced Learning with Dual similarity information and Matrix Factorization (SPLDMF), which combines the self-paced learning method into MF. Furthermore, more similarity information related to drugs and targets is integrated into the model to improve the prediction performance. First, many previous works demonstrate that SPL has the superiority of relieving the problem of bad local optimum, especially when data is sparse [37, 38]. Inspired by the human learning process, the core idea of SPL is to automatically include more samples from simple to complex for training in a purely self-paced manner. Thus, we make improvement of MF based on the SPL mechanism to adapt for the data with high noise and high missing rate. Then, the SPLDMF method also incorporates more data into our model to improve its capacity for learning, which can predict the potential relationship more accurately. Experimental results on five benchmark datasets and two extend datasets demonstrate the effectiveness of our approach in predicting drug-target interactions. Our model obtains the best results on each dataset we tested, such as AUC and AUPR of SPLDMF achieve 0.982 and 0.815, outperforming state-of-the-art models among similar methods to our knowledge
2.Materials
Yamanishi [28], Kuang [39], and Hao [31] datasets are three critical databases used for validating the proposed DTI-related algorithm. The Yamanishi dataset is called a benchmark database, which contains drug-target relationships from databases such as KEGG BRITE [40], BRENDA [41], SuperTarget [27], and DrugBank [23], target protein sequence from KEGG Gene Database [40], and drug compounds from KEGG Drug and Compound Database [40]. Moreover, the Yamanishi database is categorized into four datasets: NR, GPCR, IC, and E. It contained 445 drugs and 664 targets in E, 210 drugs and 204 targets in IC, 223 drugs and 95 targets in GPCR, and 54 drugs and 26 targets in NR. The details of the dataset are depicted in Table 1. The Kuang dataset had 3681 known interaction pairs [39], including 786 drugs and 809 targets (Table 1). The Hao dataset comprised 829 drugs, 733 targets, and 3688 identified interaction pairs [31] (Table 1).
Table 1
Summary of four benchmark and two expanded datasets
| Dataset | No of drugs | No of targets | No of interactions | Sparsity |
|---|---|---|---|---|
| E | 445 | 664 | 2,926 | 0.010 |
| IC | 210 | 204 | 1,476 | 0.034 |
| GPCR | 223 | 95 | 635 | 0.030 |
| NR | 54 | 26 | 90 | 0.064 |
| Kuang | 786 | 809 | 3681 | 0.006 |
| Hao | 829 | 733 | 3688 | 0.006 |
For targeted analysis and prediction, we ensured that each drug contained at least one FDA-approved ATC code in the dataset.
3.Methods
This study introduced a novel DTI prediction model, self-paced learning with dual similarity information and MF method (SPLDMF), to predict unknown DTIs.
3.1Task description
Five matrices
Figure 1.
Four scenarios of DTI predictions. The pair with orange background represents (a) known drug-known target; (b) known drug-new target; (c) new drug-known target; and (d) new drug-new target.
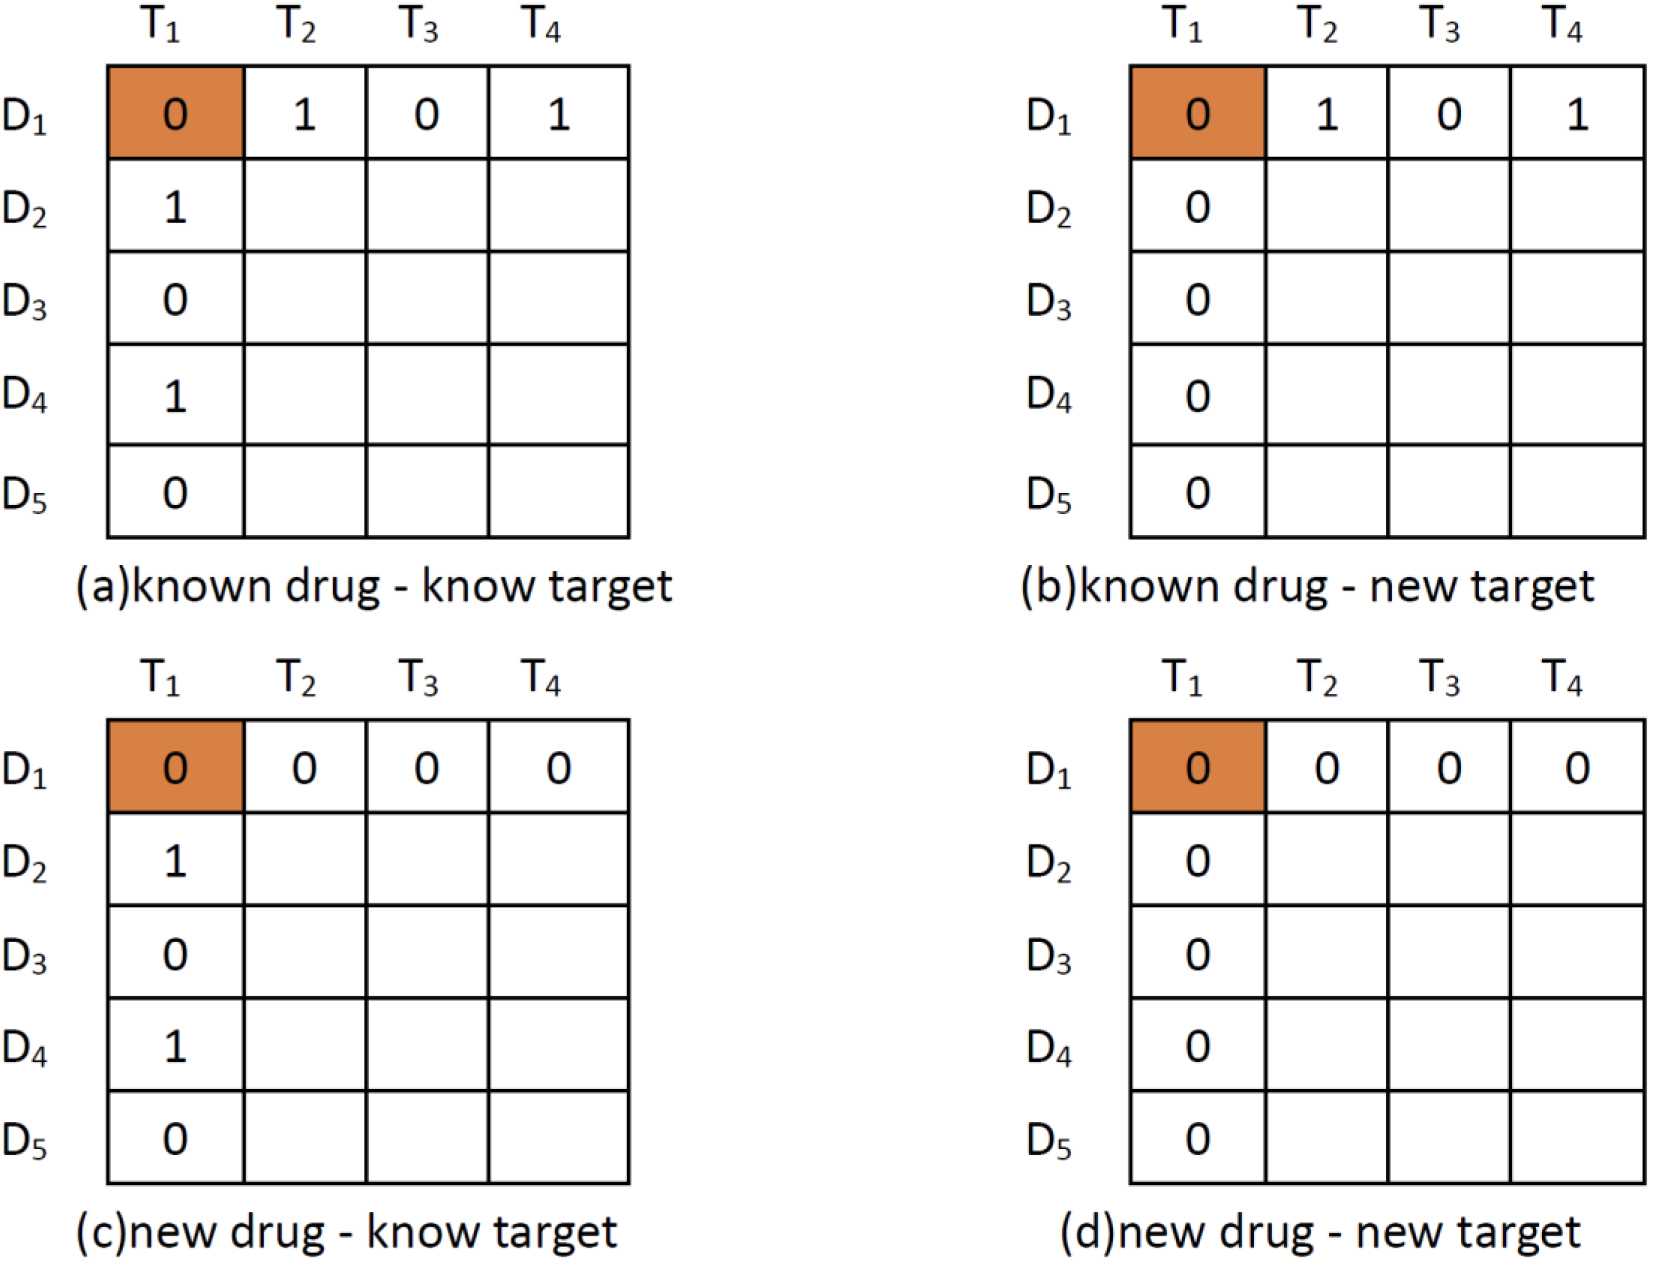
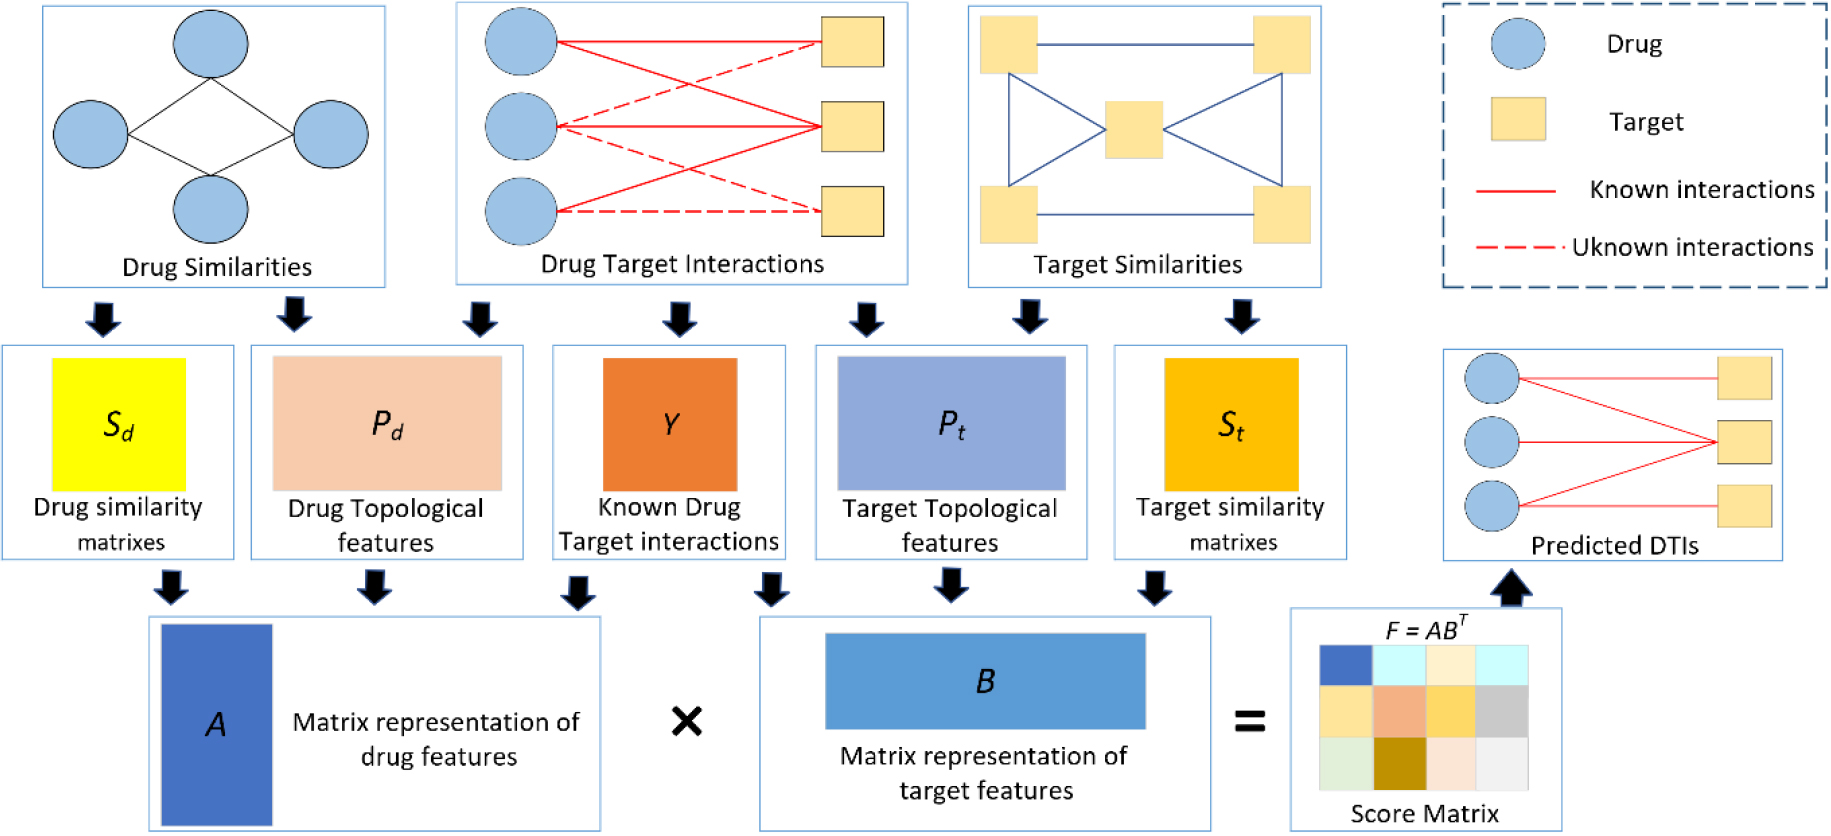
Figure 2.
Process of our proposed model.
In the protocol, definitions reference to a “known drug” means that the experimental drug has at least one interaction with the targets (e.g.,
Suppose
3.2Network topology feature calculation
In this study, the attributive and topological properties of the drug and the target were used. The drug and target attributive features referred to the drug structure and the amino acid sequence of the target protein, respectively. Yamanishi et al. [28] also collected a dataset including the attributive feature similarity of the drug and the target. The structural data of all network nodes were referred to as topological features. Drug-drug topological feature similarity and target-target topological feature similarity were measured using the Node2vec method and the cosine similarity method, respectively, to extract the topological features of drugs and targets from the DTI network [43].
The DTI matrix
(1)
For ease of description, the drug-drug topological feature similarity matrix can be represented as
3.3SPLDMF
The goal of MF was to factorize the identified DTI matrix
(2)
First,
(3)
where
Solving for Eq. (3) might directly lead to overfitting during training. Therefore, the
(4)
where
Based on the idea that drugs with a higher degree of similarity tend to act on a similar set of targets, and vice versa, we integrated drug-related similarity matrices
(5)
Therefore, we added the drug similarity matrix
(6)
where
The objective function of the most recent MF-based approaches for DTI prediction is nonconvex. As a result, the optimized objective function can be easily trapped in local minima, particularly when dealing with enhanced noise and a large amount of missing data. Many studies showed that SPL could alleviate the model falling into a bad local optimal solution because of its training strategy of selecting samples from easy to complex [44, 45]. Thus, we integrated the SPL algorithm into the MF model to improve its strength. Consequently, Eq. (3.3) could be modified as:
(7)
where
According to Zhao et al. [44], the optimal
(8)
where
The alternative search strategy (ASS) was used to calculate
(9)
We fixed
(10)
Similarly, we fixed
(11)
where
Algorithms 1 and 2 explain the process of assessing individual parameters. The potential drug characteristic representation
(12)
| Algorithm 1: Pseudocode of parameter estimation for MF |
|---|
| Input: |
| |
| |
| Ouput: |
| drug potential representation |
| 1: initial A and B randomly; |
| 2: repeat |
| 3: Update |
| 4: Update |
| 5: Update |
| 6: until |
The drugs (compounds) and targets (small molecules) could be determined based on the prediction result, that is, the scoring and ranking of matrix
| Algorithm 2: Pseudocode of parameter estimation for SPLDMF |
|---|
| Input: |
| |
| |
| |
| Ouput: |
| score matrix |
| 1: initial solve the MF problem with all the observation equally weighted to obtain |
| 2: while |
| 3: Update |
| 4: Update |
| 5: Update |
| 6: Compute currentd |
| 7: |
| 8: end while |
4.Results
Compared with other methods, the performance of the proposed model was assessed by simulating experiments under different missing rates and noise ratios. Then, compared with the performance of the advanced model, the performance was tested using four application scenarios. Further, two realistic and challenging extended datasets were selected for experimental comparison. We used four matrices such as root-mean-squared error (RMSE), mean absolute error (MAE), area under the receiver operating characteristic curve (AUC), and precision-recall curve (AUPR) to evaluate the effectiveness of SPLDMF.
4.1Simulation data experiment
Simulation experiments were carried out to test the robustness of the model under different missing rates and noise ratios. We compared the proposed SPLDMF with two popular DTI prediction methods: MF and SVD. According to the studies by Xia et al. [33], Zheng et al. [46], and Zhao et al. [44], a matrix
Table 2
Performance comparison of MF, SVD, and SPLDMF on synthetic data in terms of MAE and RMSE
| Missing_ratio (%) | Noise_ratio (%) | MAE | RMSE | ||||
|---|---|---|---|---|---|---|---|
| CMF | SVD | SPLDMF | CMF | SVD | SPLDMF | ||
| 10 | 5 | 0.497 (0.040) | 0.755 (0.048) | 0.218 (0.005) | 1.340 (0.040) | 1.804 (0.048) | 0.743 (0.029) |
| 10 | 0.667 (0.026) | 0.935 (0.034) | 0.296 (0.009) | 1.472 (0.038) | 1.970 (0.034) | 0.886 (0.031) | |
| 20 | 0.864 (0.023) | 1.159 (0.048) | 0.432 (0.016) | 1.635 (0.038) | 2.164 (0.048) | 1.078 (0.042) | |
| 25 | 0.930 (0.022) | 1.426 (0.045) | 0.514 (0.020) | 1.694 (0.026) | 2.230 (0.045) | 1.189 (0.043) | |
| 40 | 1.113 (0.025) | 1.481 (0.049) | 0.872 (0.032) | 1.833 (0.036) | 2.411 (0.049) | 1.710 (0.060) | |
| 50 | 5 | 0.681 (0.039) | 0.795 (0.045) | 0.259 (0.008) | 1.776 (0.047) | 2.153 (0.045) | 0.889 (0.047) |
| 10 | 0.911 (0.033) | 1.018 (0.038) | 0.351 (0.013) | 1.970 (0.052) | 2.346 (0.038) | 1.075 (0.053) | |
| 20 | 1.151 (0.022) | 1.297 (0.031) | 0.552 (0.022) | 2.231 (0.037) | 2.565 (0.031) | 1.393 (0.063) | |
| 25 | 1.228 (0.032) | 1.411 (0.038) | 0.659 (0.032) | 2.289 (0.051) | 2.650 (0.038) | 1.554 (0.085) | |
| 40 | 1.462 (0.026) | 1.734 (0.042) | 1.094 (0.037) | 2.469 (0.042) | 2.889 (0.042) | 2.157 (0.078) | |
| 90 | 5 | 0.656 (0.027) | 0.775 (0.078) | 0.402 (0.019) | 2.453 (0.072) | 2.571 (0.078) | 0.996 (0.059) |
| 10 | 1.247 (0.035) | 1.138 (0.034) | 0.497 (0.017) | 3.315 (0.080) | 2.881 (0.034) | 1.337 (0.072) | |
| 20 | 2.027 (0.037) | 1.514 (0.032) | 0.890 (0.042) | 4.262 (0.064) | 3.186 (0.032) | 2.171 (0.120) | |
| 25 | 2.307 (0.036) | 1.683 (0.037) | 1.110 (0.045) | 4.559 (0.083) | 3.322 (0.037) | 2.520 (0.128) | |
| 40 | 2.940 (0.052) | 2.138 (0.044) | 1.846 (0.079) | 5.129 (0.085) | 3.649 (0.044) | 3.540 (0.148) | |
4.2Benchmark data experiment
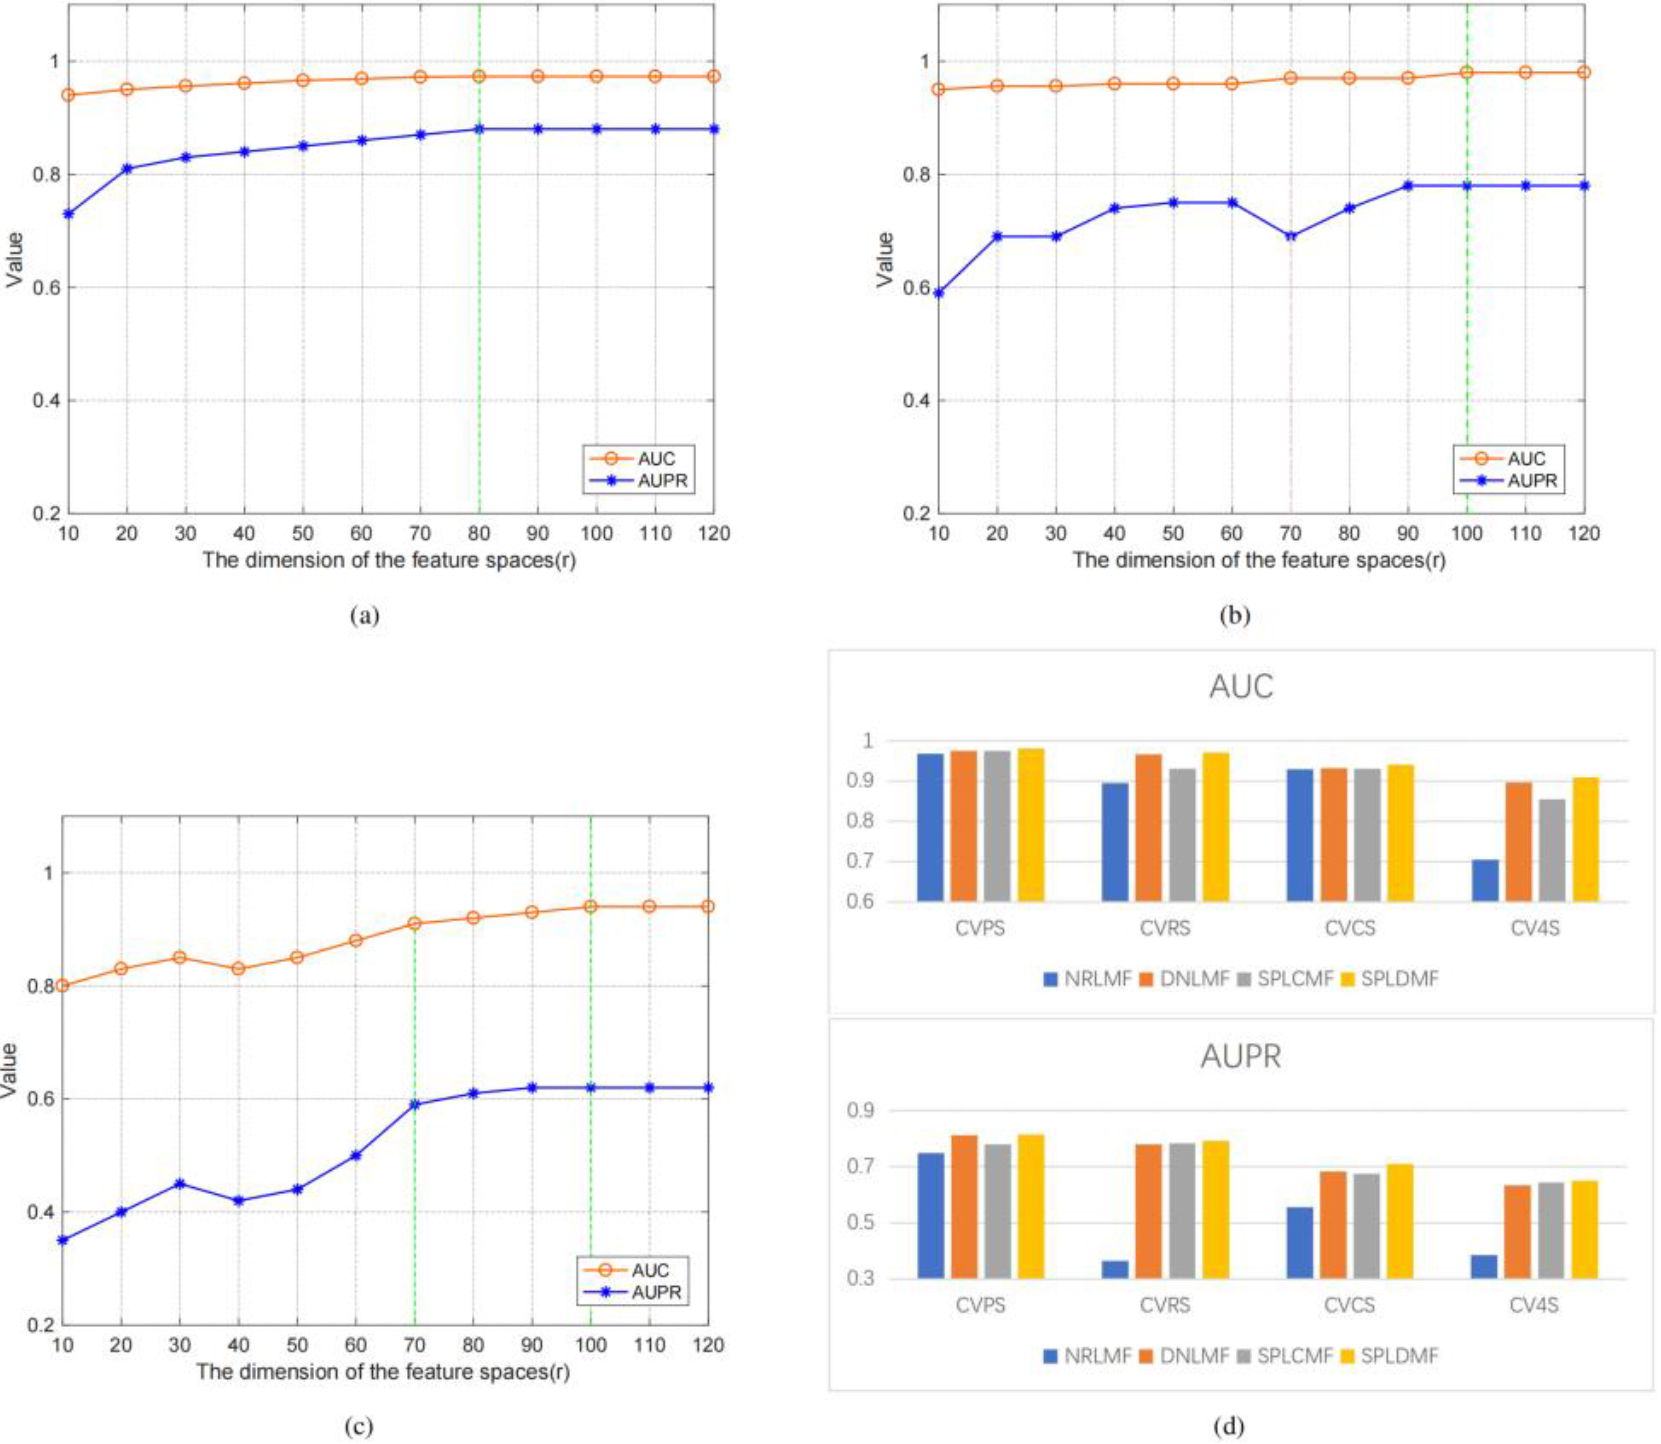
We used the same dataset and cross-validation technique to compare our method with state-of-the-art methods (i.e., 5-time-10-fold cross-validation using Yamanishi’s benchmark dataset in four different applications scenarios) to validate the performance of the model. Three cross-validation settings were used to better evaluate the model in these four scenarios: (1) CVP, which was based on the cross-validation of drug-target pairs; (2) CVR, which was based on cross-validation on rows; (3) CVC, which was based on cross-validation on columns; and (4) CV4S, which was based on random cross-validation. Table 3 depicts the application scenario as well as the optimal potential feature dimensionality settings in our experiments. We employed the CVP settings to predict known drug-known target interactions (i.e., scenario 1, named CVPS). Figure 3 illustrates the model’s AUPR and AUC values for several potential features. The findings revealed that a higher potential feature dimensionality was more consistent AUPR and AUC values. In the CVP scenario, the GPCR dataset also reached the optimal feature dimensionality at
Table 3
Application scenarios and dataset settings and optimal feature dimensionality
| CVPS | CVCS | CVRS | CV4S | |
| Dataset settings | CVP | CVC | CVR | CVP/CVC/CVR |
| Best feature dimension | 80 | 100 | 100 | 100 |
Figure 3.
Performance comparison of SPLDMF and other advanced models, and the influence and change of r on AUC and AUPR in different scenarios. (a) Changes in AUC and AUPR under different feature dimensions under CVPS. (b) Changes in AUC and AUPR under different feature dimensions under CVRS. (c) Variation in AUC and AUPR under different feature dimensions under CVCS. (d) Performance comparison of SPLDMF and other advanced models under the GPCR dataset in four scenarios.
The values are the average findings of 30 runs. The best results are shown in bold, and the values in parentheses are standard deviations.
The value was found to be the highest at
The CVC configuration was applied (i.e., scenario 2, named CVCS) for predicting new target-known drug interactions. Figure 3c illustrates the model’s AUPR and AUC values for several potential feature dimensionalities. The experimental findings revealed that the AUC curves in the CVC scenario differed significantly from those in the CVP and CVR scenarios, particularly with the possible feature dimensionality
The fourth of the four scenarios (CV4S, new drug-new target) was the most difficult for DTI prediction. Since this sort of cross-validation was random and the training datasets and test datasets were also generated randomly, the test dataset might contain samples of fresh medications and fresh targets to aid in the inclusion of drug-target combinations in the new drug-new target category (
Table 4
Comparison of the matrices from the major algorithms in CVPS, CVRS, CVCS, and CV4S scenarios based on the GPCR dataset
| Scenario | Method | AUC | AUPR |
|---|---|---|---|
| CVPS | NRLMF | 0.969 | 0.749 |
| DNILMF | 0.975 | 0.812 | |
| SPLCMF | 0.976 | 0.779 | |
| SPLDMF |
0.982 |
0.815 | |
| CVRS | NRLMF | 0.895 | 0.364 |
| DNILMF | 0.967 | 0.781 | |
| SPLCMF | 0.967 | 0.784 | |
| SPLDMF |
0.971 |
0.792 | |
| CVCS | NRLMF | 0.930 | 0.556 |
| DNILMF | 0.933 | 0.684 | |
| SPLCMF | 0.931 | 0.675 | |
| SPLDMF |
0.941 |
0.710 | |
| CV4S | NRLMF | 0.706 | 0.385 |
| DNILMF | 0.897 | 0.633 | |
| SPLCMF | 0.856 | 0.645 | |
| SPLDMF |
0.910 |
0.651 |
Table 5
Top 10 drug-target relationship prediction scores and their validation
| Rank | Drug name | Target name | Score | Databases | Literature |
|---|---|---|---|---|---|
| 1 | Verapamil | SCN4A | 0.983 | C, D, K | [49, 50] |
| 2 | Clozapine | DD5R | 0.978 | D | [51] |
| 3 | Mirtazapine | 5HR1A | 0.902 | D | [52] |
| 4 | Diethylstilbestrol | ESR1 | 0.896 | C, D, K | [53, 54] |
| 5 | Norehindrone | ESR1 | 0.894 | – | – |
| 6 | Methysergide | 5HR1D | 0.893 | C, D, K | [55] |
| 7 | Flunitrazepam | GARSA1 | 0.891 | C, K | [56] |
| 8 | Clozapine | ADRA1A | 0.886 | C, D | [57, 58] |
| 9 | Loxapine | 5HR2B | 0.879 | C, D, K | [59] |
| 10 | Isoflurane | GABRA1 | 0.876 | D | [60] |
Table 6
Comparison of the matrices from DNILMF, SPLCMF, and SPLDMF algorithms in four scenarios based on the Kuang and Hao datasets
| Dataset | Scenario | AUC | AUPR | ||||
|---|---|---|---|---|---|---|---|
| DNILMF | SPLCMF | SPLDMF | DNILMF | SPLCMF | SPLDMF | ||
| Kuang | CVP | 0.941 | 0.933 | 0.949 | 0.649 | 0.733 | 0.842 |
| CVR | 0.803 | 0.831 | 0.840 | 0.602 | 0.491 | 0.710 | |
| CVC | 0.862 | 0.886 | 0.888 | 0.643 | 0.456 | 0.731 | |
| CV4S | 0.897 | 0.826 | 0.903 | 0.633 | 0.435 | 0.742 | |
| Hao | CVP | 0.943 | 0.935 | 0.943 | 0.748 | 0.721 | 0.816 |
| CVR | 0.811 | 0.792 | 0.843 | 0.736 | 0.740 | 0.741 | |
| CVC | 0.852 | 0.868 | 0.881 | 0.683 | 0.710 | 0.726 | |
| CV4S | 0.901 | 0.816 | 0.912 | 0.621 | 0.593 | 0.735 | |
We conducted sufficient comparative experiments for the aforementioned four scenarios to verify the effectiveness of the proposed method. Specifically, we compared SPLDMF with three other state-of-the-art methods, and the results are depicted in Table 4. The results indicated that the AUC and AUPR of SPLDMF were currently the best among the comparison methods. Our method could deal with noisy data more robustly due to the introduction of the SPL strategy, thus achieving better performance. The result showed that SPLDMF under all scenarios outperformed NRLMF and DNILMF in AUC and AUPR, suggesting that the proposed SPLDMF was more robust when using ligand-based methods to anticipate the interactions between ligands and target proteins. Our method outperformed in all scenarios compared with SPLCMF, which also used SPL strategy. An insightful explanation was that we leveraged more drug-drug and target-target similarities to improve predictive capacity for unknown outcomes. The result also demonstrated that SPLDMF had an improvement of 0.054 and 0.006 in AUC and AUPR, respectively, in the most difficult scenario CV4S, compared with SPLCMF.
The prediction matrix was scored using Eq. (12). We took the top 10 DTI pairs with the prediction scores after synthesizing the DTI prediction scores of NR, GPCR, IC, and E. Data validation was performed using ChEMBL, DrugBank, and KEGG databases, labeled C, D, and K, respectively. We validated the partial prediction results based on previous studies. The fifth and sixth columns of Table 5 list the database used for data validation and the studies referred to for the validation method, respectively. Table 5 lists the top 10 predicted DTIs. The most anticipated interaction was between DB00661 (verapamil) and P35499 (SCN4A) with a predicted high score of 0.983. This predicted relationship was found in the three databases C, D, and K. Furthermore, they were also reported in previous studies (Shafi et al., 2022; Stee et al., 2020). Except for the fifth item, other predictions were found in relevant reports in the database and literature, which verified these predictions to a certain extent. The fifth pair, the relationship between norethindrone (DB00717) and ESR1 (P03372), had no relevant reports in the current database and literature.
According to the FDA, the drug norethindrone (DB00717), similar to the drug diethylstilbestrol (DB00255), is a progestin used for contraception, the prevention of endometrial hyperplasia in hormone replacement therapy, and the treatment of other hormone-mediated diseases such as endometriosis. Diethylstilbestrol is also used to treat diseases such as breast and prostate cancer, but it is listed as a known carcinogen. The predicted results indicated that norethindrone has the same target (ESR1) as diethylstilbestrol. Besides its proven contraceptive use, norethindrone may also be used to treat breast cancer, prostate cancer, and other diseases based on the target principle. We verified our speculation through the KEGG pathway analysis experiment.
4.3Expanded data experiment
Besides simulated data and common benchmark datasets, the proposed SPLDMF was also tested with additional expanded datasets (prepared by Kuang [39] and Hao [31]) to fully verify the effectiveness of the suggested model on various datasets. A total of 3681 known interactions, 786 drugs, and 809 targets were detected in the Kuang dataset. Moreover, 3688 known interactions, 829 drugs, and 733 targets were detected in the Hao dataset. Table 6 depicts the performance comparison of SPLDMF and other methods on the expanded dataset, indicating that SPLDMF achieved the best prediction performance on both augmented datasets. This was mainly attributed to the fact that the SPL strategy improved the generalization performance of the model, enabling it to perform more robustly on noisy data. Meanwhile, the use of more feature similarity also enhanced the prediction accuracy, which was conducive to the discovery of potential DTIs.
5.Discussion and conclusion
Several computational-based methods, including similarity-based methods, standard machine learning methods, and MF-based methods, have been developed in recent years to achieve efficient and accurate DTI prediction. A recent study by Shi et al. [48] revealed that MF-based methods had the best prediction accuracy. Existing MF-based methods, however, might easily fall into bad local minima due to noise and missing data, as well as the nonconvex pattern of MF models. Meanwhile, the lack of prior information made it challenging for the model to accurately predict more potential associations. Therefore, we proposed a DTI prediction model based on an SPL strategy and incorporated more similarity information. The novelty of SPLDMF might be attributed to a combination of several factors. First, introducing the SPL strategy enabled the model to avoid falling into a bad local optimum solution and thus had stronger robustness. The proposed SPLDMF had better prediction performance when the data were affected by noise. Moreover, we employed more prior similarity information to improve the feature extraction capability of the model, thus enabling the model to observe more potential DTIs accurately.
Extensive experiments on synthetic data and four benchmark datasets were performed to assess the validity of the proposed SPLDMF method, which was then compared with three state-of-the-art DTI prediction methods. Two extended datasets were also used to verify the validity of each method. Comprehensive analysis results demonstrated that our proposed SPLDMF outperformed other state-of-the-art approaches. SPLDMF, for example, was more robust for noisy and missing data based on synthetic data. Furthermore, it outperformed all four scenarios and two expanded datasets in terms of common machine learning evaluation matrices. The prediction results revealed that 9 of the top 10 DTI pairs were found in the database and literature, and they were proven or considered effective. An unproven DTI pair (DB00717-P03372) was also preliminarily proven using pathway enrichment experiments. These results suggested that SPLDMF might provide a useful tool for predicting new DTIs and redirecting the use of existing drugs.
Acknowledgments
This work was supported in part by the Macau Science and Technology Development (Grant no. 0056/2020/AFJ) from the Macau Special Administrative Region of the People’s Republic of China and the Key Project from the University of Educational Commission of Guangdong Province of China (Natural, grant no. 2019GZDXM005).
Conflict of interest
None to report.
References
[1] | Hopkins AL. Predicting promiscuity. Nature. 167-168. |
[2] | Swamidass SJ. Mining small-molecule screens to repurpose drugs. Briefings in bioinformatics. 327-335. |
[3] | Iorio F, Rittman T, Ge H, Menden M, Saez-Rodriguez J. Transcriptional data: a new gateway to drug repositioning? Drug discovery today. 350-357. |
[4] | Luo Y, Zhao X, Zhou J, Yang J, Zhang Y, Kuang W, et al. A network integration approach for drug-target interaction prediction and computational drug repositioning from heterogeneous information. Nature communications. 1-13. |
[5] | Quinn JG, Pitts KE, Steffek M, et al. Determination of affinity and residence time of potent drug-target complexes by label-free biosensing. Journal of Medicinal Chemistry. |
[6] | Ashburn TT, Thor KB. Drug repositioning: identifying and developing new uses for existing drugs. Nature reviews Drug discovery. 673-683. |
[7] | Ezzat A, Wu M, Li X-L, Kwoh C-K. Computational prediction of drug-target interactions using chemogenomic approaches: an empirical survey. Briefings in bioinformatics. 1337-1357. |
[8] | Huang S-Y, Li M, Wang J, Pan Y. Hybriddock: a hybrid protein-ligand docking protocol integrating protein-and ligand-based approaches. Journal of Chemical Information and Modeling. 1078-1087. |
[9] | Xue H, Li J, Xie H, Wang Y. Review of drug repositioning approaches and resources. International journal of biological sciences. 1232. |
[10] | Sousa SF, Ribeiro AJ, Coimbra J, Neves R, Martins S, Moorthy N, et al. Protein-ligand docking in the new millennium – a retrospective of 10 years in the field. Current medicinal chemistry. 2296-2314. |
[11] | Huang S-Y, Zou X. Advances and challenges in protein-ligand docking. International Journal of Molecular Sciences. (2010) ; 11: : 3016-3034. |
[12] | Ekins S, Williams AJ, Krasowski MD, Freundlich JS. In silico repositioning of approved drugs for rare and neglected diseases. Drug Discovery Today. (2011) ; 16: : 298-310. |
[13] | Sperandio O, Andrieu O, Miteva MA, Vo M-Q, Souaille M, Delfaud F, et al. Med-sumolig: A new ligand-based screening tool for efficient scaffold hopping. Journal of Chemical Information and Modeling. (2007) ; 47: : 1097-1110. |
[14] | Keiser MJ, Setola V, Irwin JJ, Laggner C, Abbas AI, Hufeisen SJ, et al. Predicting new molecular targets for known drugs. Nature. (2009) ; 462: : 175-181. |
[15] | Wang L, Ma C, Wipf P, Liu H, Su W, Xie X-Q. Targethunter: An in silico target identification tool for predicting therapeutic potential of small organic molecules based on chemogenomic database. The AAPS Journal. (2013) ; 15: : 395-406. |
[16] | Haupt VJ, Schroeder M. Old friends in new guise: Repositioning of known drugs with structural bioinformatics. Briefings in Bioinformatics. (2011) ; 12: : 312-326. |
[17] | Ma D-L, Chan DS-H, Leung C-H. Drug repositioning by structure-based virtual screening. Chemical Society Reviews. (2013) ; 42: : 2130-2141. |
[18] | Sousa SF, Ribeiro AJM, Coimbra JTS, et al. Protein-ligand docking in the new millennium – a retrospective of 10 years in the field. Current Medicinal Chemistry. (2013) ; 20: (18): 2296-2314. |
[19] | Ekins W, Krasowski AJ, Freundlich MD, et al. In silico repositioning of approved drugs for rare and neglected diseases. Drug Discov Today. 16: (7-8): 298-310. |
[20] | Sperandio O, Andrieu O, Miteva MA, Vo MQ, Souaille M, Delfaud F, et al. Medsumolig: A new ligand-based screening tool for efficient scaffold hopping. Journal of Chemical Information and Modeling. 1097-1110. |
[21] | Jarada TN, Rokne JG, Alhajj R. A review of computational drug repositioning: strategies, approaches, opportunities, challenges, and directions. BioMed Central. |
[22] | Pliakos K, Vens C, Tsoumakas G. Predicting drug-target interactions with multilabel classification and label partitioning. IEEE/ACM Transactions on Computational Biology and Bioinformatics. 1-1. |
[23] | Wishart DS, Knox C, Guo AC, Cheng D, Shrivastava S, Tzur D, et al. Drugbank: a knowledgebase for drugs, drug actions and drug targets. Nucleic acids research. D901-D906. |
[24] | Kanehisa M, Goto S, Hattori M, Aoki-Kinoshita KF, Itoh M, Kawashima S, et al. From genomics to chemical genomics: new developments in kegg. Nucleic acids research. D354-D357. |
[25] | Chen B, Wild D, Guha R. Pubchem as a source of polypharmacology. Journal of chemical information and modeling. 2044-2055. |
[26] | Schomburg I, Chang A, Ebeling C, Gremse M, Heldt C, Huhn G, et al. Brenda, the enzyme database: updates and major new developments. Nucleic acids research. D431-D433. |
[27] | Gunther S, Kuhn M, Dunkel M, Campillos M, Senger C, Petsalaki E, et al. Supertarget and matador: resources for exploring drug-target relationships. Nucleic acids research. D919-D922. |
[28] | Yamanishi Y, Araki M, Gutteridge A, Honda W, Kanehisa M. Prediction of drug-target interaction networks from the integration of chemical and genomic spaces. Bioinformatics. i232-i240. |
[29] | Bleakley K, Yamanishi Y. Supervised prediction of drug-target interactions using bipartite local models. Bioinformatics. 2397-2403. |
[30] | Liu Y, Wu M, Miao C, Zhao P, Li X-L. Neighborhood regularized logistic matrix factorization for drug-target interaction prediction. PLoS computational biology. e1004760. |
[31] | Hao M, Wang Y, Bryant SH. Improved prediction of drug-target interactions using regularized least squares integrating with kernel fusion technique. Analytica chimica acta. 41-50. |
[32] | Yang X, Liu Y, He J, et al. Additional neural matrix factorization model for computational drug repositioning. BMC bioinformatics. 1-11. |
[33] | Xia L-Y, Yang Z-Y, Zhang H, Liang Y. Improved prediction of drug-target interactions using self-paced learning with collaborative matrix factorization. Journal of chemical information and modeling. 3340-3351. |
[34] | Yang M, Wu G, Zhao Q, Li Y, Wang J. Computational drug repositioning based on multi-similarities bilinear matrix factorization. Briefings in Bioinformatics. bbaa267. |
[35] | Ding Y, Tang J, Guo F, Zou Q. Identification of drug-target interactions via multiple kernel-based triple collaborative matrix factorization. Briefings in Bioinformatics. |
[36] | Wang Y, Zhang Y, Wang J, Xie F, Zheng D, Zou X, et al. Prediction of drug-target interactions via neural tangent kernel extraction feature matrix factorization model. Computers in Biology and Medicine. 106955. |
[37] | Kumar MP, Packer B, Koller D. Self-paced learning for latent variable models. In International Conference on Neural Information Processing Systems. |
[38] | Kumar MP, Turki H, Dan P, Koller D. Learning specific-class segmentation from diverse data. In International Conference on Computer Vision. |
[39] | Kuang Q, Xu X, Li R, Dong Y, Li Y, Huang Z, et al. An eigenvalue transformation technique for predicting drug-target interaction. Scientific reports. 13867. |
[40] | Kanehisa M, Goto S, Hattori M, Aoki-Kinoshita KF, Itoh M, Kawashima S, et al. Fromgenomics to chemical genomics: new developments in kegg. Nucleic acids research. D354-D357. |
[41] | Schomburg I, Chang A, Ebeling C, Gremse M, Heldt C, Huhn G, et al. Brenda, the enzyme database: updates and major new developments. Nucleic acids research. D431-D433. |
[42] | Gunther S, Kuhn M, Dunkel M, Campillos M, Senger C, Petsalaki E, et al. Supertarget and matador: resources for exploring drug-target relationships. Nucleic acids research. D919-D922. |
[43] | Grover A, Leskovec J. node2vec: Scalable feature learning for networks. In Proceedings of the 22nd ACM SIGKDD International Conference on Knowledge Discovery and Data Mining. pp. 855-864. |
[44] | Zhao Q, Meng D, Jiang L, Xie Q, Xu Z, Hauptmann AG. Self-paced learning for matrix factorization. In Aaai. 3: : 4. |
[45] | Meng D, Zhao Q, Jiang L. A theoretical understanding of self-paced learning. Information Sciences. 319-328. |
[46] | Zheng X, Ding H, Mamitsuka H, Zhu S. Collaborative matrix factorization with multiple similarities for predicting drug-target interactions. In Proceedings of the 19th ACM SIGKDD International Conference on Knowledge Discovery and Data Mining. pp. 1025-1033. |
[47] | Van Laarhoven T, Nabuurs SB, Marchiori E. Gaussian interaction profile kernels for predicting drug-target interaction. Bioinformatics. 3036-3043. |
[48] | Shi J-Y, Yiu S-M, Li Y, Leung HC, Chin FY. Predicting drug-target interaction for new drugs using enhanced similarity measures and super-target clustering. Methods. 98-104. |
[49] | Shafi O, Latief M, Hassan Z, Abbas F, Farooq S. Familial hypokalemic periodic paralysis: A case series and review. Hemoglobin (g/dL). 13-8. |
[50] | Stee K, Van Poucke M, Peelman L, Lowrie M. Paradoxical pseudomyotonia in English springer and cocker spaniels. Journal of veterinary internal medicine. 253-257. |
[51] | Von Coburg Y, Kottke T, Weizel L, Ligneau X, Stark H. Potential utility of histamine h3 receptor antagonist pharmacophore in antipsychotics. Bioorganic & medicinal chemistry letters. 538-542. |
[52] | Langham JJ, Cleves AE, Spitzer R, Kirshner D, Jain AN. Physical binding pocket induction for affinity prediction. Journal of medicinal chemistry. 6107-6125. |
[53] | Adam AHB, de Haan LH, Louisse J, Rietjens IM, Kamelia L. Assessment of the in vitro developmental toxicity of diethylstilbestrol and estradiol in the zebrafish embryotoxicity test. Toxicology in Vitro. 105088. |
[54] | Gomez AL, Delconte MB, Altamirano GA, Vigezzi L, Bosquiazzo VL, Barbisan LF, et al. Perinatal exposure to bisphenol a or diethylstilbestrol increases the susceptibility to develop mammary gland lesions after estrogen replacement therapy in middle-aged rats. Hormones and Cancer. 78-89. |
[55] | Wishart D, Arndt D, Pon A, Sajed T, Guo AC, Djoumbou Y, et al. T3db: The toxic exposome database. Nucleic Acids Research. 43: : D928-D934. |
[56] | Collins I, Davey WB, Rowley M, Quirk K, Bromidge FA, McKernan RM, et al. N-(indol-3-ylglyoxylyl) piperidines: high affinity agonists of human gaba-a receptors containing the subunit. Bioorganic & medicinal chemistry letters. 1381-1384. |
[57] | Gundlach M, Di Paolo C, Chen Q, Majewski K, Haigis A-C, Werner I, et al. Clozapine modulation of zebrafish swimming behavior and gene expression as a case study to investigate effects of atypical drugs on aquatic organisms. Science of The Total Environment. 152621. |
[58] | Masellis M, Basile V, DeLuca V, Meltzer H, Lieberman J, Potkin S, et al. Alpha-1a adrenergic (adra1a) and serotonin 6 (htr6) receptor gene polymorphisms and clinical response to clozapine. American Journal of Medical Genetics-Neuropsychiatric Genetics. |
[59] | Alaimo S, Bonnici V, Cancemi D, Ferro A, Giugno R, Pulvirenti A. Dt-web: a web-based application for drug-target interaction and drug combination prediction through domain-tuned network-based inference. BMC systems biology. (2015) ; 1-11. |
[60] | Hall AC, Rowan KC, Stevens RJ, Kelley JC, Harrison NL. The effects of isoflurane on desensitized wild-type and |


