
Morphological ECG subtraction method for removing ECG artifacts from diaphragm EMG
Abstract
BACKGROUND:
Diaphragmatic electromyographic (EMGdi) is a helpful method to reflect the respiratory center’s activity visually. However, the electrocardiogram (ECG) severely affected its weakness, limiting its use.
OBJECTIVE:
To remove the ECG artifact from the EMGdi, we designed a Morphological ECG subtraction method (MES) based on three steps: 1) ECG localization, 2) morphological tracking, and 3) ECG subtractor.
METHODS:
We evaluated the MES method against the wavelet-based dual-threshold and stationary wavelet filters using visual and frequency-domain characteristics (median frequency and power ratio).
RESULTS:
The results show that the MES method can preserve the features of the original diaphragm signal for both surface diaphragm signal (SEMGdi) and clinical collection of diaphragm signal (EMGdi_clinic), and it is more effective than the wavelet-based dual-threshold and stationary wavelet filtering methods.
CONCLUSION:
The MES method is more effective than other methods. This technique may improve respiratory monitoring and assisted ventilation in patients with respiratory diseases.
1.Introduction
Chronic respiratory diseases, such as asthma, chronic obstructive pulmonary dis-ease (COPD), occupational lung disease, and pulmonary hypertension, damage the airways and several lung structures and are considered to be one of the major threats to human survival and development [1]. According to the World Health Organization (WHO), over 3 million deaths every year are due to chronic respiratory diseases [2]. Bioelectrical signals, such as the electrocardiogram (ECG) and electromyography (EMG), can be recorded with devices, and signal processing techniques are used to ultimately obtain important cardiopulmonary information. The measurement of diaphragmatic electromyography (EMGdi) can be used to assess the nerve respiratory drive (NRD) indirectly, thereby assessing the level and mode [3, 4] of muscle activation, which is essential for the treatment of respiratory diseases.
There are two main ways to collect EMGdi: esophageal diaphragm (ESD) and surface diaphragm electromyography (SEMGdi) [5]. ESD detection is an invasive method of detection that receives signals by feeding a collection tube into the esophagus. Although esophageal diaphragm detection can obtain a relatively pure diaphragm signal, it is an invasive acquisition method, so it has some limitations. SEMGdi has the same function as ESD and has the advantage of being noninvasive [6]. SEMGdi measures the location of interest on the body surface by using electrodes. However, due to the acquisition on the body surface, although it reduces the harm caused by the invasion, it also increases other muscle electrical signals [7, 8]. The SEMGdi decays through tissue and skin and becomes much smaller [9] than the ECG signal, which means a better signal processing algorithm is required to obtain the required information.
EMGdi has spectral aliasing with ECG [10] (the main frequency band of ECG signal is 20–100 Hz, in which P wave and T wave are below 20 hz, while the main frequency band of diaphragm EMG is 30–400 Hz), which makes it challenging to extract the EMGdi signal without ECG. To remove ECG interference from EMGdi signals, re-searchers have proposed many solutions, including using gating [6], template reduction [11, 11, 12, 13, 14], mathematical morphology [15], wavelet filter [5, 16, 17] and independent variable analysis [17]. However, these methods either cannot remove ECG interference while retaining most EMGdi information or are limited in clinical application due to computational complexity and the need to add extra channels. To solve the problem of requiring redundant channels, Jonkman [12] and Costa Junior [14] proposed that template subtractors that do not require separate ECG records would work well in removing ECG interference from EMG and EMGdi. However, a single ECG template could not consider the abrupt changes in ECG information, which would limit the effect.
In contrast, Wu et al. [17] proposed the combination of ICA decomposition and wavelet transformation to remove ECG interference for EMGdi. According to the statistical characteristics of EMGdi and ECG, it is divided into different sub-carriers. Then the sub-carriers are subjected to wavelet transformation to remove ECG noise, and finally, all signals are inversely transformed into clean EMGdi. ICA and wavelet transform methods achieve better performance by increasing the complexity. Lu [15] and others have proposed a mathematical morphology method to remove ECG interference from EMGdi. This method is simple and easy to implement, but they process all segments of EMGdi and eventually cause EMGdi to decay. EMGdi fragments without ECG do not need to be processed. Mathematical morphology subtraction removes the part of the EMGdi that is processed at low frequencies, so there is an attenuation of the EMGdi. The above algorithms either process EMGdi collected from the esophagus alone or SEMGdi. No algorithm can process both SEMGdi and ESD.
To solve the inability to obey the diaphragm EMG signal faithfully, the attenuation of the diaphragm EMG as a whole, the vacancy in the simultaneous processing of SEMGdi and ESD, and the complexity of the processing, we propose a mathematical morphology subtraction method based on ECG detection to remove ECG artifacts from EMGdi.
2.Method
2.1Subjects and signal acquisition
The data of 20 subjects were used in this experiment, and all data were processed offline by saving them on a computer. All subjects were fully informed of any risk as-sociated with the study and provided their written consent before participation. The data of 10 clinical patients (EMGdi_clinic) were obtained from the Guangzhou State Key Laboratory of Respiratory Diseases [18, 19, 20]. These subjects were all male, with an average age of 66 years, a standard deviation of 10, a mean BMI of 21, and a standard check of 3.9. The underlying diseases were interstitial lung disease and chronic obstructive pulmonary disease. The main components of the signal acquisition system are five-lead esophagus electrodes and Powerlab medical, a physiological signal acquisition system from AD Instruments, Australia, with a sampling frequency of 2000 Hz. The signal has undergone the following pre-processing during acquisition.
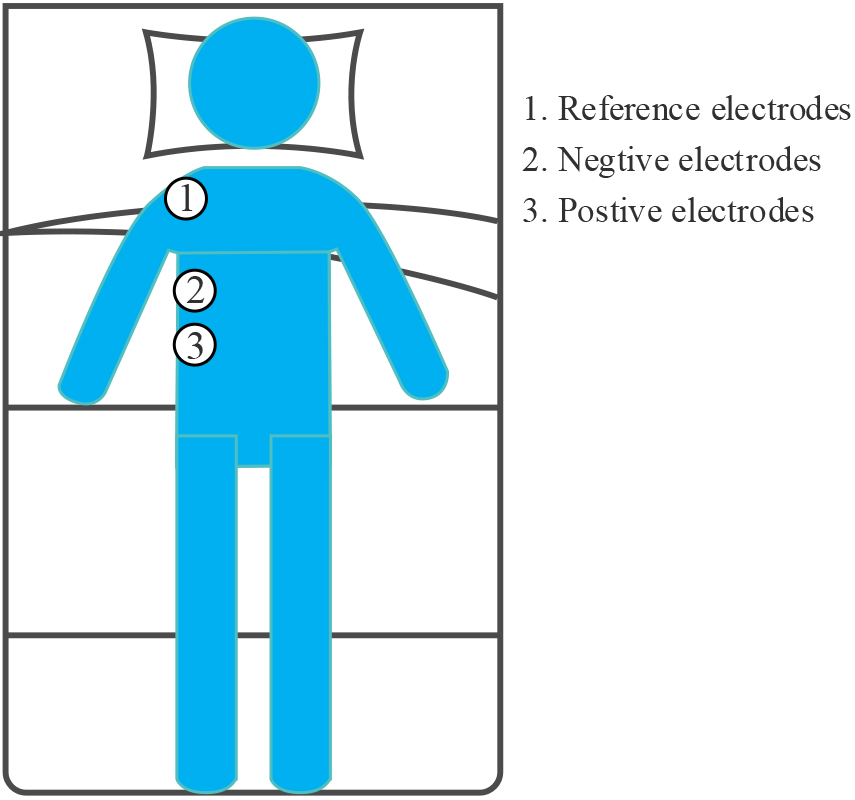
The SEMGdi data collected in the laboratory from 10 healthy adults were used in this study. Again, these subjects were also male, with a mean age of 25 years, a stand-ard deviation of 1, and a mean BMI of 23.7, with a standard deviation of 0.4. Physio-logical signals were recorded by two round disposable Ag/AgCl electrodes (11 mm in diameter, pre-gel, foam) with a bipolar structure. A 24-bit high-precision ADC (ADS1293, USA, TI Corp) was used for modular conversion. The differential input ends were attached to the right lower chest, along the line between the anterior axillary line and the midline of the clavicle [7], on the seventh and eighth rib spaces above the rib edge, and the two differential input ends were placed 2–3 cm apart. As shown in Fig. 1, the reference electrodes are placed on the right shoulder away from the input end. This area corresponds to the adhering area of the cost diaphragm. The whole measurement process strictly follows SENIAM measurement recommendations [21]. All electrode recording points are carefully prepared with abrasive cream (Heal Force, ShangHai, China) and cleaned with medical alcohol to improve skin/electrode impedance. Participants were asked not to speak or move during the test. They naturally placed their hands on both sides and lay flat in bed after 100 seconds of silence.
Figure 1.
Position of electrode for SEMGdi signal acquisition.
2.2Studies for comparison
After pre-processing, Li et al. [20] proposed a wavelet-based du-al-threshold filter to eliminate the ECG artifact in the ESD. The basic principle is to decompose the wavelet into many sub-wavelets and perform ECG positioning in the sub-wavelets with the most apparent ECG signal. During positioning, each sub-wavelet uses threshold filtering. The segment is identified as an ECG segment when more excellent than a certain threshold. Then, the distribution around the ECG segment is calculated, and the ECG segment is filled. Finally, the filled sub-wavelets are reconstructed to a diaphragmatic signal without an ECG (EMGdi_DFT). It is worth noting that the threshold for ECG localization and the threshold used for filling ECG segments are dynamically updated, and the algorithm shows promising results in EMGdi_clinic.
In addition, Luo et al. [13] used a threshold filter based on a stationary wavelet to deal with the ECG interference in the diaphragm signal (EMGdi_STAT), which has a good effect. Recently, Gu et al. [22] demonstrated that the processed signal could extract breathing features.
2.3Signal pre-processing
All signal processing work is done in Python. The preprocessing appointment can divide into two steps: 1) The surface EMG signal is passed through an 8th-order Butterworth filter with a bandwidth of 20–400 Hz and then passed through a notch filter with a center frequency of 50 Hz. The diaphragm signal (EMGdi_raw). According to the literature [6], the above operation can reduce the SEMGdi_para to remove most of the noise of the ECG signal. 2) After passing the signal through an 8th-order Butter-worth bandpass filter with a bandwidth of 20–50, ECG_Chanel is obtained to prepare for the subsequent ECG detection. This can preserve the ECG signal more thoroughly and remove the diaphragm muscle signal, so as to prepare for the subsequent ECG detection.
2.4Morphological ECG Subtraction Method Based on ECG Detection
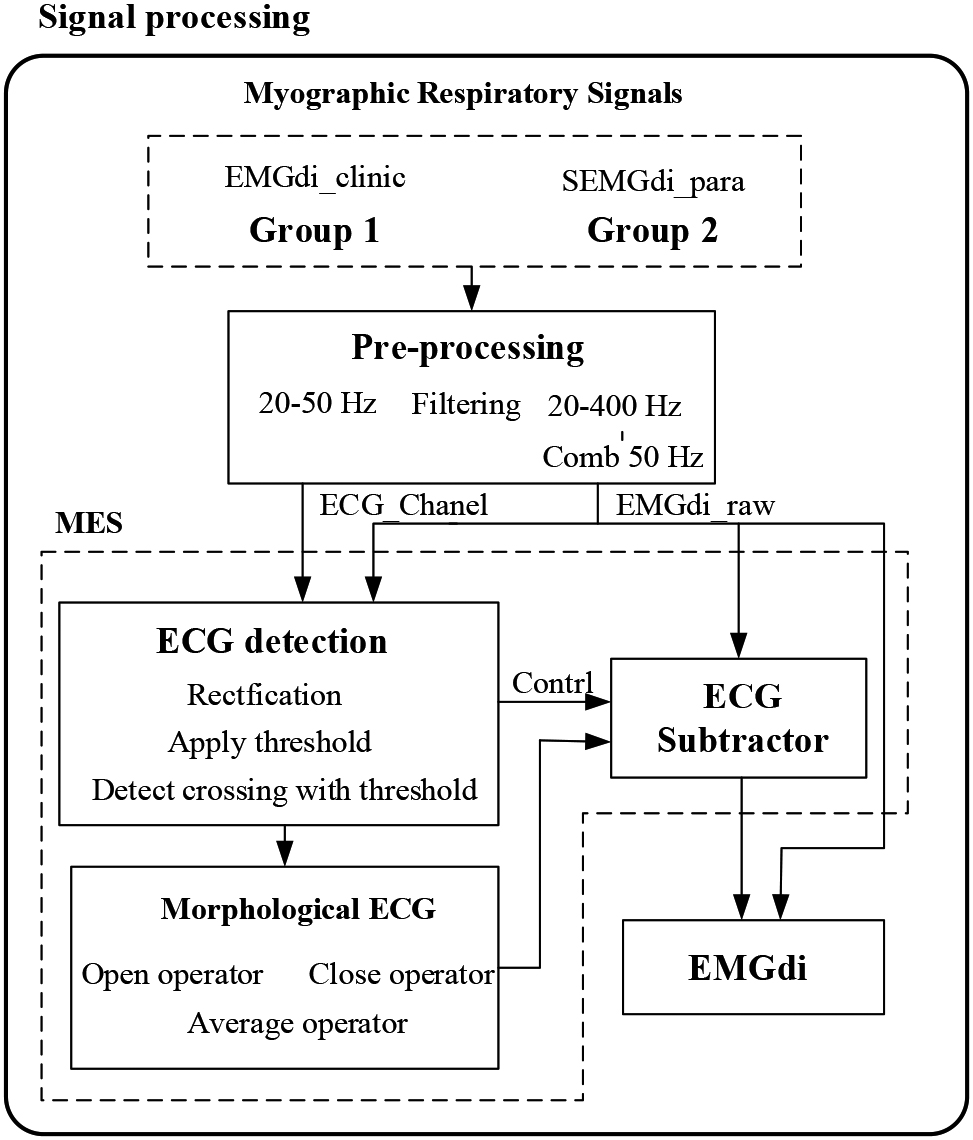
We propose a Morphological ECG subtraction method (MES) to extract the diaphragm electromyographic components from the ECG signal. The algorithm consists of three steps: 1) ECG detection, 2) morphological tracking, and 3) ECG subtractor. The processing block diagram of the system is shown in Fig. 2. The MES method uses the basic idea of mathematical morphology, obtains the peak and valley information of ECG fragments by expanding and corrosion operation, integrates the peak and valley information of ECG fragments by averaging function, obtains pieces with ECG morphology, and finally obtains EMGdi without ECG by removing the ECG with subtractor.
Figure 2.
Data analysis block diagram. MES: Morphological ECG subtraction.
2.4.1ECG detection
ECG detection is the critical step of this algorithm, and the quality of ECG detection directly affects the filtering effect. Since the ECG has its prominent morphological characteristics and the R point is obvious, our ECG detection is mainly the detection of the R point. In this algorithm, the ECG_Chanel signal is squared first. The square distinguishes the ECG signal from the diaphragmatic muscle signal to a greater degree. Then find the maximum value for a while, and use this maximum value as the starting point of the first ECG. At the same time, half of this maximum value is taken as the threshold value. Then, the threshold value is updated each time a new ECG signal is detected. The threshold update rule is shown by Eq. (1):
(1)
Where
ECG detection is achieved by taking the intersection of the threshold and the square signal. An input signal to compare the threshold used for each, and the timing starts when the comparison is that the current threshold is smaller than the current input signal. When a signal value below the threshold occurs before the time count to
(2)
Note that the length of
2.4.2Morphological tracing
Morphological tracing is developed based on rigorous mathematical topology. The mathematical morphological method has two fundamental operations (expansion and corrosion) and two basic operations (open and closed operations) [15, 24]. Morphological tracing is to traverse the signal using shift and extreme value by using the template function. The traversal result is closely related to the choice of template, associate with the shape of the signal. The open operation is sensitive to the trough of the signal, while the closed operation is sensitive to the signal’s peak. To better fit the peaks and troughs of the ECG signal, the output signal is the average form of open operation and closed operation. Let
(3)
From the EMGdi_raw, we can see that the fluctuation of the ECG signal is more prominent and lower in frequency than the diaphragm signal. Therefore, we can use a smaller template than the ECG fluctuation and more significant than the diaphragmatic muscle fluctuation to realize the ECG fitting. The sampling rate of EMGdi_clinic is 2000 Hz. According to experience, a linear template with all 0 s and a length of 5 is used. The SEMGdi sampling rate is 2560 Hz, using a straight template with all 0 s and a length of 7.
2.4.3ECG subtractor
Pieces of literature pointed out [11, 12] that the ECG signal and the diaphragm muscle signal are signals from different sources and are relatively independent. The collected diaphragm muscle signal is the superposition of the ECG signal and the diaphragm muscle signal. Therefore, to remove the ECG interference of the EMGdi ECG segment, only the components of the ECG segment need to be extracted and then subtracted from the original signal. This paper uses the mathematical morphology method to fit the ECG signal in the ECG segment, and the final signal output rule is shown in Eq. (4).
(4)
The diaphragm component EMGdi_od in the ECG segment can be obtained by subtracting EMGdi_raw and Md in the ECG segment. Since many low-frequency components of EMGdi are also removed when the method removes the ECG components, the subtraction signal needs to be amplified in the end.
2.5Evaluation of performance
Verification of the effect of each filtering method in filtering out ECG is mainly carried out from two aspects of frequency domain and time domain visual evaluation. Power spectral density (PSD) is a quantitative method for describing EMG signals. We cannot get the actual diaphragm EMG signal without ECG interference for the actual signal, so we cannot calculate the proper signal-to-noise ratio and relative error. Power spectral analysis (PSD) of diaphragm signals, such as total power, median frequency, and standard deviation, can measure the algorithm’s performance [5, 6, 22]. The median frequency is the main index used to evaluate electromyographic fatigue [21, 25].
Although the ECG signal and the diaphragm signal in EMGdi have spectral overlap, in the main frequency band, the diaphragm signal is in the high-frequency band (30–400 Hz). The ECG signal is in the low-frequency band (10–100 Hz), so the high and low power ratio can be approximated by Describing the signal-to-noise ratio. In this paper, we use: 1) visual judgment in the time domain and frequency, 2) power spectral density analysis (high-low power ratio and median frequency) to quantify algorithm performance, respectively.
Because the main bandwidth of ECG is 10–50 Hz, and the main bandwidth of diaphragm is around 30–150 Hz, according to [21, 26], there is a high-low power spectral density ratio (PSDR) defined as:
(5)
set
(6)
3.Results
3.1Clinical data
Figure 3.
Time-domain and frequency-domain visual effects after EMG processing. (a) and (c) are the time-domain and frequency-domain effects of the same EMGdi_clinic processing, corresponding to C1 subjects in Table 1; (b) and (d) are the time-domain and frequency-domain effects after the same SEMGdi processing, corresponding to the s1 subjects in Table 2.
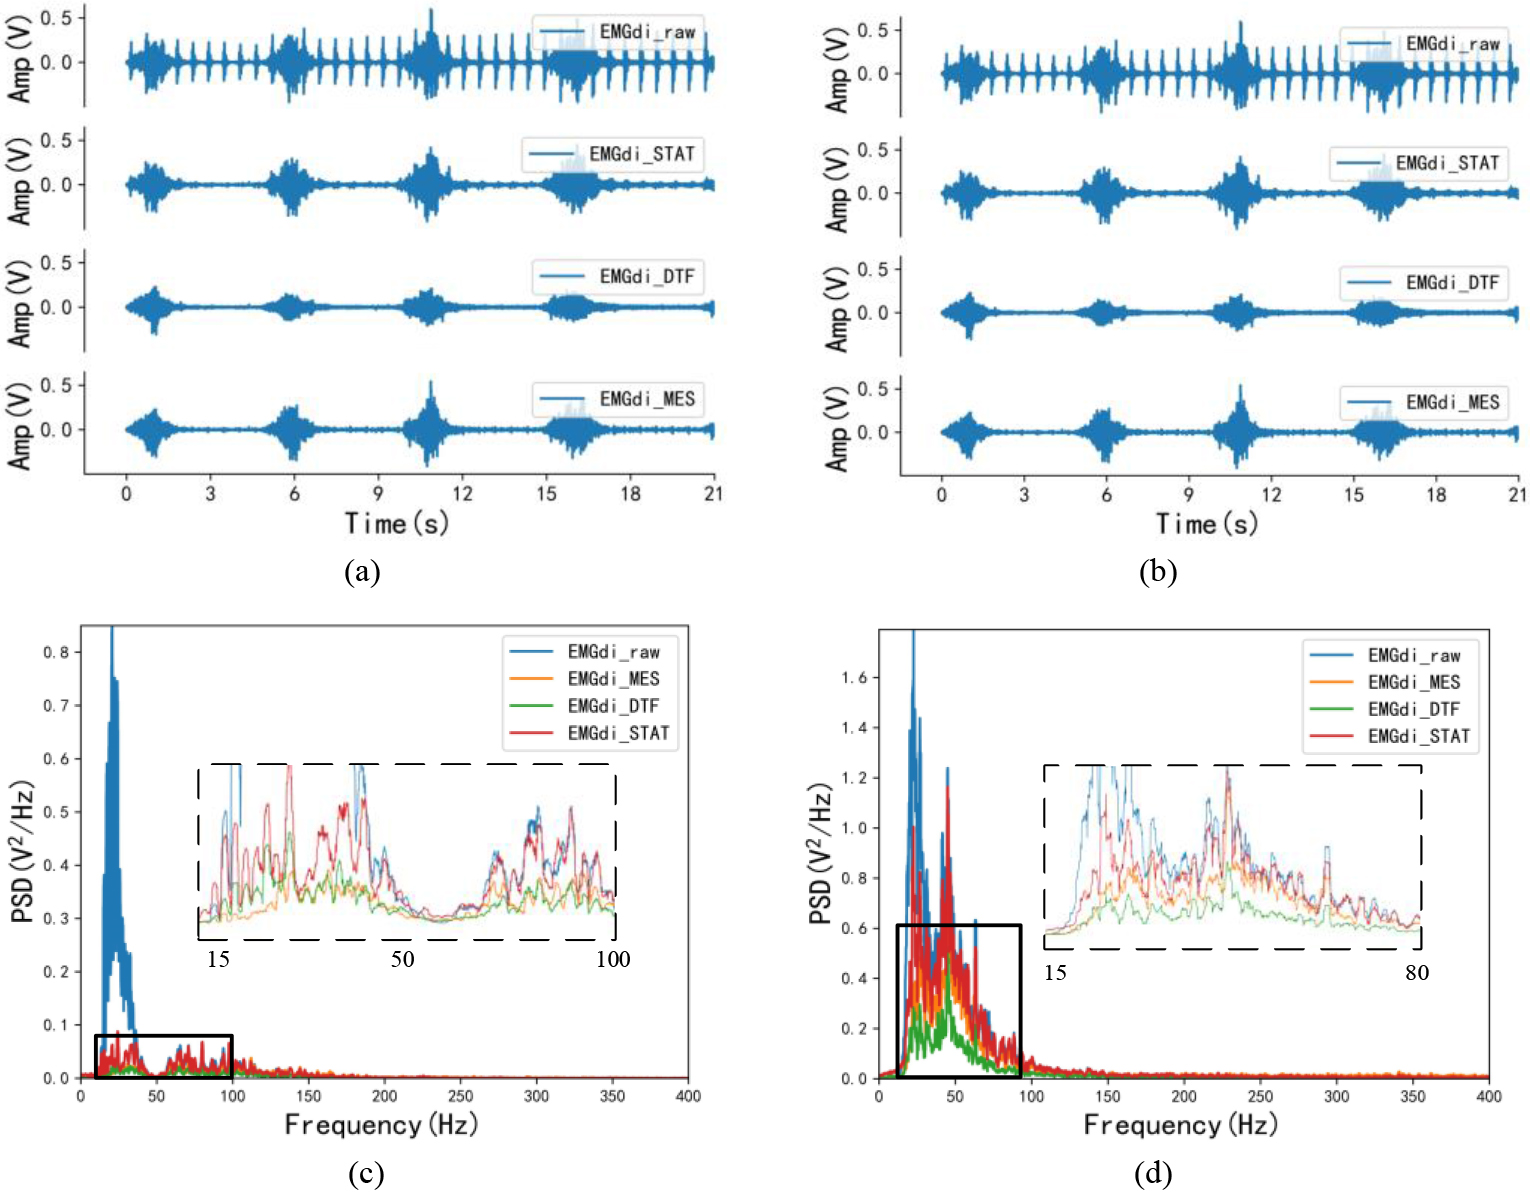
Figures 3a and c show the visual differences in the time and frequency do-mains of the signals from clinical subjects after processing by the morphological attenuator, wavelet-based dual-threshold filter (DFT), and stationary wavelet filter (STAT), respectively. In the time domain, by comparing the processing effects of each different algorithm with the EMGdi_raw comparison, it can be found that EMGdi_DTF tends to attenuate the diaphragm amplitude. At the same time, the EMGdi_MES and EMGdi_STAT are better for EMGdi_raw amplitude retention than EMGdi_DTF. Also, based on comparing the spectral density of each signal, it can be seen that in the ECG band (20–30 Hz), EMGdi_MES has the lowest spectral density, followed by EMGdi_DTF, while EMGdi_STAT is the highest. Moreover, in the main bandwidth of the diaphragm signal (30–150 Hz), EMGdi_STAT has a higher spectral density than EMGdi_DTF and EMG_MES, and part of the spectrum has surpassed EMGdi_raw.
Table 1
The median frequency and power ratios of EMGdi_raw, EMGdi_STAT, EMGdi_DTF and EMGdi_MES of EMGdi_clinic. The median frequency and power ratios of EMGdi_raw, EMGdi_STAT, EMGdi_DTF and EMGdi_MES were statistically significant, and all pairwise comparisons were significant (
| Median frequency | ||||
|---|---|---|---|---|
| Subject | EMGdi_raw | EMGdi_STAT | EMGdi_DTF | EMGdi_MES |
| C1 | 33.976 | 53.635 | 44.792 | 74.629 |
| C2 | 32.641 | 54.674 | 35.905 | 73.739 |
| C3 | 26.558 | 40.801 | 38.872 | 59.644 |
| C4 | 29.377 | 39.614 | 42.656 | 63.056 |
| C5 | 30.861 | 38.427 | 39.466 | 58.012 |
| C6 | 23.516 | 46.929 | 44.407 | 52.955 |
| C7 | 22.997 | 48.997 | 36.516 | 56.380 |
| C8 | 22.329 | 29.507 | 34.184 | 80.638 |
| C9 | 24.407 | 54.748 | 48.576 | 76.157 |
| C10 | 22.700 | 47.493 | 50.086 | 98.691 |
| Mean | 26.936 | 45.482 | 41.546 | 69.390 |
| Power spectral density ratio | ||||
| Subject | EMGdi_raw | EMGdi_STAT | EMGdi_DTF | EMGdi_MES |
| C1 | 0.253 | 0.929 | 0.737 | 1.744 |
| C2 | 0.136 | 0.924 | 0.675 | 1.667 |
| C3 | 0.115 | 0.700 | 0.655 | 1.105 |
| C4 | 0.251 | 0.640 | 0.872 | 1.311 |
| C5 | 0.306 | 0.603 | 0.658 | 1.025 |
| C6 | 0.037 | 0.602 | 0.484 | 1.089 |
| C7 | 0.024 | 0.817 | 0.420 | 1.373 |
| C8 | 0.017 | 0.396 | 0.482 | 1.930 |
| C9 | 0.229 | 0.898 | 0.743 | 1.526 |
| C10 | 0.220 | 0.537 | 0.658 | 2.382 |
| Mean | 0.159 | 0.705 | 0.638 | 1.515 |
Abbreviations: EMGdi, diaphragm electromyogram; EMGdi_raw, processed EMGdi; EMGdi_STAT, EMGdi as processed with the Stationary Wavelet Filter; EMGdi_DTF, EMGdi as processed with the Dual Threshold Filter; EMGdi_MES, EMGdi as filtered with the Morphological ECG subtraction method.
The median frequency and power ratios of EMGdi_raw, EMGdi_STAT, EMGdi_DTF, and EMGdi_MES of EMGdi_clinic are described in Table 1. As can be seen from Table 1, the average median frequency of the EMGdi_raw signal is 26.936 Hz, the average median frequency of EMGdi_STAT is 45.482 Hz, the average median frequency of EMGdi_DTF is 41.546 Hz, and the average median frequency of EMGdi_MES signal is 69.390 Hz. In terms of power ratio, the average value of the power ratio of the EMGdi_raw signal is 0.159, the average value of the power ratio of the EMGdi_STAT signal is 0.705, the average value of the power ratio of the EMGdi_DTF signal is 0.638, and the average value of the power ratio of the EMGdi_MES signal is 1.515. Regardless of the visual or frequency domain features, compared with the EMGdi_raw signal, the above three can well retain high-frequency components and reduce low-frequency components.
3.2Surface EMG data
Ten surface diaphragm EMG signals (SEMGdi) were collected at the same time, and their visual and frequency domain features are shown in Fig. 3b and d and shown in Table 2.
Table 2
The median frequency and power ratio of EMGdi_raw, EMGdi_STAT, EMGdi_DTF and EMGdi_MES of SEMGdi_para. The median frequency and power spectral density ratio of EMGdi_raw, EMGdi_STAT, EMGdi_DTF and EMGdi_MES were statistically significant, and all pairwise comparisons were significant (
| Median frequency | ||||
|---|---|---|---|---|
| Subject | EMGdi_raw | EMGdi_STAT | EMGdi_DTF | EMGdi_MES |
| S1 | 29.108 | 34.972 | 35.218 | 42.802 |
| S2 | 20.857 | 43.996 | 56.952 | 73.315 |
| S3 | 21.454 | 42.872 | 48.279 | 70.997 |
| S4 | 27.633 | 43.855 | 55.548 | 67.591 |
| S5 | 18.469 | 40.836 | 43.504 | 49.579 |
| S6 | 21.067 | 63.413 | 74.719 | 85.358 |
| S7 | 19.031 | 41.713 | 47.472 | 67.381 |
| S8 | 18.294 | 48.806 | 50.948 | 80.618 |
| S9 | 21.313 | 33.743 | 34.902 | 43.504 |
| S10 | 19.909 | 79.459 | 99.965 | 120.646 |
| Mean | 21.713 | 47.367 | 54.751 | 70.179 |
| Power spectral density ratio | ||||
| Subject | EMGdi_raw | EMGdi_STAT | EMGdi_DTF | EMGdi_MES |
| S1 | 0.273 | 0.404 | 0.417 | 0.626 |
| S2 | 0.269 | 0.753 | 1.104 | 1.518 |
| S3 | 0.315 | 0.748 | 0.953 | 1.529 |
| S4 | 0.548 | 0.744 | 1.117 | 1.474 |
| S5 | 0.127 | 0.652 | 0.8 | 0.984 |
| S6 | 0.289 | 1.173 | 1.628 | 2.028 |
| S7 | 0.228 | 0.683 | 0.922 | 1.362 |
| S8 | 0.171 | 0.842 | 0.998 | 1.749 |
| S9 | 0.172 | 0.592 | 0.695 | 0.867 |
| S10 | 0.184 | 1.502 | 1.999 | 3.028 |
| Mean | 0.258 | 0.809 | 1.063 | 1.516 |
In Fig. 3b, the diaphragm amplitude of EMGdi_MES is closer to that of EMGdi_raw relative to EMGdi_STAT and EMGdi_DTF. According to the PSD in Fig. 3d, the problems in EMGdi_clinic processing (in the main frequency band of ECG signal, the spectral density of EMGdi_MES is the lowest. In the frequency band of diaphragm muscle electromyography, the spectral density of EM From Table 2, the average median frequency of EMGdi_raw is 21.713 Hz. After processing, the median frequencies of EMGdi_STAT, EMGdi_DTF, and EMGdi_MES are all improved, respectively 47.367 Hz, 54.751 Hz and 70.179 Hz. The average value of the power ratio is 0.258 for EMGdi_raw, 0.809 for EMGdi_STAT, 1.516 for EMGdi_MES, and 1.063 for EMGdi_DTF after processing. It can be seen that STAT, DTF, and MES methods all have good performance for EMGdi_clinic and SEMGdi_para.
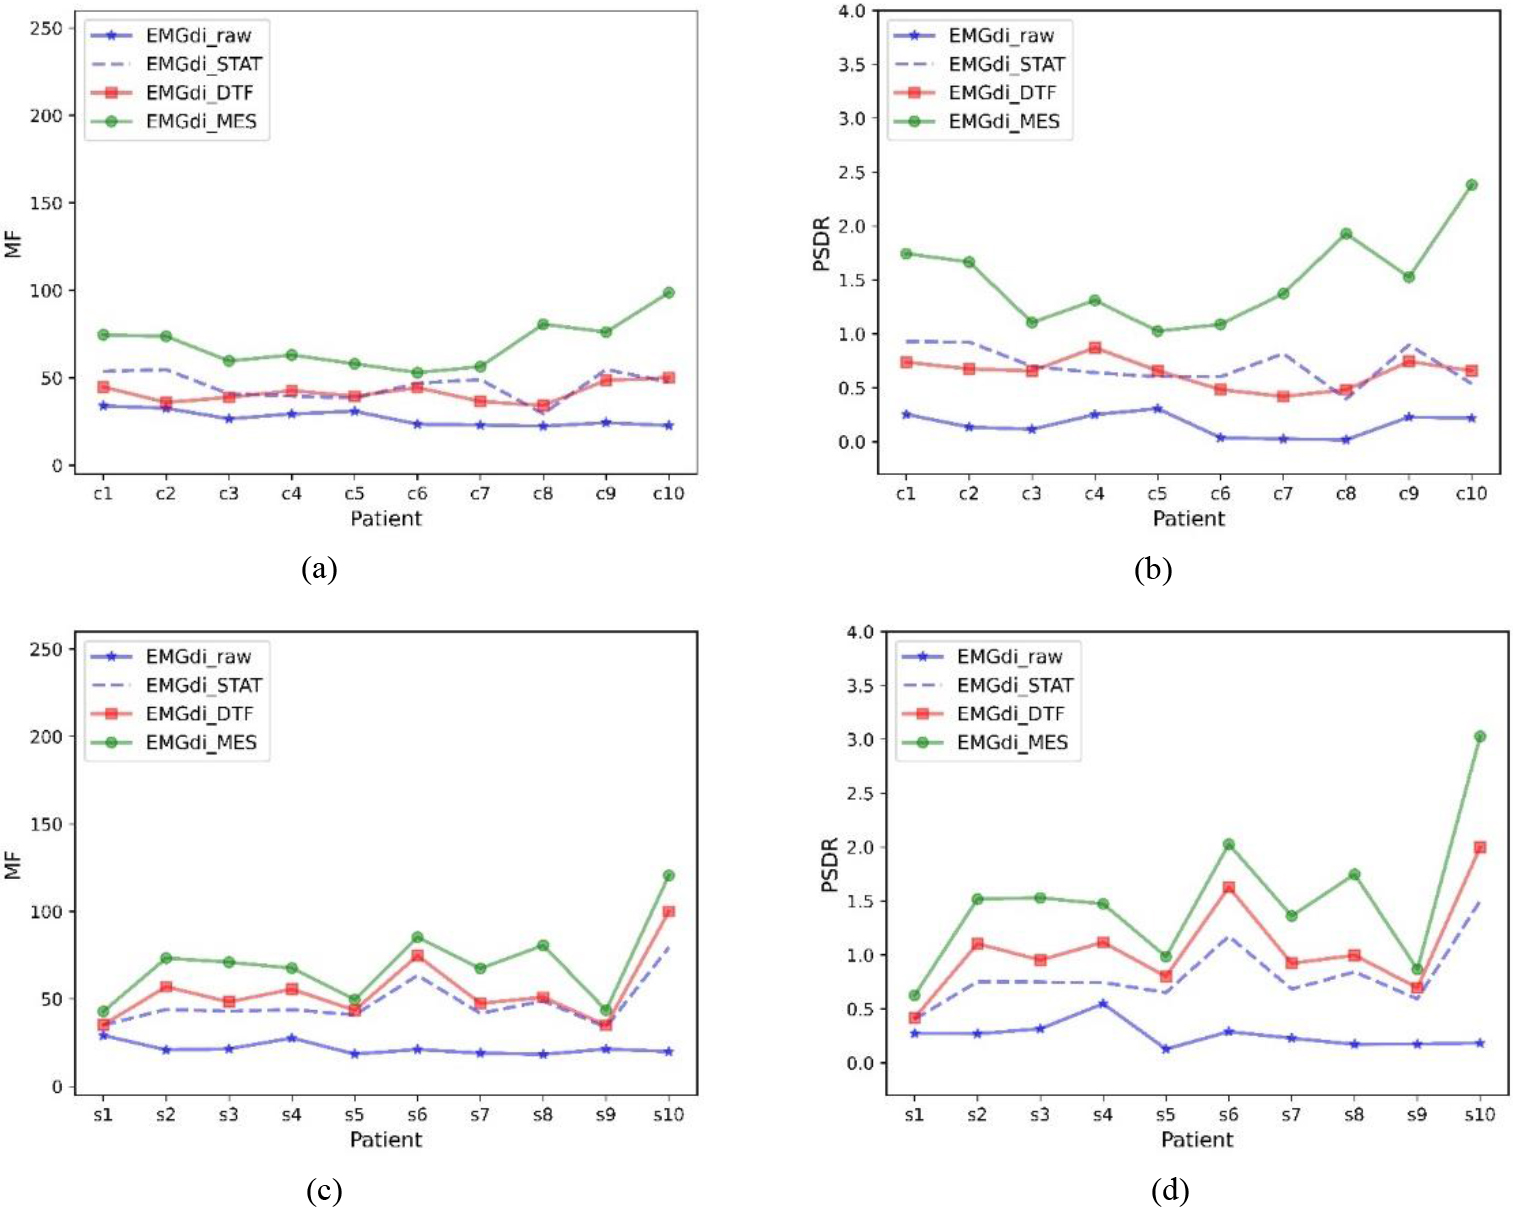
Figure 4 shows the MF and PSDR trends for the data of all subjects under different processing methods, respectively. In general, EMGdi_STAT, EMGdi_DTF, and EMGdi_MES can improve the median frequency and power ratio of EMGdi_raw, and usually, EMGdi_MES improves more significantly than EMGdi_DTF and EMGdi_STAT. The power ratios and median frequencies of EMGdi_STAT, EMGdi_MES, and EMGdi_DTF during calm breathing were compared with those of EMGdi_raw, which were statistically significant; both comparisons were significant (
Figure 4.
Median frequency and power ratios for different subjects. Median frequency (MF) and power ratio (PSDR) of EMGdi_raw, EMGdi_STAT, EMGdi_DTF, and EMGdi_MES with different data included. (a) and (b) are clinically collected data, (c) and (d) are laboratory-collected data.
4.Discussion
We propose a method for removing ECG noise in EMGdi. We use the method proposed in this paper to quantify the processing performance by comparing the visual and frequency domain features with the wavelet-based dual-threshold filter [20] and the stationary wavelet filter [22]. The experimental results show that this method is effective for the data of patients with dyspnea collected by the esophagus and effective for the data of healthy people collected by SEMGdi.
Although the ECG signal in EMGdi_raw has spectral overlap with the diaphragm muscle signal, the diaphragm muscle (EMGdi) signal is mainly in the high-frequency band (30–150 hz), and the ECG signal is primarily in the low-frequency band (10–50 hz). The extent to which the algorithm removes ECG interference can be illustrated by comparing the data’s power ratio and median frequency trend before and after processing. Generally speaking, if these values increase after processing, it can indicate that the signal in the EMGdi band has increased while the signal in the ECG band has decreased. Thus demonstrating the performance in removing ECG interference. In Tables 1 and 2, and Fig. 4, it can be seen that relative to EMGdi_raw, the power ratio and median frequency of each signal have increased. This shows that the STAT, MES, and DTF methods have specific effects on removing ECG signals. Moreover, it can be seen in Tables 1 and 2, and Fig. 4 that EMGdi_MES has the highest power ratio and median frequency, which also shows that EMGdi_MES has the best performance.
As seen in Fig. 3c and d, the spectral density of EMGdi_MES is lowest in the ECG-only band (20–30 Hz). In the frequency band of EMGdi, the spectral density of EMGdi_STAT is closest to EMGdi_raw, followed by EMGdi_MES. However, in some frequency bands, the spectral density of EMGdi_STAT exceeds that of EMGdi_raw. This shows that the STAT method introduces a particular distortion when processing the signal and finally makes the processed signal different from the original signal. After processing, signal distortion should be avoided by signal processing algorithms. In Fig. 3a and b, visually, EMGdi_STAT, EMGdi_DTF, and EMGdi_MES all have a good removal effect on ECG. Compared with EMGdi_raw, EMGdi_DTF will make an inevitable reduction of non-ECG fragments. In connection with the distribution and visual effects of PSD, it can well explain that the MES method can retain EMGdi while removing ECG interference, while the STAT and DTF methods could be better.
Whether it is EMGdi_clinic or SEMGdi, EMGdi_DTF will make an inevitable re-duction in non-ECG fragments. These two wavelet filters first locate the ECG, and then process the ECG segment. When processing the ECG segment, fills the ECG segment with the average energy before and after the ECG. The effect of this algorithm depends on the ECG location and the thresholds before and after filling. Although this filling can make the filled ECG segment more in line with the actual breathing situation to a certain extent, it also increases unnecessary time delay and calculation amount, so this method has certain limitations for engineering applications. The MES method pro-posed also locates the ECG segment first and then traverses the ECG segment through a template with ECG characteristics. (This process is essentially a low-pass filter, which is consistent with the spectral distribution of the ECG signal and the EMGdi.). Finally, the result of the traversal is used as an ECG segment. This method does not require the additional power calculation before and after the ECG segment and fills the ECG segment, reducing unnecessary delay. At the same time, since the frequency domain of EMGdi is more concentrated in the high-frequency part (30–400Hz), after the template traverses the ECG segment, the information of EMGdi can be retained, and the sudden change of ECG can be filtered out. Finally, this study first extracted the ECG signal through a 20–50 Hz band-pass filter. Then the extracted ECG signal was squared to widen the gap between the ECG signal and the residual diaphragm signal, making it more convenient to use the threshold value. The electrocardiographic signal is located, and the accuracy of ECG location can be improved.
In Fig. 3a, the EMGdi_MES signal in the central electrical segment during the expiratory phase has more protrusions in the same area than the EMGdi_DFT and EMGdi_STAT. The template’s width cannot keep up with the speed of data change when the template is selected, leaving inherent ECG residues. In the next step of re-search, it is necessary to study how to adapt the template function to the shape of the ECG so that the algorithm can be better and more general.
5.Conclusions
In conclusion, we propose a morphological ECG subtraction method, which can effectively remove ECG interference from EMGdi signals. At the same time, the morphological ECG subtraction method can deal with the EMGdi of the esophagus and the SEMGdi, which has better generality. Compared with the wavelet-based dual-threshold filter, the morphological ECG subtraction method is more effective in removing ECG signals. It is more helpful to improve the monitoring of respiratory drive and respiratory control in clinical practice.
Acknowledgments
This work was supported by the Science and Technology Program of Guangzhou (No. 202002030353, No. 2019050001), the Science and Technology Planning Project of Guangdong Province (No. 2019A1515011940), and the Industry-Academia-Research Innovation Project of Blue-Fire of Ministry of Education (No. CXZJHZ201803).
Conflict of interest
The authors declare that there are no conficts of interest.
References
[1] | WHO Action Plan for the Global Strategy for the Prevention and Control of Noncommunicable Diseases The Six Objectives of the 2008–2013. Geneva World Heal. Organ. (2008) ; (1): 48. |
[2] | World Health Organization [homepage on the Internet]. Chronic Respiratory Diseases (Asthma, COPD) [cited 2022 Dec 12] Available from: https://www.who.int/westernpacific/health-topics/chronic-respiratory-diseases. |
[3] | Jolley CJ, Luo YM, Steier J, Reilly C, Seymour J, Lunt A, et al. Neural respiratory drive in healthy subjects and in COPD. Eur. Respir. J. (2009) ; 33: (2): 289–297. doi: 10.1183/09031936.00093408. |
[4] | Domnik NJ, Walsted ES, Langer D. Clinical utility of measuring inspiratory neural drive during cardiopulmonary exercise testing (CPET). Front. Med. (2020) ; 7: (9): 1–12. doi: 10.3389/fmed.2020.00483. |
[5] | Zhan C, Yeung LF, Yang Z. A Wavelet-Based Adaptive Filter for Removing ECG Interference in EMGdi Signals. J. Electromyogr. Kinesiol. (2010) ; 20: (3): 542–549. doi: 10.1016/j.jelekin.2009.07.007. |
[6] | van Leuteren RW, Hutten GJ, de Waal CG, Dixon P, van Kaam AH, de Jongh FH. Processing transcutaneous electromyography measurements of respiratory muscles, a review of analysis techniques. J. Electromyogr. Kinesiol. (2019) ; 48: (7): 176–186. doi: 10.1016/j.jelekin.2019.07.014. |
[7] | Ràfols-De-Urquía M, Estrada L, Estévez-Piorno J, Sarlabous L, Jané R, Torres A. Evaluation of a wearable device to determine cardiorespiratory parameters from surface diaphragm electromyography. IEEE J. Biomed. Heal. Informatics. (2019) ; 23: (5): 1964–1971. doi: 10.1109/JBHI.2018.2885138. |
[8] | Jolley CJ, Luo YM, Steier J, Reilly C, Seymour J, Lunt A, et al. Neural respiratory drive in healthy subjects and in COPD. Eur. Respir. J. (2009) ; 33: (2): 289–297. doi: 10.1183/09031936.00093408. |
[9] | Estrada L, Torres A, Sarlabous L, Jane R. Onset and offset estimation of the neural inspiratory time in surface diaphragm electromyography: A pilot study in healthy subjects. IEEE J. Biomed. Heal. Informatics. (2018) ; 22: (1): 67–76. doi: 10.1109/JBHI.2017.2672800. |
[10] | Sarlabous L, Torres A, Fiz JA, Jané R. Evidence towards improved estimation of respiratory muscle effort from diaphragm mechanomyographic signals with cardiac vibration interference using sample entropy with fixed tolerance values. PLoS One. (2014) ; 9: (2). doi: 10.1371/journal.pone.0088902. |
[11] | Deng Y, Wolf W, Schnell R, Appel U. New aspects to event-synchronous cancellation of ECG interference: An application of the method in diaphragmatic EMG signals. IEEE Trans. Biomed. Eng. (2000) ; 47: (9): 1177–1184. doi: 10.1109/10.867924. |
[12] | Jonkman AH, Juffermans R, Doorduin J, Heunks LMA, Harlaar J. Estimated ECG Subtraction Method for Removing ECG Artifacts in Esophageal Recordings of Diaphragm EMG. Biomed. Signal Process. Control. (2021) ; 69: (1): 102861. doi: 10.1016/j.bspc.2021.102861. |
[13] | Luo G, Qiu P, Huang W, Huang L. Applying stationary wavelet transform for locating and cancelling electrocardiogram interference interval in diaphragmatic electromyography. ISPCE-CN 2018 – IEEE Int. Symp. Prod. Compliance Eng. – Asia (2018) ; 1–5. doi: 10.1109/ISPCE-CN.2018.8805814. |
[14] | Costa Junior JD, de Seixas JM, Miranda de Sá AMFL. A Template Subtraction Method for Reducing Electrocardiographic Artifacts in EMG Signals of Low Intensity. Biomed. Signal Process. Control (2019) ; 47380–386. doi: 10.1016/j.bspc.2018.09.004. |
[15] | Lu Y, Xian Y, Chen J, Zheng Z. A Comparative Study to Extract the Diaphragmatic Electromyogram Signal. Biomed. Eng. Informatics New Dev. Futur. – Proc. 1st Int. Conf. Biomed. Eng. Informatics, BMEI 2008. (2008) . pp. 2315–319. doi: 10.1109/BMEI.2008.77. |
[16] | von Tscharner V, Eskofier B, Federolf P. Removal of the Electrocardiogram Signal from Surface EMG Recordings Using Non-Linearly Scaled Wavelets. J. Electromyogr. Kinesiol. (2011) ; 21: (4): 683–688. doi: 10.1016/j.jelekin.2011.03.004. |
[17] | Wu FY, Tong F, Yang Z. EMGdi Signal Enhancement Based on ICA Decomposition and Wavelet Transform. Appl. Soft Comput. J. (2016) ; 43: (12): 561–571. doi: 10.1016/j.asoc.2016.03.002. |
[18] | Zhang J, Luo Q, Zhang H, Chen R. Physiological significance of well-tolerated inspiratory pressure to chronic obstructive pulmonary disease patient with hypercapnia during noninvasive pressure support ventilation. COPD J. Chronic Obstr. Pulm. Dis. (2016) ; 13: (6): 734–740. doi: 10.1080/15412555.2016.1196658. |
[19] | Zhang J, Luo Q, Chen R. Patient-Ventilator Interaction with Noninvasive Proportional Assist Ventilation in Subjects with COPD. Respir. Care. (2020) ; 65: (1): 45–52. doi: 10.4187/respcare.06430. |
[20] | Li S, Li Z, Zhang J, Zhang H. A Denoising Method of Diaphragm Electromyogram Signals Based on Dual-Threshold Filter. J. Mech. Med. Biol. 2022; 22: 14. doi: 10.1142/s0219519422400097. LI S, LI Z, ZHANG J, ZHANG H. A Denoising Method of Diaphragm Electromyogram Signals Based on Dual-Threshold Filter. J. Mech. Med. Biol. 2022; 22: 14. doi: 10.1142/s0219519422400097. |
[21] | Corvini G, D’Anna C, Conforto S. Estimation of Mean and Median Frequency from Synthetic SEMG Signals: Effects of Different Spectral Shapes and Noise on Estimation Methods. Biomed. Signal Process. Control. (2022) ; 73: (8): 103420. doi: 10.1016/j.bspc.2021.103420. |
[22] | Gu X, Ren S, Shi Y, Li X, Guo Z, Zhao X, et al. Evaluation of Correlation Between Surface Diaphragm Electromyography and Airflow Using Fixed Sample Entropy in Healthy Subjects. IEEE Trans. Neural Syst. Rehabil. Eng. (2022) ; 30238–250. doi: 10.1109/TNSRE.2022.3144412. |
[23] | Köhler BU, Hennig C, Orglmeister R. The Principles of Software QRS Detection. IEEE Eng. Med. Biol. Mag. (2002) ; 21: (1): 42–57. doi: 10.1109/51.993193. |
[24] | Chen WD, Li X, Liu J, Hao YY, Liao YX, Su Y, et al. Mathematical Morphology Based Electro-Oculography Recognition Algorithm for Human-Computer Interaction. (2012) ; 45: (4): 644. doi: 10.3785/j.issn.1008-973X.2011.04.009. |
[25] | Shair EF, Ahmad SA, Marhaban MH, Tamrin SBM, Abdullah AR. EMG Processing Based Measures of Fatigue Assessment during Manual Lifting. Biomed Res. Int. (2017) ; 2017. doi: 10.1155/2017/3937254. |
[26] | Beck J, Sinderby C, Lindström L, Grassino A. Diaphragm Interference Pattern EMG and Compound Muscle Action Potentials: Effects of Chest Wall Configuration. J. Appl. Physiol. (1997) ; 82: (2): 520–530. doi: 10.1152/jappl.1997.82.2.520. |


