
Identification of driving genes of familial adenomatous polyposis by differential gene expression analysis and weighted gene co-expression network analysis
Abstract
BACKGROUND:
Despite the advancement of new screening strategies and the advances in pharmacological therapies, the cancerization rates of familial adenomatous polyposis (FAP) are stable and even increased in the last years. Therefore, it necessitates additional research to characterize and understand the underlying mechanisms of FAP.
OBJECTIVE:
To determine the genes that drive the pathogenesis of familial adenomatous polyposis (FAP).
METHODS:
We performed on a cohort (GSE111156) gene profile, which consist of four group of gene expressions (the gene expressions of cancer, adenoma and normal tissue of duodenal cancer from patients with FAP were defined as Case N, Case A and Case C respectively, while that of adenoma tissue from patients with FAP who did not have duodenal cancer was Ctrl A). Tracking Tumor Immunophenotype (TIP) website was applied to reveal immune infiltration profile and signature genes of FAP. We merged the genes of key module (pink and midnight module) with signature genes to obtained the biomarkers related with FAP pathogenesis. The expression of these five biomarkers in FAP intratumoral region (IT) and tumor rim (TR) was detected with Quantitative Real-Time Polymerase Chain Reaction (qRT-PCR).
RESULTS:
In total, 220, 23 and 63 DEGs were determined in Cases C, A and N, in comparison to Ctrl A. In total, 196 and 10 DEGs were determined in Cases C and A, separately, as compared to Case N. A total of four biomarkers including CCL5, CD3G, CD2 and TLR3 were finally identified associated with pink module, while only one biomarker (KLF2) associated with midnight module was identified. All biomarkers were evidently raised in FAP IT tissues utilizing qRT-PCR.
CONCLUSION:
We identified five potential biomarkers for pathogenesis of FAP to understand the fundamental mechanisms of FAP progression and revealed some probable targets for the diagnosis or treatment of FAP.
1.Introduction
Familial adenomatous polyposis (FAP) is an autosomal dominant disorder resulting from mutations in the adenomatous polyposis coli (APC) gene [1, 2]. FAP is the most common intestinal polyposis [3], and the most prominent feature is multiple adenomatous polyposis of the digestive tract which frequently leads to obstruction, gastrointestinal bleeding as well as other complications [4]. Polyposis can also develop into colorectal cancer and directly endanger human life and health [5]. Despite the advancement of new screening strategies and the advances in pharmacological therapies, the cancerization rates of FAP are stable and even increased in the last years. Therefore, it necessitates additional research to characterize and understand the underlying mechanisms of FAP.
Over 1500 mutations have been detected in the attenuated and classical families of FAP. Well over 60% of the proteins with these mutations are mapped to a region known as the mutation cluster region (MCR) that is situated in exon 15 [6, 7]. At present, there is no radical cure method for polyp, and surgical removal of polyp is still the main method. Surgery is the main treatment for FAP patients and is designed to reduce cancer risk while achieving good functional outcomes. Total abdominal colectomy plus ileorectal anastomosis (IRA) and total colorectal resection plus IPAA are the two currently selected sphincter-preserving methods. IRA is a less technically difficult procedure that is linked to better functional results and improved quality of life [8]. The preservation of the rectal reservoir improves its function. A limitation of IRA is the cancer risk of the preserved rectum. The ileal pouch-anal anastomosis (IPAA) is a procedure that is more technically demanding, that can lead to more nighttime defecation, nighttime fecal contamination, and potential sexual dysfunction and/or infertility [9, 10]. IPAA also carries a higher risk of permanent ileostomy if there are complications of anastomotic leakage or poor bag function [11].
The typical phenotype of FAP disease is marked by hundreds to thousands of colorectal adenomas and is not difficult to identify. In contrast, clinical management of FAP may present difficulties in treatment and monitoring due to the high penetrance of APC mutations, the large spectrum of possible extra-colonic manifestations, and the form of genetic transmission. The FAP biomarkers were mainly identified in the presence of adenoma and the detection of APC or MUTYH (one of base excision repair genes) germline mutations. Although the clinical characteristics of adenomas such as number and histology have a direct impact on diagnosis and treatment, APC or MUTYH mutations are primarily selected in high-risk subjects to respond to specific and intensive surveillance programs. However, in special cases, genetic testing can also have a big impact on treatment. Estrogen Receptor
Nevertheless, polyps frequently regenerate, at times in greater numbers, and can transform into CRC if left unrecognized or untreated. The 5-year OS rate for colorectal cancer transformed by FAP was estimated to be 54.4% [14]. This requires us to analyze and study more cancer-related genes of FAP as markers for treatment and diagnosis.
Nowadays, as high-throughput microarray technology has been advanced, the gene expression profile has been employed for determining the genes related to the oncogenesis and progress of FAP. The mechanism was partly explained via gene ontology (GO) analysis [15]. The metabolic differences between carcinoma and adenoma mean that the re-programming of metabolism, in particular carbohydrate metabolism, may act as an essential player in tumorigenesis and progress from adenoma to carcinoma [16]. The growing application of correlation networks in applications of bioinformatics benefits the network-based genetic screening approaches that could be applied for determining therapeutic targets or candidate biomarkers [17]. For instance, weighted gene co-expression network analysis (WGCNA) is a systems biology approach to characterize the patterns of correlation between genes in the microarray samples. WGCNA has strengths over differential expression analysis in finding highly related gene clusters (modules), recognizing hub genes within modules and linking modules to traits in external samples. Several researches have employed this approach to investigate the associations between clinical traits and gene clusters [18, 19]. Nevertheless, prior WGCNA researches have not been implemented for the analysis of the FAP differentially expressed gene expression. In this study, DEGs and immune infiltration signature genes were identified based on GEO dataset, and WGCNA was subsequently performed to screen the key module and hub gene. A total of five biomarkers were finally obtained, which may be related to the development of FAP, which laid a theoretical foundation for further research of new FAP target biomarkers.
2.Materials and methods
2.1Gene expression datasets and clinical pathological data
GSE111156, a microarray-based dataset, consists of 48 samples (https://www.ncbi.nlm.nih.gov/geo/query/acc.cgi?acc=GSE111156). In GSE111156 research, a genome-wide transcriptional analysis of the duodenal samples from patients with FAP was conducted to characterize the alterations that occur in the duodenal adenoma-carcinoma sequence in FAP. Duodenal samples from 12 patients with FAP who did not have duodenal cancer (controls) and 12 patients with FAP who were diagnosed with duodenal cancer from 1988 to 2014 (cases) were analyzed for gene expression. Extraction of RNA from archived cancer, adenoma as well as normal tissue from cases and from archived adenoma tissue from controls. Profiling and analysis of gene expression applying the Affymetrix Human Transcriptome Array 2.0. Three pairwise comparisons were implemented to characterize the adenoma-carcinoma sequence: normal-cancer (No-Ca), adenoma-cancer (Ad-Ca), and normal-adenoma (No-Ad). A total of 48 samples were evaluated, 12 from controls (adenoma) and 36 from cases (cancer, adenoma, normal).
2.2Identification of DEGs
DEGs was determined utilizing open-source software R language (Version 3.3.3, https://www.r-project.org/) together with R package of Bioconductor (http://www.bioconductor.org/) limma package [34, 35]. Screened DEGs at
2.3Construction of WGCNA
Co-expression networks of filtered genes were constructed through the usage of “WGCNA” R package [36, 37]. After assessment of the expression matrix assessed via the average method with the “hclust” function, the clustered genes of gene chips comprising GSM3024204, GSM3024195 and GSM3024196 were defined as biased and were therefore excluded from the further analysis (Fig. 1A). Other samples were applied for calculating the Pearson’s Correlation Matrices. Weighted adjacency matrices were calculated via the formula amn
2.4Identification of clinically significant module
The traits matrix contains Adenocarcinoma, Adenoma, Normal (case cancer, CaseC), and Control_ademoma 4 clinical traits. After the identification of modules, the module eigengene (ME) was concluded through the first principal component of the expression level of module. Module-trait correlations were estimated utilizing association between clinical traits and ME, which enabled efficient recognition of related modules. To assess the strength of correlation, we measured the module significance (MS), which is determined as the mean absolute gene significance (GS) of all genes that participated in the module [38]. GS was calculated as a log10 transformation of the
2.5Tumor immune cell infiltration analysis
The calculation functions for TIP were created in R [40, 41, 42]. The JavaScript, Struts2 and Bootstrap framework were employed to communicate between the web interfaces and R, which were subsequently implemented via JavaScript, and the table results were produced from DataTables. Additionally, bar, heat, scatter and pie plots were produced with HighCharts, while D3 powered box, line, circle and radar plots. The source code for https://github.com/dengchunyu/TIP. In general analysis, TIP receives four categories of expression data from Case tissue as input. One is RNA-seq expression data (TPM or raw counts), and the other is microarray expression data (non-log or log transformed). Phenotyping of tumor cell infiltration was carried out online with the usage of TIP domain (http://biocc.hrbmu.edu.cn/TIP) in accordance with the derived data GSE111156. The samples were divided into CtrlA: Control adenoma tissue; CaseN: case normal tissue; CaseA: case adenoma tissue and CaseC: case cancer tissue group. The analysis followed default parameters.
2.6Identification of TFs in the key module
Enrichr (http://amp.pharm.mssm.edu/Enrichr/) is a comprehensive tool based on the Web [43, 44]. Genetic information of key module was imported into Enrichr to capture the interaction between transcription factors (TFs) and the associated target genes. To minimize the possibility of detecting false positives, we only retrieved TFs from the ENCODE and ChEA gene-set libraries with consensus targets and identified
2.7Functional enrichment analysis
Enrichment analysis of GO [45] and KEGG [46] pathway utilizing clusterprofiler package in the R software (Version 3.3.3) [47] for investigating the underlying mechanism of DEGs, the genes in modules of interest, as well as a group of hub genes. FDR
2.8Quantitative Real-Time PCR (qRT-PCR)
Extraction of total RNA was performed from 12 pairs of FAP TR and IT tissues through TRIzol reagent (Invitrogen) and reverse transcribed to cDNA. The qRT-PCR was implemented on the ABI PRISM 7500 Real-Time PCR System (Applied Biosystems, Foster City, CA). Primers for CD2, CD3G, CCL5, KLF2 and TLR3 are presented in Table 2. GAPDH was served as the internal control. mRNAs relative expression levels were computed employing the 2 - ΔΔCT approach. All of the experiments were replicated a minimum of 3 times. Our research was authorized by the ethics committee of the First Affiliated Hospital of Kunming Medical University. All the patients provided written informed consent.
3.Results
3.1Identification of DEGs in FAP and their functional
The differential analysis was performed using GSE111156 data. By comparing case normal tissue (Case N) with control adenoma tissue (Ctrl A), it was possible to determine 63 differentially expressed genes (DEGs) in the sample tissues, of which 3 were raised and 60 were decreased (Table 1). By comparing case adenoma tissue (Case A) with Ctrl A, it was possible to determine the 23 DEGs in the sample tissues, of which 1 gene was raised and 22 were decreased. By comparing case cancer tissue (Case C) with Ctrl A, it was possible to determine 220 DEGs in the sample tissues, of which 44 genes were raised and 176 were decreased. By comparing Case A with Case N, it was possible to determine 10 DEGs in the sample tissues, of which 2 genes were raised and 8 were decreased. In contrast to Case N, 196 DEGs were identified in the samples from Case C, 136 of which were up-regulated and 60 were down-regulated. Then, the number of 20 DEGs were screened in Case C compared with Case A, of which 12 were raised and 8 were decreased.
Table 1
The differentially expressed genes in Familial Adenomatous Polyposis (FAP) under different condition
| Compared groups | Log2FC_Cutoff | FDR_Cutoff | All Gene_Num | Up Gene_Num | Down Gene_Num |
|---|---|---|---|---|---|
| CaseN VS CtrlA | 1 | 0.05 | 63 | 3 | 60 |
| CaseA VS CtrlA | 1 | 0.05 | 23 | 1 | 22 |
| CaseC VS CtrlA | 1 | 0.05 | 220 | 44 | 176 |
| CaseA VS CaseN | 1 | 0.05 | 10 | 2 | 8 |
| CaseC VS CaseN | 1 | 0.05 | 196 | 136 | 60 |
| CaseC VS CaseA | 1 | 0.05 | 20 | 12 | 8 |
Abbreviation: Ctrl A: Control adenoma tissue; CaseN: case normal tissue; CaseA: case adenoma tissue; CaseC: case cancer tissue.
Table 2
Primer information for qRT-PCR
| Genes | Primer sequence |
|---|---|
| CCL5 | 5’-CCCCATATTCCTCGGACAC-3’ (forward) |
| 5’-CACTTGGCGGTTCTTTCG-3’ (reverse) | |
| CD3G | 5’-GGAATCTGGGAAGTAATGCCAA-3’ (forward) |
| 5’-TCAATGCAGTTCTGACACATTCT-3’ (reverse) | |
| CD2 | 5’-CCCCATATTCCTCGGACAC-3’ (forward) |
| 5’-CACTTGGCGGTTCTTTCG-3’ (reverse) | |
| TLR3 | 5’-TTGCCTTGTATCTACTTTTGGGG-3’ (forward) |
| 5’-TCAACACTGTTATGTTTGTGGGT-3’ (reverse) | |
| KLF2 | 5’-TTCGGTCTCTTCGACGACG-3’ (forward) |
| 5’-TGCGAACTCTTGGTGTAGGTC-3’ (reverse) | |
| GAPDH | 5’-GGACCTGACCTGCCGTCTAG-3’ (forward) |
| 5’-GTAGCCCAGGATGCCCTTGA-3’ (reverse) |
Figure 1.
Sample clustering was conducted to detect outliers.
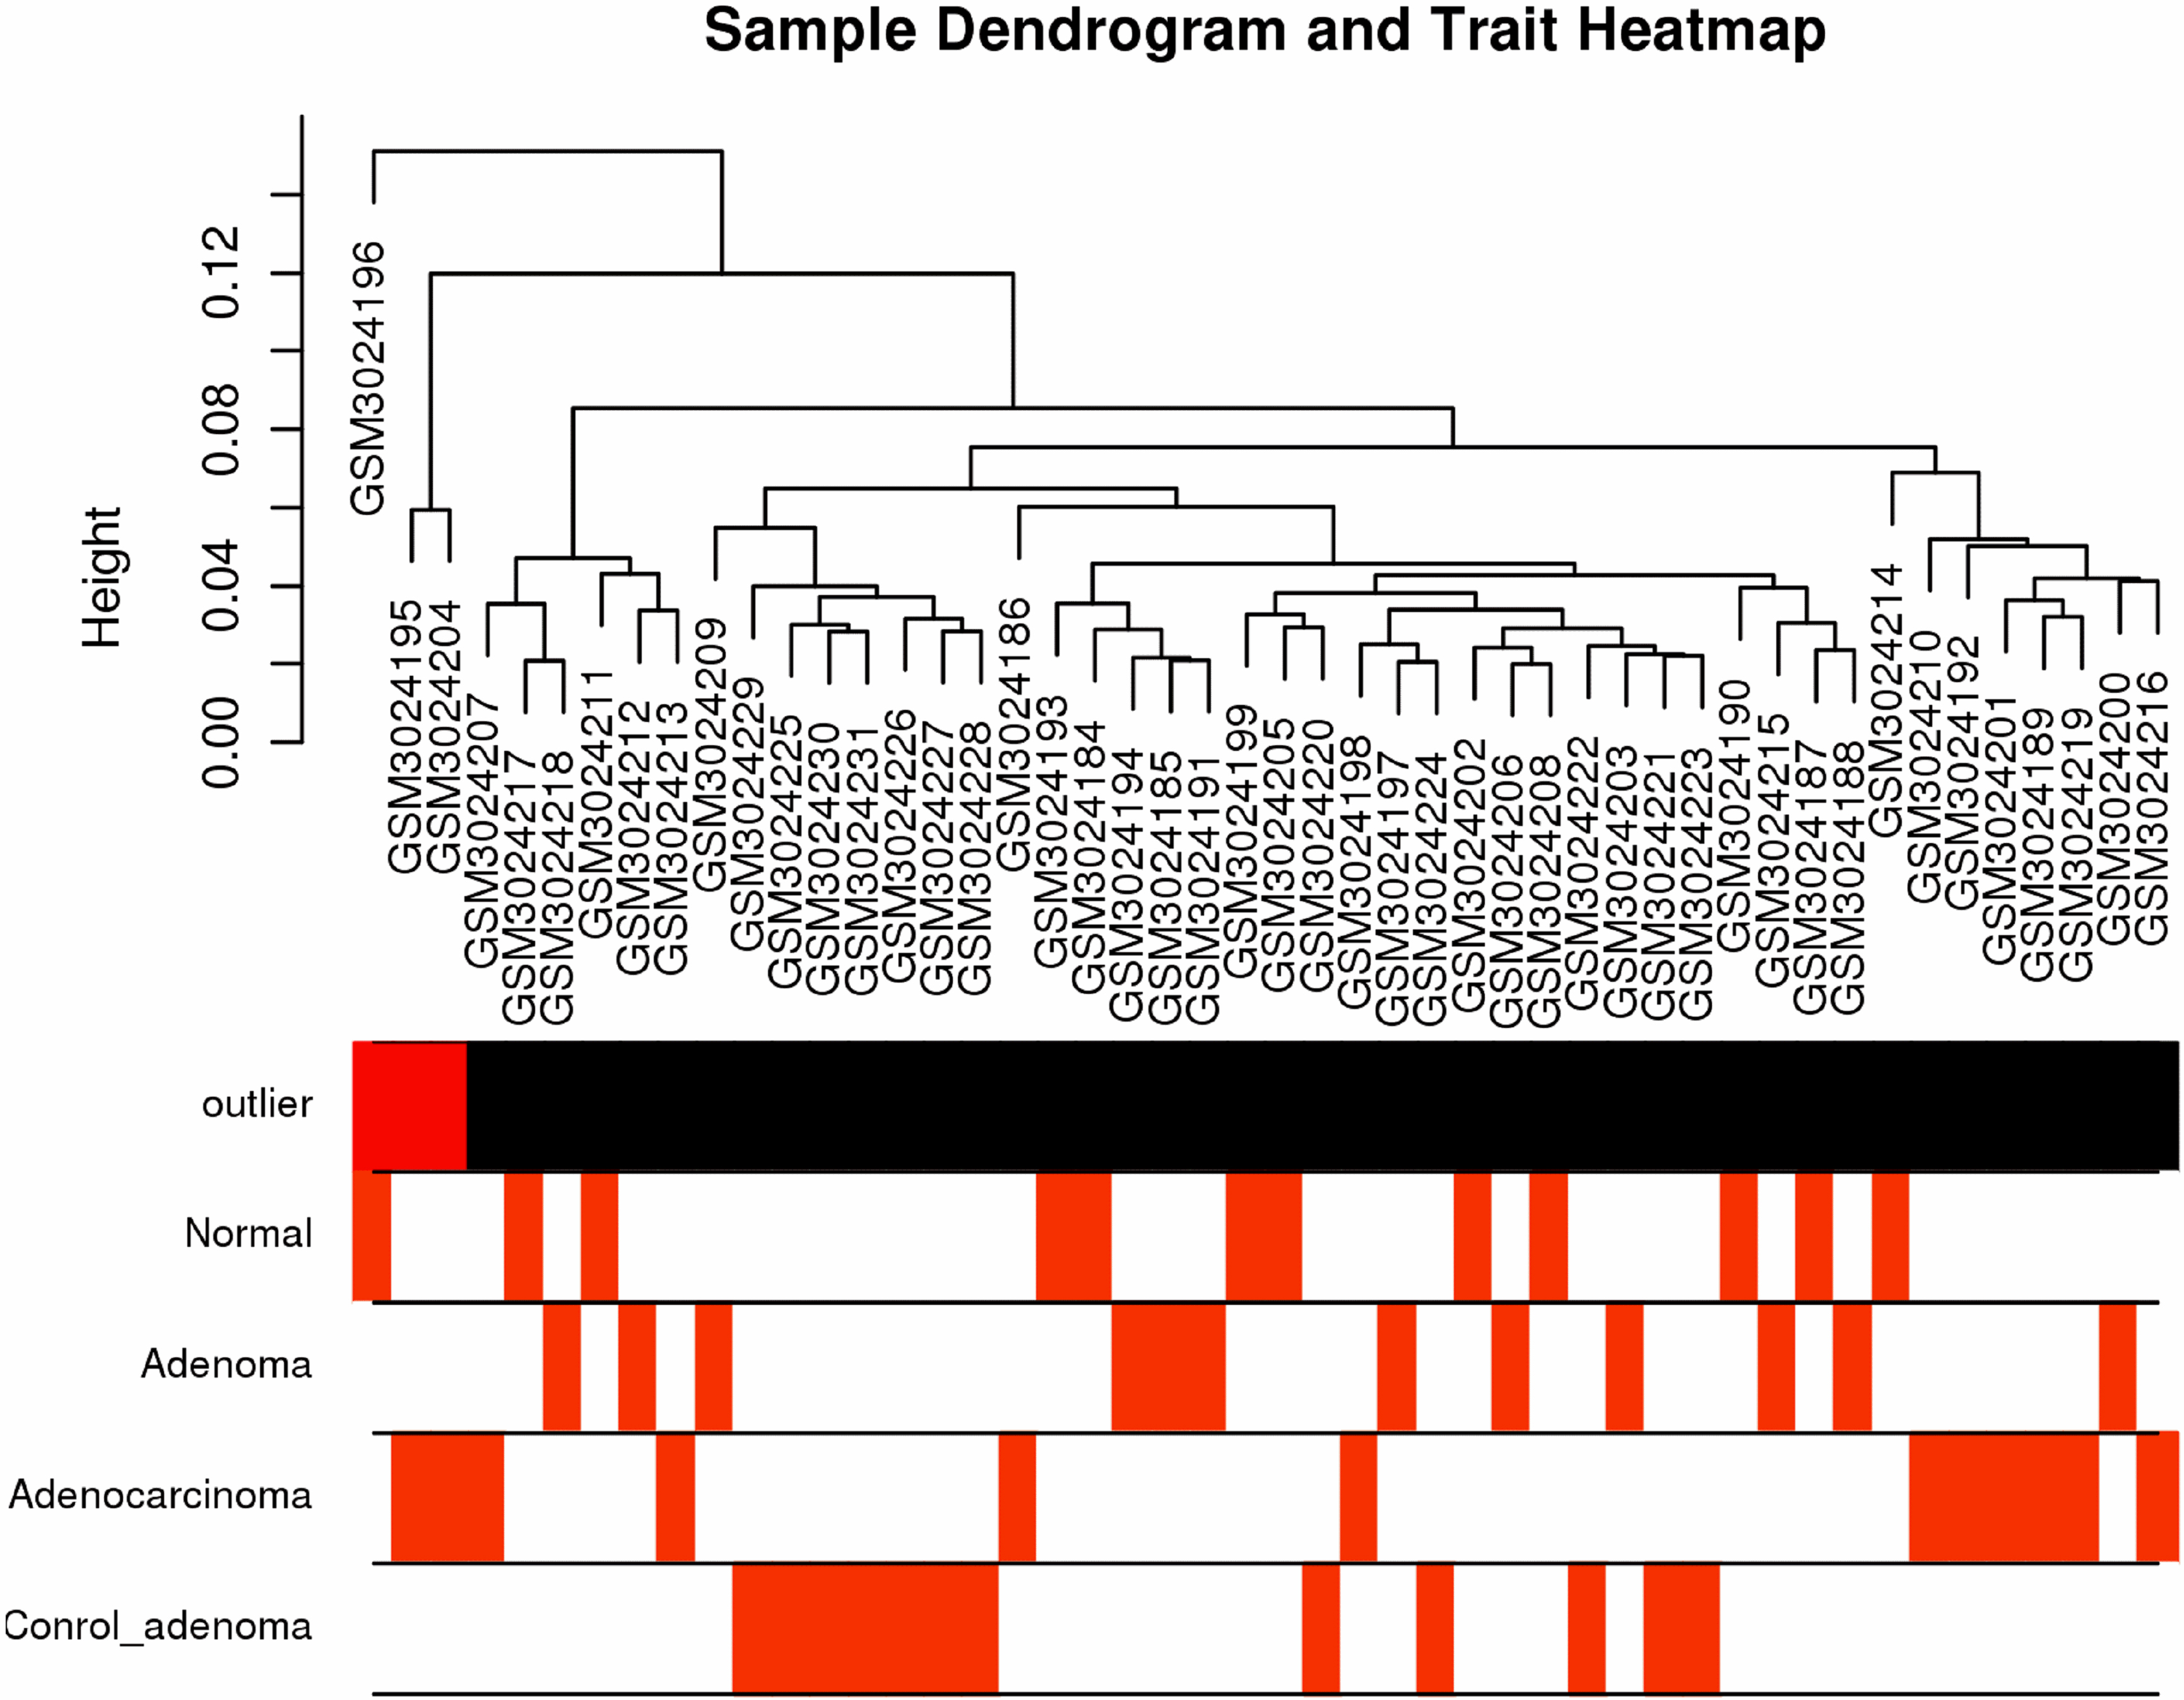
Figure 2.
The results of DEGs among different groups. (A) The volcano plot of DEGs in Case N vs Ctrl A. (B) The volcano plot of DEGs in Case A vs Ctrl A. (C) The volcano plot of DEGs in Case C vs Ctrl A. (D) The volcano plot of DEGs in Case A vs Case N. (E) The volcano plot of DEGs in Case C vs Case N. (F) The volcano plot of DEGs in Case C vs Case A. Red points indicate up-regulation genes, blue points indicate down-regulation genes.
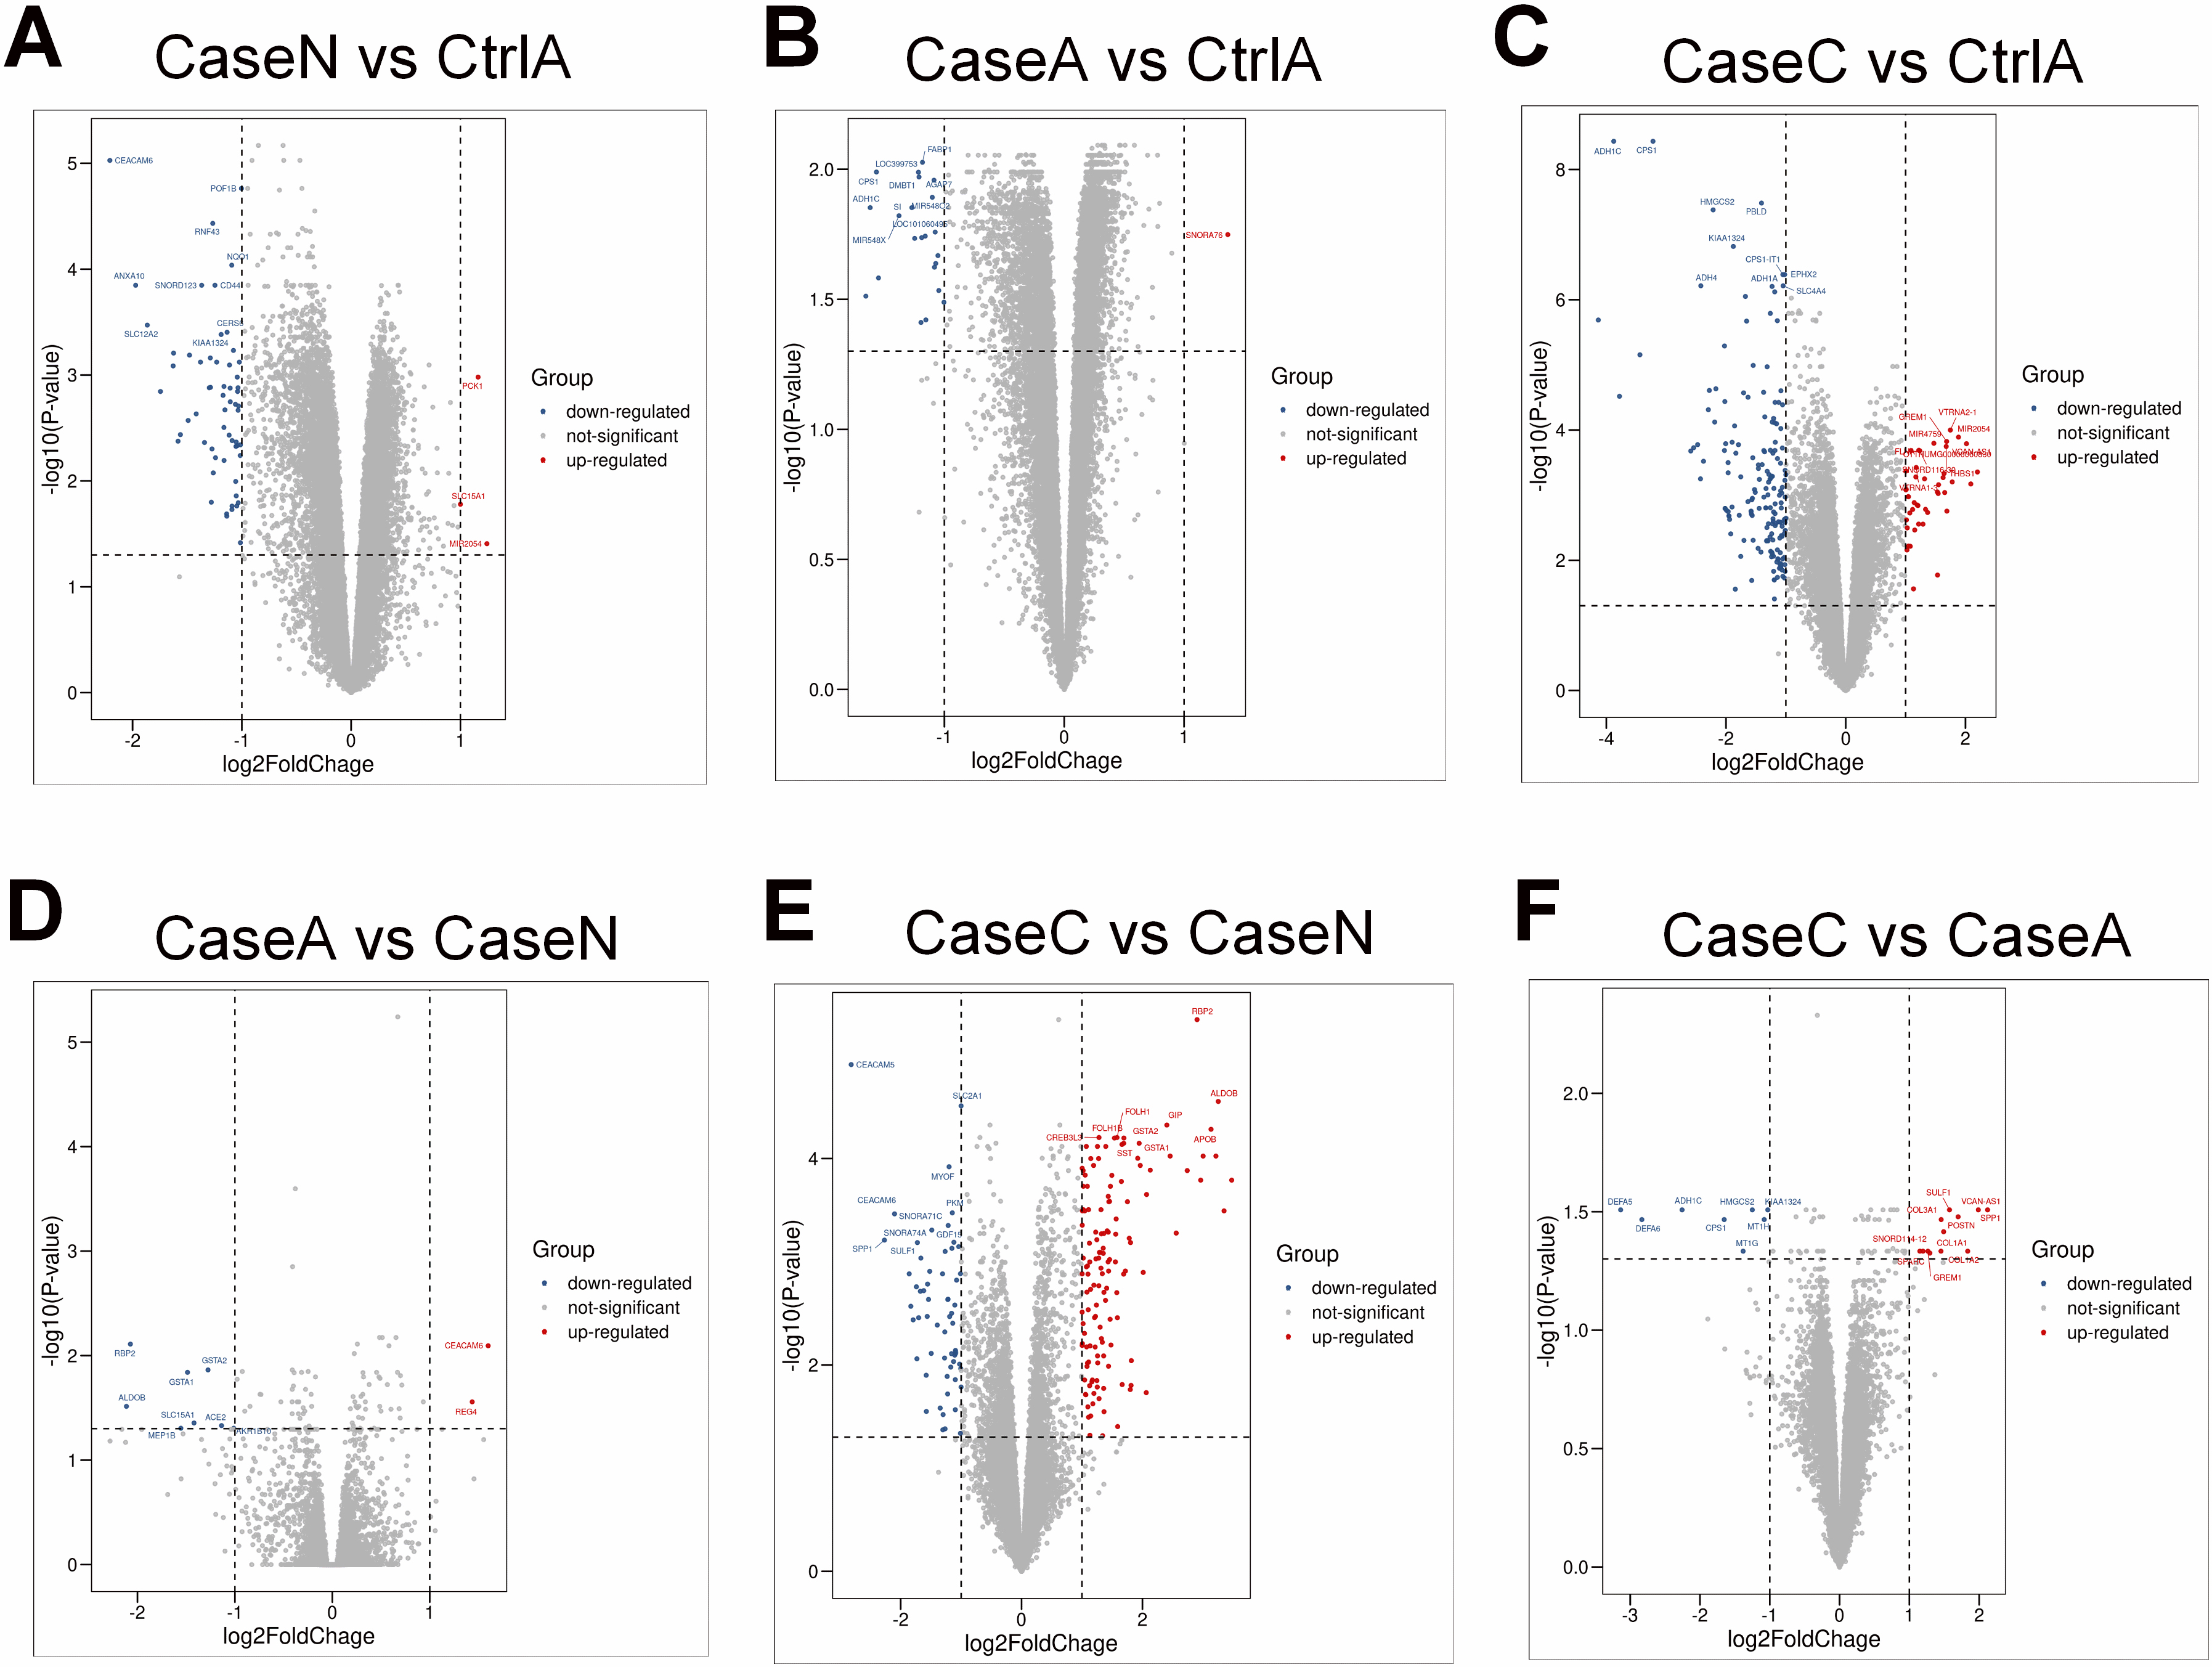
Figure 3.
Identification of hub genes associated with FAP. (A) The results of clustering analysis based on genes in Case N vs Ctrl A. (B) T The results of clustering analysis based on genes in Case A vs Ctrl A. (C) The results of clustering analysis based on genes in Case C vs Ctrl A. (D) The results of clustering analysis based on genes in Case A vs Case N. (E) The results of clustering analysis based on genes in Case C vs Case N. (F) The results of clustering analysis based on genes in Case C vs Case A.

Figure 4.
The gene ontology enrichment and KEGG pathway classification of DEGs. It contains three categories including biological process, cellular component and molecular function. The abscissa axis indicates the number of enriched genes. The abscissa represents the annotated genes in KEGG database; the ordinate represents Categories in KEGG database.
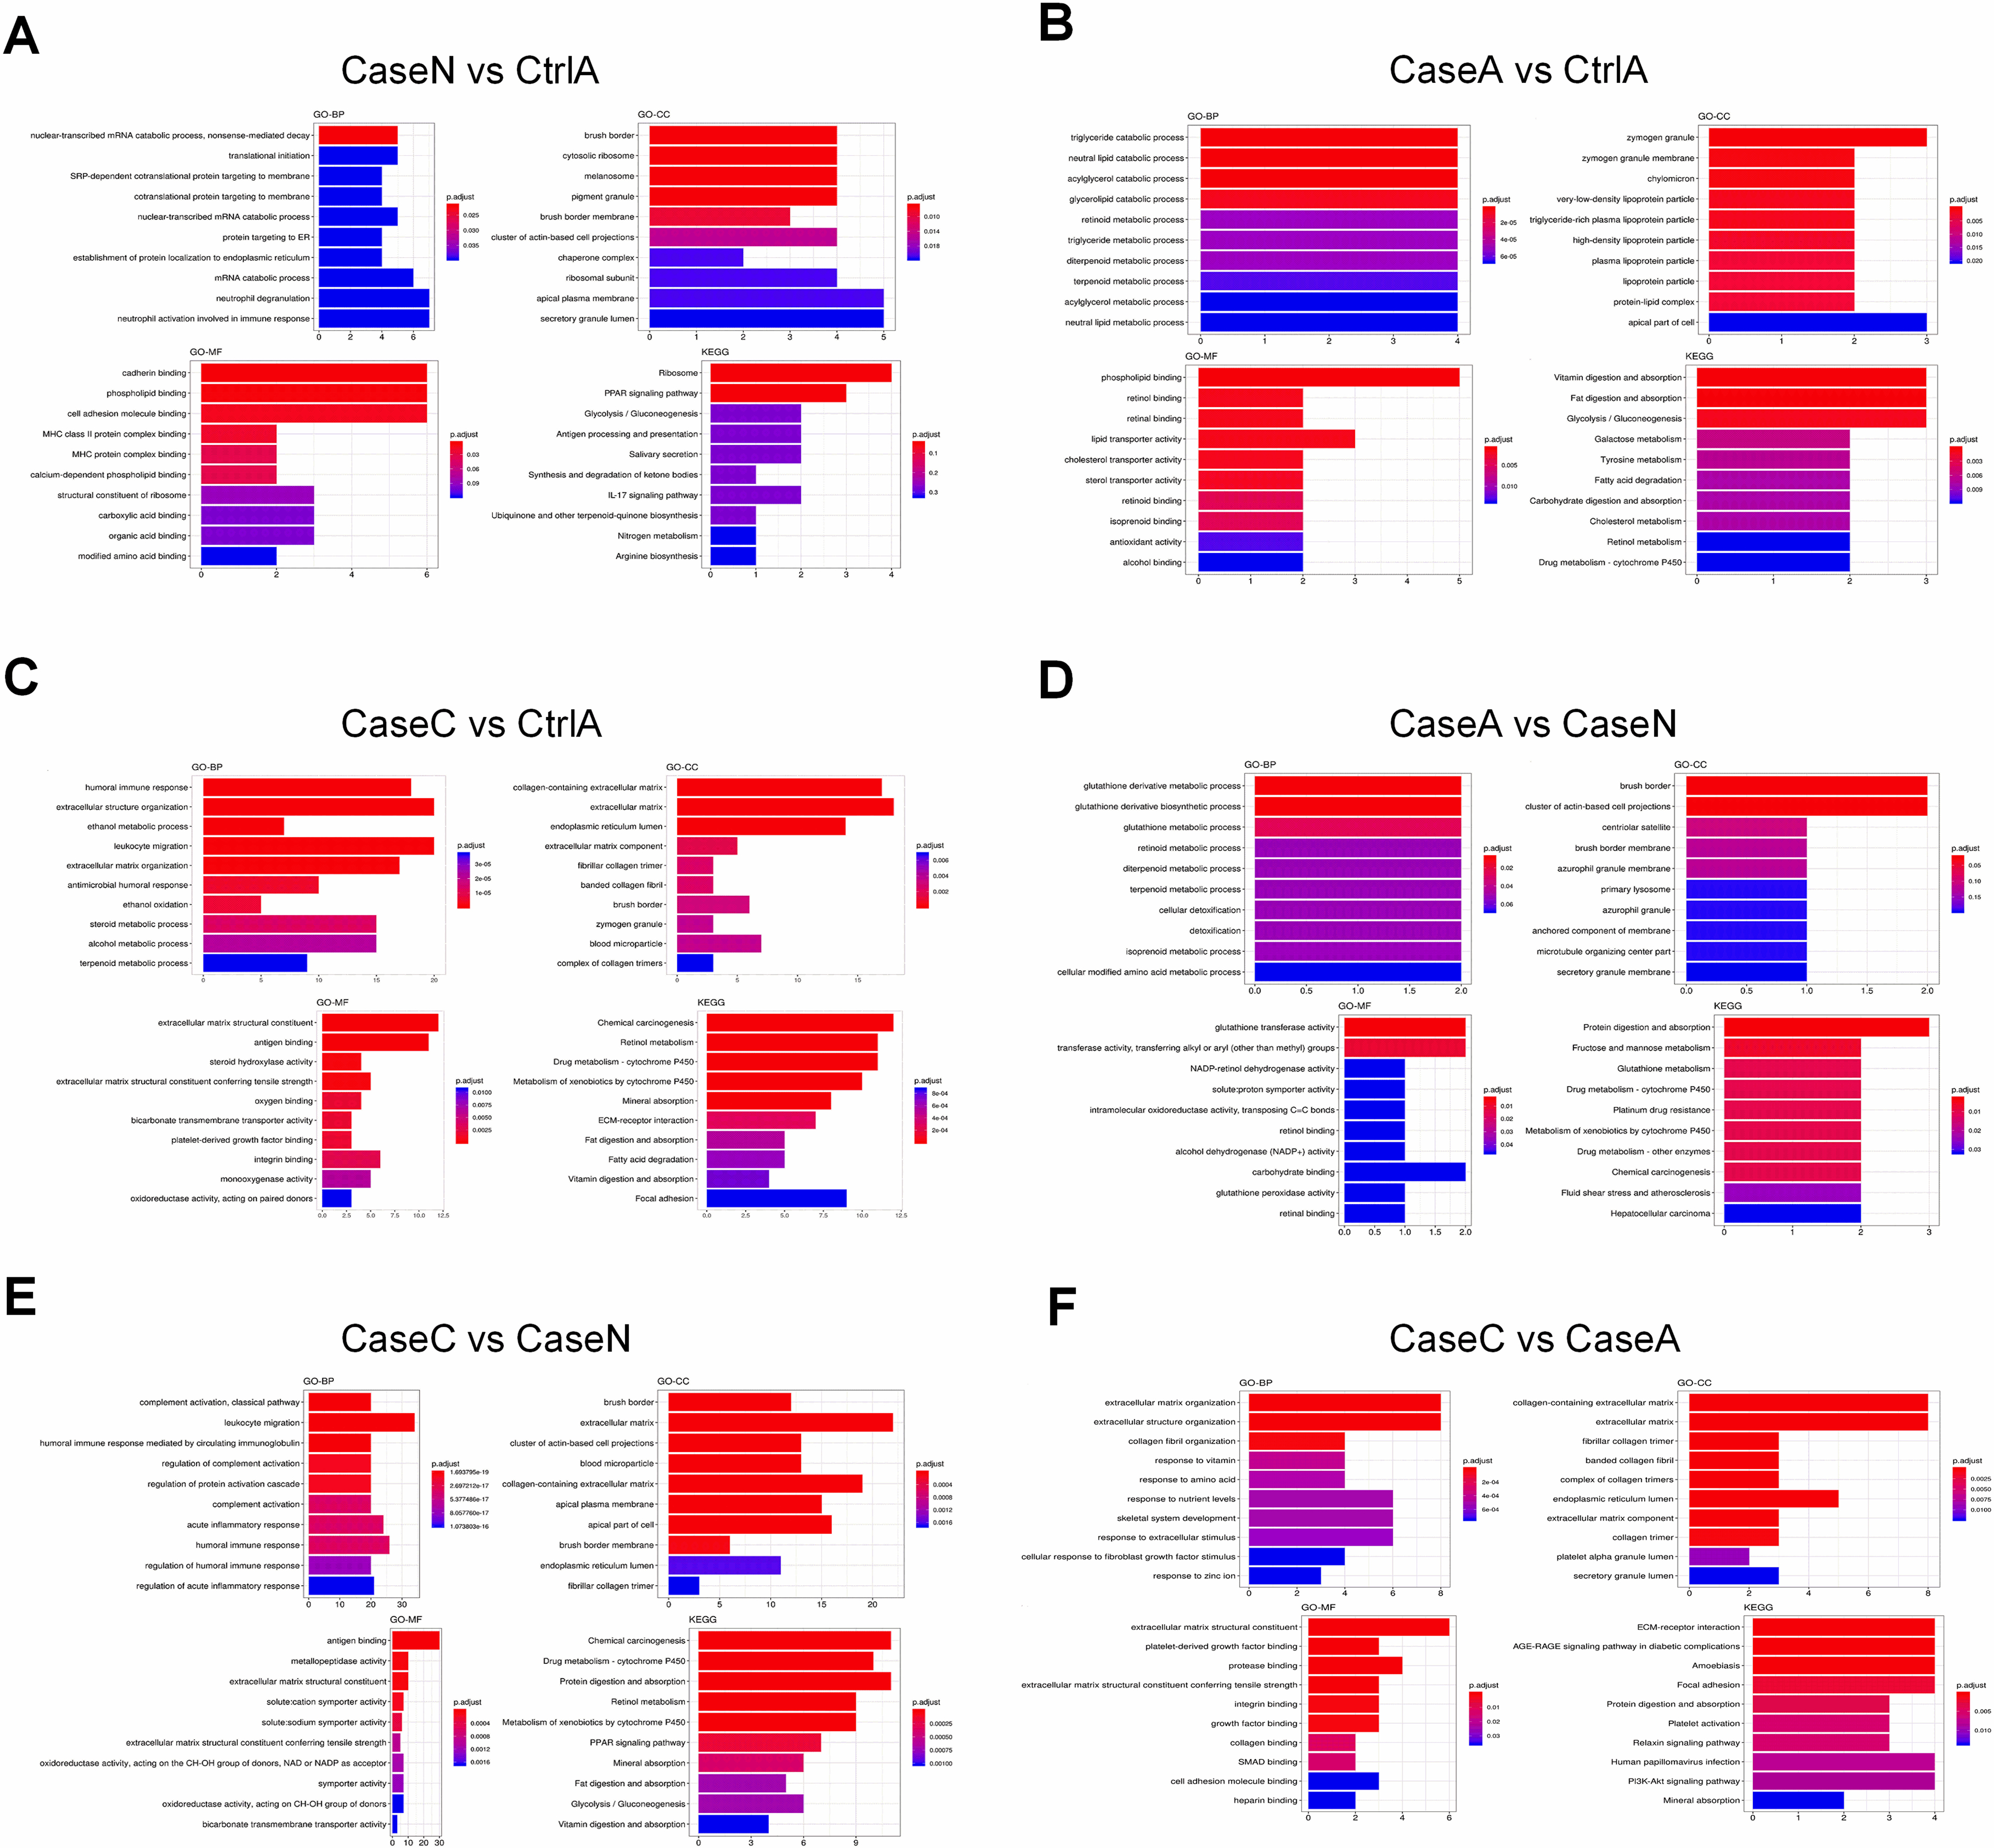
Figure 5.
Global visualization of the immunophenotype across samples from TCGA. (A) The heatmap of 23 normalized immune activity scores in 48 samples. (B) The relative proportion of tumor-infiltrating immune cells. (C) Left, the expression pattern of signature genes from the seven-step cancer-immunity cycle. Each row represents a single gene, and each column represents one sample. Right, the principal component analysis (PCA) of signature genes expression for all samples.
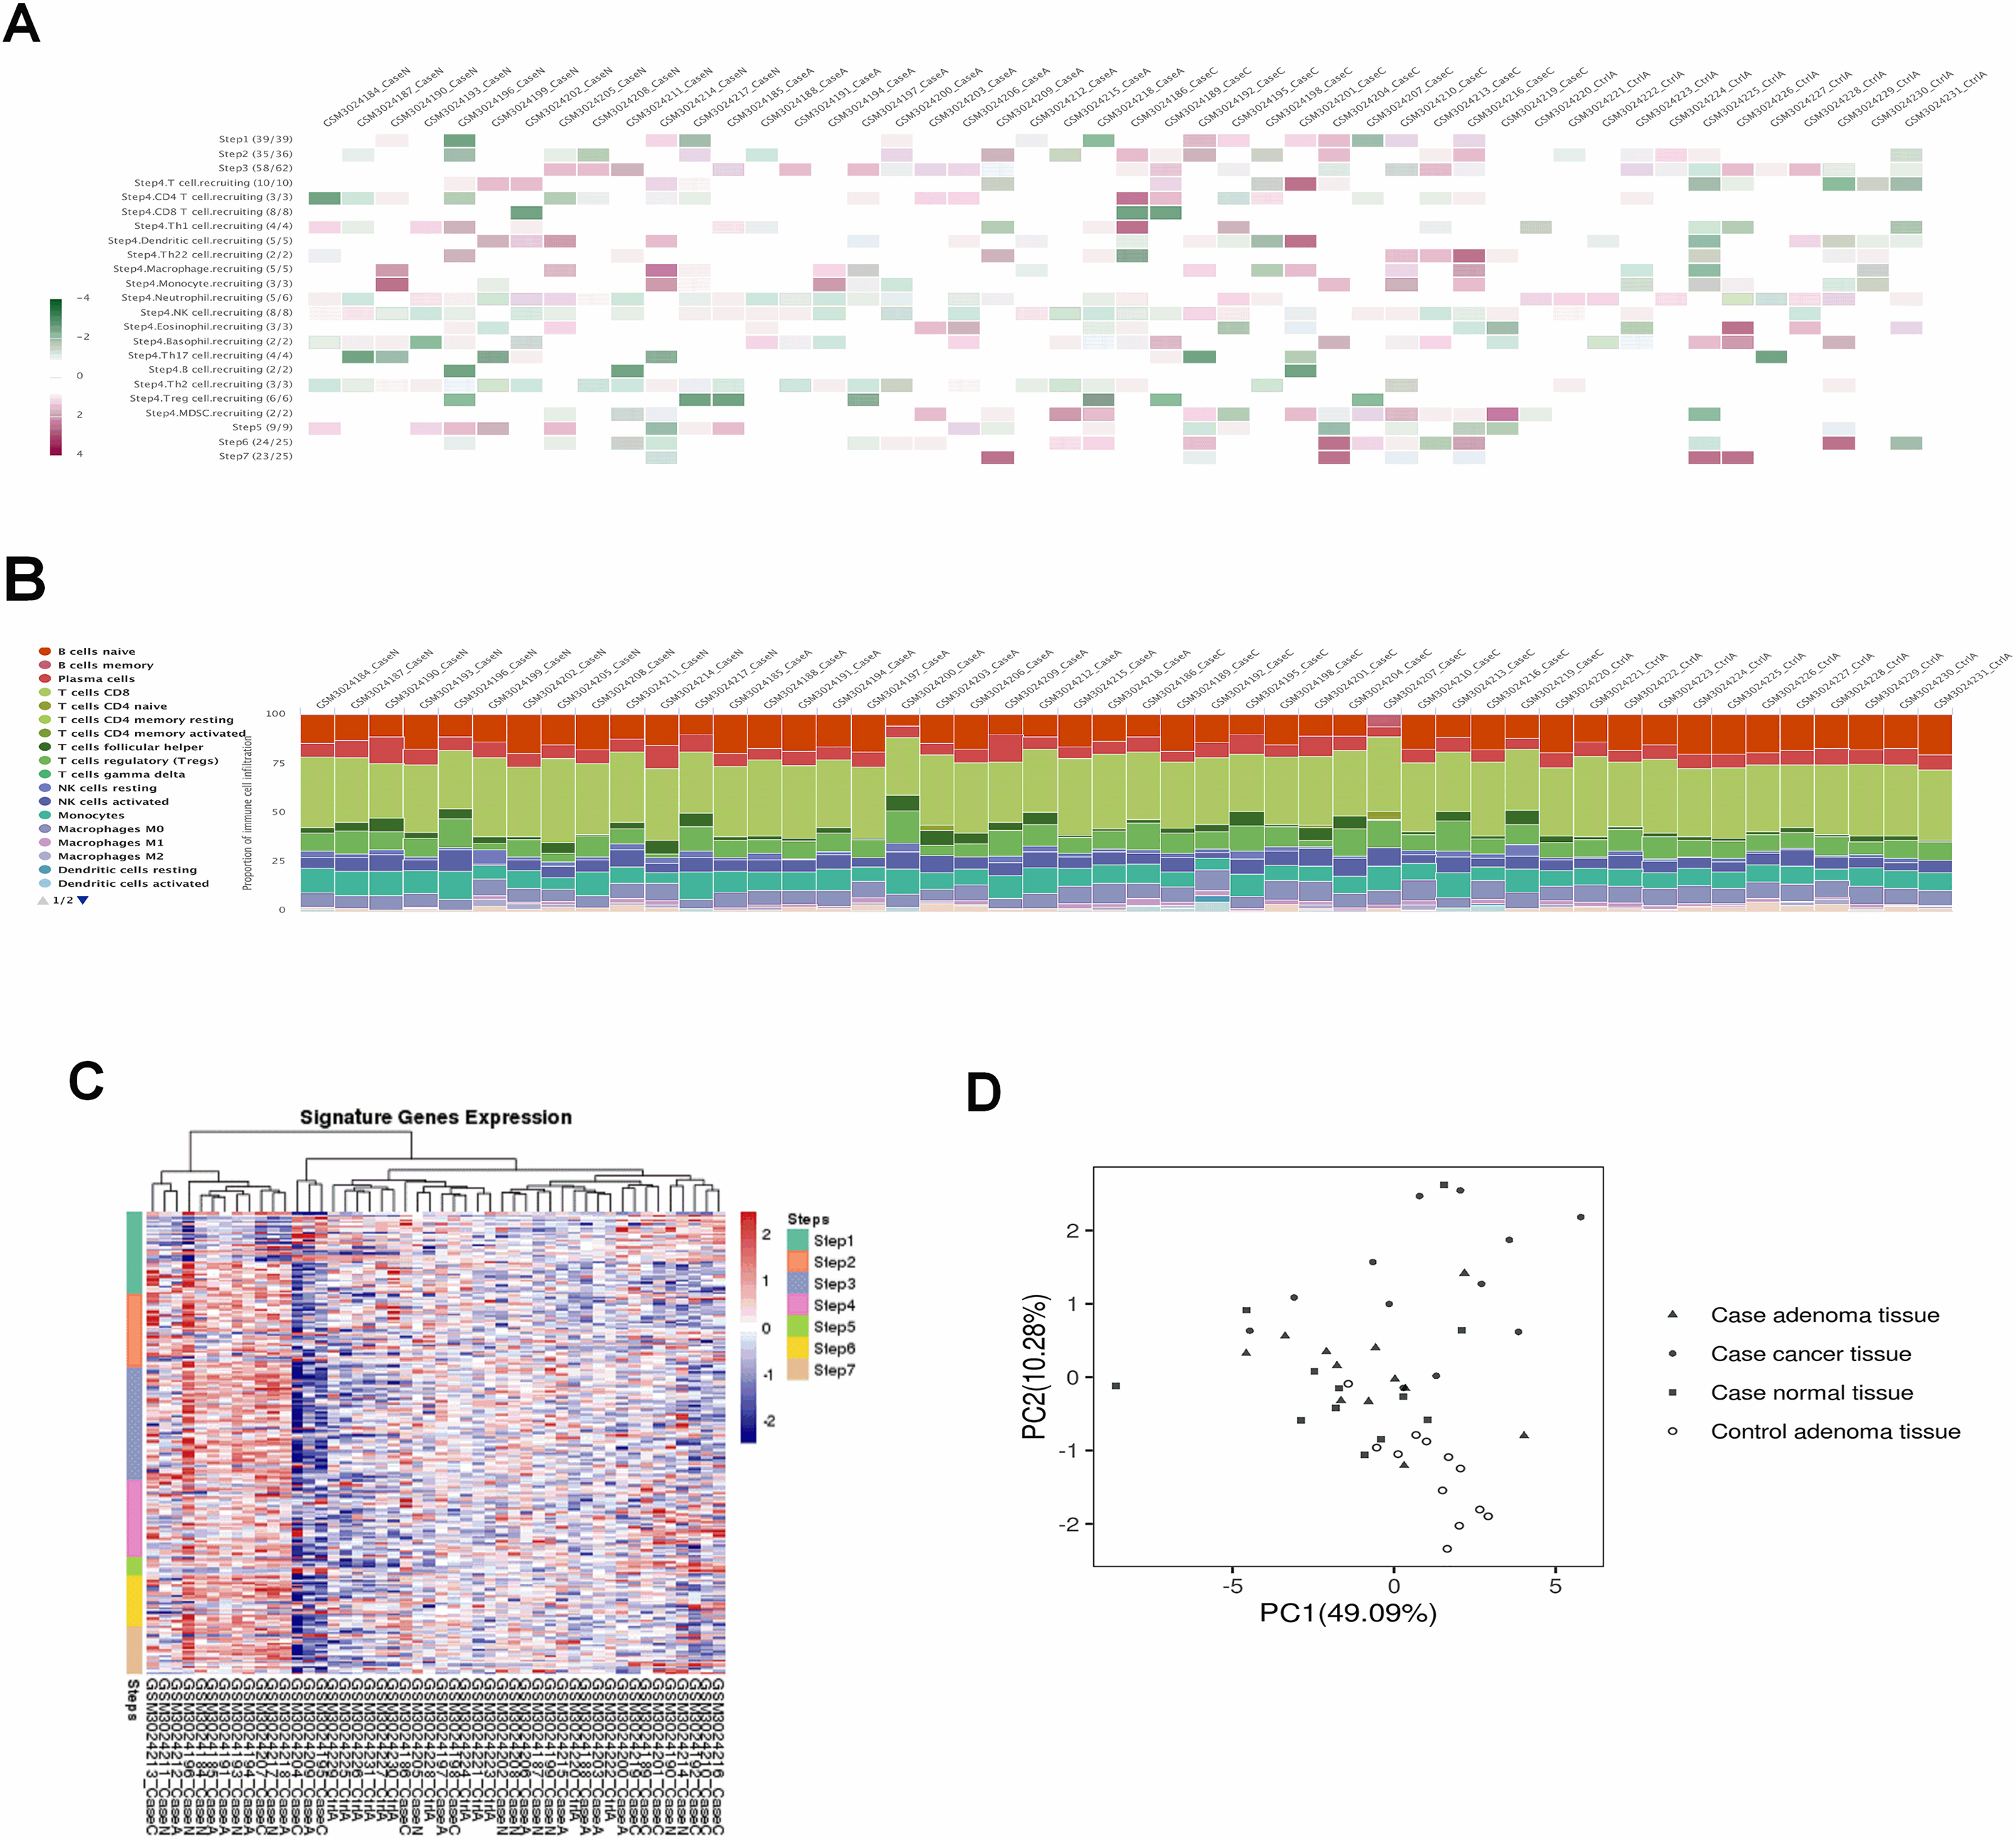
Figure 6.
Weighted gene co-expression network analysis. (A) Sample dendrogram and trait heatmap. (B) Scale independence and mean connectivity of various soft-thresholding values (
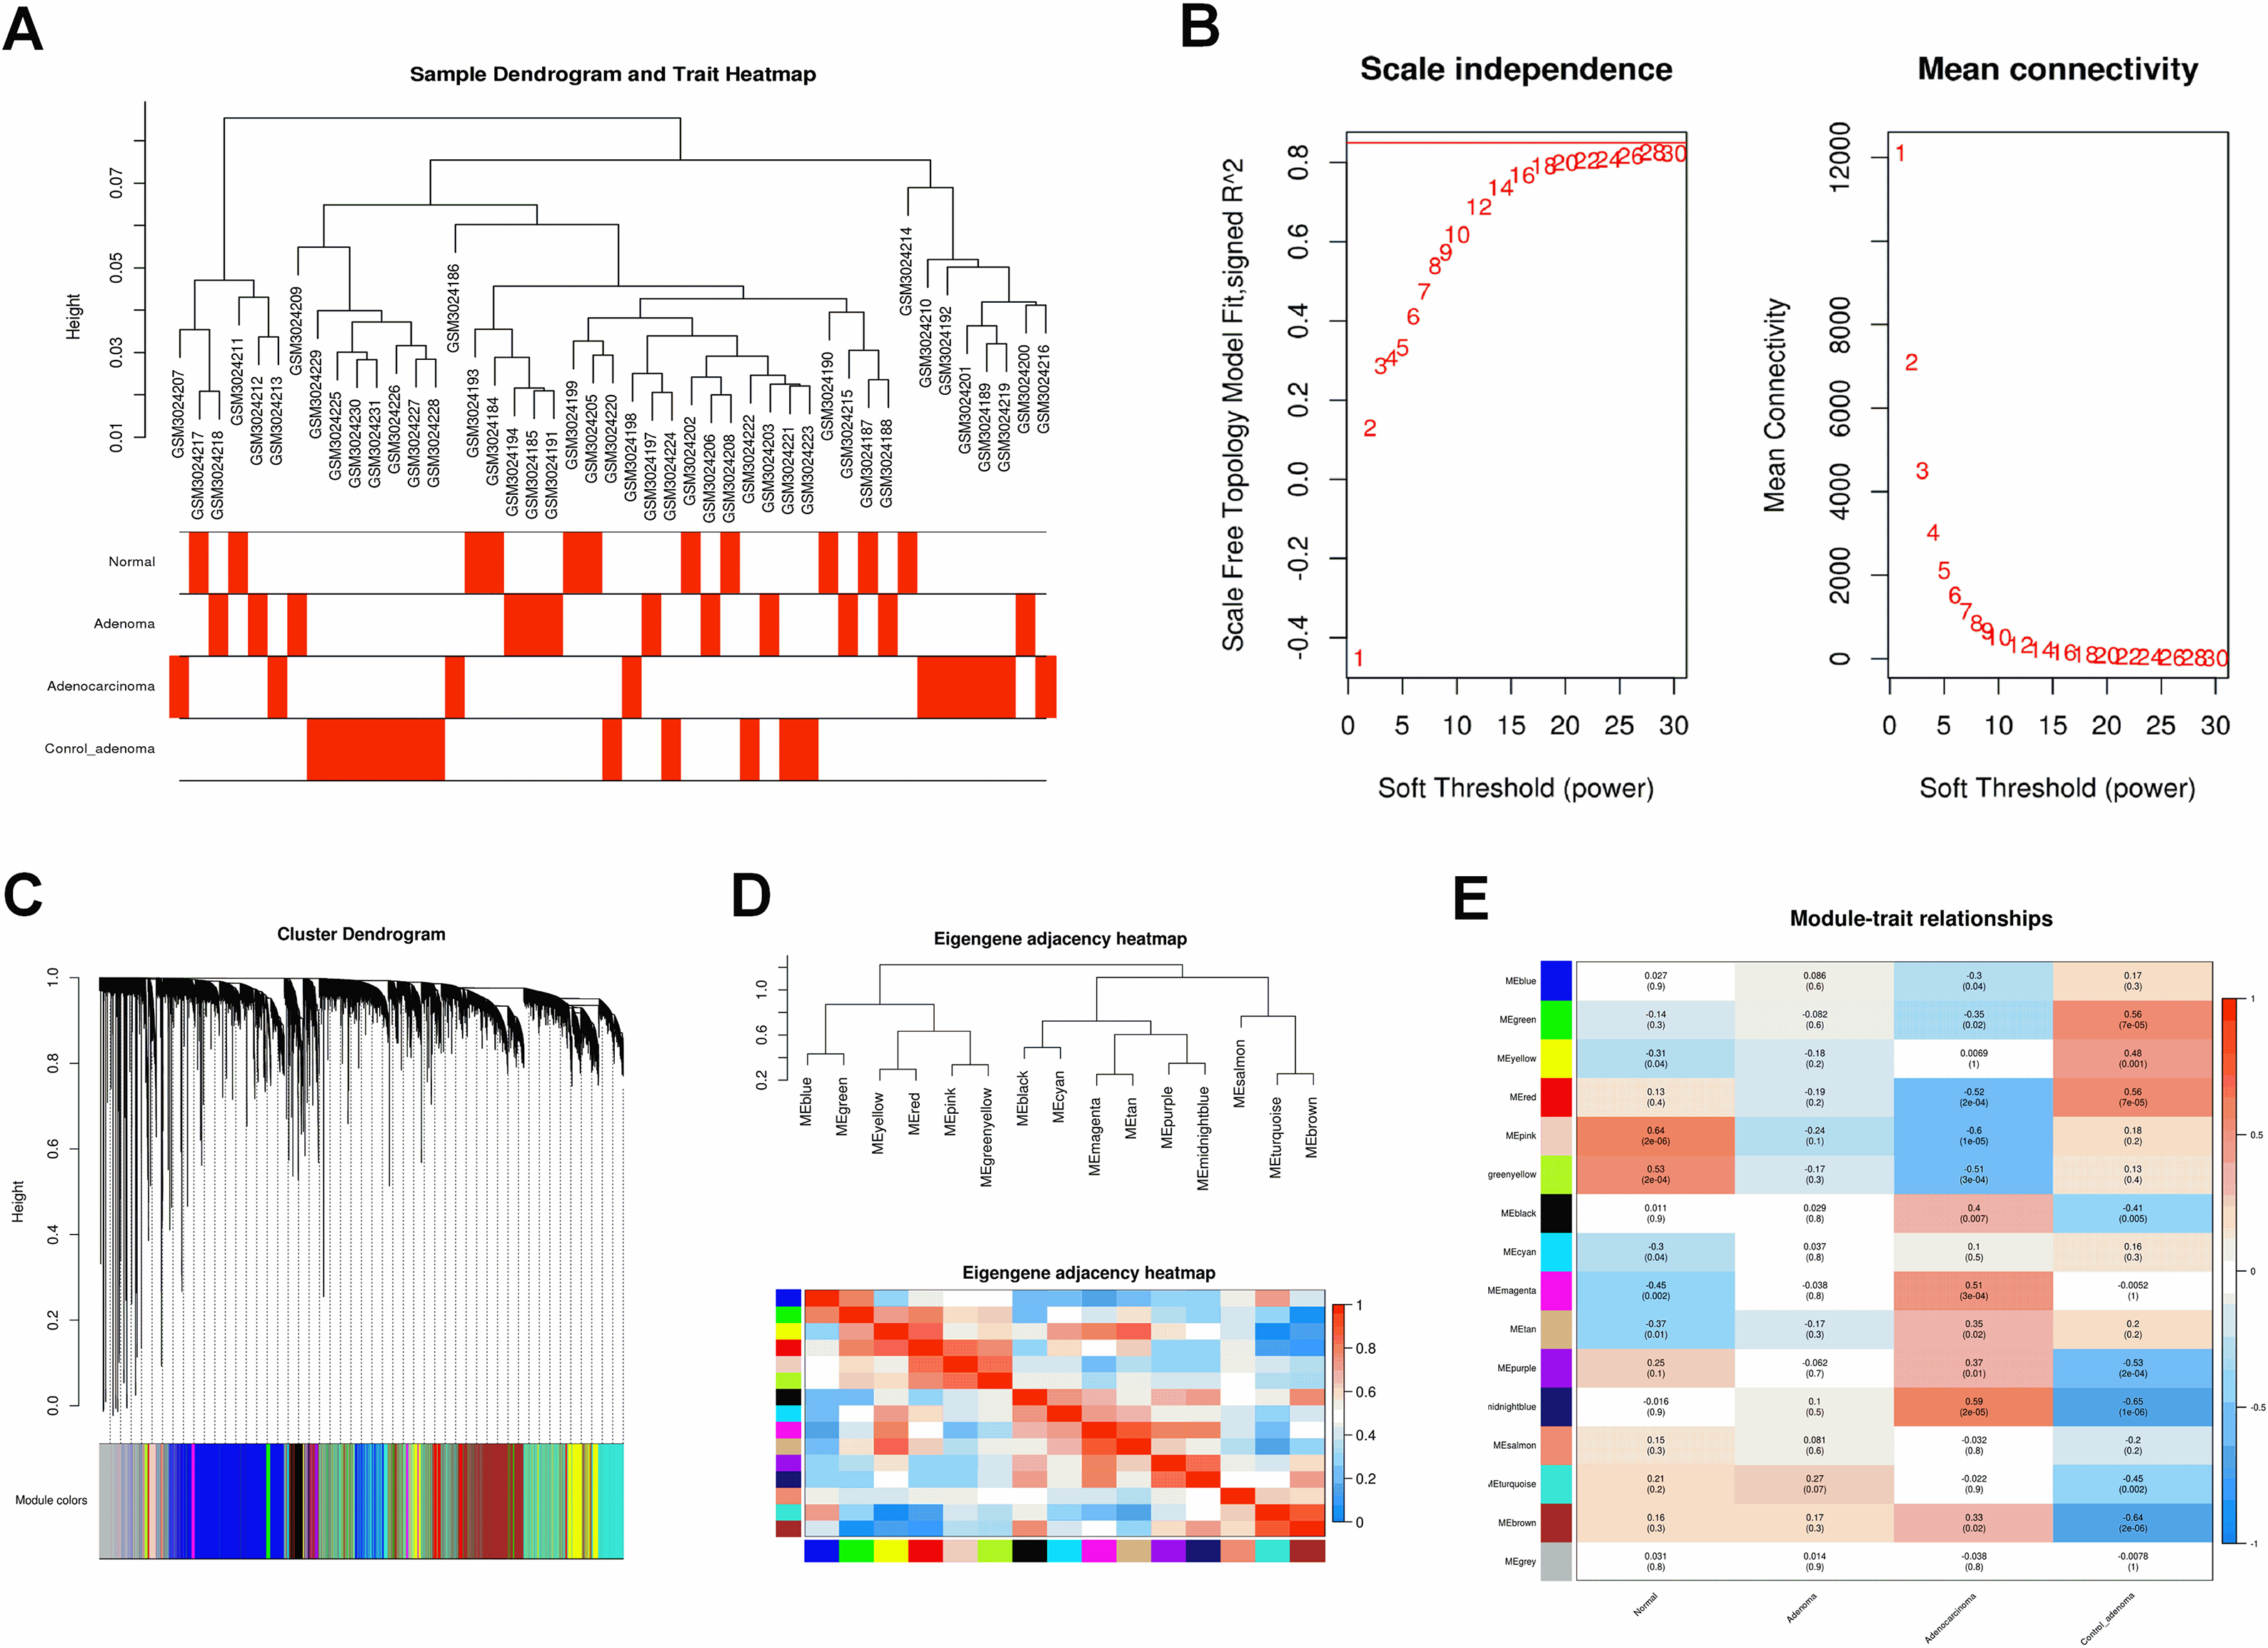
Figure 7.
(A) The scatter plot between the pink module membership and the gene significance for normal. (B) Functional enrichment of genes in the pink module, including Biological process GO terms, Cellular component GO terms, Molecular function GO terms and KEGG analysis.
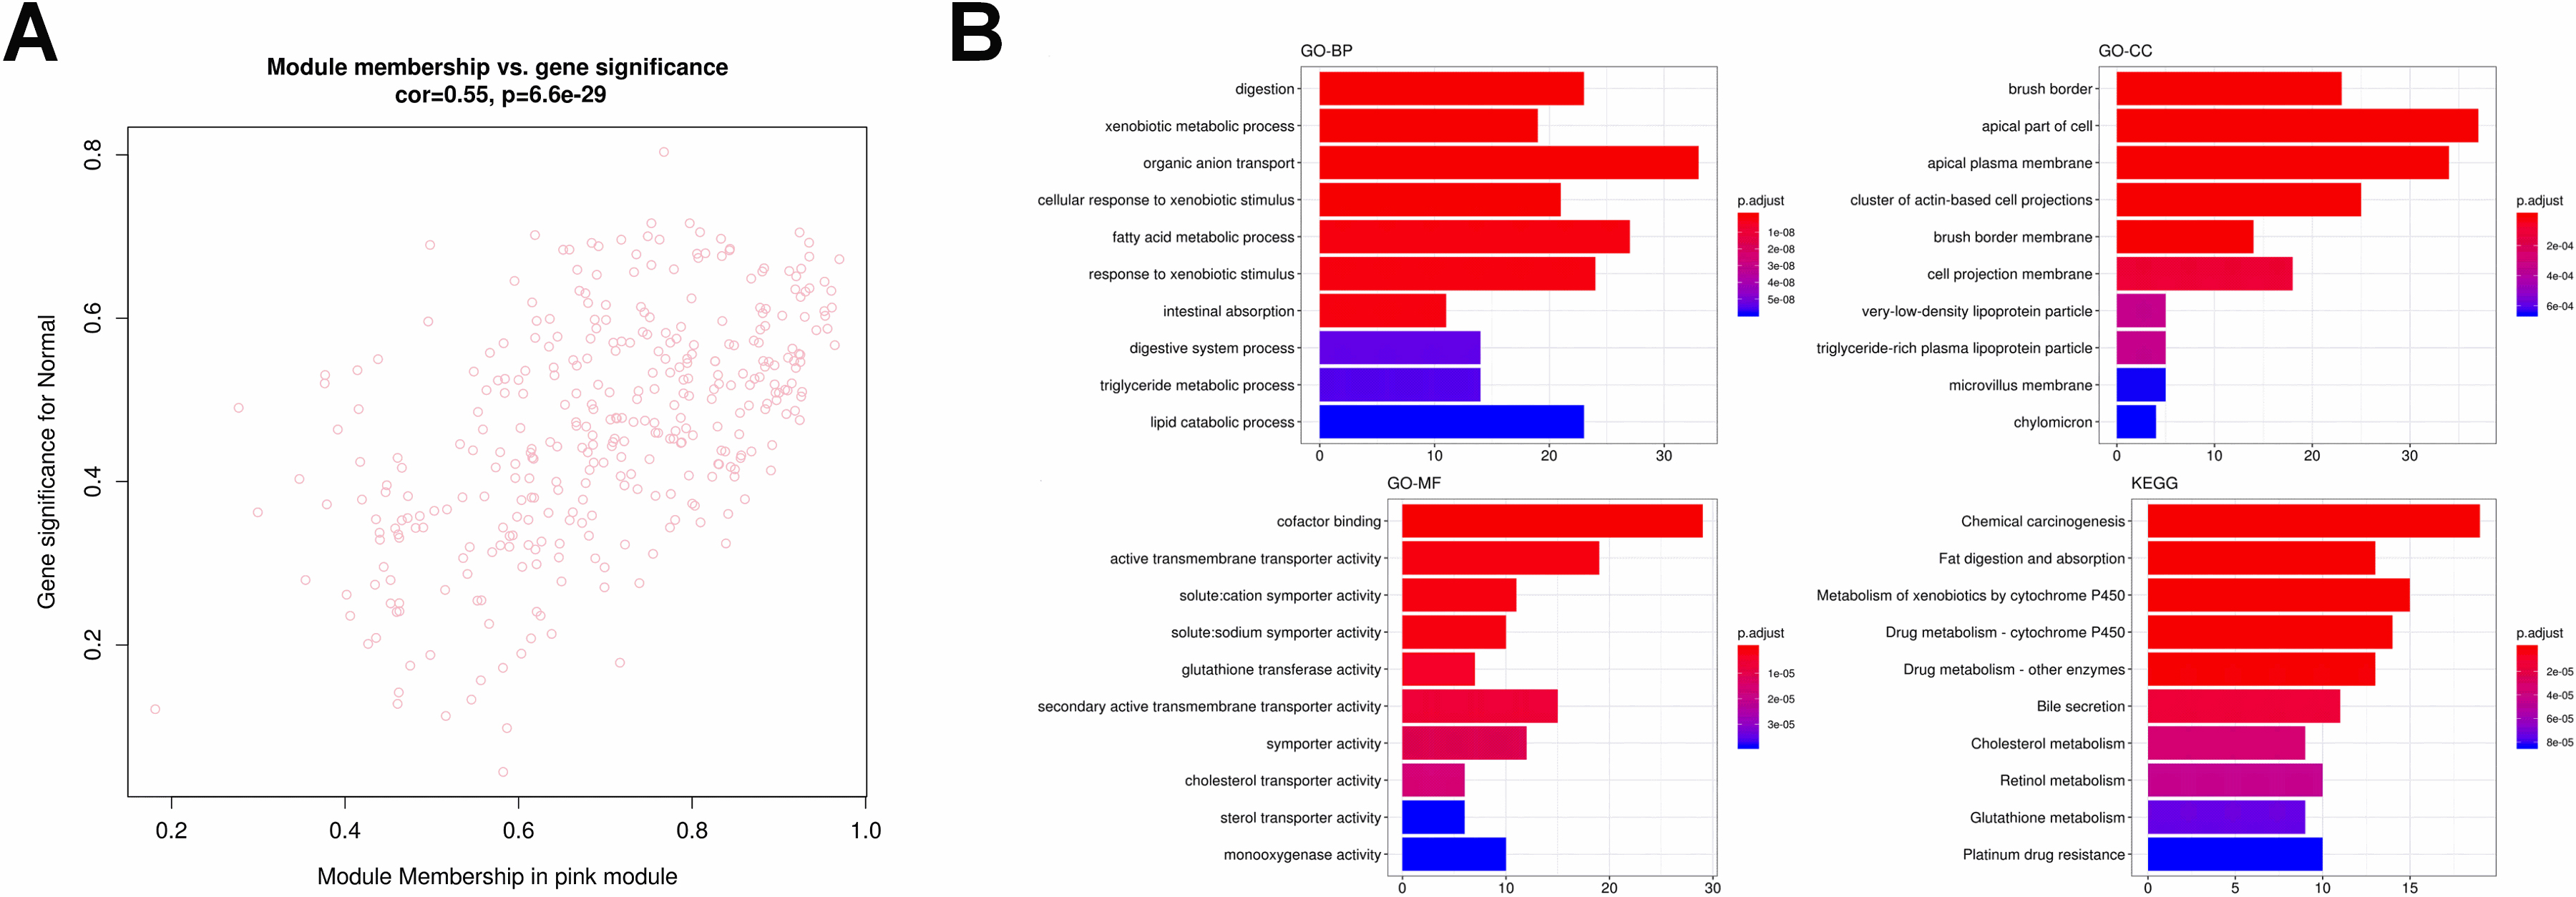
Figure 8.
The identification and further analysis of hub genes in pink module. (A) Genes network with 381 edges and 79 nodes, red points represented hub genes [20]; (B) Boxplots for the expression of hub genes in normal vs. FAP; (C) Functional annotation for hub genes associated with control ademona, including Biological process GO terms, Cellular component GO terms, Molecular function and KEGG analysis.
![The identification and further analysis of hub genes in pink module. (A) Genes network with 381 edges and 79 nodes, red points represented hub genes [20]; (B) Boxplots for the expression of hub genes in normal vs. FAP; (C) Functional annotation for hub genes associated with control ademona, including Biological process GO terms, Cellular component GO terms, Molecular function and KEGG analysis.](https://content.iospress.com:443/media/thc/2024/32-3/thc-32-3-thc230719/thc-32-thc230719-g008.jpg)
Figure 9.
Identification and functional enrichment analysis of transcriptional factors in pink module. (A) The transcriptional factor (TF) network of the 80 genes generated by Webgestalt. The diamond and red color indicate the TFs while the green and eclipse shape indicate the target gene. (B) The GO and KEGG enrichment analysis for TF in pink module.
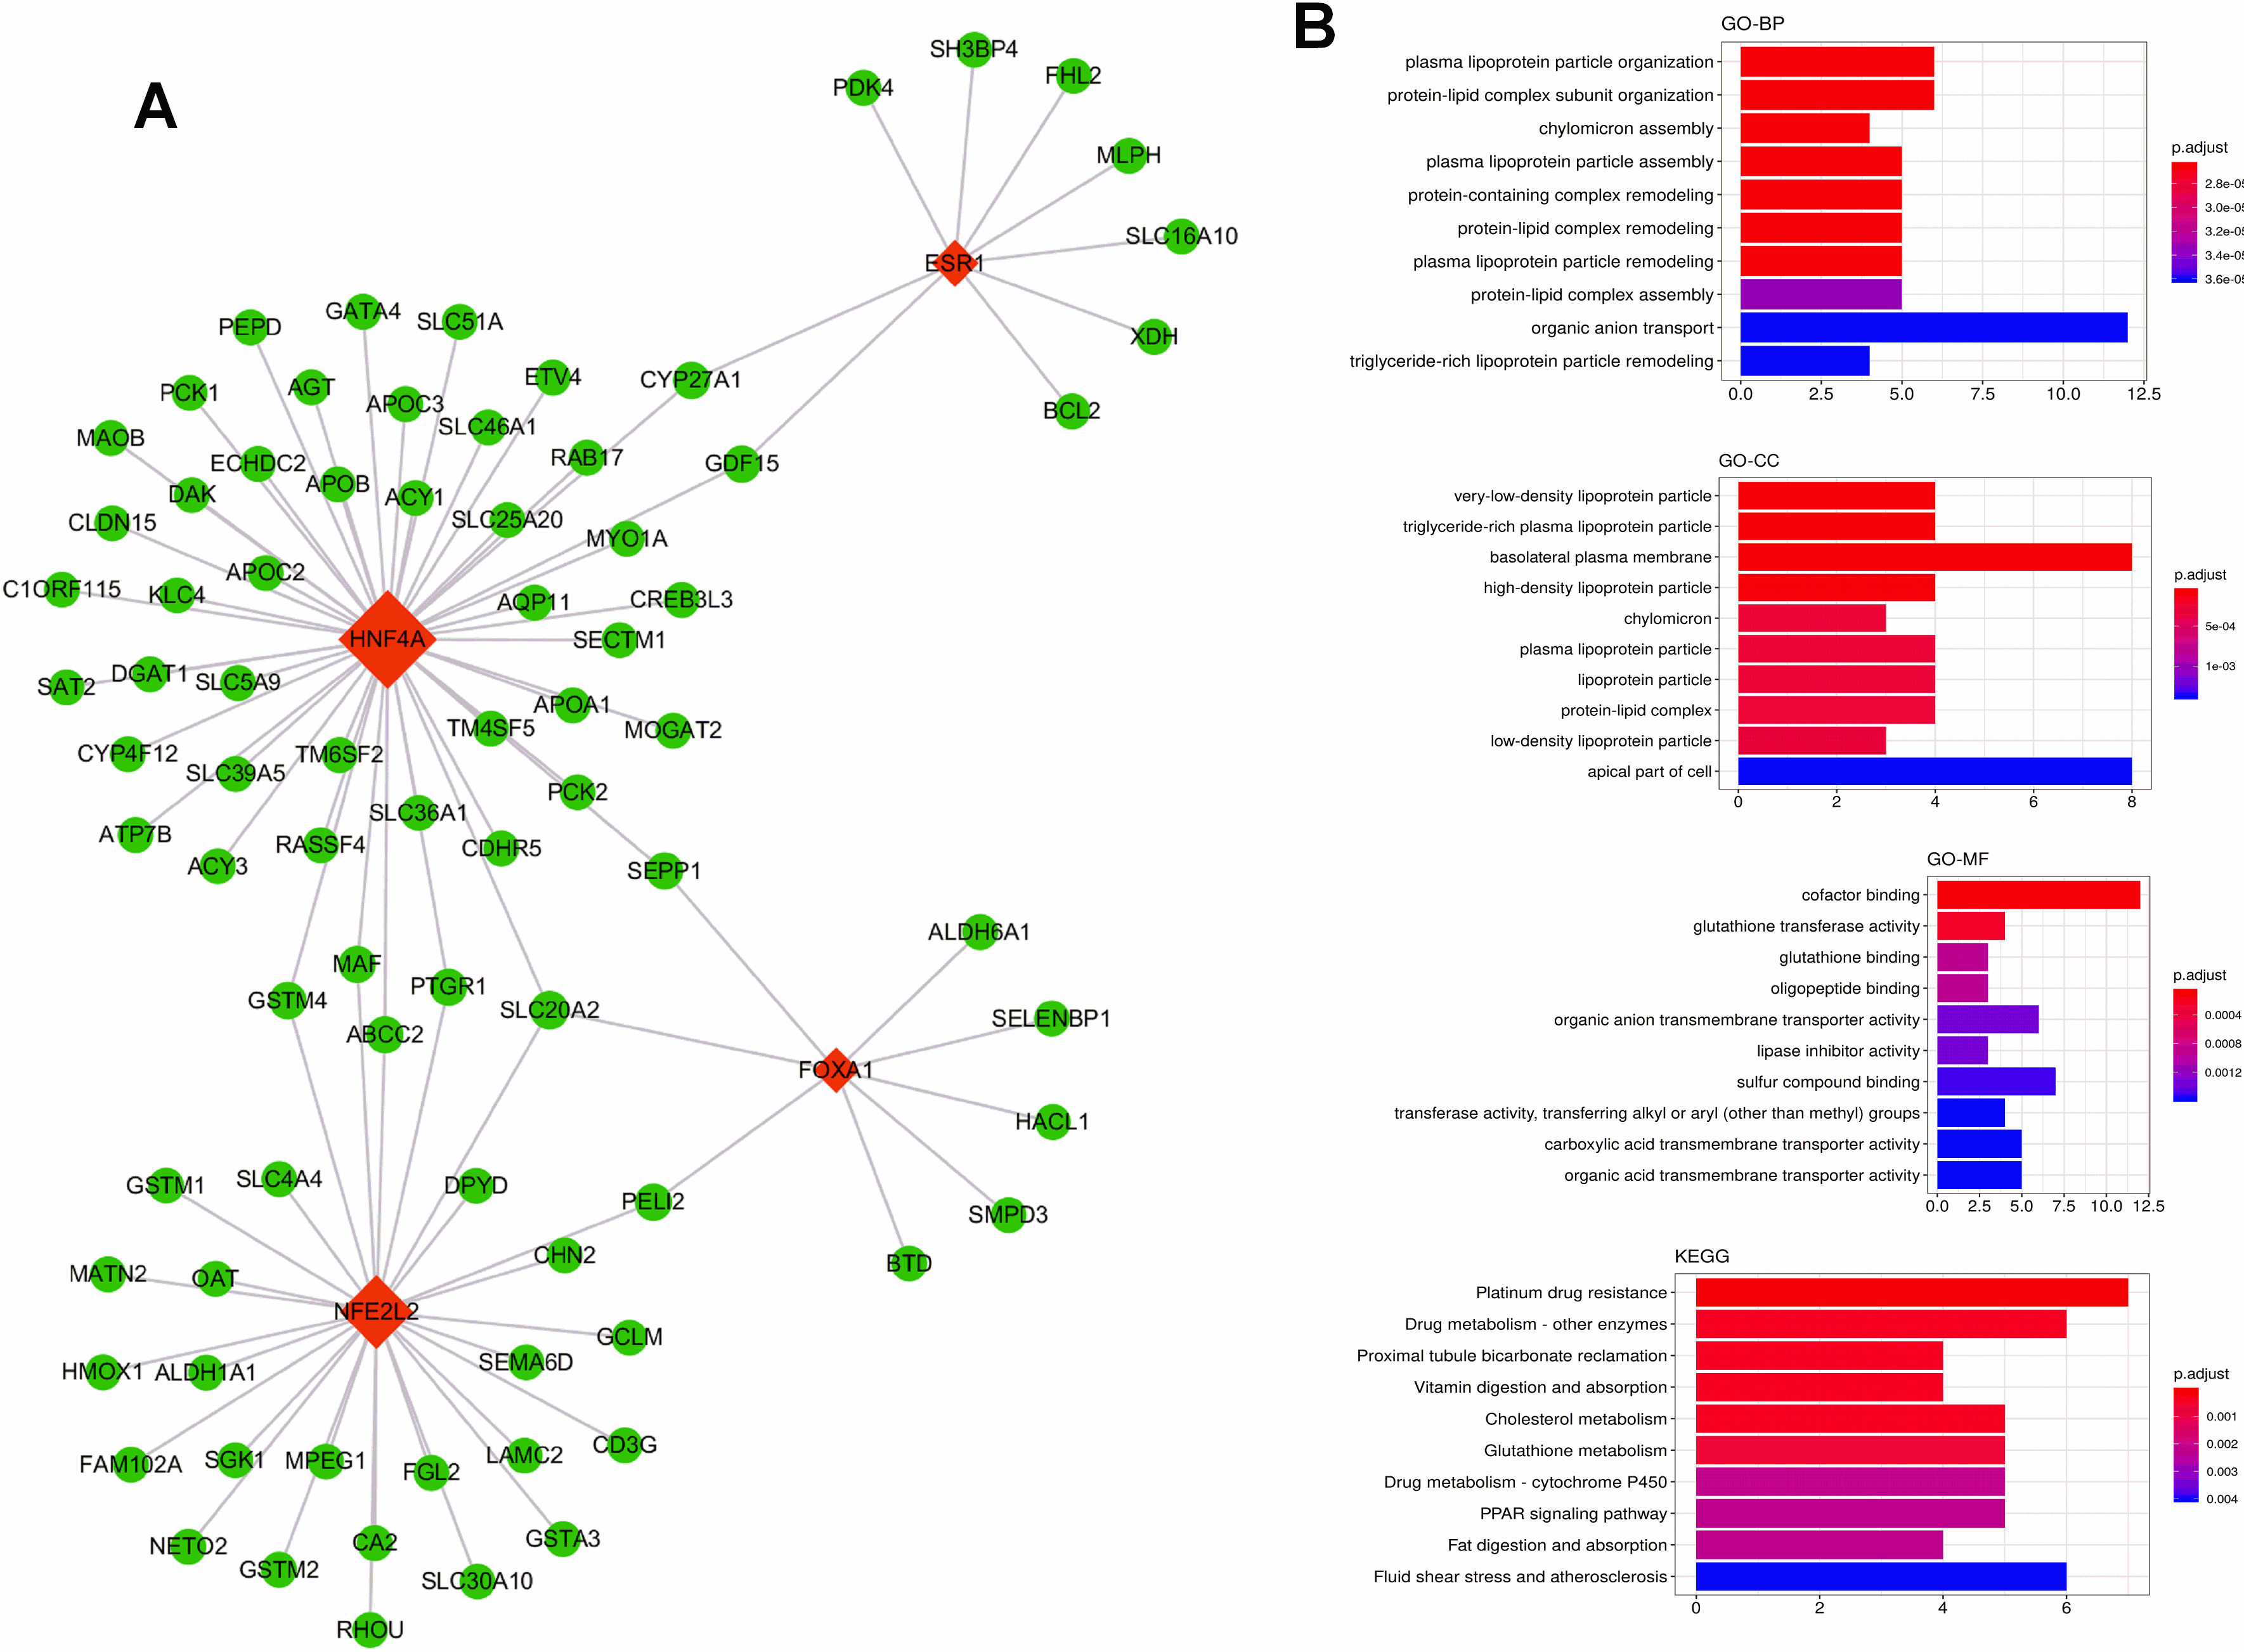
Figure 10.
(A) The scatter plot between the midnightblue module membership and the gene significance for control ademona. (B) Functional enrichment of genes in the pink module, including Biological process GO terms, Molecular function GO terms and KEGG analysis.
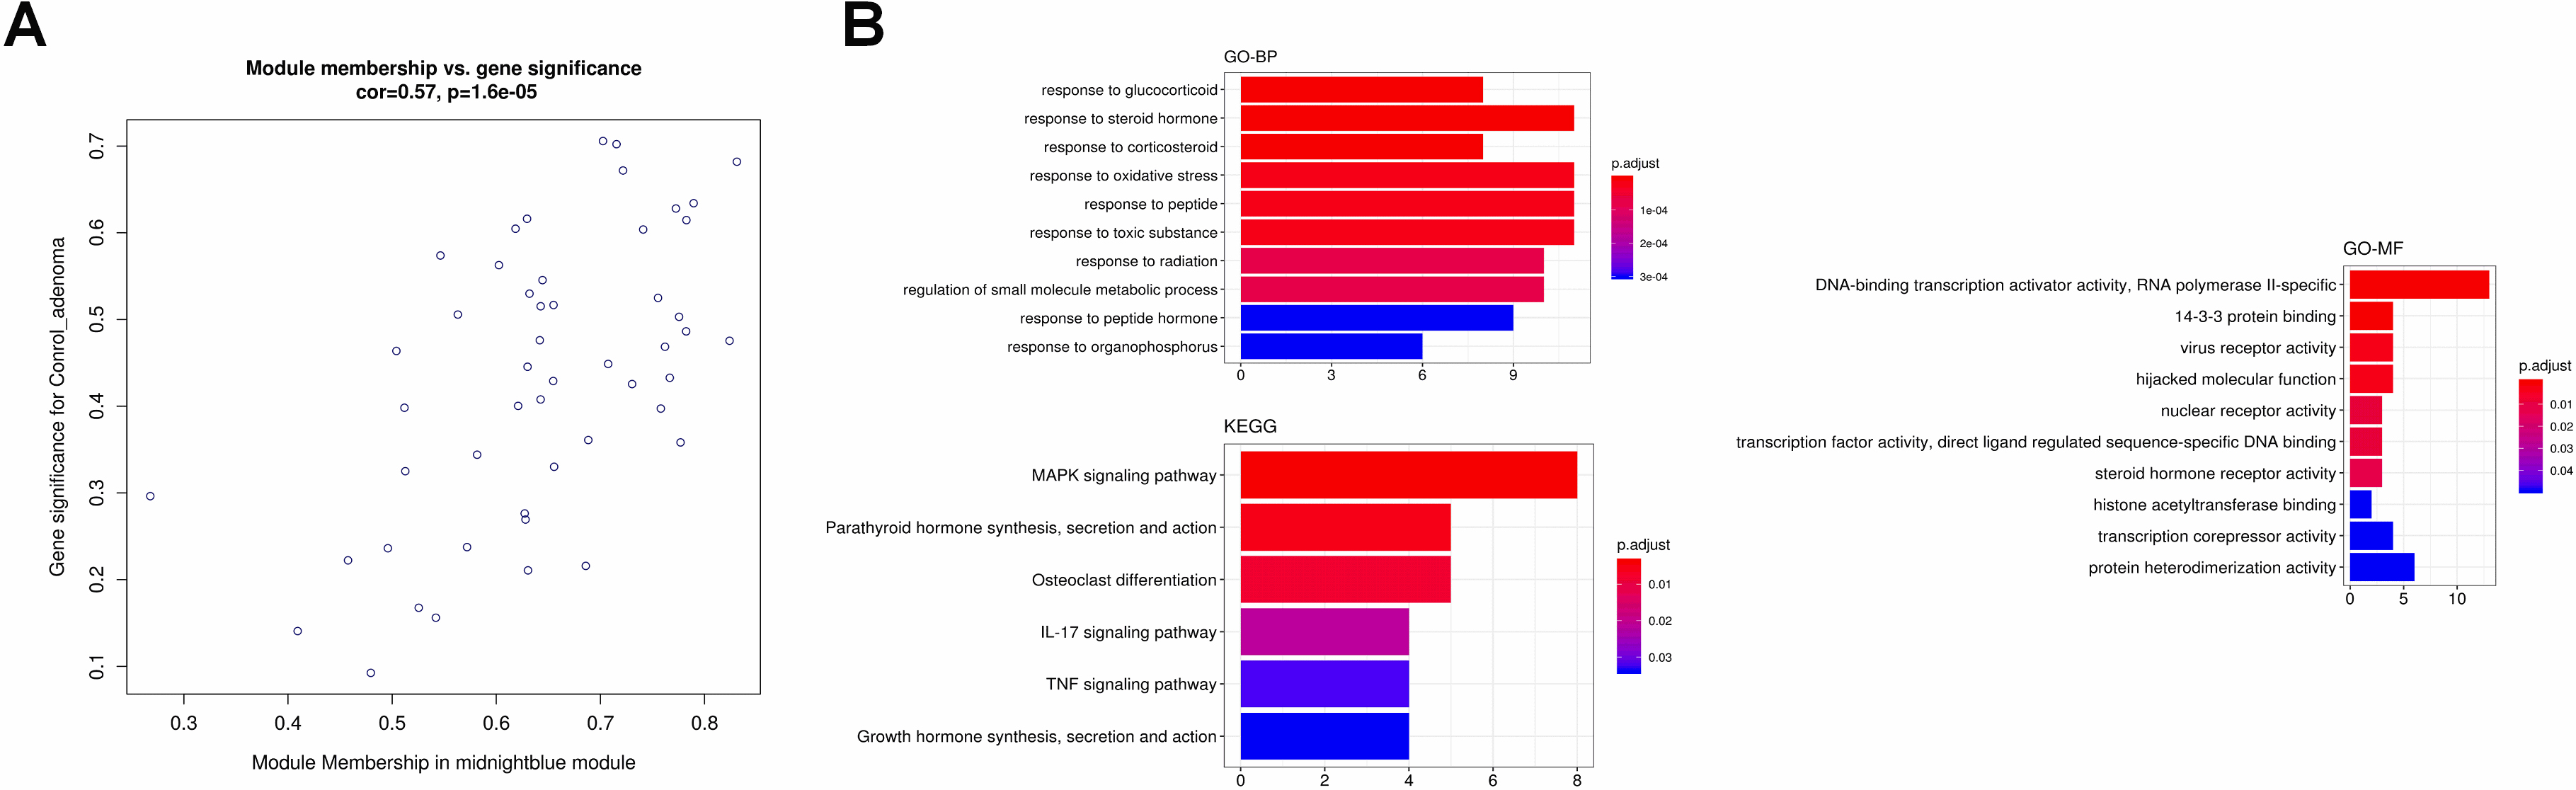
Figure 11.
The identification and further analysis of hub genes in midnight blue module. (A) Genes network with 136 edges and 17 nodes, red points represented hub genes [17]; (B) Functional annotation for hub genes associated with control ademona, including Biological process GO terms and KEGG analysis; (C) Boxplots for the expression of hub genes in control ademona vs. FAP.
![The identification and further analysis of hub genes in midnight blue module. (A) Genes network with 136 edges and 17 nodes, red points represented hub genes [17]; (B) Functional annotation for hub genes associated with control ademona, including Biological process GO terms and KEGG analysis; (C) Boxplots for the expression of hub genes in control ademona vs. FAP.](https://content.iospress.com:443/media/thc/2024/32-3/thc-32-3-thc230719/thc-32-thc230719-g011.jpg)
Figure 12.
Identification and functional enrichment analysis of TFs in midnightblue module. (A) The transcriptional factor (TF) network of the 48 genes generated by Webgestalt. The diamond and red color indicate the TFs while the green and eclipse shape indicate the target gene. (B) The GO and KEGG enrichment of analysis in midnightblue module.
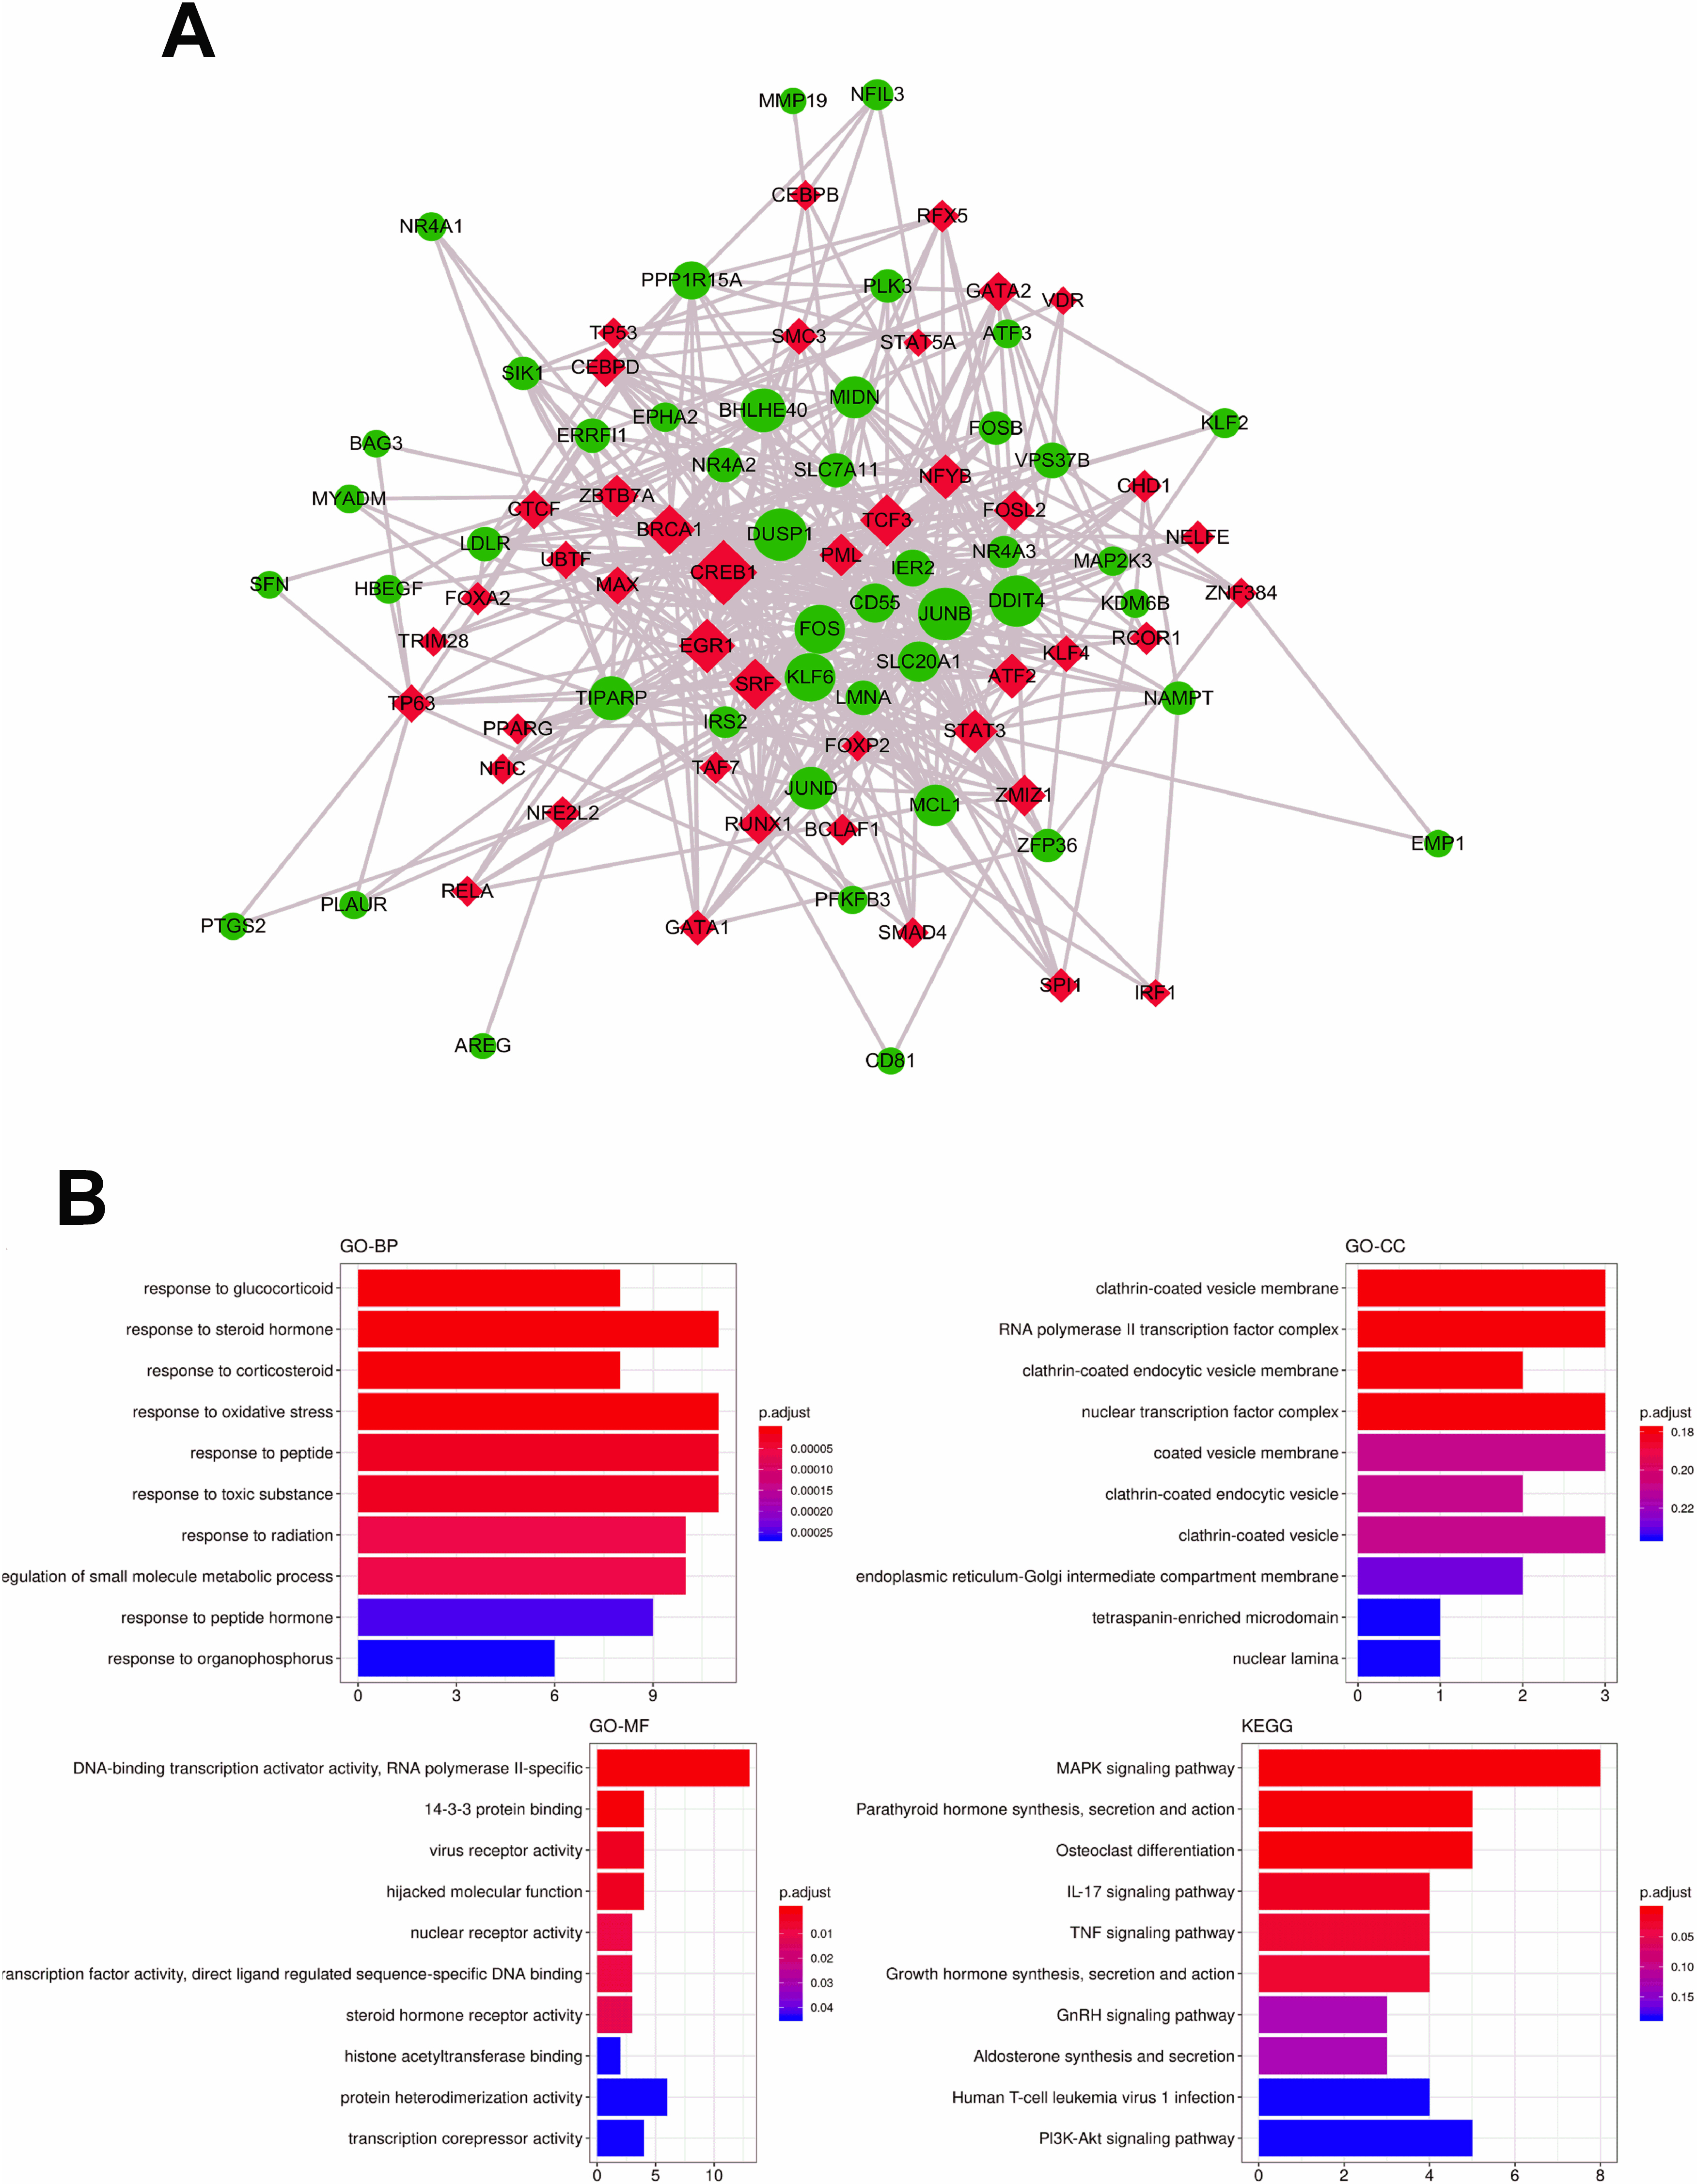
Figure 13.
The most significant correlation module merge Immune infiltration signature genes, pink (CCL5, CD3G, CD2, TLR3). The GO and KEGG enrichment of four identified genes. The GO item contains (A) biological process, (B) cellular component and (C) molecular function. (D) KEGG pathway analysis.
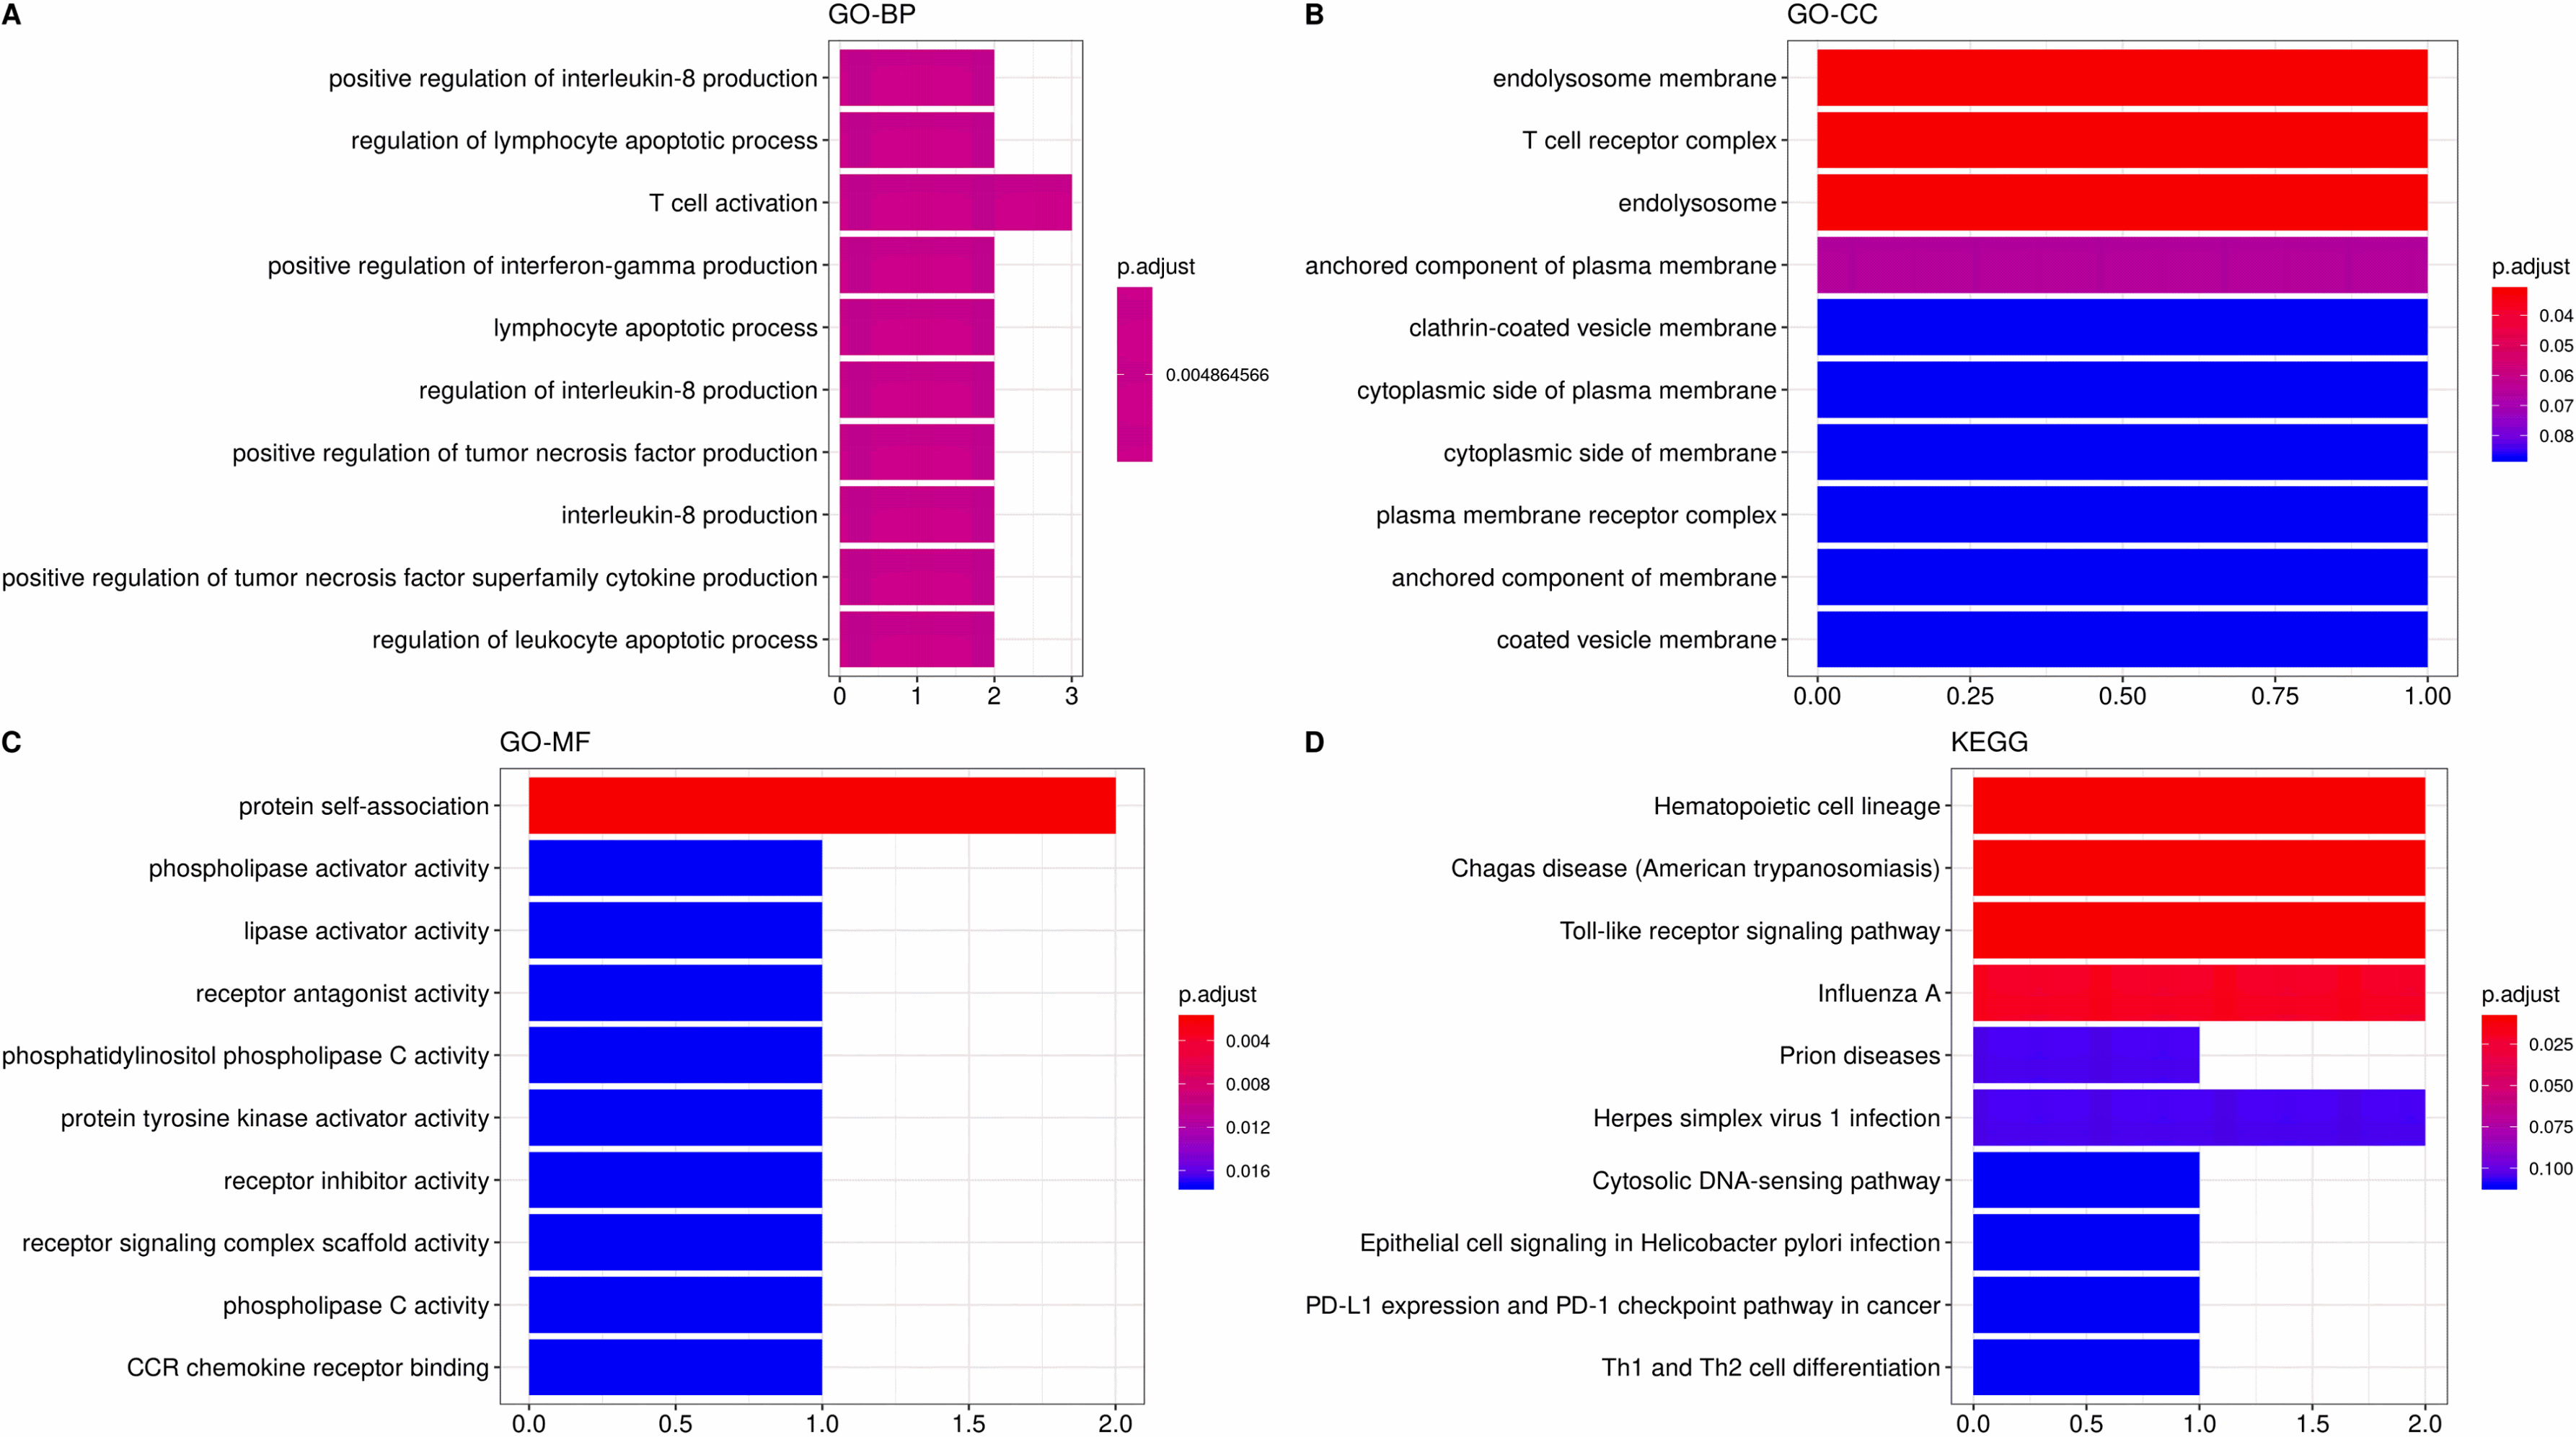
Figure 14.
The most significant correlation module merge Immune infiltration signature genes: midnightblue (KLF2). The GO and KEGG enrichment of the KLF2. The GO item including (A) biological process, (B) cellular component. (C) KEGG pathway analysis.
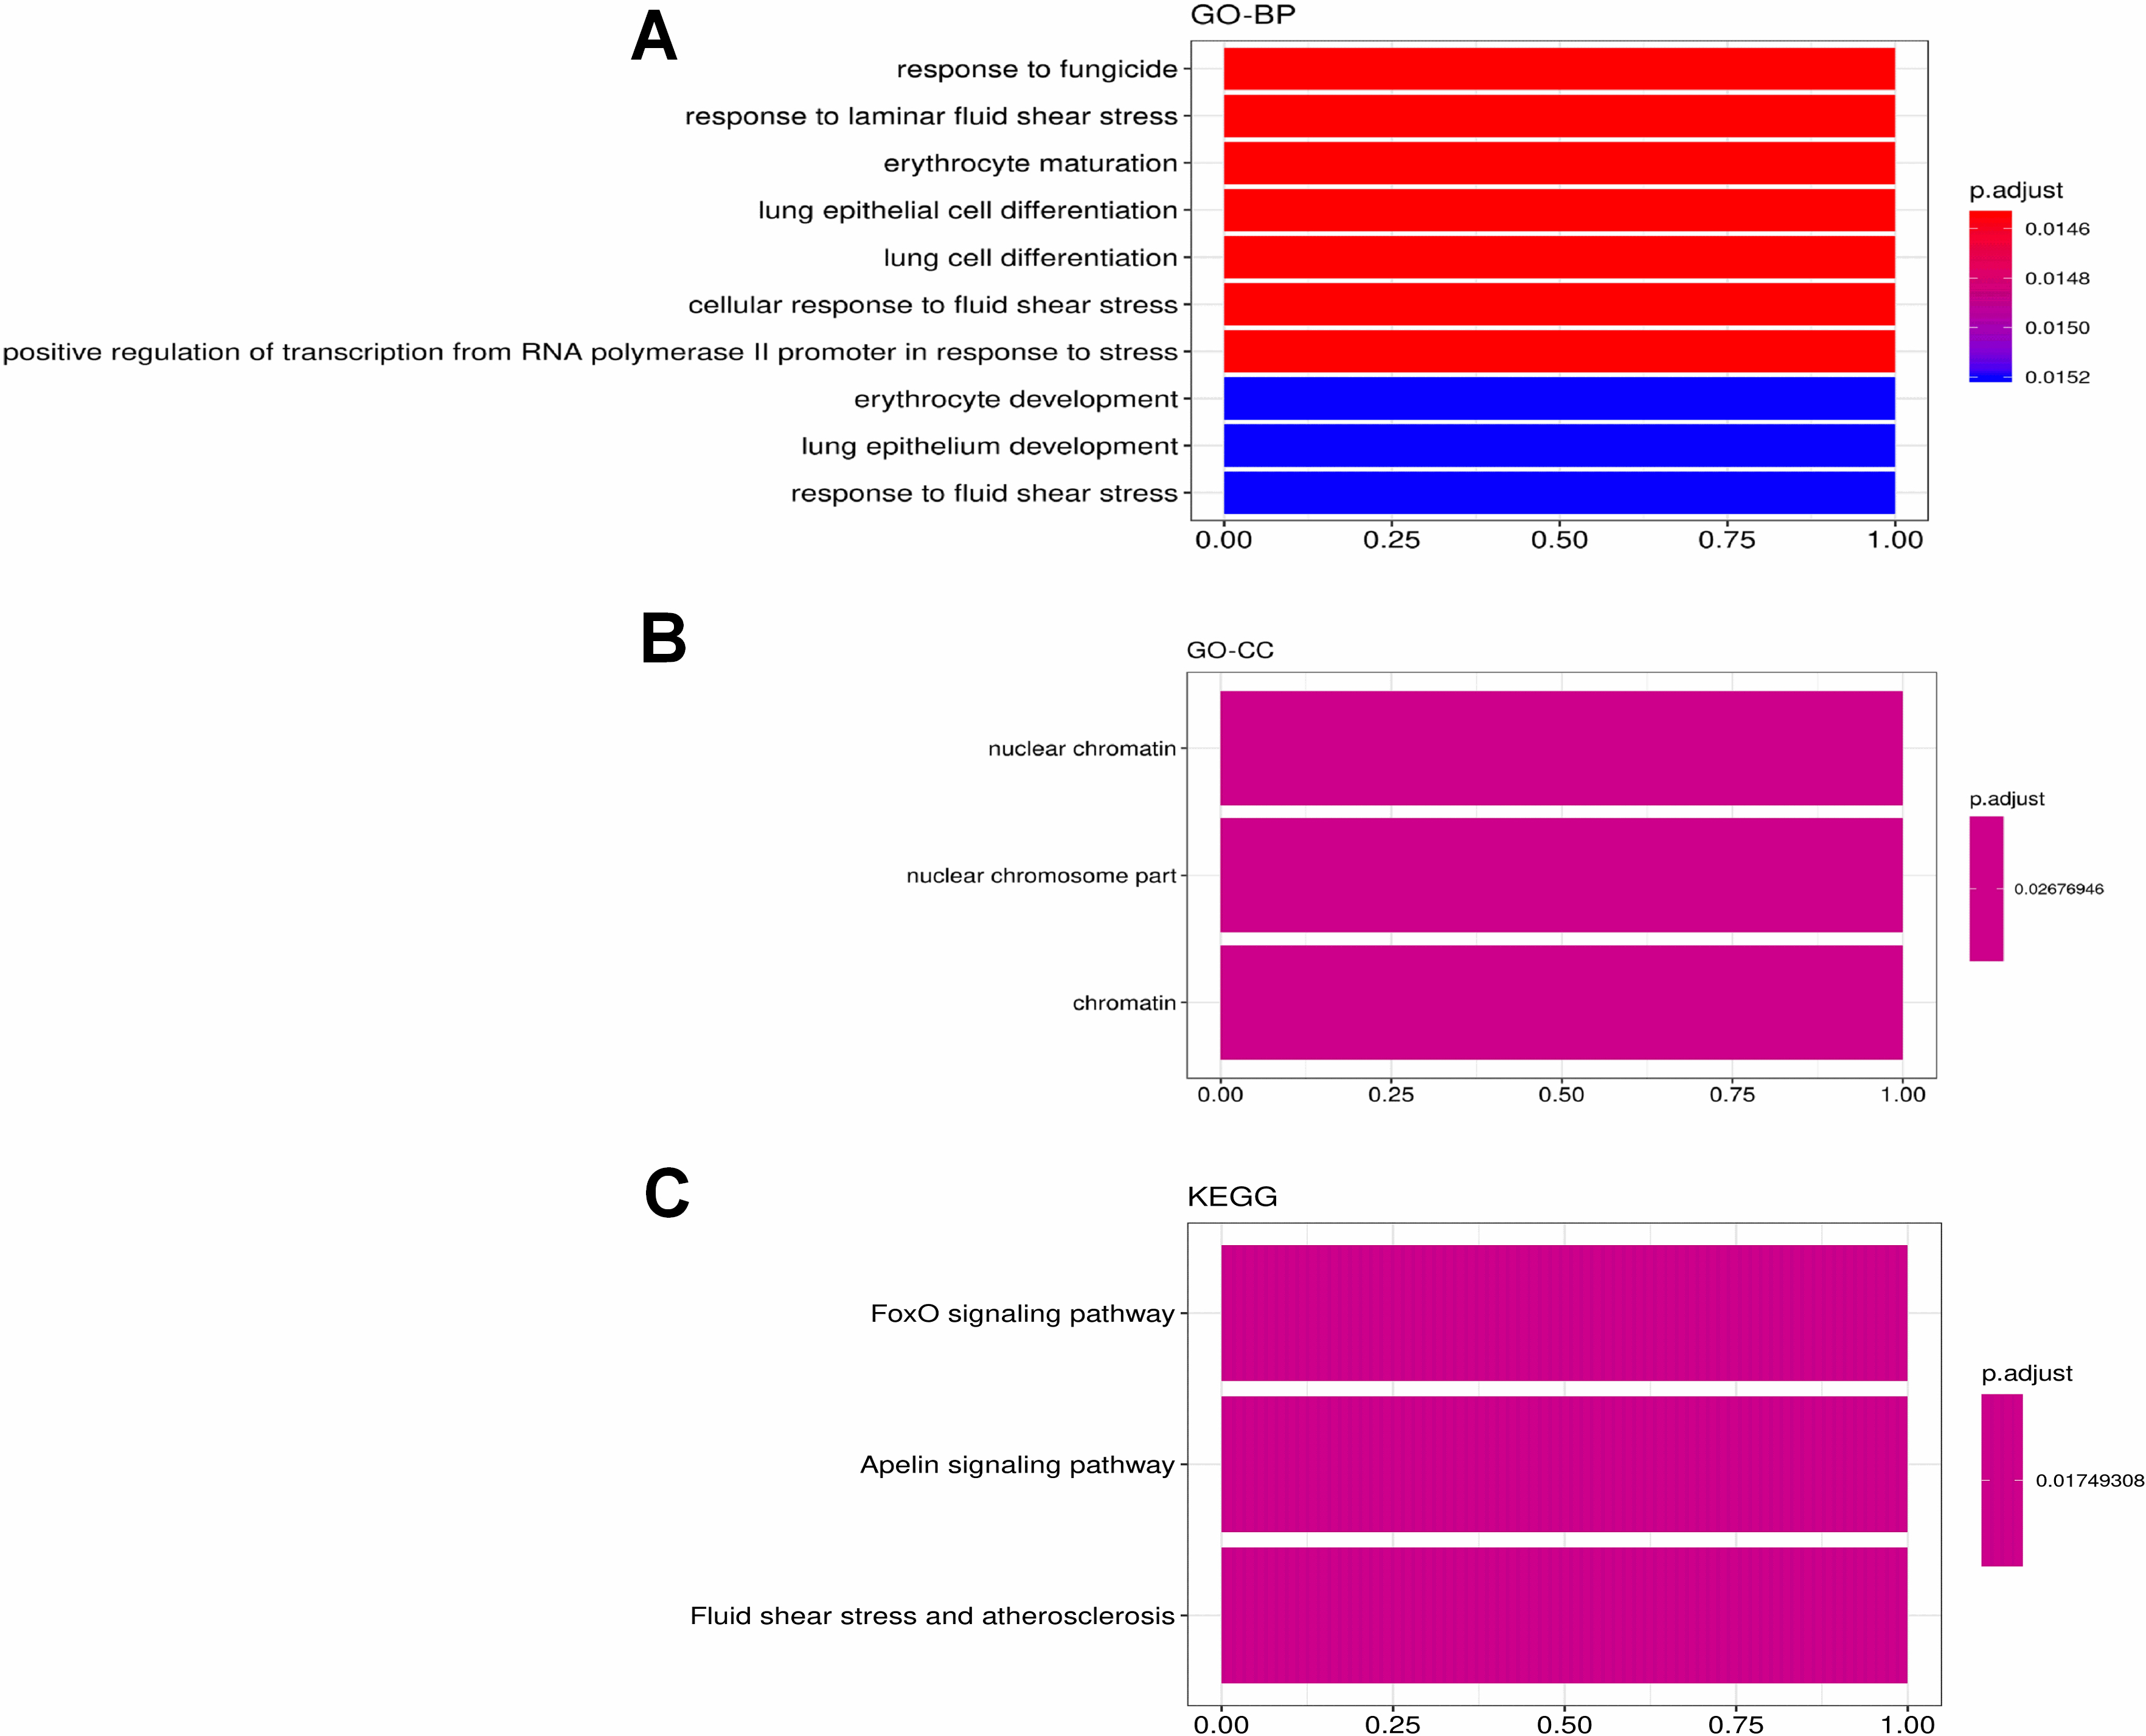
Figure 15.
Validation of genes in FAP TR and IT tissues, including CCL5, CD3G, CD2, TLR3 and KLF2.
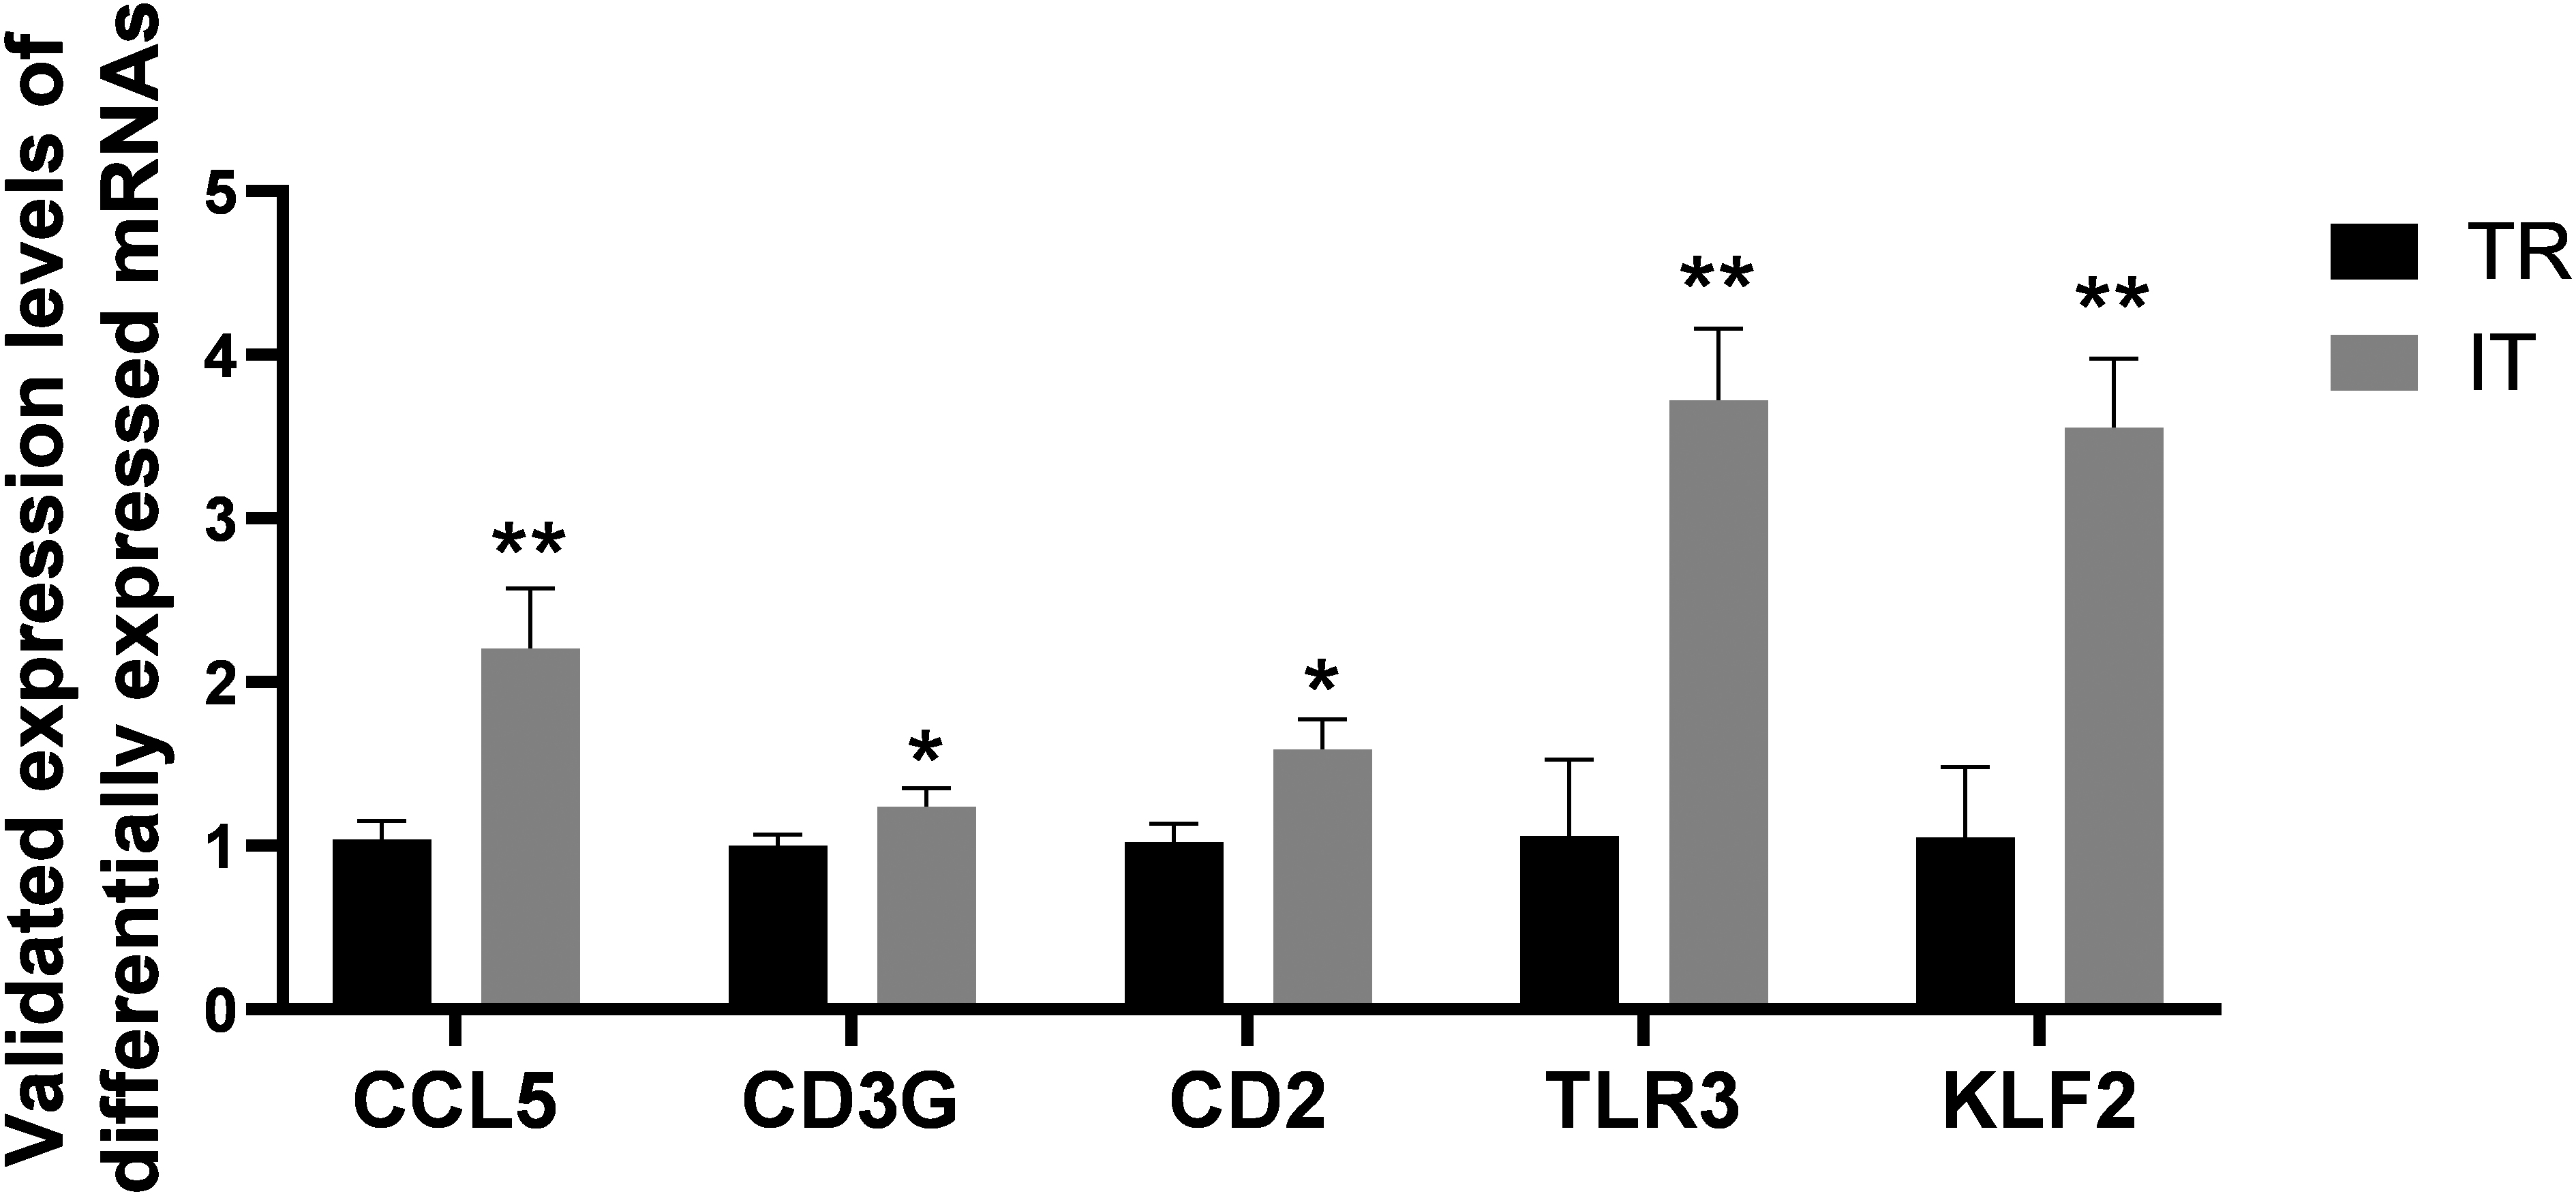
Figure 2A displays the volcano charts of DEGs expression variations in Case N and Ctrl A. The signal distribution of the plot indicates specific up-regulated (PCK1, SLC15A1, MIR2054) and down-regulated (CEACAM6, POF1B, RNF 43, NQO1, CD44, ANXA10, SNORD123, SLC12A2, CERS6, KIAA1324) transcripts. As shown in Fig. 2B, the differentially expressed genes between Case A with Ctrl A tissue, the specific up-regulated gene contained SNORA76, and down-regulated genes included FABP1, LOC399753, CPS1, DMBT1, AGAP7, ADH1C, SI, MIR548O2, LOC101060495, MIR548X). Figure 2C suggested that the expression of some genes was increased (GREM1, VTRNA2-1, MIR2054, MIR4759, THBS1, VTRNA1-3) whereas that of others was downregulated (ADH1C, CPS1, HMGCS2, PBLD, KIAA1324, CPS1-IT1, ADH4, ADH1A, EPHX2, SLC4A4) between Case C with Ctrl A. Compared Case A with Case N, the DGEs contained up-regulation (CEACAM6 and REG4) and down-regulation (RBP2, GSTA1, GSTA2, ALDOB, SLC15A1, ACE2, MEP1B and AKR1B10) genes (Fig. 2D). Then, compared Case C with Case N, the signal distribution of the plot indicates specific up-regulated (RBP2, ALDOB, APOB, GIP, GSTA1, GSTA2, FOLH1, FOLH1B, CREB3L3, SST) and down-regulated (CEACAM5, SLC2A1, MYOF, CEACAM6, PKM, SNORA71C, SNORA74A, GDF15, SPP1, SULF1) transcripts (Fig. 2E). The differentially expressed genes between Case C with Case A tissue, the specific up-regulated genes contained SULF1, VCAN-AS1, SPP1, POSTN, SNORD114-12, COL3A1, COL1A1, COL1A2, SPARC and GREM1, and down-regulated genes included DEFA5, DEFA6, ADH1C, HMGCS2, KIAA1324, MT1H, MT1G, CPS1 (Fig. 2F).
Hierarchical clustering heatmap was applied to reveal the DEGs profiles among two group, displayed differences in the mode of gene expression between both groups (Fig. 3). Figure 3 presents that these genes could distinctly separate all samples into two groups.
In order to understand their functionality, all of the DEGs were plotted against the terms of the GO database and subsequently compared to the entire reference database. The GO analysis results for the DEGs are presented in Fig. 4A. They were categorized into three groups, namely, the Cellular Component (CC), the Molecular Function (MF), together with the Biological Process (BP). It was revealed that these genes were linked to mRNA catabolic processes, neutrophil degranulation, as well as the neutrophil activation involved in the immune response. For further insight into the bio-functions of the genes determined and to categorize their functional annotations, remarkably enriched pathways were defined through comparison with KEGG database. When comparing case N with Ctrl A, the DEGs were enriched to Ribosome and PPAR signaling pathway. As shown in Fig. 4B, the findings presented that the genes were correlated with catabolic and metabolic process, annotated to digestion and absorption pathways. When comparing Case C vs Ctrl A, DEGs were associated with immune response, annotated to chemical carcinogenesis and metabolism (Fig. 4C). When comparing Case A vs Case N, DEGs were associated with catabolic and metabolic and annotated to metabolism pathways (Fig. 4D). Notably, when comparing Case C vs Case N, DEGs were associated with leukocyte migration (Fig. 4E), while the genes were associated with extracellular organization when comparing Case C vs Case A (Fig. 4F). Some pathways that are strongly associated with immunity were markedly enriched, for instance the “leukocyte migration and acute inflammatory”, which warranted to be further studied.
3.2Immunophenotype profiling
To reveal the status of immune infiltration in FAP, we tracked, analyzed and later validated the anti-cancer immune status and the ratio of tumor-infiltrating immune cells in the 7-step Cancer-Immunity Cycle through the Tracking Tumor Immunophenotype (TIP) website utilizing samples from patients with FAP. Figure 5A exhibited that in contrast to other groups, the scores of the first to third Cancer-Immunity Cycle steps corresponding to cancer cell antigen release (Step 1), the presentation of cancer antigens (Step 2), as well as excitation and activation (Step 3) were increased in Case C. The step 4, which corresponds to the trafficking of immune cells to the tumors showed significant alterations between the samples in each group. Specifically, immune activity scores corresponding to dendritic cell recruiting, Th1 cell recruiting, T cell recruiting, Treg cell recruiting, Th2 cell recruiting, and B cell recruiting raised, while scores corresponding to Th22 cell recruiting, CD8 T cell recruiting, CD4 T cell recruiting, neutrophil recruiting, monocyte recruiting, macrophage recruiting, eosinophil acidophil recruiting, NK cell recruiting, Th17 cell recruiting and basophil recruiting correspondingly declined significantly in both Case A and Case C. In FAP samples, immune cell infiltration of the tumors (Step 5) was diminished, while T cell recognition of cancer cells (Step 6) and killing of cancer cells (Step 7) revealed elevated immune activity scores. Analysis of the infiltration of immune cells in multiple samples (Fig. 5B) suggested that FAP samples mainly infiltrated by CD8 T cells, memory B cells, monocyte and naive B cells. The expression of signature gene on samples was depicted in the heatmap (Fig. 5C). With 48 samples, we identified signature genes participating in the cancer-immune cycle that exhibited diverse patterns of expression among Case A, Case C, Case N and Ctrl A samples (Fig. 5D).
3.3WGCNA analysis for identification of gene modules associated with FAP
After applying the “cluster” function to the expression matrix assessed via the averaging approach [20], a total of four samples including GSM3024207, GSM3024217, GSM3024218 and GSM3024211 whose cluster height above 0.05 were considered as deviations and were therefore excluded from the further analysis (Fig. 6A). R package “WGCNA” was employed to group similarly expressed genes into distinct modules. In this research,
3.4Construction of co-expression network and identification of hub genes in pink module
In pink module, the edges marking the correlations were filtered with the weight value
Furthermore, we entered these 161 genes into Enrich with a
3.5Function annotation of the midnight blue module of interest and the hub genes
Midnight blue module related to FAP was the darkest (cor
3.6Construction of co-expression network and identification of hub genes in midnight blue module
In midnight blue module, the edges marking the correlations were filtered with the weight value
At last, we merged the genes of the most significant correlation module with immune infiltration signature genes to obtain the potential biomarkers for FAP pathogenesis. For the most positive module (pink module), in total, four genes were eventually acquired which including CCL5, CD3G, CD2 and TLR3 (Fig. 13). GO analysis demonstrated that these four genes were linked to protein self-binding and T cell activation. Enrichment analysis of KEGG pathway suggested that the Toll-like receptor signaling pathway was the predominant enrichment pathway. CD3G is also a gene in pink module correlated to HNF4A, which is one of the types of TFs.
For the most negative module (midnight blue module), we identified only one gene (KLF2), which is also a hub gene in midnight blue correlated to Ctrl A (Fig. 14). KEGG pathway enrichment analysis indicated that FoxO signaling pathway was the most predominantly enriched.
The outcomes of qRT-PCR exhibited that among the genes of cancer-associated pathway, CD2, CD3G, CCL5, KLF2 and TLR3 were all dramatically upregulated in the FAP IT tissues versus tumor rim (TR) tissues (Fig. 15), pointing to their effects in the FAP progression.
4.Discussion
Patients with FAP are born with the germline mutation in APC gene that unavoidably progresses to hundreds of multi-stage precancerous adenomas in the rectum and colon. This characteristic allows FAP to serve as a natural model for investigating the adenoma-cancer metastasis process. At present, it is generally agreed that early intervention and early detection of high-risk human can benefit FAP patients [21, 22]. Therefore, to explore the early detection and early diagnosis of FAP is a hot topic in this field.
In order to uncover genes driving the pathogenesis of FAP, WGCNA and differential gene expression analysis were carried out based on GSE111156 data that is publicly available. Compare with Ctrl A, we found the most distinct genes in Case N were down-regulation of CEACAM6 and up-regulation of MIR2054. The most distinct DEGs between Case C and Ctrl A were ADH1C and VCAN-AS1. While compare with Case N, we found the most distinct genes in Case A were down-regulation of RBP2, ALDOB and up-regulation of CEACAM6, the most distinct genes in Case C were down-regulation of CEACAM5, SPP1 and up-regulation of RBP2, ALDOB, further compare with Case A, the most distinct genes in Case C were down-regulation of DEFA5, DEFA 6 and up-regulation of VCAN-AS1, SPP1. In summary, we could observe that VCAN-AS1, SPP1, RBP2, ALDOB, ADH1C significant differential expression occurred in different samples, which had never been reported to be associated with FAP. Both of ADH1C and VCAN-AS1 were revealed to be related with development of gastric cancer [23, 24]. Besides, ADH1C displayed high expression in the normal epithelium of FAP patients in contrast to that of patients with sporadic CRC. In our study, we found that ADH1C was down-regulation in Case C compare with Ctrl A, which provided a guess that ADH1C may be an adenoma-associated gene in FAP patients. Among the most DEGs, SPP1 was reported to be associated with immune infiltration [25]. Several studies revealed that CEACAM6 can used be a novel therapeutic target in many cancers, such as gastric cancer, pancreatic ductal adenocarcinoma and oral squamous cell carcinoma [26, 27, 28]. There are few reports about MIR2054. To the best of our knowledge, this research represents the first effort to determine key genes related to the oncogenesis and progress of FAP. The correlations of the pink and midnight blue modules with FAP were remarkably significant, thus we choose these two modules for further analysis. After constructing co-expression networks and the recognition of hub genes in midnight blue and pink module, we found 17 and 20 hub genes in midnight blue and pink module separately. In pink module, the most differentially expressed hub genes were APOB and CDHR5. It was reported that APOB participated in fat digestion and absorption, vitamin digestion and absorption. CDHR5 was related to cell adhesion together with the homologous cell adhesion through plasma membrane adhesion molecules. While, the most significant hub gene in midnight blue module was ZFP36, which was also identified as a hub gene associated with HTLV-I infection [29]. Furthermore, we identified five biomarkers (CCL5, CD3G, CD2, TLR3 and KLF2) by merging the immune infiltration signature genes with the genes of the most significant module with FAP. All of the biomarkers have never been reported to be associated with FAP before, which may provide new predictive and diagnostic targets for the cancerization of FAP.
In our study, for the first time, we have determined a group of genes connected to tumor infiltration and FAP. CCL5 is a subfamily CC member that serves as a chemoattractant for monocytes, eosinophils as well as memory T helper cells in the blood. It also enables the histamine release from basophils and activates eosinophils [30]. CD3G could influence activation and stimulation of T cell. CD2 is involved in the leukocyte migration, activation of T cell [31] and T cell differentiation modulation [32]. TLR3 could mediate the production of cytokines necessary for the development of effective immunity. KLF2 could also negatively regulate production of interleukin-6 and participant immune infiltration [33]. These genes can be used as markers of adenoma infiltration, providing new targets for clinical diagnosis.
Nonetheless, it should be recognized that there are limitations to our research and that additional clinical samples were needed to verify our results and clarify the underlying mechanisms. In our future work, we will concentrate on this issue.
5.Conclusions
Through co-expression analysis, we identified five biomarkers including CCL5, CD3G, CD2, TLR3 and KLF2 based on GSE111156 dataset. The findings of the functional enrichment analysis exhibited that such genes may participate pathogenesis of FAP by modulating the toll-like receptor and foxO signaling pathway. These results may have important clinical significance in improving cancer prediction in patients with FAP.
Ethics statement
The Ethics Committee of our institution approved the study (ethical approval number: 2022-L-271). All patients provided informed consent in writing. The Research Ethics Board approved the consent procedure.
Availability of data and materials
All the data produced or analyzed during the current work are included in this published article.
Competing interests
The authors state that there are no competing interests.
Funding
This work was supported by the National Natural Science Foundation of China (No. 81960100 and No. 82160533), the Applied Basic Foundation of Yunnan Province (No. 202001AY070001-192 and No. 202001AT070009), the Young and Middle-aged Academic and Technical Leaders Reserve Talents Program in Yunnan Province (No. 202205AC160045), and the Yunnan Health Training Project of High Level Talents (No. D-2019032).
Author contributions
Wan Rong Lin and Wei Qing Liu wrote the manuscript and interpreted the data. Xiao Ting Liu, Xuan Yu Meng, Lei Liang and Wen Liang Li provided contributions to the data analysis and interpretation. Jun Yang conceived and designed the study. All authors reviewed and approved the manuscript in its final form.
Acknowledgments
None to report.
References
[1] | Perea Garcia J, Arribas J, Canete A, Garcia JL, Alvaro E, Tapial S, et al. Association of polyps with early-onset colorectal cancer and throughout surveillance: Novel clinical and molecular implications. Cancers (Basel). (2019) ; 11: (12). |
[2] | van Neerven SM, de Groot NE, Nijman LE, Scicluna BP, van Driel MS, Lecca MC, et al. Apc-mutant cells act as supercompetitors in intestinal tumour initiation. Nature. (2021) ; 594: (7863): 436-41. |
[3] | Ditonno I, Novielli D, Celiberto F, Rizzi S, Rendina M, Ierardi E, et al. Molecular pathways of carcinogenesis in familial adenomatous polyposis. Int J Mol Sci. (2023) ; 24: (6). |
[4] | Stevanato Filho PR, Aguiar Junior S, Begnami MD, Ferreira FO, Nakagawa WT, Spencer R, et al. Estrogen receptor beta as a prognostic marker of tumor progression in colorectal cancer with familial adenomatous polyposis and sporadic polyps. Pathol Oncol Res. (2018) ; 24: (3): 533-40. |
[5] | Flisikowski K, Perleberg C, Niu G, Winogrodzki T, Bak A, Liang W, et al. Wild-type APC influences the severity of familial adenomatous polyposis. Cell Mol Gastroenterol Hepatol. (2022) ; 13: (2): 669-71 e3. |
[6] | Schatoff EM, Goswami S, Zafra MP, Foronda M, Shusterman M, Leach BI, et al. Distinct colorectal cancer-associated APC mutations dictate response to tankyrase inhibition. Cancer Discov. (2019) ; 9: (10): 1358-71. |
[7] | Short E, Thomas LE, Davies A, Bolton A, Maynard J, Giles P, et al. APC transcription studies and molecular diagnosis of familial adenomatous polyposis. Eur J Hum Genet. (2020) ; 28: (1): 118-21. |
[8] | Tajika M, Tanaka T, Oonishi S, Yamada K, Kamiya T, Mizuno N, et al. Endoscopic management of adenomas in the ileal pouch and the rectal remnant after surgical treatment in familial adenomatous polyposis. J Clin Med. (2022) ; 11: (12). |
[9] | Shen B, Kochhar GS, Kariv R, Liu X, Navaneethan U, Rubin DT, et al. Diagnosis and classification of ileal pouch disorders: Consensus guidelines from the International Ileal Pouch Consortium. Lancet Gastroenterol Hepatol. (2021) ; 6: (10): 826-49. |
[10] | Aelvoet AS, Roos VH, Bastiaansen BAJ, Hompes R, Bemelman WA, Aalfs CM, et al. Development of ileal adenomas after ileal pouch-anal anastomosis versus end ileostomy in patients with familial adenomatous polyposis. Gastrointest Endosc. (2023) ; 97: (1): 69-77 e1. |
[11] | Ng KS, Gonsalves SJ, Sagar PM. Ileal-anal pouches: A review of its history, indications, and complications. World J Gastroenterol. (2019) ; 25: (31): 4320-42. |
[12] | Stevanato Filho PR, Aguiar Junior S, Begnami MD, Kuasne H, Spencer RM, Nakagawa WT, et al. Oestrogen receptor beta isoform expression in sporadic colorectal cancer, familial adenomatous polyposis and progressive stages of colorectal cancer. BMC Cancer. (2017) ; 17: (1): 754. |
[13] | Delker DA, Wood AC, Snow AK, Samadder NJ, Samowitz WS, Affolter KE, et al. Chemoprevention with cyclooxygenase and epidermal growth factor receptor inhibitors in familial adenomatous polyposis patients: mRNA signatures of duodenal neoplasia. Cancer Prev Res (Phila). (2018) ; 11: (1): 4-15. |
[14] | Khattak MA, Martin H, Davidson A, Phillips M. Role of first-line anti-epidermal growth factor receptor therapy compared with anti-vascular endothelial growth factor therapy in advanced colorectal cancer: A meta-analysis of randomized clinical trials. Clin Colorectal Cancer. (2015) ; 14: (2): 81-90. |
[15] | Stier Q, Thrun MC. Deriving Homogeneous Subsets from Gene Sets by Exploiting the Gene Ontology. Informatica. (2023) ; 357-86. |
[16] | Li J, Wang R, Zhou X, Wang W, Gao S, Mao Y, et al. Genomic and transcriptomic profiling of carcinogenesis in patients with familial adenomatous polyposis. Gut. (2019) . |
[17] | Delker DA, McGettigan BM, Kanth P, Pop S, Neklason DW, Bronner MP, et al. RNA sequencing of sessile serrated colon polyps identifies differentially expressed genes and immunohistochemical markers. PLoS One. (2014) ; 9: (2): e88367. |
[18] | Abu-Jamous B, Kelly S. Clust: Automatic extraction of optimal co-expressed gene clusters from gene expression data. Genome Biol. (2018) ; 19: (1): 172. |
[19] | Videlock EJ, Hatami A, Zhu C, Kawaguchi R, Chen H, Khan T, et al. Distinct Patterns of Gene Expression Changes in the Colon and Striatum of Young Mice Overexpressing Alpha-Synuclein Support Parkinson’s Disease as a Multi-System Process. Journal of Parkinson’s Disease. (2023) ; 1-21. |
[20] | Yao Q, Song Z, Wang B, Qin Q, Zhang JA. Identifying key genes and functionally enriched pathways in sjogren’s syndrome by weighted gene co-expression network analysis. Front Genet. (2019) ; 10: : 1142. |
[21] | Barberio B, Savarino E, Verstockt B, Fumery M, Pugliese D, Bertani L, et al. Hereditary colorectal cancer syndromes and inflammatory bowel diseases: An ECCO CONFER multicentre case series. J Crohns Colitis. (2022) ; 16: (12): 1845-52. |
[22] | Cruz-Correa M, Hylind LM, Marrero JH, Zahurak ML, Murray-Stewart T, Casero RA, Jr., et al. Efficacy and safety of curcumin in treatment of intestinal adenomas in patients with familial adenomatous polyposis. Gastroenterology. (2018) ; 155: (3): 668-73. |
[23] | Chen Q, Li F, Gao Y, Xu G, Liang L, Xu J. Identification of energy metabolism genes for the prediction of survival in hepatocellular carcinoma. Front Oncol. (2020) ; 10: : 1210. |
[24] | Feng L, Li J, Li F, Li H, Bei S, Zhang X, et al. Long noncoding RNA VCAN-AS1 contributes to the progression of gastric cancer via regulating p53 expression. J Cell Physiol. (2020) ; 235: (5): 4388-98. |
[25] | Christensen SM, Belew AT, El-Sayed NM, Tafuri WL, Silveira FT, Mosser DM. Host and parasite responses in human diffuse cutaneous leishmaniasis caused by L. amazonensis. PLoS Negl Trop Dis. (2019) ; 13: (3): e0007152. |
[26] | Chiang WF, Cheng TM, Chang CC, Pan SH, Changou CA, Chang TH, et al. Carcinoembryonic antigen-related cell adhesion molecule 6 (CEACAM6) promotes EGF receptor signaling of oral squamous cell carcinoma metastasis via the complex N-glycosylation. Oncogene. (2018) ; 37: (1): 116-27. |
[27] | Ru GQ, Han Y, Wang W, Chen Y, Wang HJ, Xu WJ, et al. CEACAM6 is a prognostic biomarker and potential therapeutic target for gastric carcinoma. Oncotarget. (2017) ; 8: (48): 83673-83. |
[28] | Pandey R, Zhou M, Islam S, Chen B, Barker NK, Langlais P, et al. Carcinoembryonic antigen cell adhesion molecule 6 (CEACAM6) in Pancreatic Ductal Adenocarcinoma (PDA): An integrative analysis of a novel therapeutic target. Sci Rep. (2019) ; 9: (1): 18347. |
[29] | Luo S, Cao N, Tang Y, Gu W. Identification of key microRNAs and genes in preeclampsia by bioinformatics analysis. PLoS One. (2017) ; 12: (6): e0178549. |
[30] | Xia Y, Zhou L, Yang HC, Yu CW. Chemokine CCL5 immune subtypes of human liver cancer with prognostic significance. Int Immunopharmacol. (2022) ; 113: (Pt A): 109372. |
[31] | Li B, Lu Y, Zhong MC, Qian J, Li R, Davidson D, et al. Cis interactions between CD2 and its ligands on T cells are required for T cell activation. Sci Immunol. (2022) ; 7: (74): eabn6373. |
[32] | Orlik C, Deibel D, Kublbeck J, Balta E, Ganskih S, Habicht J, et al. Keratinocytes costimulate naive human T cells via CD2: A potential target to prevent the development of proinflammatory Th1 cells in the skin. Cell Mol Immunol. (2020) ; 17: (4): 380-94. |
[33] | Chrysanthopoulou A, Antoniadou C, Natsi AM, Gavriilidis E, Papadopoulos V, Xingi E, et al. Down-regulation of KLF2 in lung fibroblasts is linked with COVID-19 immunofibrosis and restored by combined inhibition of NETs, JAK-1/2 and IL-6 signaling. Clin Immunol. (2023) ; 247: : 109240. |
[34] | Lee II, Maniar K, Lydon JP, Kim JJ. Akt regulates progesterone receptor B-dependent transcription and angiogenesis in endometrial cancer cells. Oncogene. (2016) ; 35: (39): 5191-201. |
[35] | Ritchie ME, Phipson B, Wu D, Hu Y, Law CW, Shi W, et al. limma powers differential expression analyses for RNA-sequencing and microarray studies. Nucleic Acids Res. (2015) ; 43: (7): e47. |
[36] | Di Z, Zhou S, Xu G, Ren L, Li C, Ding Z, et al. Single-cell and WGCNA uncover a prognostic model and potential oncogenes in colorectal cancer. Biol Proced Online. (2022) ; 24: (1): 13. |
[37] | Rezaei Z, Ranjbaran J, Safarpour H, Nomiri S, Salmani F, Chamani E, et al. Identification of early diagnostic biomarkers via WGCNA in gastric cancer. Biomed Pharmacother. (2022) ; 145: : 112477. |
[38] | Clark KEN, Csomor E, Campochiaro C, Galwey N, Nevin K, Morse MA, et al. Integrated analysis of dermal blister fluid proteomics and genome-wide skin gene expression in systemic sclerosis: An observational study. Lancet Rheumatol. (2022) ; 4: (7): e507-e16. |
[39] | Wang CCN, Li CY, Cai JH, Sheu PC, Tsai JJP, Wu MY, et al. Identification of prognostic candidate genes in breast cancer by integrated bioinformatic analysis. J Clin Med. (2019) ; 8: (8). |
[40] | Xu L, Deng C, Pang B, Zhang X, Liu W, Liao G, et al. TIP: A web server for resolving tumor immunophenotype profiling. Cancer Res. (2018) ; 78: (23): 6575-80. |
[41] | Sturm G, Finotello F, Petitprez F, Zhang JD, Baumbach J, Fridman WH, et al. Comprehensive evaluation of transcriptome-based cell-type quantification methods for immuno-oncology. Bioinformatics. (2019) ; 35: (14): i436-i45. |
[42] | Clancy T, Hovig E. Profiling networks of distinct immune-cells in tumors. BMC Bioinformatics. (2016) ; 17: (1): 263. |
[43] | Xie Z, Bailey A, Kuleshov MV, Clarke DJB, Evangelista JE, Jenkins SL, et al. Gene set knowledge discovery with enrichr. Curr Protoc. (2021) ; 1: (3): e90. |
[44] | Chairta PP, Nicolaou P, Christodoulou K. Enrichr in silico analysis of MS-based extracted candidate proteomic biomarkers highlights pathogenic pathways in systemic sclerosis. Sci Rep. (2023) ; 13: (1): 1934. |
[45] | Gene Ontology C. The Gene Ontology resource: Enriching a GOld mine. Nucleic Acids Res. (2021) ; 49: (D1): D325-D34. |
[46] | Kanehisa M, Furumichi M, Sato Y, Kawashima M, Ishiguro-Watanabe M. KEGG for taxonomy-based analysis of pathways and genomes. Nucleic Acids Res. (2023) ; 51: (D1): D587-D92. |
[47] | Xie L, Wu S, He R, Li S, Lai X, Wang Z. Identification of epigenetic dysregulation gene markers and immune landscape in kidney renal clear cell carcinoma by comprehensive genomic analysis. Front Immunol. (2022) ; 13: : 901662. |
[48] | Qiu P, Guo Q, Yao Q, Chen J, Lin J. Characterization of exosome-related gene risk model to evaluate the tumor immune microenvironment and predict prognosis in triple-negative breast cancer. Front Immunol. (2021) ; 12: : 736030. |


