
A machine learning prediction model for cancer risk in patients with type 2 diabetes based on clinical tests
Abstract
BACKGROUND:
The incidence of type 2 diabetes is rapidly increasing worldwide. Studies have shown that it is also associated with cancer-related morbidities. Early detection of cancer in patients with type 2 diabetes is crucial.
OBJECTIVE:
This study aimed to construct a model to predict cancer risk in patients with type 2 diabetes.
METHODS:
This study collected clinical data from a total of 5198 patients. A cancer risk prediction model was established by analyzing 261 items from routine laboratory tests. We screened 107 risk factors from 261 clinical tests based on the importance of the characteristic variables, significance of differences between groups (
RESULTS:
Compared with 16 machine learning classifiers, five classifiers based on the decision tree algorithm (CatBoost, light gradient boosting, random forest, XGBoost, and gradient boosting) had an area under the receiver operating characteristic curve (AUC) of
CONCLUSION:
The constructed model can predict the risk of cancer in patients with type 2 diabetes based on tumor biomarkers and routine tests using machine learning algorithms. This is helpful for early cancer risk screening and prevention to improve patient outcomes.
1.Introduction
Over the past two decades, the incidence of type 2 diabetes and its complications have rapidly increased worldwide, accounting for 90% of all diabetes cases [1]. As this trend continues, the incidence of cancer among patients with type 2 diabetes has increased significantly [2]. A number of large-scale epidemiological studies and meta-analyses have demonstrated that type 2 diabetes is associated with the development of various cancers, including pancreatic, colorectal, thyroid, esophageal, and gynecological cancers [3, 4, 5, 6, 7]. Moreover, research indicates that this association may be attributed to hyperglycemia and hyperinsulinemia [8]. Since different cancers have different manifestations and characteristics, they are difficult to identify in patients with diabetes through routine screening. If one can comprehensively analyze and fully utilize the relevant laboratory indicators in patients with type 2 diabetes, the risk of cancer in patients with type 2 diabetes can be predicted.
Machine learning, an important field of artificial intelligence, is a general term for a class of algorithms that can learn from numerous datasets to predict the characteristics of new samples and perform required tasks [9]. A previous study by Choudhury [10] demonstrated the effectiveness of artificial intelligence algorithms in evaluating the early diagnosis and prognosis of tumors. Furthermore, artificial intelligence has been shown to assist greatly in cancer screening even when using the clinical data of patients alone [11]. Compared to traditional statistical methods, machine learning performs more objectively in classification and prediction, with better classification results. Currently, there are various machine learning algorithms based on different weak learners, such as logistic regression, naive Bayes, support vector machines, and decision tree classifiers. A previous study found that a sub-discipline of machine learning requiring less user input but more data and processing power has provided great promise in assisting physicians in achieving accurate diagnoses [12]. Furthermore, classifiers such as the multilayer perceptron (MLP), random forest (RF), and decision tree (DT) can accurately predict the survival of patients with cancer [13]. More and more machine learning methods have been applied in cancer diagnosis and prognosis and have shown great potential [14, 15, 16].
This study aimed to establish a machine-learning prediction model by selecting important features and predicting the risk of cancer in patients with type 2 diabetes based on tumor markers and other routine laboratory tests.
2.Materials and methods
2.1Sample information
The data for this study were collected from June 2013 to September 2022 from all hospitalized patients diagnosed with type 2 diabetes at the Shaanxi Provincial People’s Hospital. This study was approved by the Ethics Committee of the Shaanxi Provincial People’s Hospital. All participants were fully informed about the study and provided written informed consent.
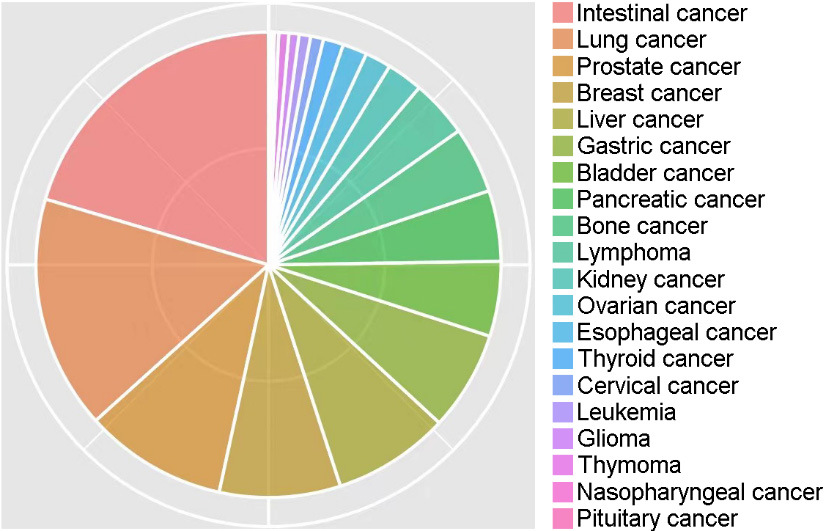
Of the 100120 cases, 9352 (9.34%) were patients with cancer. According to statistics, the cancer types mainly included intestinal (20.4%), lung (16.2%), prostate (9.9%), breast (8.4%), liver (8.1%), gastric (6.9%), bladder (5.2%), pancreatic (4.9%), bone (4.6%), lymphoma (4.0%), kidney (2.5%), ovarian (1.8%), esophageal (1.7%), thyroid (1.4%), cervical (0.9%), leukemia (0.8%), glioma (0.7%), thymoma (0.7%), nasopharyngeal (0.3%), and pituitary (0.2%) cancer, comprising 20 different types of cancer (Fig. 1).
Figure 1.
Percentages of 20 different types of cancer in this study.
2.2Quality control
2.2.1Missing value control and filling
A total of 1381 variables of relevant clinical data were extracted. Variables with missing values exceeding 50% in the both groups were gradually excluded. Patients were excluded if the missing value rate exceeded 20%. Adjacent individual values were used for quantitative variables. For categorical variables, missing values were randomly filled in using the proportion of categories.
2.2.2Data matching
The K-means algorithm cluster matching method was used to match the data of the cancer and non-cancer groups based on age and sex. The basic method of cluster matching is to use the K-means algorithm to cluster the observation group into different subgroups and obtain the grouping rules. According to grouping rules, control patients were grouped based on the lowest value of the same type ratio (1:1) as cases [20].
2.3Feature selection
Feature selection methods are used to remove redundant features from all available features to improve the efficiency of machine-learning models and reduce overfitting. Important feature combinations were effectively identified and validated by combining significance tests (
The MDL algorithm considers each relevant variable as a simple predictive model and compares and scores these individual models using their respective MDL measures to determine the relevant variables. The formula used was: Si (Modeli, D)
Ultimately, the following criteria were used to select important features (laboratory indicators) for modeling: 1) features discovered by the feature selection algorithm are preferred features; 2) selected features should cover as many different aspects of routine checks as possible, such as blood routine, liver and kidney function, and electrolytes; 3) selected features should be as independent of each other as possible, i.e., they should reduce multicollinearity and multivariate correlation as much as possible; 4) the number of features should be proportional to the amount of data; and 5) medical expertise and practical experience should be considered.
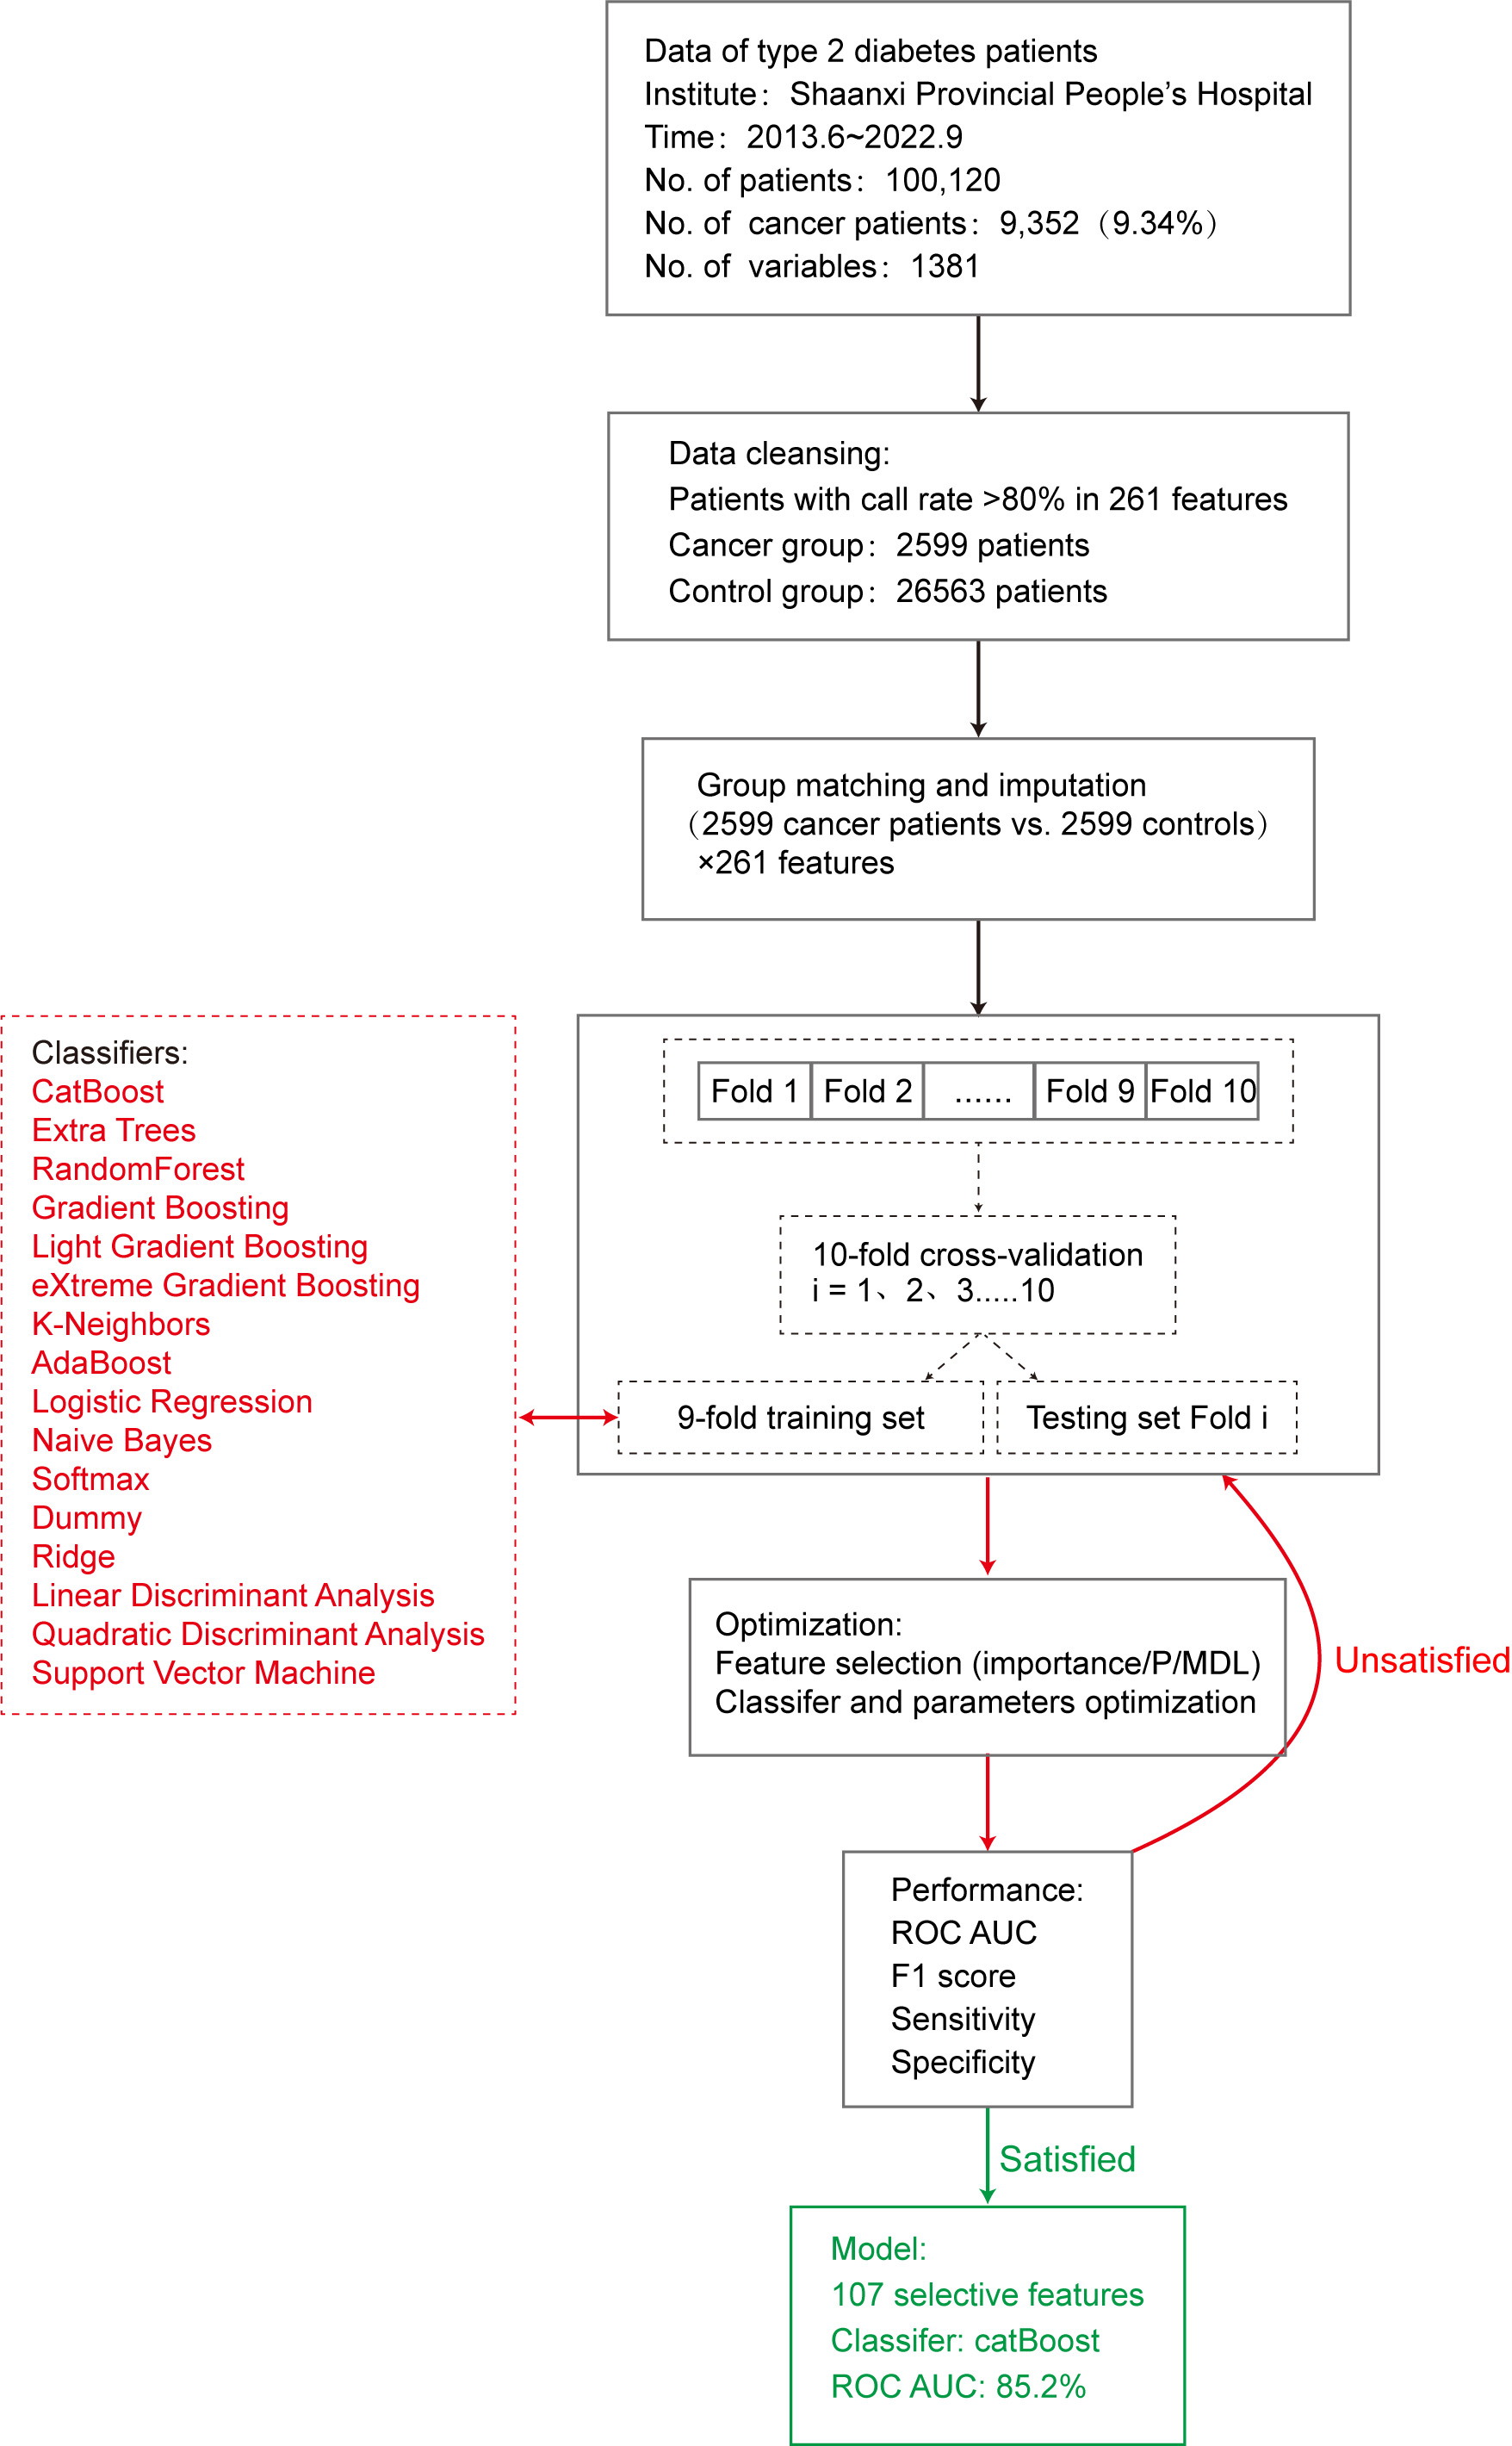
Figure 2.
Construction of the machine-learning predictive model.
2.4Model construction
This study used 16 machine learning algorithm classifiers, including logistic regression, softmax, and dummy classifiers based on the principles of logistic regression, linear discriminant analysis, quadratic discriminant analysis, ridge, support vector machine (SVM), k-neighbors, naive Bayes, and decision tree classifiers such as random forest, adaptive boosting (AdaBoost), CatBoost, extra trees, light gradient boosting, gradient boosting, and extreme gradient boosting (XGBoost). Figure 2 shows the specific modeling process using the 10-fold cross-validation method with 90% of the data as the training set and 10% as the test set. The following is a brief introduction to different types of classifiers.
2.4.1Logistic regression
Logistic regression [22] estimates the probability of an event occurring by fitting the data to a sigmoid function. For probability values between 0 and 1, a prediction of 1 was made when the probability was greater than 0.5, whereas a prediction of 0 was made when the probability was less than 0.5. The R
2.4.2Linear discriminant analysis
Linear discriminant analysis and quadratic discriminant analysis have similar algorithmic features and can determine whether to use a quadratic model based on whether the covariance matrices of different classification samples are the same. Ridge regression is based on the principle of least squares and has practical value for overcoming the problem of feature collinearity by simultaneously imposing regularization constraints on each feature coefficient.
2.4.3Naive Bayes
The naive Bayes model [23] is based on the Bayesian theorem of conditional independence, which assumes that each input variable can be independently estimated as a one-dimensional variable. The posterior probability distribution is calculated for a given test set by learning the prior and conditional probability distributions from the training dataset. The classification with the maximum posterior probability is the result. In this study, the naive Bayes function in the klaR package was used to build the prediction model.
2.4.4SVM
SVM [24] can theoretically achieve optimal classification of linearly separable data. Their basic model defines a linear classifier with the maximum margin in the feature space, which can be transformed into a convex quadratic programming problem to be solved. The SVM function in the e1071 package in R
2.4.5Decision tree
Various classifiers based on decision trees have been developed, including random forest, AdaBoost, and gradient boosting. Random forest [25] is a bagging ensemble algorithm based on the decision tree algorithm, which separately models each sample using resampling methods to generate multiple decision trees. The result is the mode of the predicted result. Overfitting is less likely to occur owing to the characteristics of random forests. The model was built using the importance function, replicate function, and random forest function in randomForest
AdaBoost is a representative boosting ensemble algorithm. It iteratively trains weak classifiers (usually decision trees), and assigns higher weights to misclassified samples from the previous layer of weak classifiers during training. The dataset was redefined for training, and the results were obtained by weighting each weak classifier. The model was built using the boosting function in the adabag package of R
Gradient-boosting ensemble algorithms, such as CatBoost and XGBoost, achieve accurate classification results through iterative calculations of weak classifiers and aggregates the conclusions of multiple decision trees as the final prediction result. It is suitable for running large-scale data; however, its computation is relatively time-consuming.
2.5Evaluation of prediction models
Following completion of model construction, the model performance was evaluated. In this study, 10% of data randomly selected from the original queue data was used as the test set to evaluate the classification performance of the model using parameters such as accuracy, sensitivity, specificity [26], and F1 score [27]. In addition, we used the area under the curve (AUC) of the receiver operating characteristic (ROC) curve [28] to evaluate model efficiency. The AUC of the ROC is between 0 and 1, and the closer the AUC value is to 1, the better the classification performance of the model.
3.Results
3.1Preliminary model performance
To construct the model, the cancer group included cases diagnosed with type 2 diabetes and various types of cancer (excluding heart disease, kidney disease, hypertension, arteriosclerosis, and hyperlipidemia). A total of 2599 patients with 261 routine clinical laboratory indicators were included, with a detection rate of
To predict the possibility of cancer occurrence in patients with type 2 diabetes, we introduced 16 machine learning classifiers and constructed and evaluated a risk prediction model for cancer in patients with type 2 diabetes using 5198 patients with 261 clinical variables. First, all 261 feature variables were included in the model and the accuracy of the 16 classifiers varied from 0.508 (dummy) to 0.739 (CatBoost). The AUC values ranged from 0.530 to 0.818. To further improve model performance and reduce the impact of possible overfitting on classification performance, we conducted a feature selection process.
3.2Feature selection
We extracted 107 important features through a comprehensive comparison of differences in
Table 1
Statistics and importance of the 107 selected features
| Patients with type 2 diabetes, Mean (SD) | ||||||||
|---|---|---|---|---|---|---|---|---|
| Feature variables | Total (5198) | Non-cancer group (2599) | Cancer group (2599) | Importance | ||||
| Neuron-specific enolase | 14.934 | (17.709) | 11.902 | (6.656) | 17.967 | (23.762) | 4.462 | |
| Alpha-fetoprotein (AFP) | 15.941 | (100.903) | 4.109 | (30.551) | 27.773 | (138.396) | 4.110 | |
| CA-125 (carbohydrate antigen 125) | 6.894 | (26.765) | 3.888 | (10.794) | 9.900 | (36.034) | 2.572 | |
| CA15-3 (carbohydrate antigen 15-3) | 12.794 | (25.888) | 9.220 | (8.972) | 16.368 | (35.136) | 2.549 | |
| CA72-4 (carbohydrate antigen 72-4) | 0.495 | (2.253) | 0.420 | (1.624) | 0.571 | (2.739) | 0.016 | 2.425 |
| Characteristic variable | 68.061 | (12.220) | 66.615 | (13.024) | 69.508 | (11.177) | 2.076 | |
| Fibrinogen (or fibrin) degradation products | 53.919 | (233.679) | 27.204 | (96.430) | 80.635 | (313.858) | 1.980 | |
| Hematocrit measurement | 226.336 | (254.639) | 225.756 | (250.649) | 226.915 | (258.615) | 0.870 | 1.929 |
| Hemoglobin measurement | 26.285 | (847.005) | 3.254 | (24.197) | 49.316 | (1197.274) | 0.050 | 1.849 |
| Lipoprotein (a) | 1.456 | (0.779) | 1.615 | (0.757) | 1.296 | (0.767) | 1.759 | |
| Absolute lymphocyte count | 0.364 | (0.070) | 0.383 | (0.067) | 0.346 | (0.067) | 1.734 | |
| Neuron-specific enolase | 120.357 | (23.905) | 126.499 | (23.234) | 114.215 | (22.975) | 1.722 | |
| Fibrin degradation products (FDP) | 6.757 | (18.445) | 4.993 | (18.353) | 8.521 | (18.372) | 1.671 | |
| Red cell distribution width (RDW) | 0.196 | (0.079) | 0.200 | (0.070) | 0.192 | (0.088) | 1.559 | |
| Carcinoembryonic antigen (CEA) | 64.747 | (8.190) | 64.997 | (7.569) | 64.497 | (8.762) | 0.028 | 1.521 |
| Platelet volume fraction | 3.931 | (10.704) | 4.010 | (10.362) | 3.853 | (11.038) | 0.597 | 1.496 |
| Activated partial thromboplastin time | 32.339 | (8.242) | 32.219 | (7.653) | 32.459 | (8.791) | 0.294 | 1.481 |
| Thyroid-stimulating hormone (TSH) | 3.459 | (6.637) | 3.452 | (5.886) | 3.466 | (7.312) | 0.940 | 1.434 |
| Retinol-binding protein (RBP) | 37.708 | (18.072) | 40.928 | (18.179) | 34.489 | (17.381) | 1.416 | |
| Myoglobin | 77.525 | (288.505) | 81.020 | (303.085) | 74.030 | (273.163) | 0.382 | 1.320 |
| Total bile acids (TBA) | 8.863 | (23.144) | 6.293 | (11.544) | 11.433 | (30.415) | 1.320 | |
| Mean corpuscular hemoglobin concentration (MCHC) | 30.361 | (2.796) | 30.478 | (2.235) | 30.243 | (3.257) | 0.002 | 1.281 |
| Free triiodothyronine (FT3) | 4.677 | (1.170) | 4.742 | (1.119) | 4.612 | (1.215) | 1.229 | |
| Albumin | 36.444 | (6.227) | 37.311 | (5.734) | 35.578 | (6.571) | 1.195 | |
| Triglycerides (TG) | 1.581 | (1.294) | 1.597 | (1.398) | 1.566 | (1.182) | 0.395 | 1.153 |
| Platelet volume distribution width (PDW) | 15.416 | (2.803) | 15.528 | (2.729) | 15.303 | (2.872) | 0.004 | 1.153 |
| Blood glucose | 7.535 | (3.615) | 7.724 | (3.872) | 7.346 | (3.329) | 1.127 | |
| Protein | 0.426 | (0.741) | 0.427 | (0.793) | 0.425 | (0.684) | 0.918 | 1.122 |
| 5’-nucleotidase (5’NT) | 4.787 | (9.825) | 3.960 | (6.760) | 5.614 | (12.085) | 1.121 | |
| Prealbumin | 199.623 | (77.217) | 216.499 | (68.563) | 182.748 | (81.588) | 1.113 | |
| Fibrinogen | 3.525 | (1.228) | 3.404 | (1.135) | 3.646 | (1.303) | 1.078 | |
| Prostate-specific antigen (PSA) | 2.917 | (26.362) | 2.197 | (24.110) | 3.637 | (28.423) | 0.049 | 1.069 |
| Mean corpuscular volume (MCV) | 91.955 | (6.276) | 92.183 | (5.748) | 91.726 | (6.756) | 0.009 | 1.065 |
| Cholinesterase | 6562.606 | (2466.747) | 7139.902 | (2207.827) | 5985.310 | (2575.021) | 1.056 | |
| Carbohydrate antigen 19-9 (CA19-9) | 58.243 | (206.582) | 22.928 | (75.813) | 93.557 | (277.716) | 1.055 | |
| Cystatin C | 1.376 | (0.969) | 1.366 | (1.041) | 1.386 | (0.893) | 0.458 | 0.993 |
| Eosinophil ratio (EOS) | 0.022 | (0.022) | 0.024 | (0.021) | 0.020 | (0.022) | 0.980 | |
| Apolipoprotein B (ApoB) | 0.810 | (0.258) | 0.797 | (0.257) | 0.823 | (0.257) | 0.967 | |
| Prothrombin time (PT) | 17.166 | (8.906) | 17.609 | (11.982) | 16.724 | (3.835) | 0.967 | |
| 24.222 | (9.147) | 23.990 | (8.646) | 24.454 | (9.619) | 0.068 | 0.948 | |
|
Table 1, continued | ||||||||
| Patients with type 2 diabetes, Mean (SD) | ||||||||
| Feature variables | Total (5198) | Non-cancer group (2599) | Cancer group (2599) | Importance | ||||
| Nucleated red blood cells (NRBC) | 0.084 | (0.790) | 0.081 | (0.598) | 0.087 | (0.944) | 0.784 | 0.945 |
| Adenosine deaminase (ADA) | 12.977 | (6.371) | 12.549 | (5.764) | 13.406 | (6.899) | 0.914 | |
| Calcium | 2.216 | (0.186) | 2.230 | (0.161) | 2.202 | (0.206) | 0.906 | |
| Neutrophil ratio | 0.666 | (0.130) | 0.638 | (0.117) | 0.695 | (0.136) | 0.869 | |
| Monocyte ratio | 0.078 | (0.030) | 0.079 | (0.025) | 0.076 | (0.034) | 0.853 | |
| White blood cell count | 7.225 | (4.497) | 6.799 | (2.925) | 7.651 | (5.616) | 0.825 | |
| Lymphocyte ratio | 0.228 | (0.113) | 0.253 | (0.105) | 0.203 | (0.115) | 0.819 | |
| Lactate dehydrogenase (LDH) | 251.827 | (381.207) | 231.046 | (310.509) | 272.607 | (439.787) | 0.793 | |
| Fecal occult blood test (FOBT/ OB) | 0.178 | (0.349) | 0.118 | (0.288) | 0.238 | (0.392) | 0.789 | |
| Quantitative D-dimer | 1.658 | (4.972) | 1.249 | (5.108) | 2.068 | (4.798) | 0.773 | |
| Low-density lipoprotein cholesterol (LDL-C) | 2.254 | (0.879) | 2.228 | (0.881) | 2.280 | (0.877) | 0.032 | 0.751 |
| Neutrophil gelatinase-associated lipocalin (NGAL) | 155.837 | (162.717) | 156.372 | (180.541) | 155.303 | (142.718) | 0.813 | 0.745 |
| Ferritin | 243.243 | (374.617) | 219.029 | (352.352) | 267.458 | (394.214) | 0.728 | |
| Creatinine | 84.489 | (92.047) | 89.687 | (106.136) | 79.290 | (75.029) | 0.719 | |
| Alkaline phosphatase (ALP) | 113.620 | (162.957) | 92.361 | (65.960) | 134.879 | (218.781) | 0.696 | |
| Urea | 7.231 | (6.153) | 6.955 | (5.173) | 7.506 | (6.987) | 0.001 | 0.684 |
| Red blood cells (RBC) | 309.913 | (5549.819) | 285.720 | (7075.950) | 334.106 | (3397.439) | 0.753 | 0.655 |
| Monoamine oxidase (MAO) | 7.421 | (3.005) | 7.297 | (2.901) | 7.545 | (3.102) | 0.003 | 0.637 |
| Red blood cells (in high power field/HPF) | 58.166 | (1012.069) | 51.442 | (1273.670) | 64.890 | (653.173) | 0.632 | 0.633 |
| Mean corpuscular volume (MCV) of 70% RBC | 22.187 | (44.133) | 18.791 | (41.203) | 25.582 | (46.643) | 0.616 | |
| Total bilirubin | 18.239 | (35.744) | 14.933 | (16.703) | 21.545 | (47.485) | 0.601 | |
| Quantitative hepatitis B e-antigen (HBeAg) | 0.637 | (10.692) | 0.585876 | (11.537) | 0.688 | (9.777) | 0.729 | 0.577 |
| Complement C1q measurement | 173.428 | (39.576) | 174.516 | (40.620) | 172.340 | (38.480) | 0.047 | 0.577 |
| Uric acid | 318.547 | (125.341) | 323.582 | (109.505) | 313.512 | (139.229) | 0.004 | 0.569 |
| Epithelial cells (in high power field/HPF) | 1.501 | (3.297) | 1.389 | (3.494) | 1.614 | (3.085) | 0.014 | 0.568 |
| Mean corpuscular hemoglobin concentration (MCHC) | 287.090 | (108.450) | 283.327 | (111.643) | 290.852 | (105.047) | 0.012 | 0.566 |
| Inorganic phosphate | 1.070 | (0.278) | 1.079 | (0.277) | 1.062 | (0.279) | 0.027 | 0.562 |
| Monocyte absolute count | 0.525 | (0.265) | 0.521 | (0.217) | 0.529 | (0.305) | 0.246 | 0.554 |
| Quantitative hepatitis B core antibody (anti-HBc) | 3.235 | (4.560) | 3.282 | (5.573) | 3.188 | (3.245) | 0.457 | 0.547 |
| Prothrombin time (PT) | 13.786 | (4.143) | 13.596 | (4.117) | 13.975 | (4.161) | 0.001 | 0.546 |
| Red blood cell count (RBC) | 4.027 | (2.427) | 4.157 | (0.784) | 3.897 | (3.337) | 0.543 | |
| Globulin | 28.339 | (5.982) | 27.710 | (5.265) | 28.967 | (6.562) | 0.538 | |
| Gamma-glutamyl transferase (GGT) | 56.235 | (123.965) | 42.283 | (72.679) | 70.188 | (158.331) | 0.528 | |
| Apolipoprotein A1 (ApoA1) | 1.187 | (0.280) | 1.207 | (0.274) | 1.167 | (0.285) | 0.520 | |
| Total cholesterol (TC) | 4.026 | (1.260) | 4.000 | (1.276) | 4.051 | (1.244) | 0.145 | 0.512 |
| Magnesium (Mg) | 0.885 | (0.128) | 0.897 | (0.126) | 0.873 | (0.130) | 0.512 | |
| Human immunodeficiency virus antigen/antibody test (HIV Ag/Ab) | 0.441 | (16.699) | 0.768 | (23.614) | 0.115 | (0.078) | 0.159 | 0.502 |
| Epithelial cells | 4.578 | (13.764) | 4.038 | (13.978) | 5.119 | (13.527) | 0.005 | 0.491 |
|
Table 1, continued | ||||||||
| Patients with type 2 diabetes, Mean (SD) | ||||||||
| Feature variables | Total (5198) | Non-cancer group (2599) | Cancer group (2599) | Importance | ||||
| International normalized ratio (INR) of prothrombin time | 1.079 | (0.412) | 1.064 | (0.442) | 1.094 | (0.379) | 0.009 | 0.481 |
| Glycated hemoglobin (HbA1c) | 7.473 | (1.751) | 7.584 | (1.835) | 7.362 | (1.656) | 0.458 | |
| Quantitative hepatitis B surface antibody (anti-HBs) | 102.791 | (226.734) | 109.701 | (239.511) | 95.880 | (213.015) | 0.028 | 0.456 |
| Neutrophil absolute count | 5.041 | (4.152) | 4.467 | (2.551) | 5.614 | (5.227) | 0.454 | |
| Direct bilirubin | 8.530 | (25.691) | 5.727 | (10.749) | 11.332 | (34.483) | 0.450 | |
| Eosinophil absolute count | 0.140 | (0.153) | 0.152 | (0.151) | 0.128 | (0.155) | 0.442 | |
| Nucleated red blood cell absolute count | 0.0140 | (0.0605) | 0.0134 | (0.0527) | 0.0147 | (0.0674) | 0.440 | 0.440 |
| Carbon dioxide combining power (CO2CP) | 23.520 | (3.486) | 23.727 | (3.259) | 23.313 | (3.688) | 0.436 | |
| Platelet count | 191.816 | (85.029) | 194.770 | (75.947) | 188.862 | (93.151) | 0.012 | 0.415 |
| Acidity/Alkalinity (pH) | 6.035 | (0.777) | 6.045 | (0.772) | 6.025 | (0.781) | 0.354 | 0.414 |
| White blood cell count (WBC) | 175.582 | (3582.474) | 216.176 | (4979.509) | 134.988 | (935.078) | 0.414 | 0.380 |
| Specific gravity | 1.0170 | (0.0078) | 1.0172 | (0.0080) | 1.0168 | (0.0075) | 0.045 | 0.379 |
| White blood cell to red blood cell ratio (WBC: RBC) | 1.337 | (0.353) | 1.392 | (0.340) | 1.283 | (0.357) | 0.374 | |
| Alanine transaminase (ALT) | 29.762 | (112.448) | 29.187 | (103.502) | 30.338 | (120.751) | 0.712 | 0.371 |
| Eosinophil ratio | 0.0041 | (0.0046) | 0.0044 | (0.0046) | 0.0038 | (0.0046) | 0.371 | |
| Aspartate transaminase (AST) | 40.456 | (284.429) | 33.537 | (208.257) | 47.375 | (344.041) | 0.079 | 0.366 |
| Mean platelet volume (MPV) | 10.444 | (1.465) | 10.513 | (1.453) | 10.374 | (1.474) | 0.001 | 0.358 |
| Urine glucose | 0.808 | (1.359) | 0.924 | (1.426) | 0.691 | (1.279) | 0.341 | |
| Quantitative hepatitis B e-antibody (anti-HBe) | 1.392 | (2.096) | 1.437 | (2.883) | 1.348 | (0.687) | 0.123 | 0.333 |
| Bacteria (in high power field/ HPF) | 284.715 | (1320.872) | 238.154 | (1192.108) | 331.275 | (1436.879) | 0.011 | 0.324 |
| High-density lipoprotein cholesterol (HDL-C) | 1.068 | (0.322) | 1.075 | (0.330) | 1.061 | (0.314) | 0.116 | 0.302 |
| Treponema pallidum-specific antibody test (TPPA) | 0.238 | (1.556) | 0.245 | (1.706) | 0.231 | (1.392) | 0.729 | 0.296 |
| Quantitative hepatitis C antibody (anti-HCV) | 0.356 | (1.808) | 0.314 | (1.654) | 0.397 | (1.948) | 0.098 | 0.294 |
| Prothrombin ratio (PR) | 1.063 | (0.319) | 1.050 | (0.327) | 1.077 | (0.311) | 0.002 | 0.279 |
| Potassium (K) | 4.075 | (0.542) | 4.083 | (0.492) | 4.067 | (0.589) | 0.309 | 0.246 |
| Bacteria | 1664.088 | (7657.302) | 1502.787 | (7662.094) | 1825.389 | (7650.581) | 0.129 | 0.243 |
| Casts (in low power field/LPF) | 0.124 | (0.679) | 0.095 | (0.326) | 0.153 | (0.903) | 0.002 | 0.193 |
| Sodium (Na) | 139.705 | (4.289) | 140.068 | (3.546) | 139.342 | (4.895) | 0.182 | |
| Small round epithelial cells | 1.241 | (2.183) | 1.189 | (2.571) | 1.293 | (1.709) | 0.088 | 0.178 |
3.3Model performance
By continuously adding feature variables and testing classifier performance, we found that the model classification performance peaked when 107 feature variables were used. The mean AUC values of the top 10 classifiers was 0.770 (0.691–0.852), as shown in Fig. 3.
Figure 3.
Change of ROC AUC curve along with gradually added features.
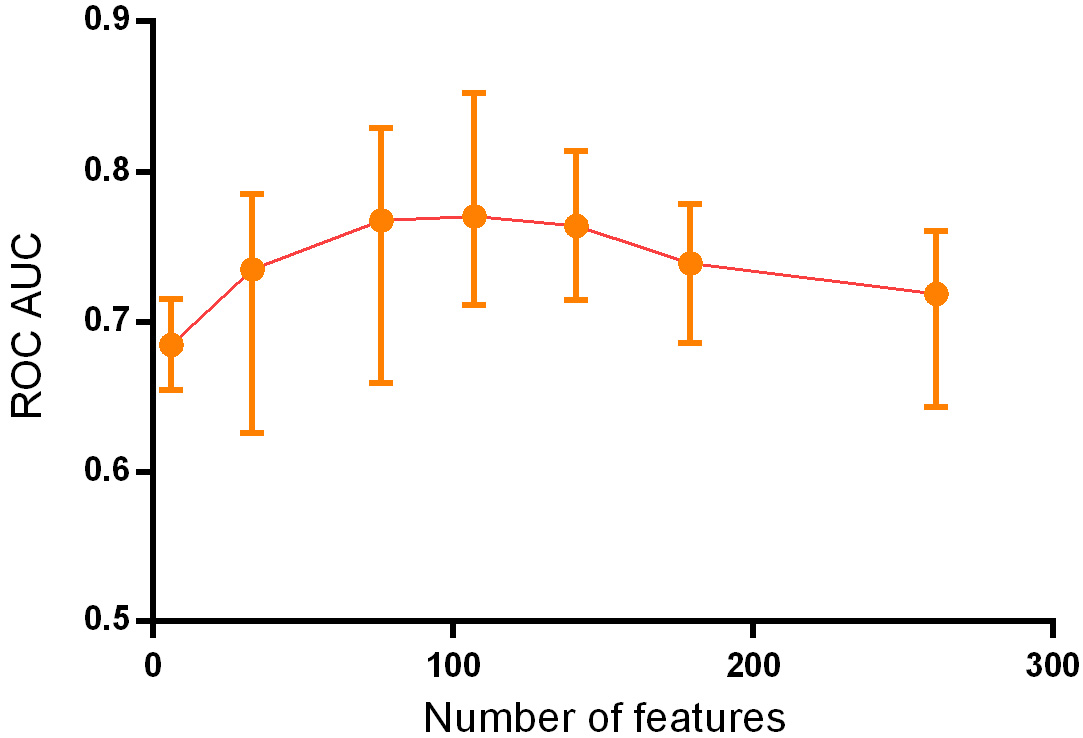
Table 2
Parameters of the five best classifiers
| Classifier | AUC | Accuracy | Sensitivity | Specificity |
|---|---|---|---|---|
| CatBoost | 0.852 | 0.796 | 0.761 | 0.832 |
| Light gradient boosting | 0.836 | 0.771 | 0.750 | 0.793 |
| XGBoost | 0.830 | 0.754 | 0.739 | 0.770 |
| Gradient boosting | 0.829 | 0.767 | 0.731 | 0.805 |
| Random forest | 0.833 | 0.779 | 0.746 | 0.813 |
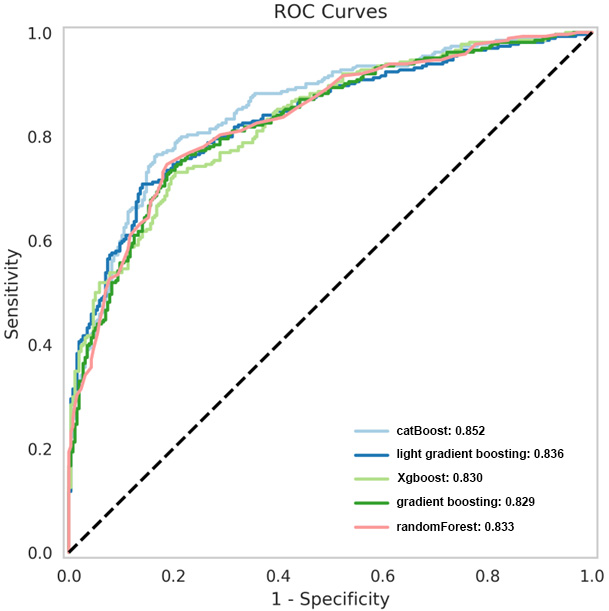
Based on the principle of decision trees, the five best classifiers were obtained: random forest, CatBoost, light gradient boosting, gradient boosting, and XGBoost models, as listed in Table 2. The AUC values of the five classifiers were all
Figure 4.
ROC curves of the five superior classifiers.
4.Discussion
Many studies have been conducted on cancer complications in patients with type 2 diabetes. The main mechanisms by which diabetes increases the risk of cancer are as follows: 1) Diabetes and cancer share common risk factors, such as family history (genetics), obesity, high-calorie diet, smoking, and alcohol consumption. 2) High blood glucose in patients with diabetes leads to a decrease in insulin sensitivity, compensatory hyperinsulinemia, and elevated levels of insulin-like growth factor (IGF). High concentrations of growth factors activate insulin receptors, thereby activating the insulin/IGF axis signaling pathway, which, in turn, activates signaling pathways to promote the proliferation and metastasis of cancer cells. 3) Long-term hyperglycemia provides sufficient energy for cancer cell proliferation, which can cause oxidative stress and promote cancer cell proliferation [17, 18, 19, 20]. Many studies have shown that diabetes increases the risk of liver, breast, throat, endometrial, bladder, and kidney cancers. A large study in the United States demonstrated that the risk and type of cancer in patients with type 2 diabetes varies by sex and organ system [19]. These studies do not completely agree on the results of cancer in different organ systems, and the disparities may be due to differences in patient populations, regions, course of disease, and selected analysis factors.
Currently, early screening for cancer is mainly based on a comprehensive evaluation of medical history, family history, imaging data, and blood tumor markers. Imaging diagnosis still requires a subjective assessment by a doctor, but omissions or misjudgments can occur. Blood tumor markers are one of the most commonly used screening methods for early-stage cancer. However, high levels are only present in some patients, and sensitivity is lacking in patients with low concentrations [21]. The diagnosis of cancer using a single test method has limitations, while comprehensive judgment based on clinical data extraction has great advantages. A previous study by Sharma et al. indicated that including data such as age, blood glucose level, and weight change in the model could predict the cancer risk of patients with diabetes and achieved good results with a sensitivity of 78%, specificity of 80%, and AUC of 0.87 [22]. In addition, a British study showed that models including age, BMI change, smoking, diabetes medication, proton pump inhibitors, hemoglobin, total cholesterol, and other indicators could predict the occurrence of pancreatic cancer in high-risk groups, with a sensitivity of 11%, specificity of 99.7%, and AUC of 0.82 [23]. Moreover, Ben et al. demonstrated that glucose level alone could be used as an indicator of pancreatic cancer risk [24]. We therefore considered that artificial intelligence could be used to extract disease-related data from patients to establish a simple, efficient, and population-adaptable pre-screening model, and subsequently established a prediction model using multiple classifiers and data from patients’ routine clinical tests. This can significantly increase the population participation rate and improve the screening efficiency for the disease, thereby improving patient prognosis.
The present study is similar to Choudhury’s study [10] in that multiple classifiers were used to construct models based on clinical data for early cancer diagnosis. Classifiers include MLP, voted perceptron, Clojure classifier, kernel logistic regression, stochastic gradient descent, AdaBoost, Hoeffding tree, and a primal estimated sub-gradient solver for support vector machines (s-Pegasos) [10]. In Choudhury’s study, the classification accuracy of AdaBoost was 71.29%, which was better than that of the other algorithms. However, the diagnostic efficiency obtained in our study differed because the number and category of indicators entered into the model were different. This study used 261 clinical characteristic variables and 16 machine learning algorithms based on the optimal combination of 107 characteristics to establish a prediction model. Our study used blood tumor markers as the main input, combined with routine blood, liver and kidney function, and other routine laboratory tests to establish a more sensitive and specific prediction model. In our study, the AUC values were all
The 16 machine-learning algorithms used in this study are commonly used in many research projects, and different algorithms have different advantages and disadvantages owing to their different principles. The random forest model performed well in this study because of its randomness, which makes it less prone to overfitting and able to handle high-dimensional input samples without dimensionality reduction, thereby achieving an AUC of 0.833. In addition, boosting algorithms are mainly divided into AdaBoost and gradient-boosting decision trees, with the CatBoost and XGBoost algorithms optimized based on a gradient boosting decision tree and known for their parallel computing and ability to simulate nonlinear effects, achieving high efficiency and accuracy in processing large datasets. These optimized algorithms can be applied in future studies to further improve model accuracy and stability. The specificity indicators of the three models (CatBoost, gradient boosting, and random forest) exceeded 80%, whereas the sensitivity indicators of the top five models did not reach 80%, possibly because of the large number of cancer types and relatively insufficient sample size, which made the model less effective for extracting the characteristic features of these patients. This can be improved in the future by increasing the sample size, thereby enabling the model to extract more typical features for modeling different types of cancer. In summary, using the 107 routine examination indicators selected in this study as variables for modeling enabled us to predict a high-risk population of cancer in patients with type 2 diabetes based on routine examination indicators. This can help in early intervention and prevention of cancer in clinical practice.
5.Conclusion
This study used routine laboratory data from patients with type 2 diabetes to construct a predictive model for cancer risk using 16 machine learning classifiers. The catBoost classifier model displayed good sensitivity and specificity, and could promote early risk screening and cancer prevention, thereby improving patient outcomes. Due to the large number of cancer types, the current number of atients is relatively insufficient to achieve high-efficiency prediction.
Funding
This work was supported by the Key Research and Development Program of Shaanxi Province (2017ZDXM-SF-064), Natural Science Basic Research Project of Shaanxi Province (No.2022JQ-925), and Shaanxi Provincial People’s Hospital Incubation Fund (2021YJY-03).
Supplementary data
The supplementary files are available to download from http://dx.doi.org/10.3233/THC-230385.
Acknowledgments
None to report.
Conflict of interest
The authors declare no conflict of interest.
References
[1] | Khan MAB, Hashim MJ, King JK, Govender RD, Mustafa H, Kaabi J. Epidemiology of type 2 diabetes – global burden of disease and forecasted trends. J Epidemiol Glob Health. (2020) ; 10: (1): 107-11. |
[2] | Saito E, Charvat H, Goto A, Matsuda T, Noda M, Sasazuki S, et al. Burden of cancer associated with type 2 diabetes mellitus in Japan, 2010–2030. Cancer Sci. (2016) ; 107: (4): 521-7. |
[3] | Pearson-Stuttard J, Papadimitriou N, Markozannes G, Cividini S, Kakourou A, Gill D, et al. Type 2 diabetes and cancer: An umbrella review of observational and mendelian randomization studies. Cancer Epidemiol Biomarkers Prev. (2021) ; 30: (6): 1218-28. |
[4] | Pizzato M, Turati F, Rosato V, Vecchia C. Exploring the link between diabetes and pancreatic cancer. Expert Rev Anticancer Ther. (2019) ; 19: (8): 681-7. |
[5] | Wu HD, Zhang JJ, Zhou BJ. The effect of metformin on esophageal cancer risk in patients with type 2 diabetes mellitus: A systematic review and meta-analysis. Clin Transl Oncol. (2021) ; 23: (2): 275-82. |
[6] | Liu F, Yan L, Wang Z, Lu Y, Chu Y, Li X, et al. Metformin therapy and risk of colorectal adenomas and colorectal cancer in type 2 diabetes mellitus patients: A systematic review and meta-analysis. Oncotarget. (2017) ; 8: (9): 16017-26. |
[7] | Seo YG, Choi HC, An AR, Park DJ, Park YJ, Lee KE, et al. The association between type 2 diabetes mellitus and thyroid cancer. J Diabetes Res. (2017) ; 2017: : 5850879. |
[8] | Mirmiran P, Bahadoran Z, Ghasemi A, Hosseinpanah F. Type 2 diabetes and cancer: An overview of epidemiological evidence and potential mechanisms. Crit Rev Oncog. (2019) ; 24: (3): 223-33. |
[9] | Balyen L, Peto T. Promising artificial intelligence-machine learning-deep learning algorithms in ophthalmology. Asia Pac J Ophthalmol (Phila). (2019) ; 8: (3): 264-72. |
[10] | Choudhury A. Predicting cancer using supervised machine learning: Mesothelioma. Technol Health Care. (2021) ; 29: (1): 45-58. |
[11] | Tsai IJ, Shen WC, Lee CL, Wang HD, Lin CY. Machine learning in prediction of bladder cancer on clinical laboratory data. Diagnostics (Basel). (2022) ; 12: (1). |
[12] | Rauschert S, Raubenheimer K, Melton PE, Huang RC. Machine learning and clinical epigenetics: A review of challenges for diagnosis and classification. Clin Epigenetics. (2020) ; 12: (1): 51. |
[13] | Kalafi EY, Nor NAM, Taib NA, Ganggayah MD, Town C, Dhillon SK. Machine learning and deep learning approaches in breast cancer survival prediction using clinical data. Folia Biol (Praha). (2019) ; 65: (5-6): 212-20. |
[14] | Barrera C, Corredor G, Viswanathan VS, Ding R, Toro P, Fu P, et al. Deep computational image analysis of immune cell niches reveals treatment-specific outcome associations in lung cancer. NPJ Precis Oncol. (2023) ; 7: (1): 52. |
[15] | Gan P, Li P, Xia H, Zhou X, Tang X. The application of artificial intelligence in improving colonoscopic adenoma detection rate: Where are we and where are we going. Gastroenterol Hepatol. (2023) ; 46: (3): 203-13. |
[16] | Wang Z, Liu Y, Niu X. Application of artificial intelligence for improving early detection and prediction of therapeutic outcomes for gastric cancer in the era of precision oncology. Semin Cancer Biol. (2023) ; 93: : 83-96. |
[17] | Giovannucci E, Harlan DM, Archer MC, Bergenstal RM, Gapstur SM, Habel LA, et al. Diabetes and cancer: A consensus report. Diabetes Care. (2010) ; 33: (7): 1674-85. |
[18] | Pitocco D, Tesauro M, Alessandro R, Ghirlanda G, Cardillo C. Oxidative stress in diabetes: implications for vascular and other complications. Int J Mol Sci. (2013) ; 14: (11): 21525-50. |
[19] | Campbell PT, Newton CC, Patel AV, Jacobs EJ, Gapstur SM. Diabetes and cause-specific mortality in a prospective cohort of one million U.S. adults. Diabetes Care. (2012) ; 35: (9): 1835-44. |
[20] | Peeters PJ, Bazelier MT, Leufkens HG, de Vries F, De Bruin ML. The risk of colorectal cancer in patients with type 2 diabetes: Associations with treatment stage and obesity. Diabetes Care. (2015) ; 38: (3): 495-502. |
[21] | Ahmad E, Ali A, Nimisha, Kumar Sharma A, Apurva, Kumar A, et al. Molecular markers in cancer. Clin Chim Acta. (2022) ; 532: : 95-114. |
[22] | Sharma A, Kandlakunta H, Nagpal SJS, Feng Z, Hoos W, Petersen GM, et al. Model to determine risk of pancreatic cancer in patients with new-onset diabetes. Gastroenterology. (2018) ; 155: (3): 730-9 e3. |
[23] | Boursi B, Finkelman B, Giantonio BJ, Haynes K, Rustgi AK, Rhim AD, et al. A clinical prediction model to assess risk for pancreatic cancer among patients with new-onset diabetes. Gastroenterology. (2017) ; 152: (4): 840-50 e3. |
[24] | Ben Q, Cai Q, Li Z, Yuan Y, Ning X, Deng S, et al. The relationship between new-onset diabetes mellitus and pancreatic cancer risk: A case-control study. Eur J Cancer. (2011) ; 47: (2): 248-54. |


