
A study of a fetal heart rate calculation system based on R-R interval
Abstract
BACKGROUND:
Fetal electrocardiogram (FECG) can be obtained in a non-invasive manner to monitor fetal growth status.
OBJECTIVE:
In this study, a fetal heart rate (FHR) calculation system was proposed, which consists of the FECG recorder (MF-HOLTER) and the FECG monitoring software (FECG-MS). The abdomen electrocardiogram (AECG) of pregnant woman is acquired through the MF-HOLTER. The FECG-MS packs the AECG data and calls the FECG separation algorithm to obtain the separated FECG and the fetal QRS (FQRS) position. The FHR is further obtained by calculating the R-R interval value. At the same time, this study proposed a FQRS position correction algorithm to calculate the correct FHR values.
METHOD:
In order to verify the accuracy of the FHR calculation, the ECG signal of FLUKE’s PS320 FETAL SIMULATOR and clinical data were simultaneously tested.
RESULTS:
The accuracy rate is over 98% in processing the simulator’s data. In processing clinical data, the FHR values obtained by both the system proposed in this study and Monica AN24 are very close, and the difference is less than 1 bpm.
CONCLUSION:
The results show that the FHR calculation system is accurate and stable, and has a positive application value and prospect.
1.Introduction
Fetal heart rate (FHR) monitoring is an important method in the field of obstetrics. It can help clinicians to obtain timely information on the physiological status of the fetus during pregnancy and childbirth [1]. Changes in the physiological state of the fetus can often be reflected in the changes of the FHR. The abnormal FHR may mean fetal distress or other problems, and urgent measures are needed for pregnant women. Therefore, FHR monitoring technology has a great application value in clinical practice.
There are many ways to monitor the FHR. The methods used early on are fetal heart sound method [2] and magnetocardiography [3], but because of their own limitations, these methods have rarely been used in clinical practice. In recent years, photoelectric method has also appeared to detect the FHR [4, 5], but the technology has not yet matured. At present, the main method of clinical FHR monitoring is the ultrasound Doppler method. This method has a good monitoring effect on the FHR changes, but it has the following three limitations: 1. This method requires a strict position of the ultrasonic probe, so it often requires professional to operate it. 2. Pregnant women need to remain inactive during the monitoring process, so this method is not suitable for long-term monitoring [6]. 3. At the same time, one study has shown that the long-term use of ultrasound testing will affect the growth and development of the fetus [7].
The FHR can also be calculated from the fetal electrocardiogram (FECG). The FHR calculated by the FECG and the FHR obtained by the ultrasound Doppler method are highly correlated even in the first stage of labor [8]. The acquisition method of the FECG is divided into invasive and non-invasive. The invasive method may cause infection to the fetus or the pregnant woman, so it is rarely used in the clinic. The non-invasive method places a set of ECG electrodes on the abdomen of the pregnant woman to collect abdominal ECG (AECG). The FECG can be extracted from the AECG according to the specific FECG signal separation algorithm.
In comparison to the ultrasonic Doppler method, the non-invasive method has the following advantages: 1. The ECG electrodes require less accuracy of placement than the ultrasonic probe, so the method can also be performed without professional guidance and pregnant women can do it themselves. 2. This method is less affected by the posture of the pregnant woman than with the ultrasound Doppler method, so it can be used for long-term FHR monitoring. 3. The detection effect of this method is significantly better than the ultrasound Doppler method, especially for obese pregnant women or pregnant women who are in an active state [9]. 4. One study has shown that the method can detect higher baseline variability in early pregnancy compared to traditional FHR monitoring, so it is possible to perform FHR detection earlier on [10].
2.System structure
2.1Overall system structure
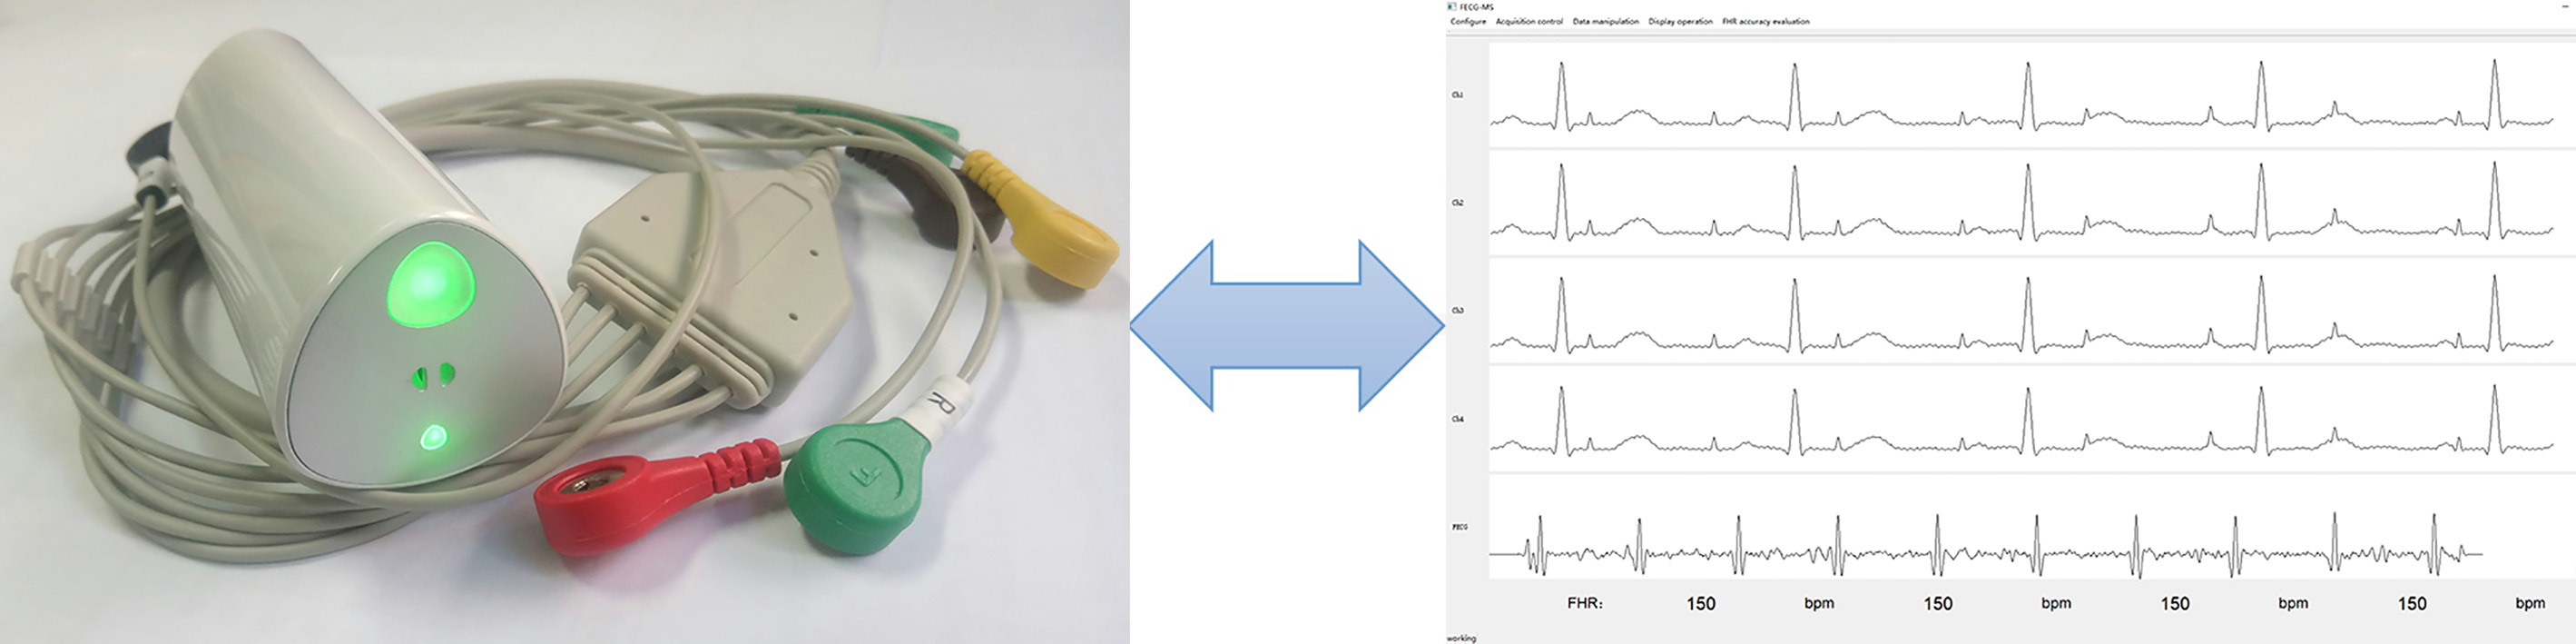
The FHR calculation system consists of two parts, as shown in Fig. 1: the fetal ECG recorder (MF-HOLTER), which collects the AECG through 4 electrodes, and the fetal ECG monitoring software (FECG-MS), which displays waveform and analysis data.
Figure 1.
The overall structure of the system. Left: MF-HOLTER. Right: FECG-MS.
2.2Hardware: MF-HOLTER
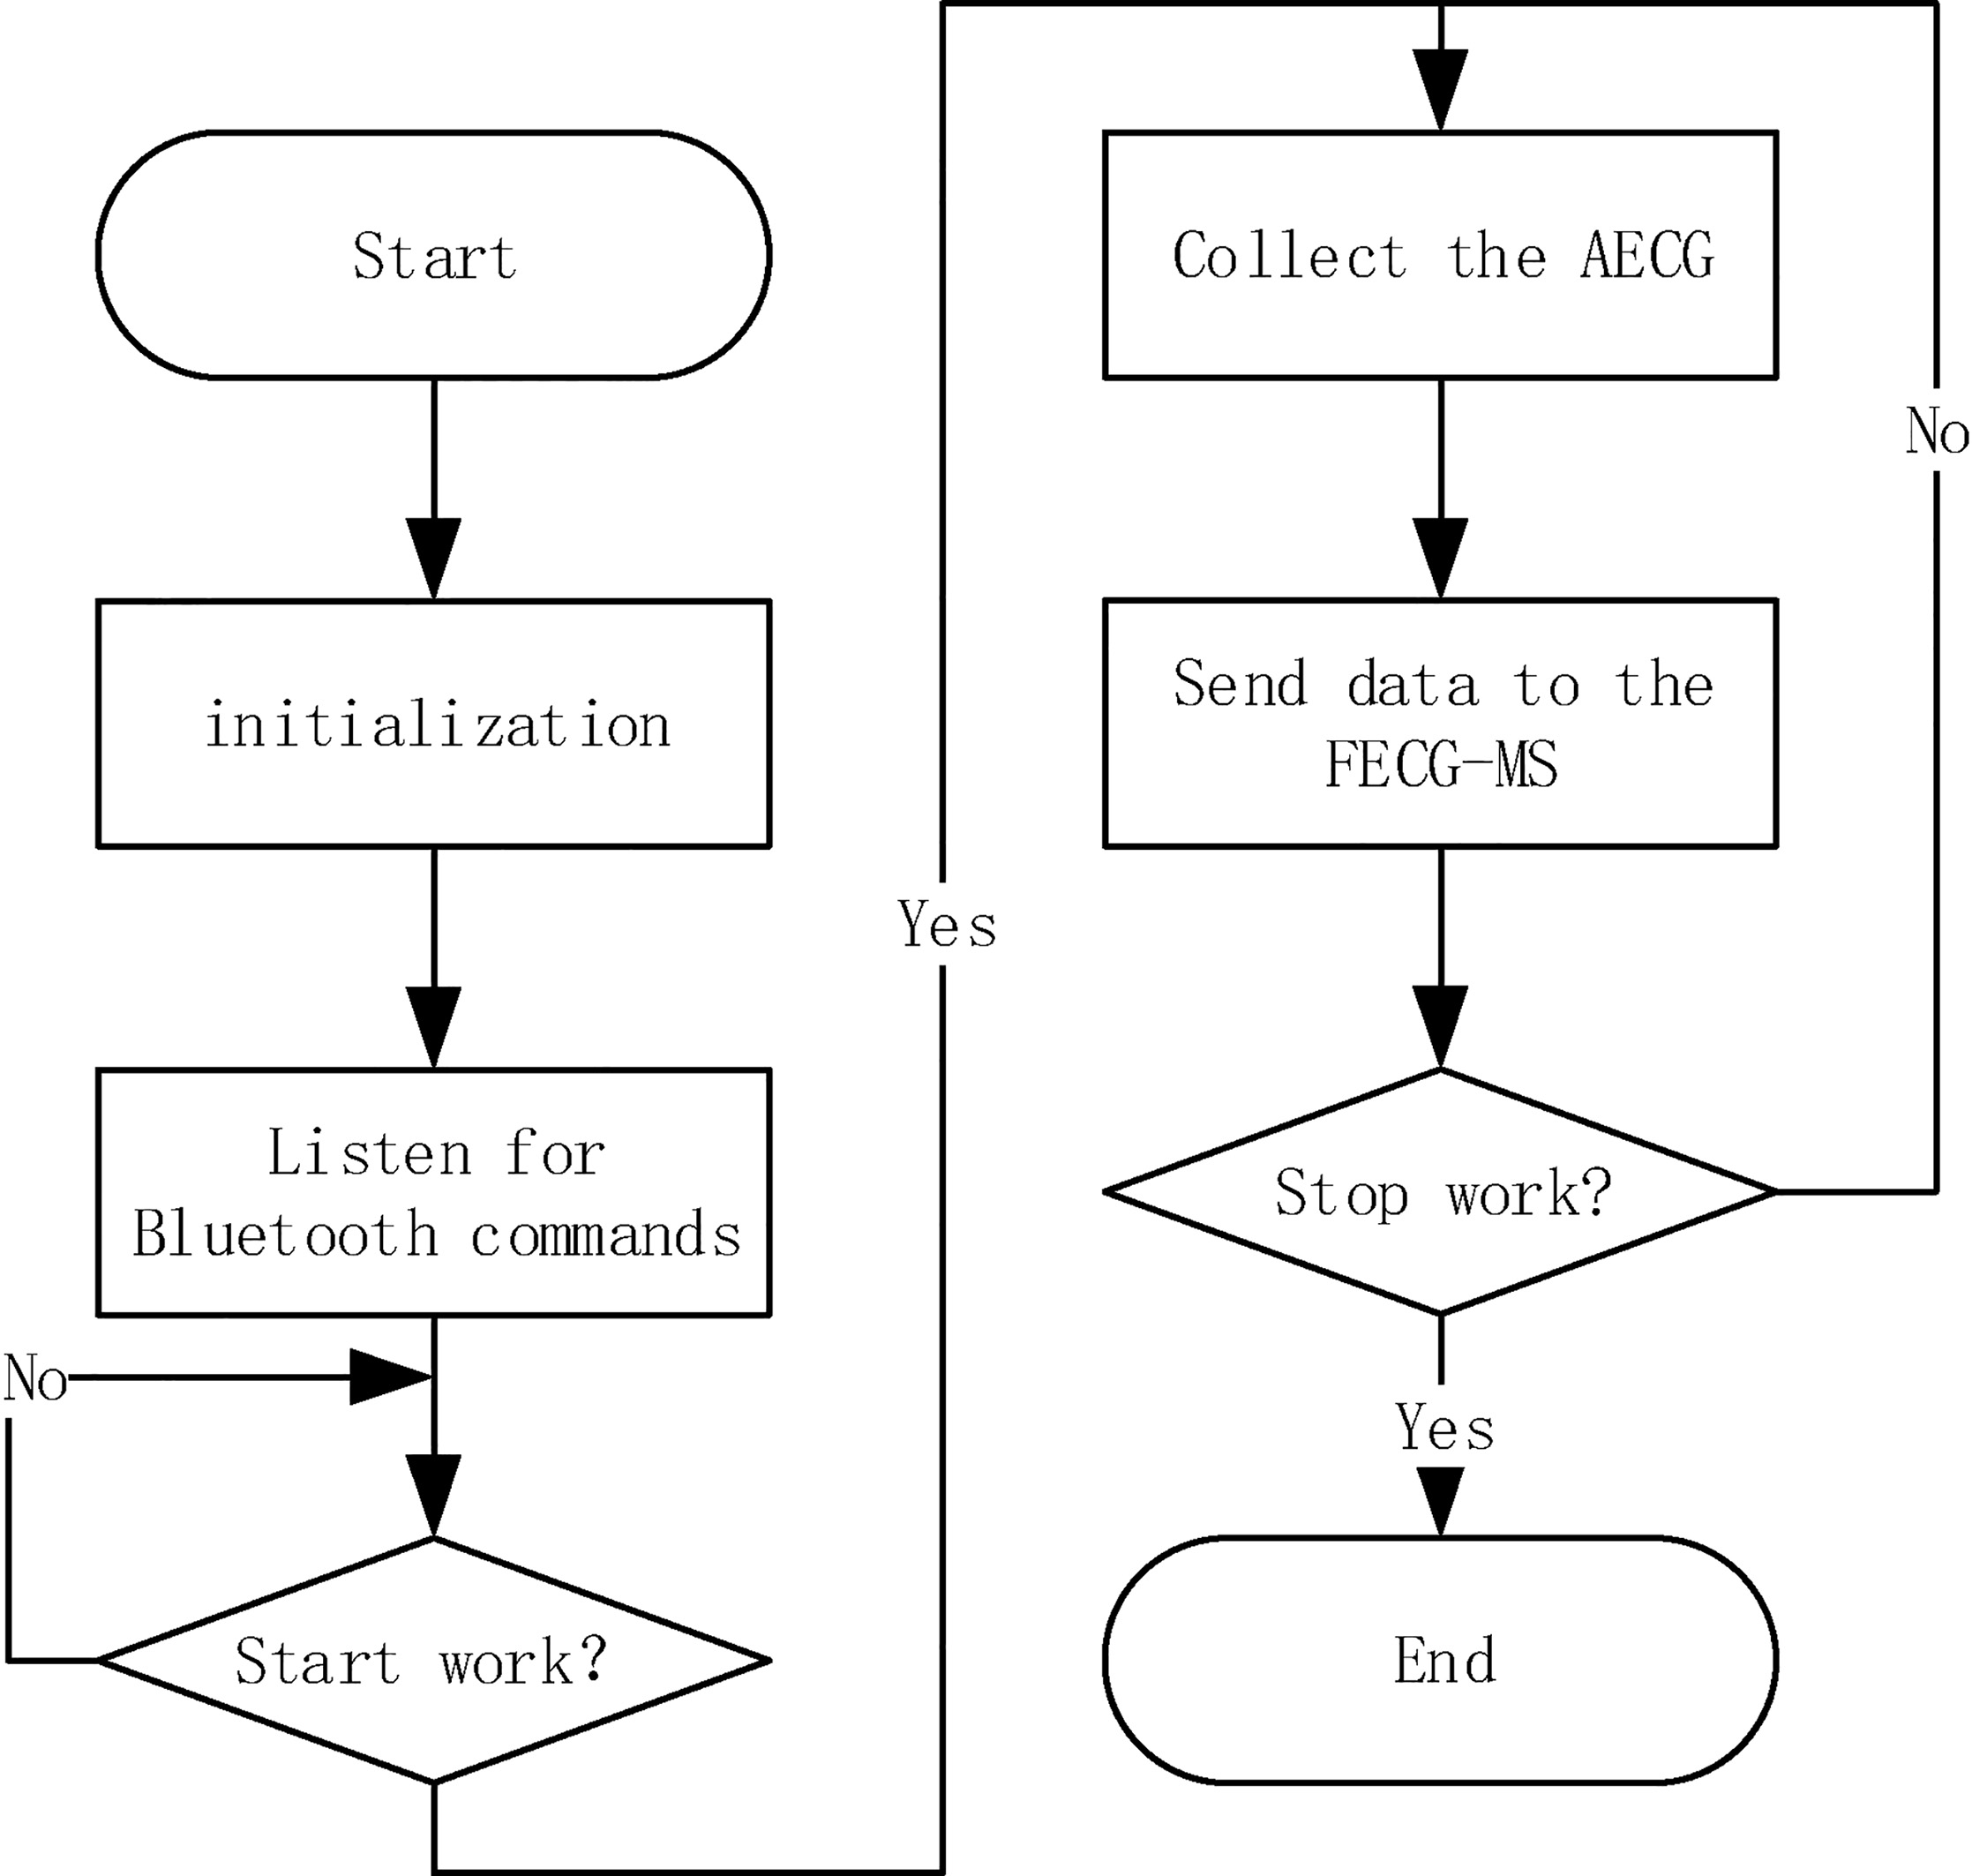
This study designed the MF-HOLTER with four leads that can continuously acquire the AECG for a long time. It can synchronously collect four channels of the AECG, package data according to the certain data format, and transmit data to the FECG-MS through Bluetooth Low Energy transmission.
The amplitude of the MECG signal in the clinic is about 100
Figure 2.
The flowchart of the MF-HOLTER.
2.3Software: FECG-MS
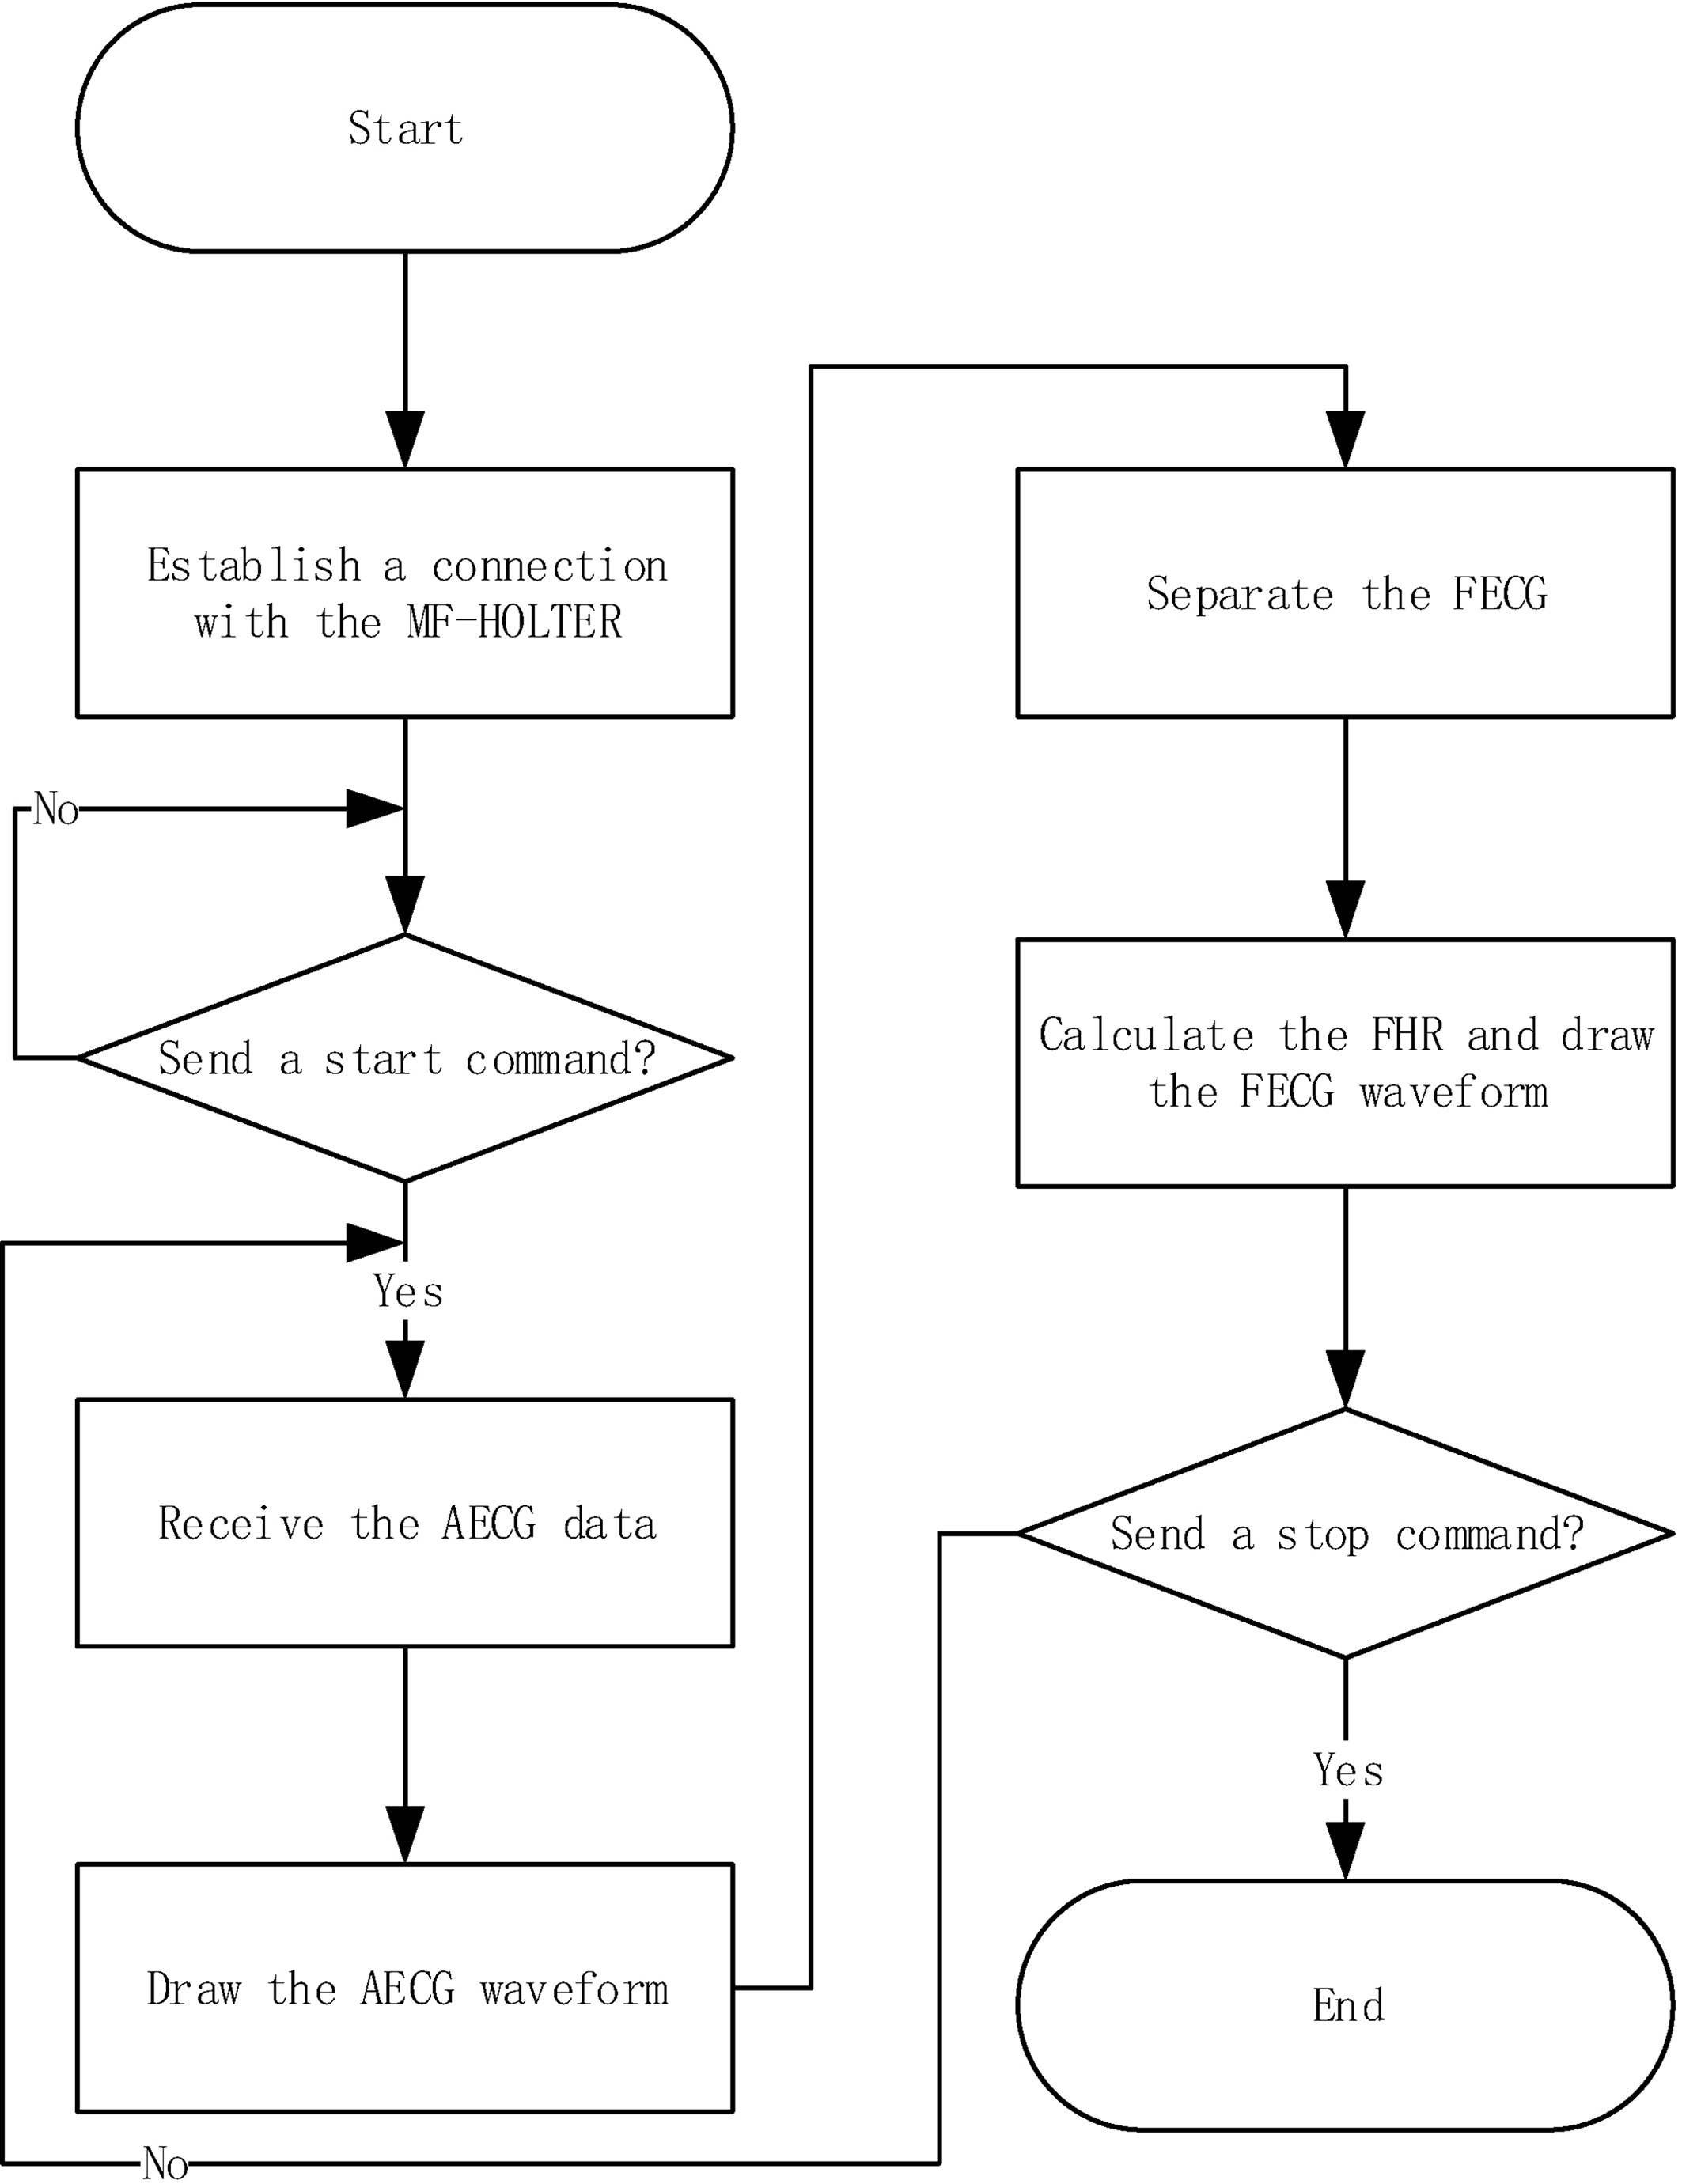
The FECG-MS is responsible for controlling the work of the MF-HOLTER, receiving the AECG data collected in real time, and packaging the AECG data according to the specific format to the FECG separation algorithm for separation. The R-R interval values in each separation are calculated based on the returned fetal QRS (FQRS) position, and the FHR is further calculated. The collected AECG and the separated FECG are drawn to the screen, the AECG and the FECG and the positions of the FQRS can be saved to the local disk in a CSV file format. At the same time, the FECG-MS provides the function of assessing the accuracy of FHR calculation. The flowchart of the FECG-MS is shown in Fig. 3.
Figure 3.
The flowchart of the FECG-MS.
3.Method for calculating the FHR
According to the position of the FQRS returned from the FECG separation algorithm, the R-R interval values can be calculated, and the FHR can be further calculated.
3.1The FECG separation algorithm
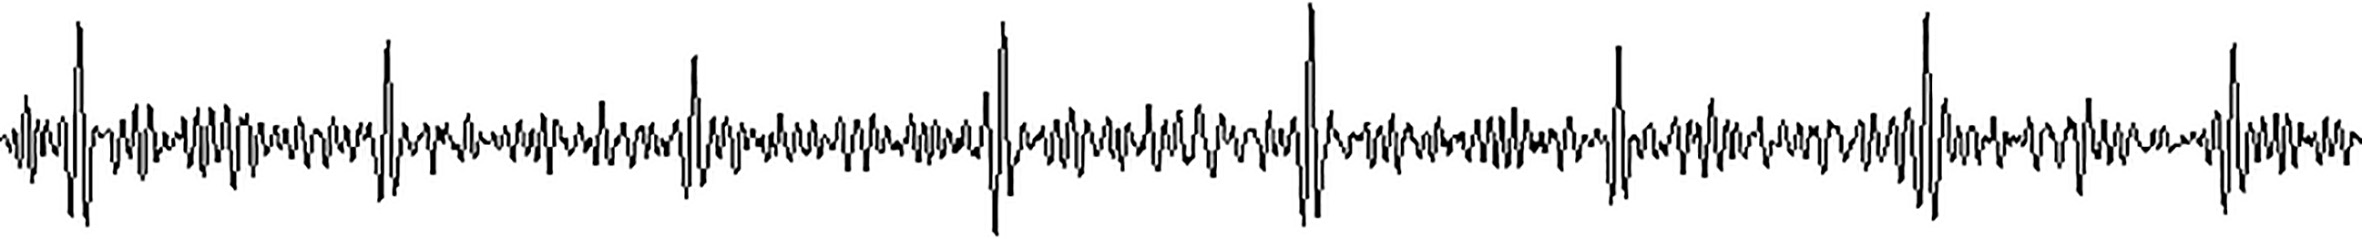
This study is based on the existing FECG separation algorithm in the authors’ laboratory. The input of the FECG separation algorithm is a 4-channel AECG signal that has 4S duration data, and the output is the FECG signal and the position of the FQRS. The basic idea of the algorithm is as follows: 1. The AECG is pre-processed to remove the maternal muscle noise, the baseline drift, the power frequency interference, the electrode noise and so on, leaving only the mixed ECG signal containing the MECG and the FECG. 2. The template signal of the MECG is constructed by identifying the maternal QRS (MQRS). 3. The template signal of the MECG is subtracted from the mixed ECG signal to get the pure FECG, as shown in Fig. 4. 4. The position of the FQRS is identified.
Figure 4.
The complete FECG separated (120 bpm).
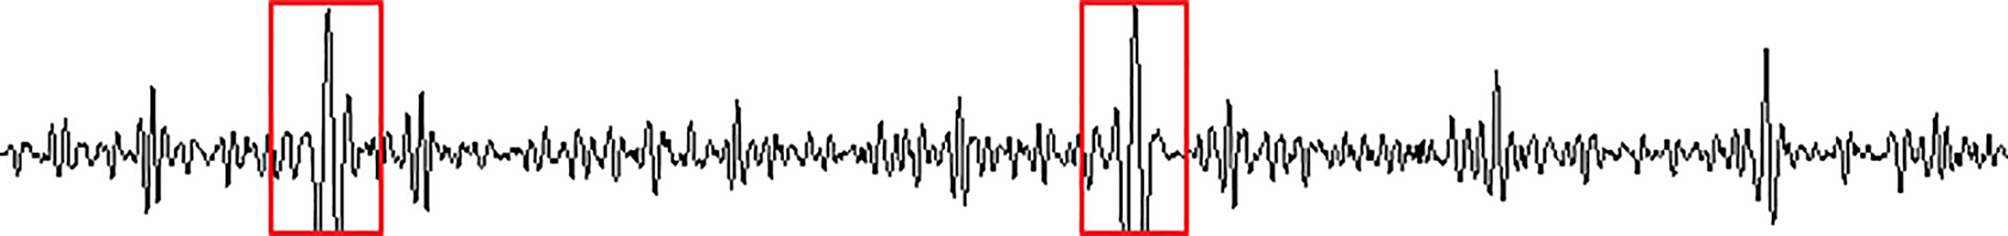
However, there are some shortcomings in the current FECG separation algorithm: 1. When the amplitude of the FECG is very low and submerged by noise, the FQRS will not be recognized, so the FQRS will be lost in this position, as shown in Fig. 5. 2. When the MQRS and the FQRS in the AECG are aligned, the elimination of the MECG is not complete, and the MQRS will remain in the FECG, thus the MQRS will be recognized as the FQRS in advance, while the real FQRS will not be recognized, as shown in Fig. 6.
Figure 5.
The separated FECG with FQRS lost (120 bpm).
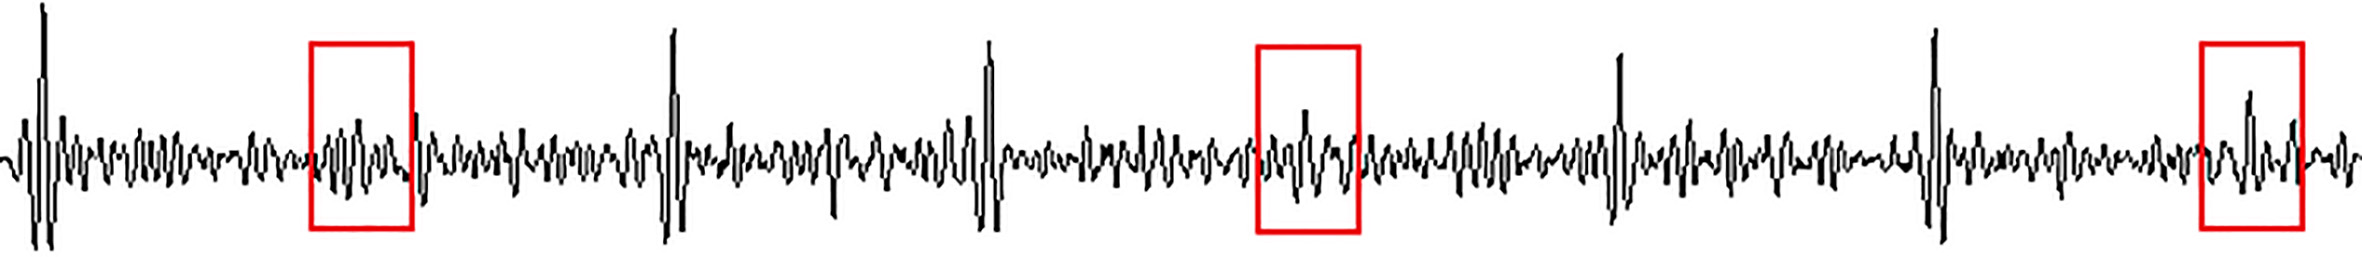
Figure 6.
The separated FECG where the MQRS is misjudged as FQRS (120 bpm).
3.2The FQRS position correction algorithm
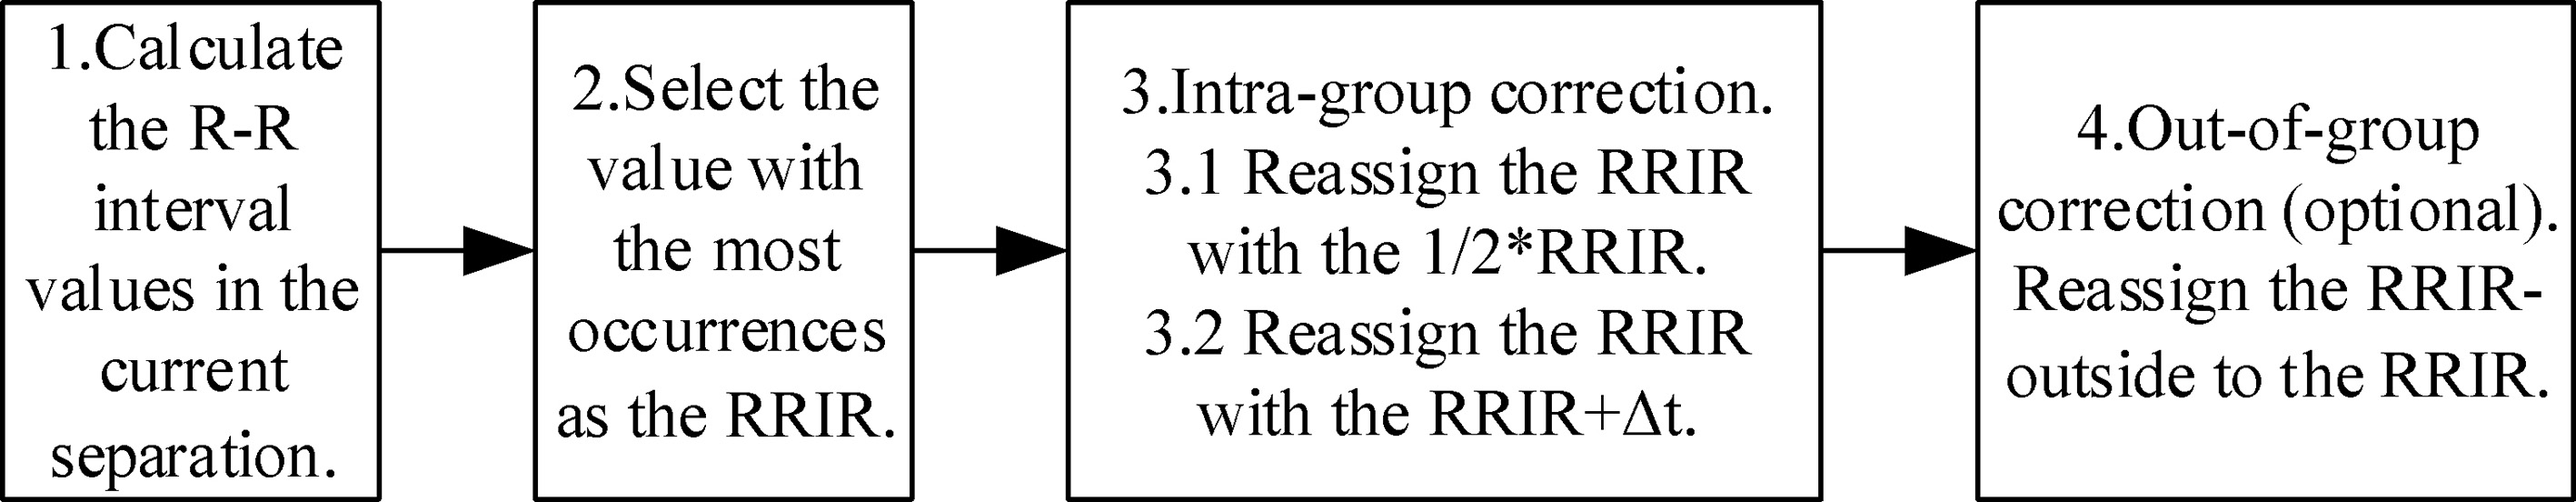
In order to improve the deviation of the FQRS position recognition in the FECG separation algorithm, the FQRS position correction algorithm is proposed in this study. The specific steps of the algorithm are as follows: 1. The R-R interval values in the current separation are calculated according to the position of the FQRS returned by the FECG separation algorithm. 2. According to the number of occurrences of each value, the value with the most occurrences is regarded as the reference of R-R interval values in the current separation, which is recorded as RRIR, but the RRIR obtained at this time is not necessarily accurate and needs to be improved. 3. Intra-group correction is conducted. 3.1. Find out whether there is a value of half of the RRIR in those R-R interval values obtained from the current separation, and record it as 1/2*RRIR. If there is one, it means that there are too many FQRS waves lost in the current separation and the RRIR is a pseudo-reference value. At this time, the RRIR is reassigned with the 1/2*RRIR as the final R-R interval reference value. 3.2. Determine whether there is a value of RRIR
Figure 7.
The step diagram.
4.Data test
In this study, two different data sets were used to assess the performance of the proposed system. One was the signal provided by the FLUKE’s PS320 FETAL SIMULATOR, which is recorded as DB1. The other was the AECG signals of pregnant women collected at the Peking Union Medical College Hospital, which is recorded as DB2.
4.1The data from the FLUKE’s PS320 FETAL SIMULATOR
The PS320 FETAL SIMULATOR is a FECG simulator, which can provide pure FECG signal, pure MECG signal, and mixed signal of the FECG and the MECG. Some specific parameters are shown in Table 1.
Table 1
The parameters of FLUKE’s PS320 FETAL SIMULATOR
| ECG type | Optional amplitude ( | Optional heart rate (bpm) |
|---|---|---|
| MECG | 500, 1000, 2000 | 60, 80, 100, 120, 140, 160 |
| FECG | 50, 100, 200, 500, 1000, 2000 | 30, 60, 90, 120, 150, 180, 210, 240 |
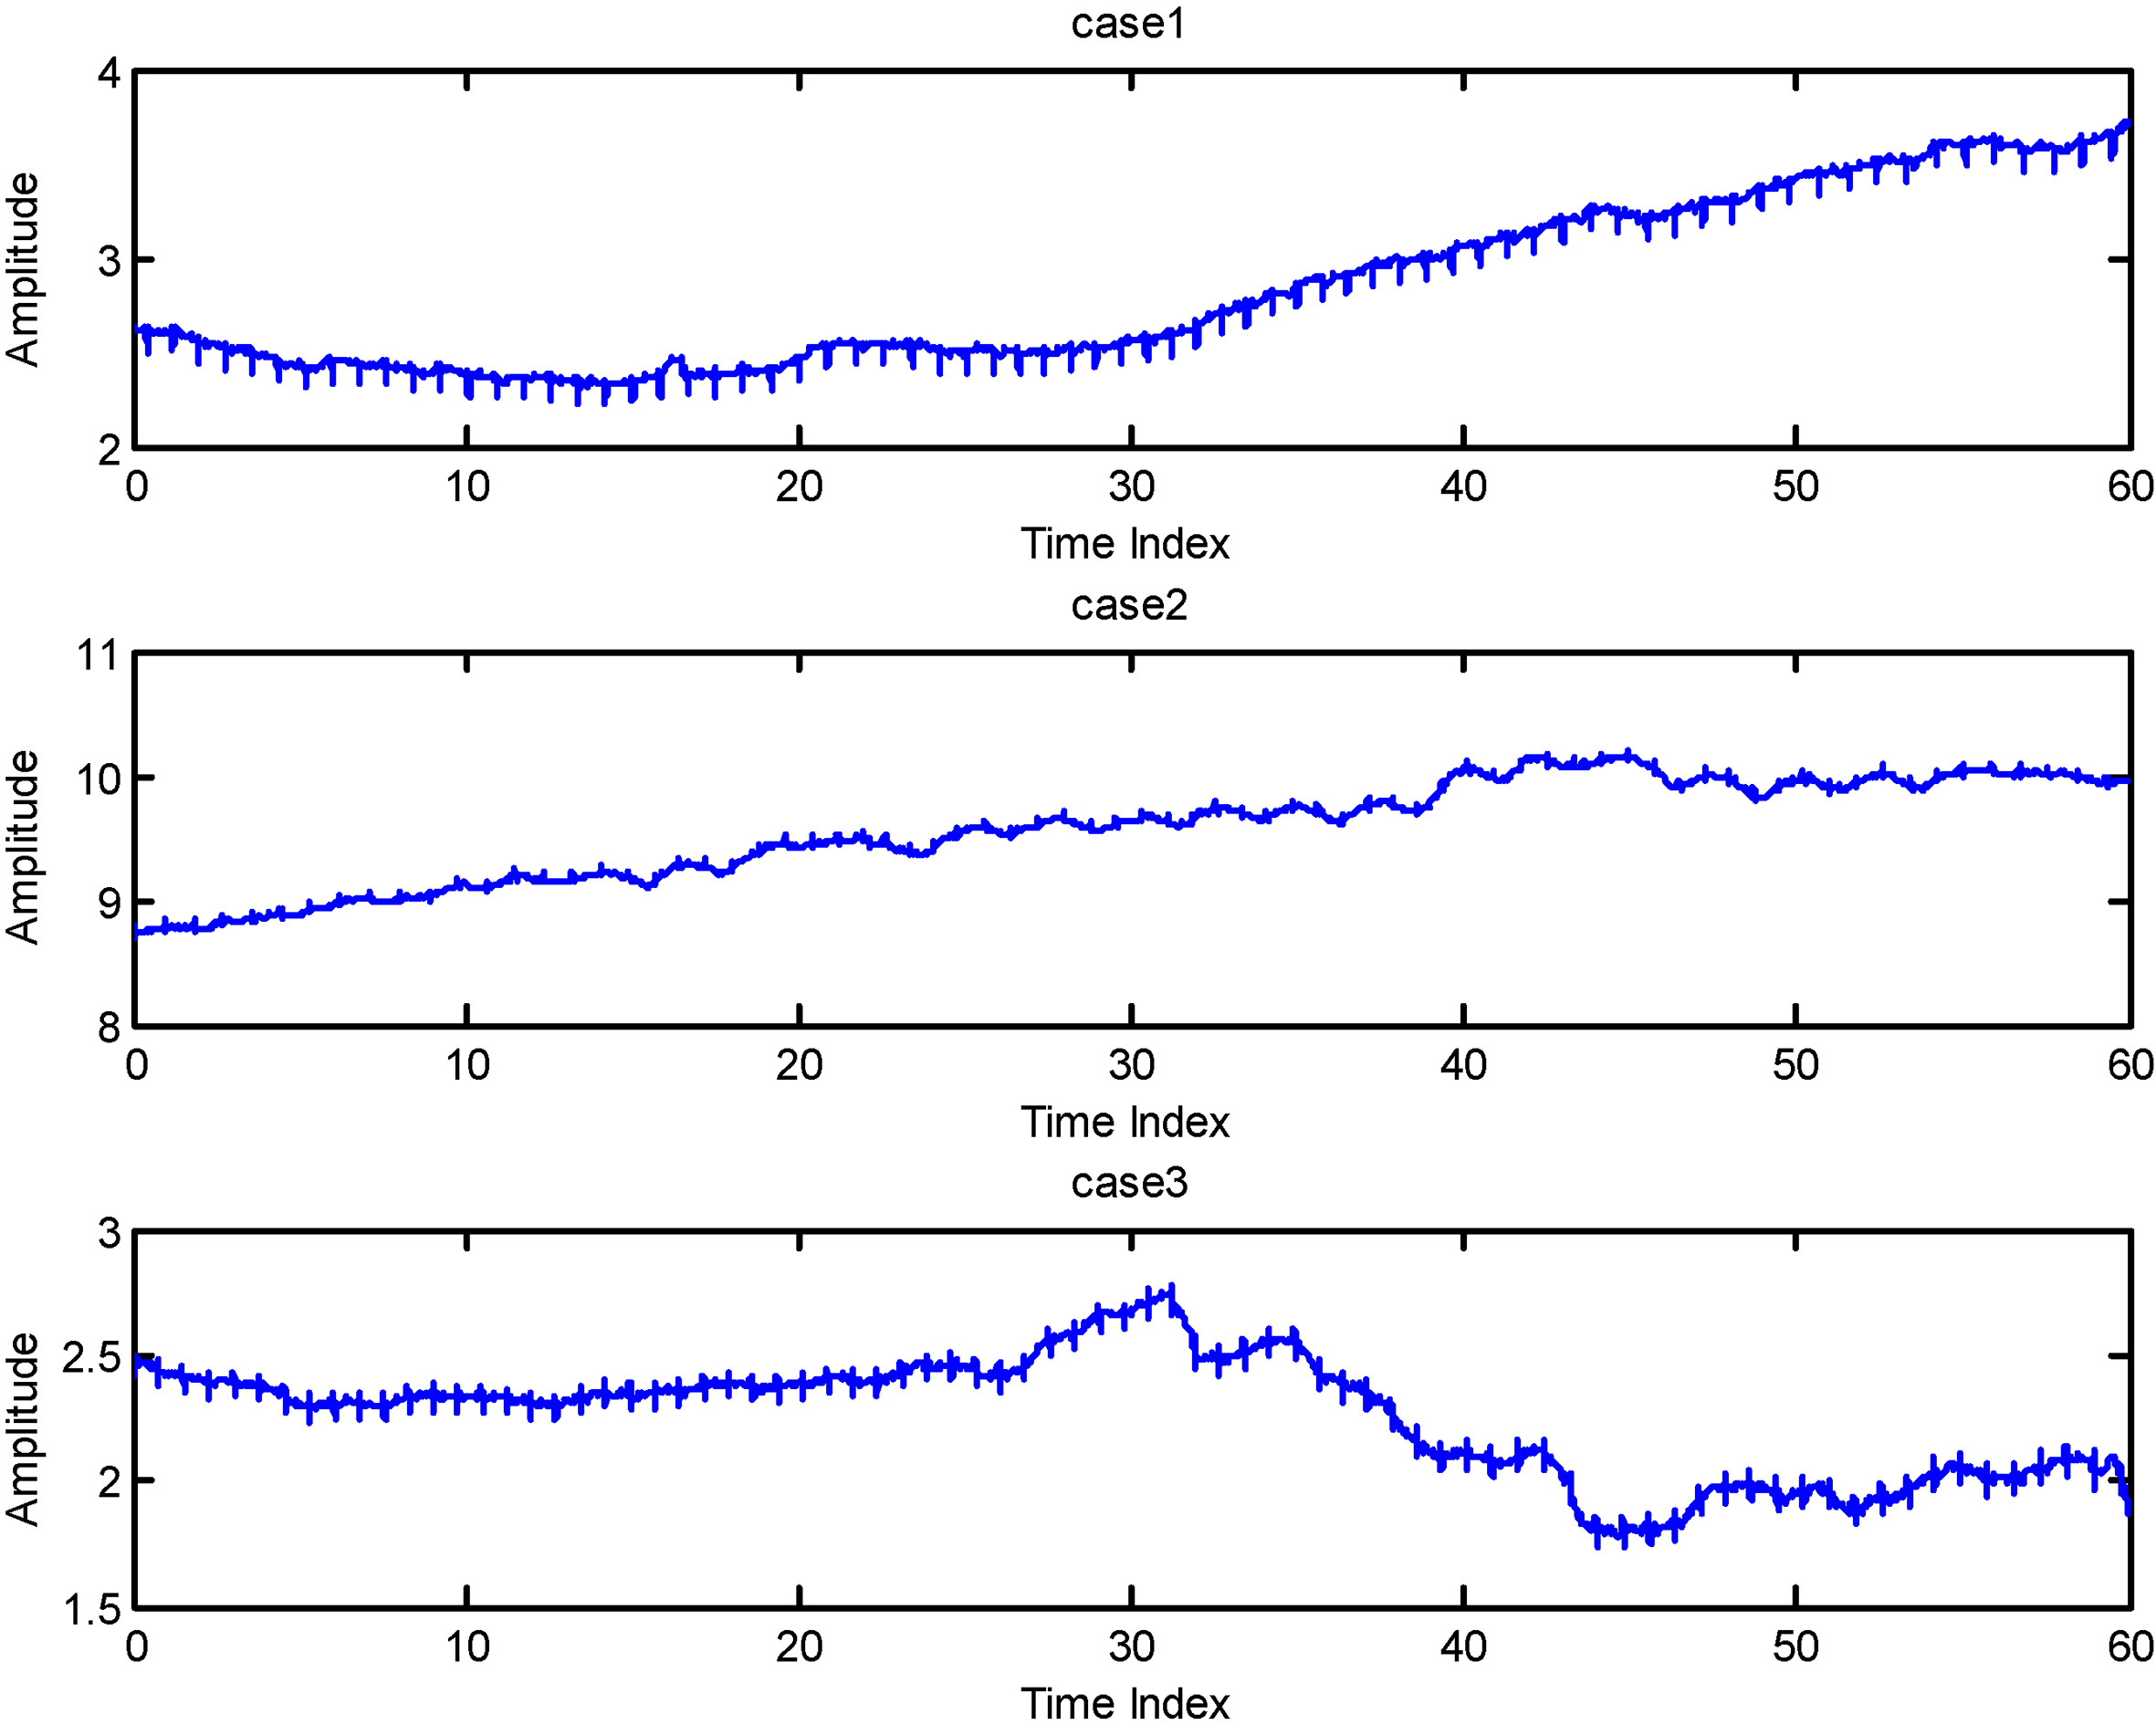
Figure 8.
The three AECG signals. From top to bottom are case 1, case 2 and case 3, respectively.
One problem that must be highlighted here is that when the FECG and the MECG are mixed together, the amplitude of the FECG will be reduced to half the set value, which is real and has been officially certified by FLUKE.
Specific data testing methods are as follows: 1. The following four sets of data were collected in this study: 120 bpm, 150 bpm, 180 bpm, 120/150/180 evenly mixed. 2. The same points of the four sets of data are as follows: the data acquisition time for each data set is 15 minutes, the maternal heart rate is set to 80 bpm, the MECG amplitude is set to 1000
4.2The data from Peking Union Medical College Hospital
The DB2 is the AECG signals of pregnant women collected at the Peking Union Medical College Hospital. In this study, three cases of data were selected, and the data of one minute was intercepted respectively to evaluate the performance of the FHR calculation system. Three AECG signals are shown in Fig. 8.
5.Results
5.1Performance based on DB1
In order to eliminate the influence caused by uncertain factors such as the external environment, this study randomly conducted two data collections and evaluations of the accuracy of the FHR calculation, then took the average as the final accuracy of each data set. The accuracy of the FHR calculation for each data set is shown in Table 2.
Table 2
The accuracy of the FHR calculation
| FHR value (bpm) | Duration (min) | Results |
|---|---|---|
| 120 | 15 | Total: 3616 Wrong: 8 Accuracy: 99.78% |
| 150 | 15 | Total: 3616 Wrong: 40 Accuracy: 98.89% |
| 180 | 15 | Total: 3616 Wrong: 40 Accuracy: 98.89% |
| 120/150/180 | 15 | Total: 3616 Wrong: 72 Accuracy: 98.01% |
Table 3
The average FHR values from the proposed system and Monica AN24
| Data | Case 1 | Case 2 | Case 3 |
|---|---|---|---|
| The proposed system | 144.13 | 133.06 | 127.53 |
| Monica AN24 | 144.18 | 132.95 | 128.27 |
| Difference | 0.05 | 0.11 | 0.74 |
The results show that the FHR calculating system can obtain more accurate FHR values for processing the AECG provided by FLUKE’s PS320 FETAL SIMULATOR, and still has a higher calculating accuracy when dealing with the variable FHR values.
5.2Performance based on DB2
Three cases of data were processed using the FHR calculation system proposed in this study, and the average FHR within one minute duration was calculated. At the same time, this study used Monica AN24 to process the same data set. Monica AN24 is a maternal-fetal holter monitor based on FECG technology developed by the University of Nottingham, UK, which is recognized in clinical applications [9]. The average FHR values are as shown in Table 3. The unit is bpm (beat per minute). From Table 3, we can see that the average FHR values obtained by both the FHR calculation system proposed in this study and Monica AN24 are very close, and the error is less than 1 bpm.
6.Conclusion and discussion
The results show that the FHR calculation system proposed in this study has achieved good performance when processing the simulator signals and clinical data with high signal-to-noise ratio.
There are many new ways to continue to explore FECG monitoring. Zhang et al. used the single-channel combined with the adaptive noise canceller to achieve a good result in processing the data of the public database [11]. Marchon et al. studied the distribution of ECG electrodes [12]. Li et al. used convolutional neural networks to automatically classify the FHR [13].
Future works will deal with more clinical data to enhance clinical applicability. At the same time, more features of the FECG in the time domain and frequency domain will be explored to improve the accuracy of the FQRS recognition.
Acknowledgments
This work was supported by the National Key R&D Program of China (no. 2019YFC0119700), the Bill and Melinda Gates Foundation (no. OPP1148910), the Beijing Natural Science Foundation (no. 7172015), and Intelligent Physiological Measurement and Clinical Translation, Beijing International Base for Scientific and Technological Cooperation.
Conflict of interest
None to report.
References
[1] | Hasan MA, Reaz MBI, Ibrahimy MI, Hussain MS and Uddin J. Detection and processing techniques of FECG signal for fetal monitoring. Biological Procedures Online. (2009) ; 11: (1): 263-295. |
[2] | Bassil HE, Dripps JH. Real time processing and analysis of fetal phonocardiographic signals. Clinical Physics and Physiological Measurement: An Official Journal of the Hospital Physicists’ Association, Deutsche Gesellschaft für Medizinische Physik and the European Federation of Organisations for Medical Physics. (1989) ; 10: (Suppl B): 67-74. |
[3] | Crowe JA, Herbert JM, Huang XB, Reed N, Wolfson MS, Rassi D, Zhuravlev Y and Emery SJ. Sequential recording of the abdominal fetal electrocardiogram and magnetocardiogram. Physiological Measurement. (1995) ; 16: (1): 43-47. |
[4] | Oweis RJ, As’ad H, Aldarawsheh A, AI-Khdeirat R and Lwissy K. A PC-aided optical foetal heart rate detection system. Journal of Medical Engineering & Technology. (2014) ; 38: (1): 23-31. |
[5] | Laqua D, Pollnow S, Fischer J, Ley S and Husar P. A phantom with pulsating artificial vessels for non-invasive fetal pulse oximetry. In 2014 36th Annual International Conference of the IEEE Engineering in Medicine and Biology Society, Chicago; (2014) : pp. 5631-5634. |
[6] | Ungureanu M, Bergmans JWM, Mischi M, Oei SG and Strungaru R. Improved method for fetal heart rate monitoring. In 2005 IEEE Engineering in Medicine and Biology 27th Annual Conference, Shanghai; (2005) : pp. 5916-5919. |
[7] | Maurice N, Olry JC, Cariou R, Dervilly-Pinel G, Le Bizec B, Travel A, Jondreville C and Schroeder H. Short-term effects of a perinatal exposure to the hbcdd alpha-isomer in rats: Assessment of early motor and sensory development, spontaneous locomotor activity and anxiety in pups. Neurotoxicology and Teratology. (2015) ; 52: (Pt B): 170-180. |
[8] | Reinhard J, Hayes-Gill BR, Yi Q, Hatzmann H and Schiermeier S. Comparison of non-invasive fetal electrocardiogram to Doppler cardiotocogram during the 1st stage of labor. Journal of Perinatal Medicine. (2010) ; 38: (2): 179-185. |
[9] | Reinhard J, Hayes-Gill BR, Schiermeier S, Hatzmann H, Heinrich TM and Louwen F. Intrapartum heart rate ambiguity: A comparison of cardiotocogram and abdominal fetal electrocardiogram with maternal electrocardiogram. Gynecologic and Obstetric Investigation. (2013) ; 75: (2): 101-108. |
[10] | Hofmeyr F, Groenewald CA, Nel DG, Myers MM, Fifer WP, Signore C, Hankins GDV and Odendaal HJ. Fetal heart rate patterns at 20 to 24 weeks gestation as recorded by fetal electrocardiography. Journal of Maternal-Fetal & Neonatal Medicine. (2014) ; 27: (7): 714-718. |
[11] | Zhang N, Zhang J, Li H, Mumini OO, Samuel OW, Ivanov K and Wang L. A novel technique for fetal ECG extraction using single-channel abdominal recording. Sensors. (2017) ; 17: (3): 457-472. |
[12] | Marchon N, Naik G and Pai R. ECG electrode configuration to extract real time FECG signals. Procedia Computer Science. (2018) ; 125: : 501-508. |
[13] | Li J, Chen Z, Huang L, Fang M, Li B, Fu X, Wang H and Zhao Q. Automatic classification of fetal heart rate based on convolutional neural network. IEEE Internet of Things Journal. (2019) ; 6: (2): 1394-1401. |


