
How have National Statistical Institutes improved quality in the last 25 years?
Abstract
Over the last 25 years government statistical offices have held many discussions about improving quality, conferences have been held, frameworks established, and many agencies have been reorganized. This paper summarizes many of these changes and addresses whether we are in a better place than we were when we started. What has been improved? And what still needs to be addressed?
1.Introduction
Many aspects of quality at National Statistical Institutes have clearly improved in the last quarter of a century. The European Leadership Expert Group brought together senior staff that developed a series of recommendations that every European statistical institute agreed to pursue. This included the establishment of a series of European biennial quality conferences, starting in Stockholm Sweden in 2001 and most recently in Madrid Spain in 2016. These have provided an opportunity for the cross-fertilization of ideas for quality improvement from throughout the world (not just Europe).
The efforts to improve quality have not been limited to Europe either. Numerous programs have been established to improve quality in Africa and elsewhere in the last 10 years. The nearly 50 international references to this paper are just a sample of those that might have been cited.
Here I review the development of quality frameworks and measures and tools for assessing quality. The paper also explores the challenges to actual quality improvement – particularly, to continuous quality improvement, which needs a focus on process measurement and not just product or output measurement, addressing costs as a component of quality, and strong organizational leadership. This paper goes on to discuss the importance that national statistical institutes (NSIs) know their users and understand how users’ expectations for official statistics are changing – for example, the advent of Big Data on the web has fed users’ demands for quick-turnaround data, which, in turn, has implications for the quality of those data. Big Data also offers opportunities, carefully explored, to develop official statistics that are based on blended data. Adaptive design is another strategy for meeting users’ demands for more timely statistics while maintaining quality. All of these developments will require new skill sets blended with skills that long served NSIs well.
Figure 1.
Quality frameworks.
2.Changing quality frameworks
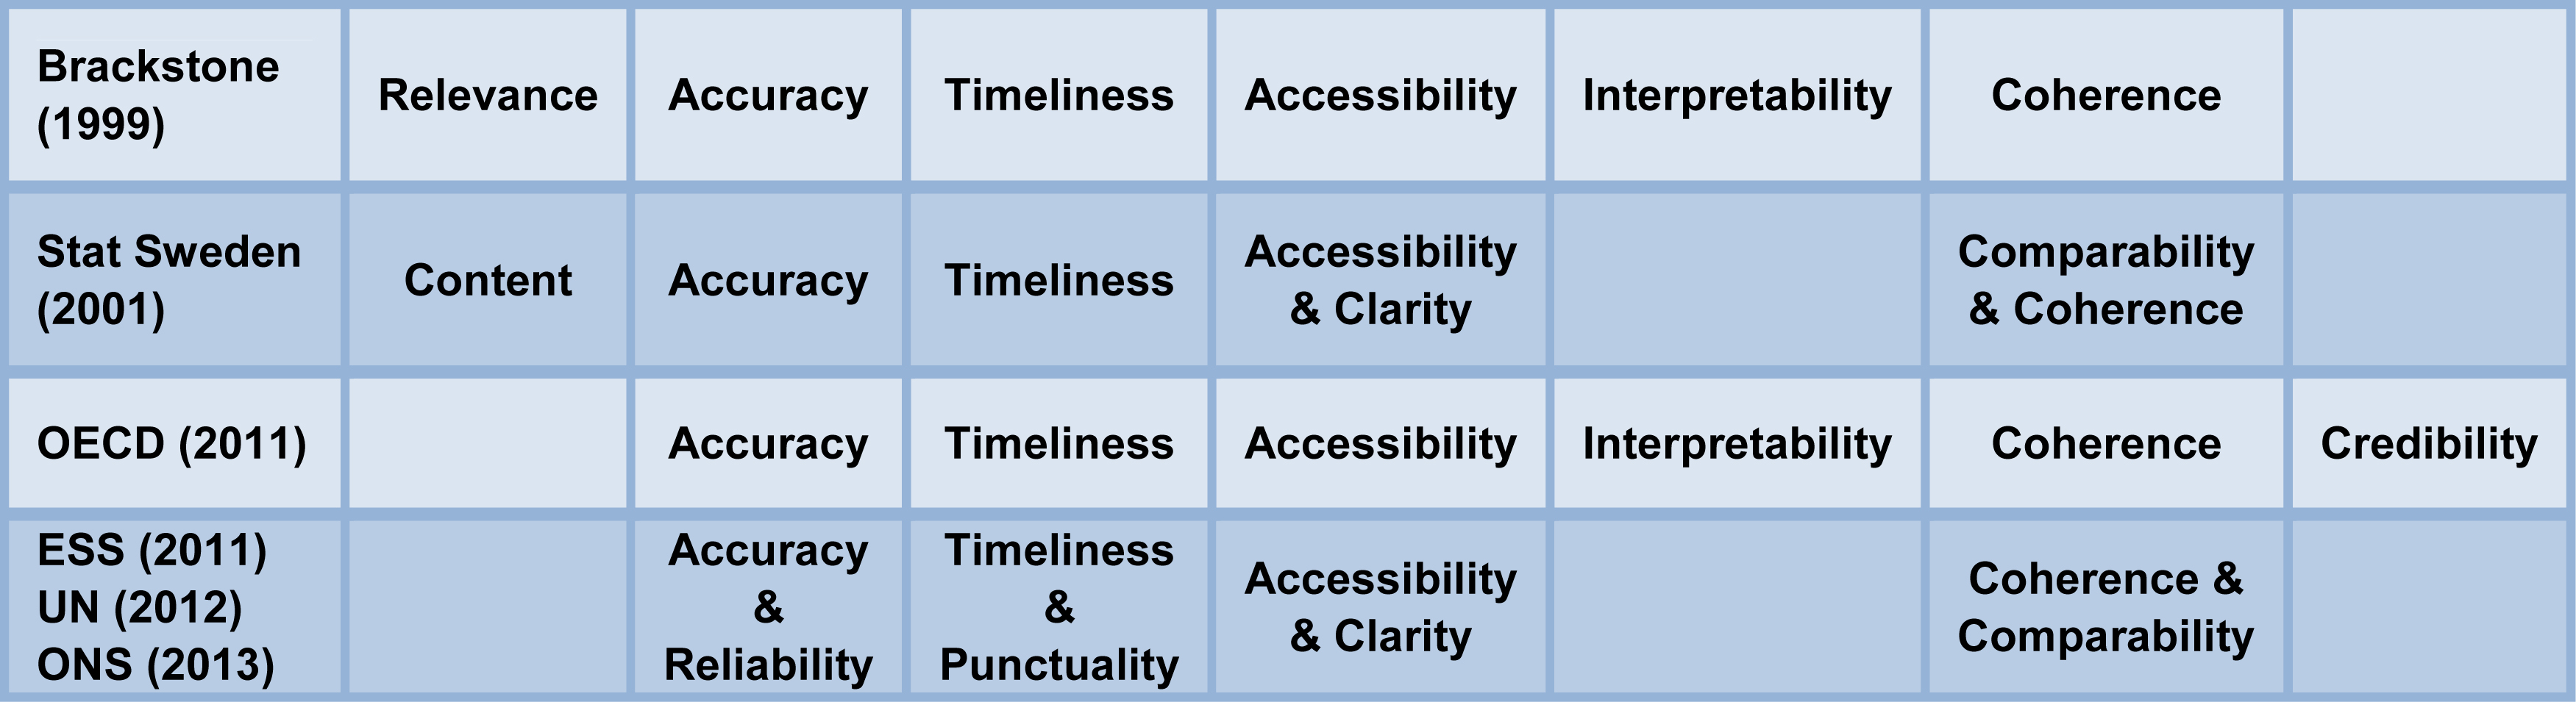
Statistics Canada published the first NSI quality framework [1], with 6 components: relevance, accuracy, timeliness, accessibility, interpretability, and coherence. Sweden’s Statistiska Centralbyran (SCB) [2] followed with its Quality Definition and Recommendations for Quality Declarations of Official Statistics: content, accuracy, timeliness, comparability and coherence, and availability and clarity (Many NSIs had worked on quality since the 1970s, including both SCB and the U.S. Census Bureau, but not established entire frameworks). Figure 1 summarizes a number of recent frameworks.
The International Monetary Fund [3] developed a Data Quality Assessment Framework as part of its Data Quality Program. This Framework had 5 components: integrity, methodological soundness, accuracy and reliability, serviceability (periodic, timely, with a revisions policy), and accessibility.
The Organization for Economic Cooperation and Development [4] has 7 dimensions to quality: relevance; accuracy; credibility; timeliness; accessibility; interpretability; and coherence. The only change from [1] is the addition of credibility. “Confidence by users is built over time. One important aspect is trust in the objectivity of the data. This implies that the data are perceived to be produced professionally in accordance with appropriate statistical standards, and that policies and practices are transparent. For example, data are not manipulated, nor their release timed in response to political pressure”.
The importance of credibility has been demonstrated in recent years in Argentina and Greece. In Argentina the government wanted to minimize knowledge of the national inflation rates, so they stopped using sound statistical practices for its computation. They also outlawed independent attempts to estimate the consumer price index, taking statisticians and economists to court and issuing large fines. The international statistical community [5] worked with the IMF and others tried and apply pressure. This included the IMF refusing to accept the inflation estimates being generated by the statistical office as not credible. Eventually the government rulings were overturned and when a new President was elected one of his first moves was to re-instate the old procedures at the statistical office.
Over the last 10 years as it has dealt with the Great Recession, the European Union has relied on statistical offices in member states to accurately report on their economies. The Greek government had misrepresented its economic condition when applying to join the Euro common currency. When new statisticians reported more truthful numbers, these were challenged in court, with angry Greeks claiming that these data were responsible for additional austerity measures. The Chief Statistician has been threatened with jail and fines [6, 7]; his legal defense is continuing, with support from the International Statistical Institute and other statistical organizations.
The European Statistical System’s (ESS) [8] has 5 components of quality of statistical output: relevance; accuracy and reliability; timeliness and punctuality; accessibility and clarity; and coherence and comparability. ESS makes clear that this isn’t a passive statement of principles. To demonstrate a commitment to quality statistical authorities “systematically and regularly identify strengths and weaknesses to continuously improve process and product quality”. This not only requires an organizational structure for managing quality, but also a focus on procedures to monitor process quality. “Results are analyzed regularly and senior management is informed in order to decide [on] improving actions”.
Figure 2.
GSBPM process structure.
The United Nation’s National Quality Assurance Framework [9] lists the same 5 components as the ESS [8].
The United Kingdom Office of National Statistics (ONS) is now on its 4
A related source of improved quality has been the rise of Professional Codes of Practices in Europe generally and in specific countries [11]. That Code’s 15 principles include independence, confidentiality, quality, etc. In the United States a similar document has been developed by the National Research Council of the National Academies [12]; Principles and Practices for a Federal Statistical Agency and forms the basis for the U.S. Office of Management and Budget’s Statistical Policy Directive No. 1 [13]. This provides a common set of professional standards and operating practices for all of the 13 principal statistical agencies of the US government.
3.From measuring quality to improving quality
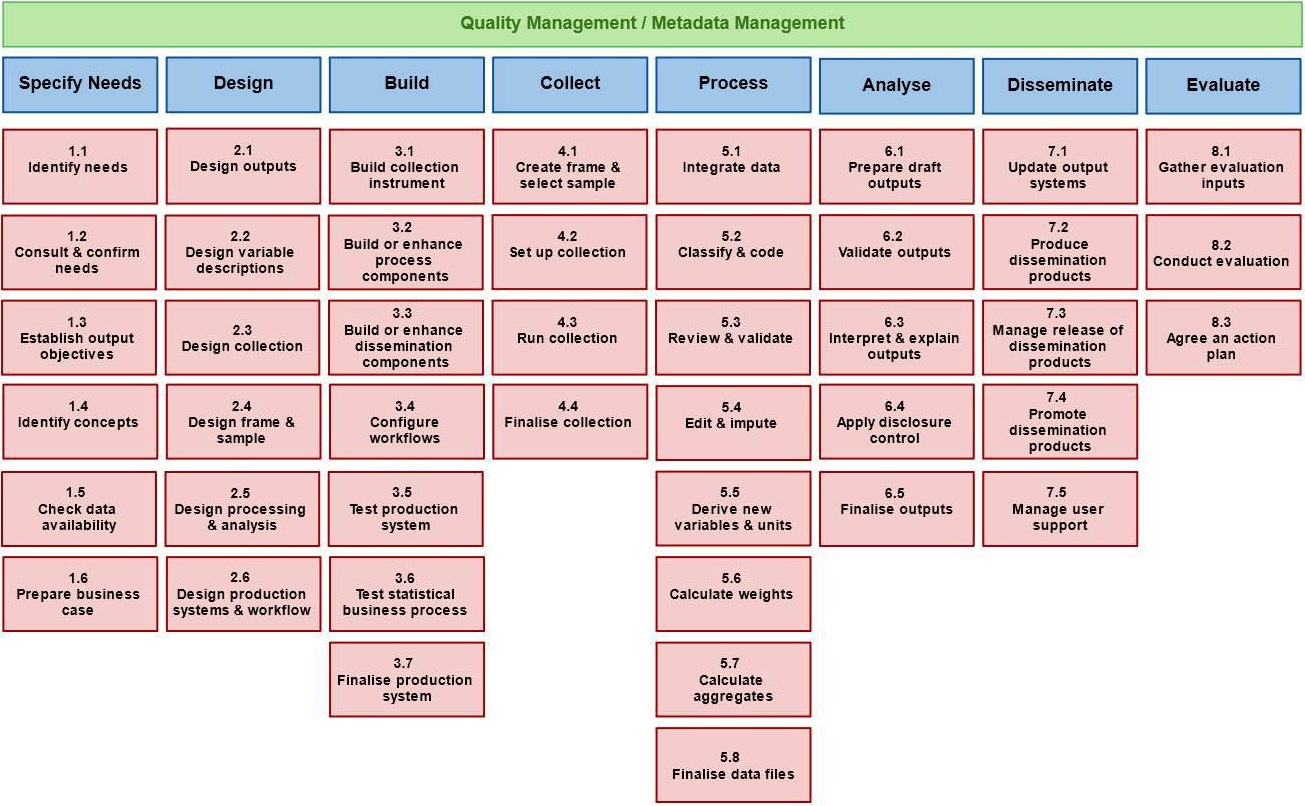
Common Frameworks help communication and understanding. But as was pointed out by Morganstein and Marker [14], and previously by Deming [15], to improve quality one must measure process variables rather than just product (output) variables. In the last 10 years many statistical offices have coalesced around a common description of their processes. The Generic Statistical Business Process Model (GSBPM) is coordinated through the United Nations Economic Commission for Europe [16]. Built upon a process model initially developed by Statistics New Zealand, it currently has support from 50 statistical offices. The basic structure of the GSBPM is shown in Fig. 2.
GSBPM provides a common understanding and language to allow simultaneous improvement of each of the framework components. By focusing one’s efforts on the sub-processes you can eliminate sources of variability that adversely effect many characteristics of the products. For example, improving the sample frame (process 2.4) can eliminate much of the back-end survey cleaning steps and clarify the coverage and eligibility of units on the frame. This will improve accuracy, timeliness, and clarity of the data products.
GSBPM also notes the importance of regular evaluations of all processes, referring to a Plan/Run/Evaluate/ Improve cycle. This is consistent with the Plan/Do/ Check/Act or Plan/Do/Study/Act cycles introduced by Deming [17] over 60 years ago, in turn based on the ideas of Walter Shewhart. This is fundamental to all continuous quality improvement efforts in both the public and private sectors.
There is, however, a component that is often overlooked because it isn’t explicitly listed in any of the frameworks or in the sub-processes of GSBPM. None of these focus on measuring cost as a component of quality. At the very end of the GSBPM, under “other uses of the GSBPM” is the following very important point. “The GSBPM can be used as a basis for measuring the costs of different parts of the statistical business process. This helps to target modernisation activities to improve the efficiency of the parts of the process that are most costly”.
ONS [10] mentions cost after describing the main 5 components. “Cost, performance and respondent burden: These are important process quality components that are not readily covered by the output quality dimensions. There are invariably trade-offs required between all of the output quality components and cost, performance and response burden”. OECD [4] also mentions cost “which though is not strictly speaking, a quality dimension, is still an important consideration”.
For NSIs cost may not only be measured in Euros or dollars, but might be opportunity cost measured in hours. There are many more projects that every NSI can undertake than they have resources for. Obtaining historic response rates requires more expensive mixed-mode data collection, reducing resources for other activities. If a NSI can accomplish all the other components of quality while freeing up resources, it will allow them to improve other aspects of the NSI.
This is particularly true in recent years when there is constant pressure for NSIs to reduce costs. This has led to trade-offs between accuracy, comparability, and costs. By tracking cost associated with the sub-processes of GSBPM, NSIs are better able to maximize their response to these demands.
The author believes the reason cost has not been a central focus is a difference between NSIs focus on measuring quality of their products and services, rather than continuous improvement of quality. The internal cost to produce a database or analysis doesn’t affect the quality to the user, thus is independent of a user’s measure of its quality. But the internal cost is vital to efforts to continuously improve quality, since reducing such cost frees up resources that can be applied to improve the quality of this or other activities. I believe this to be a serious mistake if it happens. To make this mistake would be to release some of the needed pressure that should have remained on quality improvement. Hopefully the many organizations that have adopted various frameworks and GSBPM will take to heart that measuring operational costs should be a vital part of the quality improvement efforts.
4.Assessing quality
For at least 35 years NSIs have tried to assess the quality of their products. One of the first comprehensive attempts was [18] where they produced a quality profile of the many sources of error associated with the U.S. Current Population Survey. More recently there have been internal and external quality assessments, some of which could be performed by the project staff themselves.
Biemer et al. [19] describe the ASPIRE (A System for Product Improvement, Review, and Evaluation) which they developed for SCB. “ASPIRE is a system for assessing the risks of error from each potential source of error in a product and rating progress that has been made to reduce this [sic] risks according to clearly specified evaluation criteria”. ASPIRE examines eight components of error: sampling, frame, nonresponse, measurement, data processing, modeling/estimation, revision, and specification.
Revisions are an important component not getting enough focus. While not an error source, they are an opportunity to simultaneously improve timeliness and to estimate some sampling and non-sampling errors. The ESS [8] Indicator 12.3 states that, “revisions are regularly analyzed in order to improve statistical processes”. OECD [20] provides 8 reasons for revisions, including incorporating data that are more complete or better match the desired concepts, updated base periods, and corrections of errors in the data.
Brackstone [1] and others talk about timeliness as a component of quality. One way NSIs can improve timeliness is preliminary estimates that can then be revised. One beauty of revisions is that they provide a measure of relative “truth,” when preliminary estimates are compared with the revised value after all units have responded. This, in turn, allows for reporting the expected error of the preliminary number that captures some non-sampling error sources as well as sampling error. Measurement and other errors remain; but sampling and nonresponse errors can be eliminated (or greatly reduced) when the revised estimates are produced. These estimated errors are not only more accurate; they can be a way to educate the press and public more about the different sources of error.
While they have 8 components, Biemer et al.’s JOS article focuses on accuracy. They point out that “Biemer and Lyberg [21] viewed accuracy as the dimension to be optimized in a survey while the other dimensions (the so-called user dimensions) can be treated as constraints during the design and implementation phases of production”. I join with Elvers [22] in disagreeing with this as a general approach. As with the point above regarding revision and timeliness, accuracy should be one of the components of quality being optimized, not the only component. Going back to Brackstone [1] he said, “Accuracy is important, but without attention to other dimensions of quality, accuracy alone will not satisfy users”. Lyberg [23] pointed out that “During the last decades it has become obvious that accuracy and relevance are necessary but not sufficient when assessing survey quality”.
ASPIRE provides a formal, but subjective, measure of risk for each of the 8 components. ONS in the early 2000s [24] used informal risk for prioritization to evaluate all major statistical sources. For each source attributes were broken out as either World Class, Sound fundamentals but not World Class, Marked improvements needed for users, or Information recognized as faulty for key users. Based on this sources were identified for which “ONS reputation for quality [was] seriously at risk”. For example, while their New Earnings Survey had World Class estimates by area and industry, the fact that “estimates [are] subject to influence of outliers” and “No major redesign in 30 years” put ONS’ reputation at risk. This process helped ONS acquire major funding to overhaul its entire IT system to eliminate many of the major risks.
More recently Eltinge [25] suggested Total Survey Risk as an alternative to Total Survey Error.
ASPIRE has 5 levels of risk:
• Knowledge of risks.
• Communication with users and data suppliers.
• Available expertise.
• Compliance with standards and best practices.
• Achievement towards risk mitigation or improvement plans.
This provides a nice system for focusing efforts on key products and year-to-year improvement. While many other quality assessments roll across different products of an NSI, with no regular frequency for an updated review, ASPIRE examines each key product annually.
One important limitation is that it is very dependent on the same outside expert reviewers. While this provides consistency in evaluations, it limits the number of products that can be reviewed and lacks the opportunity for fresh review by other experts with creative positive suggestions. As with economic statistics that rotate panels to measure both level and trend, a mixture of new and previous reviewers would likely improve the feedback process.
A fascinating finding from ASPIRE has been that “Measurement error had the highest average inherent risk of any error source. It also ranked near the bottom in percent mitigated risk… Sampling error [on the other hand] ranked the highest in percent mitigated risk”.
This implies that measurement error had many things that could go wrong, but little had been done to address them, while lots of work had been done to reduce sampling error. One wonders if like this focus on sampling error, ASPIREs focus on accuracy over the other 7 components of error is related to its frequency of study?
This is reminiscent of the story of the drunk searching for his car keys under the lamppost. When someone offers to help search he eventually asks, “where exactly do you think you dropped your keys?” When the drunk points to a darker area, he explains that he thought it better to search where there is a lot of light.
5.Know your users
If quality is defined in terms of its use, it is vital to understand your users and their intent for your data. Lyberg [23] lamented how little is known about NSI’s data users.
Costa et al. [26], in the same issue of JOS as Biemer et al., reports that Spanish users don’t rate the quality components equally; the relative weights vary across different types of users. ‘Accuracy and reliability’ was most important overall, but users in central administration viewed it 3
The different foci of each type of user points out not only differences between users, but also that their focus may be on different statistics. There is no reason to think that any particular user cares about all of the products of an NSI. While this complicates the process of understanding the user, it does suggest that producers of main statistical products should identify their primary users and engage in conversations about what quality characteristics are most important to them.
The Government Statistics Division of the U.S. Census Bureau organized a review by a panel of the U.S. National Academy of Sciences, on which the author served. Statistics produced by the Division estimate 14% of U.S. Gross Domestic Product (GDP), so historically the only customer the Government Statistics Division focused on was the Bureau of Economic Analysis (BEA), which produces the U.S. GDP estimates. However, discussions with Division staff and outside users found a wide range of other users, including state and local governments, academics, and others. As part of their response to our report, the Division held a series of meetings with other users to gain their input and identify how their outputs could improve quality to this wider population.
6.Documentation
Clearly, internationally, NSIs are doing a better job of documenting the strengths and weaknesses of our products; almost every study put out by an NSI seems to have a link to a documentation page. But don’t congratulate yourselves too much on this improvement, there was no world wide web in 1990, so almost by default we have better and more accessible documentation. One of the first attempts at survey quality documentation was the Quality Profile [18] mentioned above. But systems like “About the Statistics” on the Statistics Norway website provide a nice summary of many of the important definitions, sources of error, etc. However, Saebo [27] points out that much of the information is dated, and the lack of complaints indicate most users probably don’t use the detail that is provided. Many other NSIs probably have similar systems.
The European Statistical Commission website has a similar page “Statistics Explained” http://ec.europa.eu/ eurostat/statistics-explained/index.php/Main_Page.This is very impressive looking; but one wonders if it suffers from the same concerns that Saebo pointed out?
Deciding how much detail to provide, and how frequently to update, are areas we can all work on. Clearly work is needed to regularly update our documentation. We need to talk with users about what documentation they need access to, in order to prioritize our efforts.
7.Organizational leadership and process improvement focus
Jan Carling was Director General of SCB in the 1990s and was renowned for asking staff what quality improvement processes they were working on (personal communication with the author, 1996). This personal demonstration of a focus on improving quality was understood throughout the organization. The author has never seen a better demonstration of how top managers can truly lead quality improvement. Are any of our current NSI managers demonstrating this personal level of commitment?
Every NSI has had multiple Directors General over the last 20 years. Saebo [27] points to the conflict between Deming’s [15] principle of constancy of purpose and new management and consultant’s desire to demonstrate decisive management practices by renaming similar concepts. The concern is not with differing names for similar concepts; the question is whether renaming and re-organizing have really improved both our products and the vital processes that produce them?
The European Leadership Expert Group [28] was incredibly successful. Every Eurostat country agreed to the need to improve quality. Biannual meetings were held, starting in Stockholm in 2001, to share ideas. Standardized procedures and harmonized definitions across Europe have greatly improved the ability to compare conditions across the continent [16].
Some NSIs have developed Current Best Methods (CBMs) that identify the best way to do important activities, given what we know now. We know that conditions will change in the future, so what is currently best may not be in the future; thus, CBMs will need regular updating. I know this is difficult. In honesty, we have not kept this updating going as well as we should at Westat where I work either. But I remain convinced that training new staff in well-developed CBMs can produce major quality improvements; at the very least by minimizing the re-occurrence of errors we previously produced. Lyberg [23] pointed out how useful CBMs can be. They are described in more detail in Morganstein and Marker [14].
The author believes the most important CBM we developed at Westat is on communication between analysts (statisticians) and programming staff. This form of documentation clearly states inputs (e.g., which version of a particular database to use) and outputs, encourages building in quality checks, and provides vital reference documentation at the end of a survey to explain what was actually done at earlier stages. This CBM was originally developed almost 20 years ago, but I have introduced it to new parts of Westat in the last few years, when questions about how best to communicate were raised.
I am not positive, but the lack of recent publication of examples indicates that the focus on process improvement has waned over the years. In Morganstein and Marker [14] we laid out how one moves from a focus on product characteristics specified (hopefully) by users, to the key processes impacting their quality, and how one measures whether those processes are consistent, and only then can we determine whether they are capable of producing the outputs needed by the NSI. I urge a re-focus on continuously improving quality.
8.Big Data challenge to NSIs
Twenty-five years ago a few NSIs were considering replacing censuses with abstracting from administrative sources [29]. Over the years a number of European NSIs have adopted this new paradigm because of the high quality of these sources. For most NSIs around the world, however, the opportunities to use administrative sources are more limited. Still, because of the web there are additional Big Data sources that have become available and, hence, the pressure to use them continues to grow.
Brown [30] suggested recently (as a discussant at the 2015 Hansen Lecture) that there is probably an agricultural analogy to availability of Big Data. He was inspired by the fact that the Hansen Lecture is presented at the U.S. Department of Agriculture. I agree, and would suggest the following. For close to 100 years, NSIs designed (planted) their data collection to provide efficient samples with good coverage, representative samples, and high response rates. We then harvested the data and processed it to produce a good product using a stable staff that repeatedly used increasingly standardized processing procedures. But, now, NSIs no longer get to plant all the crops in nice orderly ways, sometimes lots of data are made available (e.g., from the web) and for these we may know neither how they were planted nor grown (e.g., How representative are they? Who participated? Was any nonresponse bias analysis done?). For these data we are now only the harvesters of existing crops. Our job, going forward, becomes using our expertise to weed out the useless and improve the possible yield of the rest. Then, like the distillers at Johnny Walker, we have to combine the possible crops (using propensity adjustments, clear statements of non-sampling errors, etc.) into a smooth, satisfying blend.
Many of us hear politicians and scientists saying that we can rely on Big Data to answer statistical questions, whether tracking the next flu epidemic through web-scraping search engines or understanding environmental exposures by simply measuring blood levels (metabolomics) and genetics (genomics). They often forget that the methodology that produced efficient estimates of flu one year produced misleading estimates the next. Without careful weeding and blending the resulting data, inferences will be useless and statistical reputations could easily be ruined.
Puts et al. [31] recently pointed out the importance for editing Big Data before analyzing them. Unfortunately, the velocity and variety of the incoming data make many traditional editing techniques impossible. They found in their paper, however, that a Markov Chain model could be applied to improve the utility of the data.
This clearly calls for NSIs to learn new skills. We want to take advantage of all these new data sources. But we have to determine which, if any, are worth blending with our well-planted and carefully harvested existing surveys.
Big Data does provide a new set of opportunities for statistical offices; but also challenges. Japec et al. [32] urge that surveys and Big Data should be viewed as complementary, not in competition. Tam [33], in discussing Japec et al.’s report, suggested that Big Data should only be used if it improves the product offerings of the NSI or improves the cost efficiency of production. Recently more than 40 experts from different NSIs collaborated on investigating multiple sources of Big Data [34]. They found that “statistics based on Big Data sources will be different from what we have today. Big Data sources can cover aspects of reality that are not covered by traditional ones. On the other hand, such general-purpose sources require a broader interpretation of analysis, often influenced (and sometimes distorted) by events” outside the control of both the data provider and the NSI.
We must make efforts to use administrative and other Big Data, but they cannot be viewed as stand-alone options to well-done surveys. This was also the focus of a recent Waksberg lecture [35].
9.Adaptive design: Timeliness and nonresponse bias
One of the biggest impacts of Big Data has been to change the expectation on timeliness of data. Even if transactional data is not as good on the non-timeliness components of quality, it fits the demands of our now 24-hour news mentality. As Groves [36] has stated, we need to figure out how to do surveys (and censuses) quicker and for lower cost, or users will rely on Big Data without understanding what they are losing. We first demonstrate the pressures for quicker release of data; then discuss how adaptive design can address much of this problem.
The U.S. Bureau of Labor Statistics (BLS) releases estimates of unemployment and job growth the first Friday of each month (for the preceding month), at 8:30 am. Earlier that morning the news programs report various “estimates” from some organization purporting to know what they think BLS will say. The methods used by these organizations are not reported, possibly they talk to their members, but typically they come up with an uninformed number close to the average of the preceding months [37]. The only consistency in these other estimates is how wrong they are. But, of course, they do provide free advertising for their organization. It would be helpful to see an evaluation of whether they are any better than just last month’s BLS estimate, or maybe the 3-month moving average of BLS. At least in this instance as soon as the BLS numbers are released the earlier reports are forgotten, except for the obligatory comment that BLS was “higher (or lower) than experts predicted”.
What is important is that with a 24-hour news cycle the press feels a need to report what they know to be inferior estimates that will be replaced within the hour. There is no advantage to having these earlier estimates available (e.g., the financial markets aren’t open at that hour) but if some organization makes them available the press will report them. This pressure to use whatever data are available has to be recognized by NSIs when they address potential trade-offs between quality components.
One part of addressing the need for more timely release of data is adaptive design [38, 39]. Adaptive design is basically the same idea as monitoring process variables that we argued for in Morganstein and Marker [14]. With real-time monitoring of how the data collection is progressing NSIs can react quickly to improve the quality. Response rates for social statistics are going down everywhere, but are the response rates for certain key domains lower than expected, while higher in others in ways that can introduce nonresponse bias [40]? Can follow-up resources (e.g. interviewer hours) be moved from one domain to the other to get enough responses for all domains? If these decisions are made sooner can we eliminate the final weeks/months of data collection, where much of the cost lies? If we run initial data sets through editing and imputation programs can we identify problems that can be addressed before later respondents have completed their surveys? This may shorten the time period between the end of data collection and publishing findings. The opportunity to shorten both data collection and processing time can significantly improve survey timeliness, while maintaining its high quality.
To do this, though, requires having sufficient paradata on key steps, and that these data are completely filled out. It requires flexibility in staffing, interviewers being able to change assignments and cross-training data processing staff. We have found that none of these are the “traditional” model in a NSI. So management will have to break down these barriers to provide the system needed to take advantage of adaptive design from measuring process variables. But it is only by doing this that we can continuously improve our quality.
In addition to improving timeliness, it is hoped that adaptive designs can also reduce nonresponse bias by reducing differential response rates. Initial results have shown limited success in reducing bias, but have found that adaptive design decisions that improve timeliness can have minimal impact on nonresponse bias [41].
While it is clear that adaptive design has the potential to significantly improve the timeliness of official statistics, more work is needed to identify methods for reducing bias. Over the last 25 years NSIs have become more focused in studying potential nonresponse bias. For example, the U.S. Office of Management and Budget in approving government surveys requires that all surveys having less than an 80 percent response rate must conduct nonresponse bias analyses [42]. So while the potential nonresponse bias has grown with the drop in response rate, our documentation of the problem has improved. Propensity modeling [43], post-stratification [44], and other methods for adjusting for nonresponse are attempts by NSIs to reduce this nonresponse bias.
Figure 3.
NSI quality scorecard.
| Area of improvement | Need to be addressed |
|---|---|
| Sharing ideas and concepts | Focus on process improvement |
| Common frameworks and GSBPM | Measuring cost to improve quality |
| Focusing on risk | Including components other than accuracy |
| Improved knowledge of users | Increased focus on measurement error |
| Documentation | Keeping documentation up to date |
| Current Best Methods | Developing methods for incorporating Big Data |
| Timeliness | Responding to paradata in real time |
| Statistical capabilities in developing nations | Retain the very talented staff in developing countries at home |
10.Work pipeline
There is another challenge to the quality of NSIs that has been growing in recent years. Baby boomers are retiring in large numbers, resulting in a loss of experience throughout government [45, 46]. To address this it is important that NSIs document their key quality processes through CBMs or other means, before it is too late. These documents have to be good enough to pass on the knowledge gained over the years. It is also important to pro-actively seek out new staff and provide them with the necessary training and exposure to quality procedures.
One area in the U.S. that has been greatly affected is the contracts office. NSI staffing have been reduced to the point that, to get the work done, it is essential to get tenders put out for bid, then awarded. Otherwise, statistical offices will not get the support they need. While many other parts of the U.S. Federal government have gotten faster, this one, sadly, has grown slower.
11.Developing countries
One clear area where there have been increased efforts to improve quality is in developing nations. Twenty-five years ago quality improvement efforts were almost exclusively focused in the developed world. The one long-standing exception was the SRC Summer Program created by Leslie Kish that brought individuals to Ann Arbor for training, then returned them to their home countries.
Now there are a number of programs aimed at improving the statistical capabilities in the developing world, including STATCAP, Southern Africa Young Statisticians, the U.N. Handbook on Household Surveys, and the Regional Strategic Framework for Statistical Capacity Building in Africa [47]. STATCAP is a World Bank program of grants and loans with a value over $100 million, over $50 million just for Indonesia. Its goal is to change the structure of the NSIs to support higher quality work, from training, information technology, organization, and skills, to communication. We still have not figured out how to keep newly trained statisticians in their country when higher pay and opportunities can be found in developed nations. But STATCAP has the potential to help, because it supports large international programs to help the entire economy, but understands the central importance of high quality NSIs.
12.Conclusions and summary
Quality has clearly been improving at NSIs over the last 25 years (see Fig. 3). Frameworks have been established, with consistency across countries. International efforts have shared ideas and best practices. There have been improvements in timeliness and communications with clients. More documentation is available. The expectations of clients, however, have also been changing. One example is that the relative importance of accuracy and timeliness is changing, with timeliness taking on more importance in recent years.
There are still major efforts needed to continuously improve. More focus needs to be put on measuring internal processes, costs, and components of quality other than accuracy. Documentation needs to be regularly updated, methods for incorporating Big Data developed, and flexibility improved so that adaptive methods based on paradata can be used.
There is recognition that support for continuous quality improvement cannot be passive; it takes regular management involvement and procedures to be in place for it to succeed [48]. Indeed, the author strongly argues that emphasis needs to move from measuring quality to improving quality. Measurements are vital, but they are not the goal. This will require re-focusing on improving internal processes. It also implies recognizing the need to track costs as a component of quality.
While it will continue to be important for NSIs to increase their use of administrative data and the many sources of Big Data, these will rarely be able to be used as stand-alone sources. More often these sources will need to be combined with well-designed survey data to produce a blended, improved product.
References
[1] | Brackstone G. Managing data quality in a statistical agency. Survey Methodology. (1999) ; 25: (2): 139-149. |
[2] | Statistiska Centralbyran. Quality Definition and Recommendations for Quality Declarations of Official Statistics. (2001) . http://www.scb.se/grupp/hitta_statistik/forsta_statistik/metod/_dokument/mis2001_1.pdf (accessed March 1, 2015). |
[3] | International Monetary Fund (IMF). Data Quality Assessment Framework and Data Quality Program. (2003) . Available at: http://www.imf.org/external/np/sta/dsbb/2003/eng/dqaf.htm (accessed on March 4, 2015). |
[4] | Organization for Economic Cooperation and Development (OECD). (2011) . Quality Framework and Guidelines for OECD Statistical Activities. http://www.oecd.org/officialdocuments/publicdisplaydocumentpdf/?cote=std/qfs%282011%291& doclanguage=en (accessed March 8, 2015). |
[5] | Seltzer W, Kadane JB. Politics and statistics collide in Argentina. Amstat News. (2012) . http://magazine.amstat.org/blog/2012/12/01/argentinastatistics/. |
[6] | Malkoutzis N, Mouzakis Y. An issue of statistical significance in Greece.Ekathimerini.com January 26, (2013) . http://www.ekathimerini.com/148007/article/ekathimerini/comment/an-issue-of-statistical-significance-in-greece. |
[7] | Pop V. EU on Greek statistics scandal: ‘Never again’. EU Observer, April 18, (2012) . https://euobserver.com/economic/115912. |
[8] | European Statistical System. Quality Assurance Framework, (2011) . Available at: http://ec.europa.eu/eurostat/documents/64157/4392716/qaf_2012-en.pdf/8bcff303-68da-43d9-aa7d-325a5bf7fb42. (accessed on March 8, 2015). |
[9] | United Nations. National Quality Assurance Framework, (2012) . http://unstats.un.org/unsd/dnss/docs-nqaf/2012-13-NQAF-E.pdf. (accessed March 14, 2015). |
[10] | Office of National Statistics. Guidelines for Measuring Statistical Quality, (2013) , Version 4.1. http://www.ons.gov.uk/ons/guide-method/method-quality/quality/guidelines-for-measuring-statistical-quality/index.html. (accessed March 8, 2015). |
[11] | Eurostat. European Statistics Code of Practice, (2011) . Available at: http://ec.europa.eu/eurostat/documents/3859598/5921861/KS-32-11-955-EN.DF/5fa1ebc6-90bb-43fa-888f-dde032471e15 (accessed on June 16, 2016). |
[12] | National Research Council. Principles and Practices for a Federal Statistical Agency: Fifth Edition. Washington, DC: The National Academies Press, (2013) . Available at: https:// www.nap.edu/catalog/18318/principles-and-practices-for-a-federal-statistical-agency-fifth-edition. |
[13] | U.S. Office of Management and Budget, (2014) , Statistical Policy Directive No. 1: Fundamental Responsibilities of Federal Statistical Agencies and Recognized Statistical Units. Vol. 79, No. 231. Available at: https://www.gpo.gov/fdsys/pkg/FR-2014-12-02/pdf/2014-28326.pdf (accessed on March 20, 2017). |
[14] | Morganstein DR, Marker DA. Continuous Quality Improvement in Statistical Agencies, in Survey Measurement and Process Quality, Lyberg et al., (1997) . Wiley & Sons, New York, New York, 475-500. |
[15] | Deming WE. Out of the Crisis. Cambridge MA. (1982) . |
[16] | United Nations Economic Commission for Europe (UNECE). Generic Statistical Business Process Model (GSBPM version 5.0). December (2013) . http://www1.unece.org/stat/platform/display/gsbpm/gsbpm+v5.0. (accessed June 4, 2016). |
[17] | Deming WE. Elementary Principles of the Statistical Control of Quality, JUSE. (1950) . |
[18] | Brooks C, Bailar B. An error profile: Employment as measured by the Current Population Survey. Working Paper 3, Office of Management and Budget, Washington, DC. (1978) . |
[19] | Biemer PP, Trewin D, Bergdahl H, Japec L. A system for managing the quality of official statistics. Journal of Official Statistics. (2014) ; 30: (3): 381-416. |
[20] | Organization for Economic Cooperation and Development (OECD). Data and Metadata Reporting and Presentation Handbook. (2007) . https://www.oecd.org/std/37671574.pdf (accessed June 11, 2016). |
[21] | Biemer PP and Lyberg L. Introduction to Survey Quality, John Wiley & Sons, NY. (2003) . |
[22] | Elvers E. Discussion of: A system for managing the quality of official statistics. Journal of Official Statistics. (2014) ; 30: (3): 425-430. |
[23] | Lyberg L. Survey quality. Survey Methodology. (2012) ; 38: (2): 107-130. |
[24] | Linacre S. ONS internal risk matrix communicated to the author by Len Cook. (2002) . |
[25] | Eltinge J. Aggregate and systemic components of risk in total survey error models. Paper presented at ITSEW. (2011) ; Quebec, Canada. |
[26] | Costa A, Garcia J, Raymond JL. Are all quality dimensions of equal importance when measuring the perceived quality of official statistics? Evidence from spain. Journal of Official Statistics. (2014) ; 30: (3): 547-562. DOI: 10.2478/jos-2014-0034. |
[27] | Saebo HV. Quality assessment and improvement methods in statistics – what works? Statistika. (2014) ; 94: (4): 5-14. |
[28] | Lyberg L, Bergdahl M, Blanc M, Booleman M, Grunewald W, Haworth M, Japec L, Jones L, Korner T, Linden H, Lundholm G, Madaleno M, Radermacher W, Signore M, Zilhao MJ, Tzougas I, van Brakel R. Summary report from the Leadership Group (LEG) on Quality. Eurostat. (2001) . |
[29] | Statistics Finland. Use of Registers and Administrative Data Sources for Statistical Purposes, Best Practices of Statistics Finland (2011) . http://www.stat.fi/tup/julkaisut/kasikirjoja_45_en.html (accessed June 11, 2016). |
[30] | Brown L. Comments on the 24 |
[31] | Puts M, Daas P, de Waal T. Finding errors in Big Data. Significance. June (2015) ; 26-29. |
[32] | Japec L, Kreuter F, Berg M, Biemer P, Decker P, Lampe P, Lane J, O’Neil C, Usher A. AAPOR Report on Big Data. (2015) . https://www.aapor.org/AAPORKentico/AAPOR_Main /media/Task-Force-Reports/BigDataTaskForceReport_FINAL_2_12_15_b.pdf. |
[33] | Tam S-M. A statistical framework for analyzing Big Data. The Survey Statistician. (2015) . |
[34] | United Nations Economic Commission for Europe (UNECE). Outcomes of the UNECE Project on Using Big Data for Official Statistics (2016) . http://www1.unece.org/stat/platform/ display/bigdata/Big+Data+in+Official+Statistics (accessed June 11, 2016). |
[35] | Citro C. From multiple modes for surveys to multiple sources for estimates. Survey Methodology. (2014) ; 40: (2). |
[36] | Groves R. Presentation at the offices of the American Statistical Association. (2010) . |
[37] | National Public Radio. Is The Economy Adding Jobs At A Steady Clip? Report Will Offer A Clue. (2016) . http://www.npr.org/2016/06/03/480564732/is-the-economy-adding-jobs-at-a-steady-clip-report-will-offer-a-clue, (accessed June 13, 2016). |
[38] | Schouten B, Calinescu M, Luiten A. Optimizing quality of response through adaptive survey designs. Survey Methodology. (2013) ; 39: (1): 29-58. |
[39] | Tourangeau R, Brick JM, Lohr SL, Li J. Adaptive and responsive survey designs: A review and assessment. Journal of the Royal Statistical Society A. March 10 (2016) . DOI: 10.1111/rssa.12186. |
[40] | Schouten B, Shlomo N. Selecting adaptive design strata with partial r-indicators. International Statistical Review. (2015) ; 1-21. |
[41] | Riddles M, Marker DA, Rizzo L, Wiley E, Zukerberg A. Adaptive Design for the National Teacher Principal Survey. Presented at AAPOR 70 |
[42] | Office of Management and Budget. Standards and Guidelines for Statistical Surveys (2006) . http://www.whitehouse.gov//default/files/omb/assets/omb/inforeg/statpolicy/ standards_stat_surveys.pdf. |
[43] | Ekholm A, Laaksonen S. Weighting via response modeling in the finnish household budget survey. Journal of Official Statistics. (1991) ; 7: (3): 325-37. |
[44] | Valliant R. Poststratification and conditional variance estimation. Journal of the American Statistical Association. (1993) ; 88: : 89-96. |
[45] | Lohr SL. The 2009 morris hansen lecture: The care, feeding, and training of survey statisticians. Journal of Official Statistics. (2010) ; 26: (3): 395-409. |
[46] | Jang D. Discussion of “The 2009 morris hansen lecture: The care, feeding, and training of survey statisticians”. Journal of Official Statistics. (2010) ; 26: (3): 411-415. |
[47] | Sanga D, Dosso B, Gui-Diby S. Tracking progress towards statistical capacity building efforts: The african statistical development index. International Statistical Review. (2011) ; 79: (3): 303-329. |
[48] | Imai M. Kaizen: The Key to Japan’s Competitive Success. Irwin/McGraw-Hill. (1986) . |


