
Non-invasive electrical brain stimulation for vision restoration after stroke: An exploratory randomized trial (REVIS)
Abstract
Background:
Occipital strokes often cause permanent homonymous hemianopia leading to significant disability. In previous studies, non-invasive electrical brain stimulation (NIBS) has improved vision after optic nerve damage and in combination with training after stroke.
Objective:
We explored different NIBS modalities for rehabilitation of hemianopia after chronic stroke.
Methods:
In a randomized, double-blinded, sham-controlled, three-armed trial, altogether 56 patients with homonymous hemianopia were recruited. The three experiments were: i) repetitive transorbital alternating current stimulation (rtACS, n = 8) vs. rtACS with prior cathodal transcranial direct current stimulation over the intact visual cortex (tDCS/rtACS, n = 8) vs. sham (n = 8); ii) rtACS (n = 9) vs. sham (n = 9); and iii) tDCS of the visual cortex (n = 7) vs. sham (n = 7). Visual functions were evaluated before and after the intervention, and after eight weeks follow-up. The primary outcome was change in visual field assessed by high-resolution and standard perimetries. The individual modalities were compared within each experimental arm.
Results:
Primary outcomes in Experiments 1 and 2 were negative. Only significant between-group change was observed in Experiment 3, where tDCS increased visual field of the contralesional eye compared to sham. tDCS/rtACS improved dynamic vision, reading, and visual field of the contralesional eye, but was not superior to other groups. rtACS alone increased foveal sensitivity, but was otherwise ineffective. All trial-related procedures were tolerated well.
Conclusions:
This exploratory trial showed safety but no main effect of NIBS on vision restoration after stroke. However, tDCS and combined tDCS/rtACS induced improvements in visually guided performance that need to be confirmed in larger-sample trials.
NCT01418820 (clinicaltrials.gov)
1Introduction
Homonymous hemianopia is a binocular visual hemifield loss that results from unilateral damage to the central visual pathways, most commonly caused by stroke (Zhang et al., 2006). Visual field defects (VFD) affect around 30 to 50% of stroke patients (Ali et al., 2013; Rowe et al., 2019), hindering activities of daily living, such as reading, mobility, and driving (Gall et al., 2010). Some patients recover either spontaneously (Gray et al., 1989; Tiel & Kolmel, 1991) or after recanalization treatments (Strbian et al., 2012), but recovery beyond the first six months is rare (Ali et al., 2013; Zhang et al., 2006). Moreover, the evidence on the efficacy of vision training after stroke from few randomized clinical trials is limited (Pollock et al., 2019).
Many groups have explored various non-invasive brain stimulation (NIBS) modalities to improve low vision, including transcranial direct current stimulation (tDCS) and repetitive transorbital alternating current stimulation (rtACS) (Sabel et al., 2020). While the physiological NIBS effects on the visual system are insufficiently understood, tDCS and ACS are believed to act by different mechanisms. When delivered at specific frequency bands, ACS can either entrain or disrupt the underlying electrophysiological activity, which modulates the phase coherence of brain oscillations both locally and in anatomically distinct, but functionally connected neuronal assemblies (Bola et al., 2014; Kanai et al., 2008; Zaehle et al., 2010). By setting appropriate stimulation parameters, this can induce a partial restoration of network connectivity by influencing the firing coherence of the belonging nodes (neuronal assemblies) (Bola et al., 2014; Ozen et al., 2010). In patients with optic nerve damage, rtACS has improved visual detection ability and shortened reaction time in a visuo-motor paradigm, which correlated with increased coherence in the electroencephalogram (EEG) alpha frequency band of the brain functional connectivity network (Bola et al., 2014; Gall et al., 2016).
tDCS in combination with visual training has reduced VFD in subacute (Alber et al., 2017) and chronic brain injury in small pilot studies (Halko et al., 2011; Matteo et al., 2017; Plow et al., 2011; Plow et al., 2012), though not all studies have produced positive results (Larcombe et al., 2018). tDCS modulates neuronal excitability in a polarity-dependent way: anodal stimulation excites neuronal assemblies by depolarization, whereas cathodal stimulation causes inhibition by hyperpolarization (Nitsche et al., 2008). After brain damage, the intact hemisphere becomes hyperactive because of the loss of mutual inhibition from the damaged hemisphere and therefore down-modulates the excitability of the damaged side (Rossini et al., 2003). Hence, reducing the excitability of the intact hemisphere with cathodal tDCS might disinhibit the lesioned side, while the anodal tDCS over the damaged cortex increases its excitability.
Based on the above reasoning, we designed a new protocol applying cathodal tDCS over the intact occipital cortex prior to rtACS. We hypothesized that the combined tDCS/rtACS would be more effective than rtACS alone, because reducing the transcallosal inhibition with tDCS over the intact hemisphere might enhance the effect of rtACS.
We carried out a prospective, randomized, double-blinded, exploratory multicenter REVIS trial (“Restoration of Vision after Stroke”) to investigate the safety and efficacy of three different NIBS modalities in rehabilitation of chronic occipital stroke patients with persisting homonymous hemianopia. Our aim was to find the most promising stimulation modality for further refinements and future developments. Hence, the trial was based on three experimental arms: 1) rtACS vs. rtACS preceded by cathodal tDCS vs. sham, 2) rtACS vs. sham, and 3) combined anodal/cathodal tDCS vs. sham.
2Methods
2.1Study design
This randomized, controlled trial was run at three centers: Magdeburg (Germany), Helsinki (Finland), and Rome (Italy) between June 2012 and May 2016 (clinicaltrials.gov NCT01418820). The study protocol has been previously published (Gall et al., 2015). The study was approved by the local ethics committees at all three centers: University of Magdeburg, Medical Faculty (No. 173/13), the Ethics Committee of Helsinki and Uusimaa Hospital District (No. 49/13/03/01/13, date 13/03/2013), and the Ethics Committee of the University Policlinic of Catholic University in Rome (No. 4/2013, date 20/05/2013). All participants gave their written informed consent prior to the intervention.
2.2Subjects
Subjects were screened from medical databases of stroke patients treated in the recruiting centers. Screening comprised an interview and neurological and ophthalmological examinations, including near visual acuity, refraction, high-resolution perimetry (HRP), and static automated perimetry (SAP). All subjects had undergone either brain magnetic resonance imaging or computed tomography.
Inclusion criteria comprised (1) homonymous hemianopia due to ischemic or hemorrhagic stroke, (2) age between 18 and 75 years, (3) lesion age > 6 months, (4) stable VFD across baseline measurements, (5) presence of residual vision i.e. detectable gradual transition between the intact and the absolutely blind part of the visual field according to the evaluation of the clinician, and (6) best corrected visual acuity≥0.4 (20/50 Snellen).
Exclusion criteria were (1) known active malignancy, (2) ophthalmological or neurological disease that might interfere with the study, (3) electronic implants, (4) intracranial or intraorbital metal artifacts, (5) expected low compliance (e.g. dementia), (6) epileptic seizure within 10 years, and (7) use of antiepileptic or sedative drugs.
2.3Randomization
In Experiments 1 and 3, randomization was performed with “Randomization In Treatment Arms” software (RITA, StatSol, Lübeck, Germany). The stratification considered the severity of the VFD at baseline as a potential prognostic factor in blocked randomization. In Experiment 2, blocked randomization without stratification was used. Treatment codes were provided to the therapist who applied the stimulation, but the subjects and diagnostic staff were blinded to the subjects' group allocation.
Originally 57 subjects were randomized, but one was excluded from the Experiment 2 before treatment due to a late-appearing exclusion criterion. The resulting sample sizes in three experiments were (Fig. 1):
Fig. 1
Flowchart of the study. ACS, alternating current stimulation; DCS/ACS, combined direct current stimulation/alternating current stimulation; DCS, direct current stimulation; HRP, high-resolution perimetry; DVA, dynamic visual acuity.
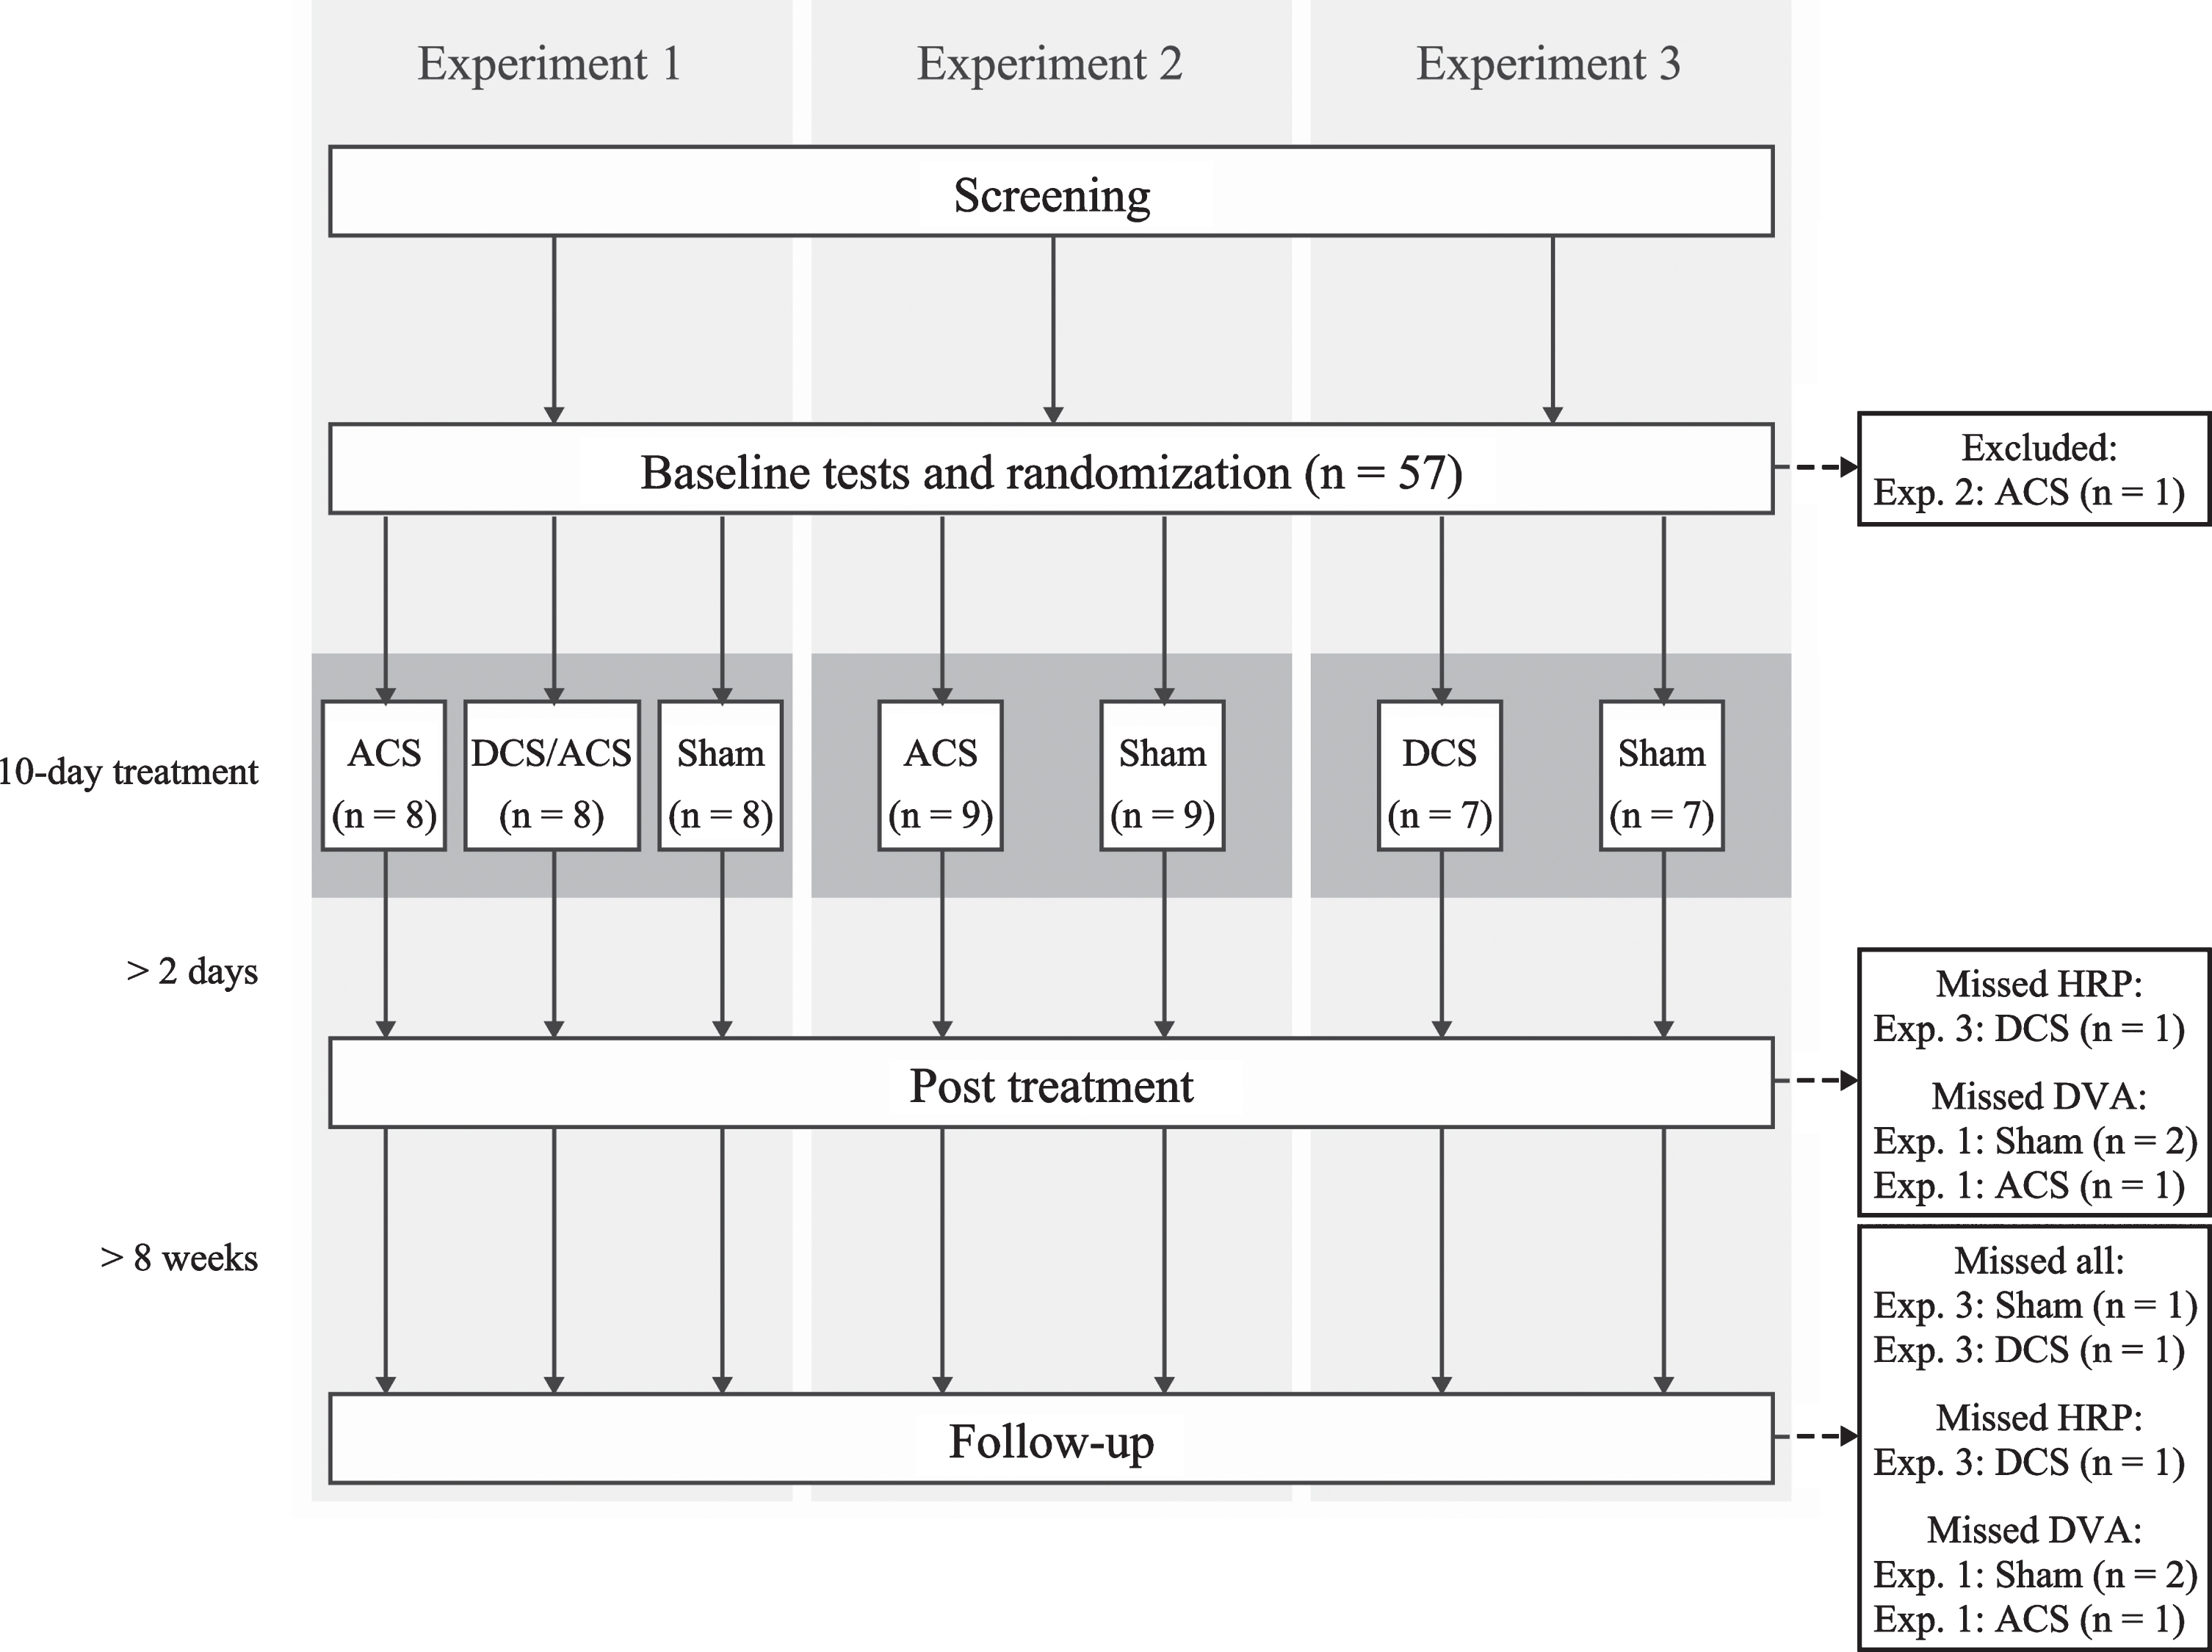
Experiment 1 (Magdeburg): i) sham-tDCS/active rtACS, n = 8, ii) active tDCS/active rtACS, n = 8, iii) sham-tDCS/sham-rtACS (n = 8);
Experiment 2 (Helsinki): i) rtACS (n = 9), ii) sham (n = 9);
Experiment 3 (Rome): i) tDCS (n = 7), ii) sham (n = 7).
2.4Outcome measures
Diagnostic evaluations were carried out at three time points: a baseline assessment prior to the intervention, a post-treatment assessment two to five days after the intervention, and a follow-up assessment at eight weeks (Fig. 1). Examinations included SAP, HRP, visual acuity, and reading performance in all centers. Additionally, contrast sensitivity was performed in Experiments 1 and 3 and dynamic visual acuity (DVA) in Experiment 1.
The primary outcome was change in VFD determined with monocular SAP and binocular computer-based HRP (Kasten et al., 1998). The former measures near-threshold light detection in the 30° visual field, whereas the latter assesses super-threshold visual detection of 12° central vision. In HRP, visual field change was defined by a percentage of correctly-detected stimuli (detection accuracy, DA) and in SAP by mean stimulus detection sensitivity (MS), comparing baseline with post treatment and follow-up. Secondary outcomes included additional variables derived from HRP, SAP, and other functional visual tests.
2.4.1Static automated perimetry
Static monocular visual field perimetry was obtained with a near-threshold Static Automated Perimetry (Oculus Twinfield, Lynnwood, WA in Experiment 1, Octopus 900, Haag-Streit Diagnostics in Experiment 2, and Humphrey Feld Analyzer II-i 750i in Experiment 3). We determined threshold values at 59–76 positions of the 30° visual field, where target stimuli (size: III/4 mm2, color: white, duration: 0.2 s) were presented on a background with constant luminance of 10 cd/m2. MS of all test positions and foveal sensitivity were analyzed. Additionally, in Experiment 1, the sizes of the absolute and relative defect and the intact field were defined as the fraction of test positions detected at none, some, and all of the test times during a session.
2.4.2High resolution perimetry
In the computer-based HRP, static supra-threshold white dots lasting 150 ms were presented in a randomized sequence at 400 positions of a 21×21 grid on a dark screen; the location and number of correctly detected stimuli were registered as described previously (Kasten et al., 1998). Each patient performed three binocular tests that were superimposed to define intact, relative defect, and absolute defect areas of the visual field. Detection accuracy, reaction times, and false positive responses were recorded.
2.4.3Fixation control
To rule out that eye movements influenced HRP results, fixation was monitored with an online eye tracker (Tobii X2-60 Eye Tracker, Tobii Technology AB, Sweden) in Experiments 1 and 2. Test points during which a subject’s gaze deviated outside the predefined area of 2° were disregarded and repeated at the end of the test round. After three consecutive failures, the test was paused, and the subject was encouraged to maintain fixation. Calibration was run to achieve a mean fixation error < 1°. In Experiment 3, the subjects underwent microperimetry to ensure sufficient fixation. Additionally, in all experimental arms, during 10% of the trials, the fixation point changed color isoluminantly to which subjects had to react; the response rate was considered a surrogate of fixation accuracy. In SAP, fixation monitoring depended on the perimetry used; it included either automatic fixation control or manual control with recorded fixation losses, and visual monitoring by a researcher performing the measurement.
2.4.4Functional visual tests
Other measures of visual function included near visual acuity (Oculus® in Experiment 1 and 2 and MNREAD acuity chart in Experiment 3) and reading performance. Reading was examined with international reading speed test (IResT) (Trauzettel-Klosinski & Dietz, 2012), validated for German, Finnish, and Italian languages. The MARS contrast sensitivity test (Dougherty et al., 2005) and computer-assisted DVA test (Wist et al., 1998) were assessed in a subset of experiments as described above.
2.5Non-invasive electrical stimulation protocols
The treatment comprised 10 NIBS sessions with 20–40 min daily stimulation within a two-week period (weekends off). NIBS was delivered with a battery-driven stimulator (MC4, NeuroConn GmbH, Ilmenau, Germany) through conductive-rubber electrodes in saline-soaked sponges, while impedance was kept < 10 kilo-ohm. During the stimulation, subjects sat in a darkened room with their eyes closed. The detailed stimulation parameters for each experiment are described below.
2.5.1Experiment 1
rtACS: The stimulation electrode (5×7 cm) was placed at Fpz according to 10–20-EEG system and the reference electrode (10×10 cm) on the right upper arm. The stimulation was delivered for 20 min daily with the current amplitude of 1.5 mA, clearly above the phosphene threshold, i.e. flickering light sensation for all subjects. Stimulation frequencies gradually increased from 5 to 30 Hz in a 48 s “block” that were repeated until the stimulation time was reached.
tDCS/rtACS: Cathodal tDCS was applied on the intact hemisphere for 10 min immediately prior to rtACS to “prime” the damaged hemisphere for the rtACS effect. The stimulation intensity was 1 mA for all participants via one electrode placed at either the O1 or O2 position (3×3 cm), depending on the side of the lesion. The anode was positioned at Fpz (5×7 cm). rtACS followed the protocol described above.
Sham: The rtACS-sham condition comprised occasional current bursts (one 5 Hz burst every 1 min) at 100% of the phosphene threshold that induced weak phosphenes to ensure blinding (Gall et al., 2016). In the tDCS-sham condition, current was ramped up for 30 s, then stopped, and at the end of the session ramped down for another 30 s, which enabled eliciting few cutaneous sensations.
2.5.2Experiment 2
rtACS: The two stimulating electrodes (3×3 cm) were placed on the forehead at Fp1 and Fp2, while the reference electrode (5×7 cm) was positioned on the right forearm. The stimulation was delivered for 30 min during treatment days 1–5 and for 40 min during days 6–10. Stimulation was delivered sequentially at each stimulation electrode with frequencies gradually increasing from 5 to 15 Hz in a 48-s “block”. The current amplitude was individually adjusted to be at 100–150% of phosphene threshold (0.45–1.5 mA peak-to-peak), which was defined at the beginning of every stimulation session.
Sham: The sham condition comprised occasional current bursts of ten pulses (one 5-Hz burst every 5 min) at 100% of the phosphene threshold to induce weak phosphenes to ensure blinding.
2.5.3Experiment 3
tDCS: tDCS was delivered as bilateral, dual-mode stimulation over the visual cortex. Two stimulating electrodes (5×5 cm) were at O1 and O2 positions: the stimulating anodal electrode over the injured occipital lobe and the stimulating cathodal electrode over the intact hemisphere. Their respective cathodal and anodal pairs (5×5 cm) were placed at Fp1 and Fp2. tDCS was delivered with fixed 2-mA amplitude for 20 min daily (30-s fade-in).
Sham: The sham condition was identical to the one in Experiment 1.
2.6Statistical analyses
Statistical analyses were executed with SPSS Statistic 25 (IBM Corporation, Armonk, NY, USA). Normality of the data was evaluated with Shapiro-Wilk and Kolmogorov-Smirnov tests. Given the small sample size and non-normal distribution of continuous variables, we report their medians and interquartile ranges (IQR) and used non-parametric methods for analyses. Significance was two-sided p < 0.05 (trends at p < 0.10).
The different treatment arms were compared within each experiment. The absolute changes of outcome variables between post treatment and baseline, and follow-up and baseline were compared between the groups with either Mann-Whitney U test or Kruskal-Wallis analysis of variance, in case of more than two groups. Post hoc pairwise comparisons were performed with Dunn test if a difference between the groups and the omnibus test were significant. We conducted within-group comparisons with Friedman two-way analysis of variance and post hoc pairwise comparisons with Wilcoxon signed-rank test. Bonferroni correction was applied for post hoc tests. If outcome data were missing at follow-up, they were replaced with subjects’ post-treatment results; if a subject had neither post-treatment nor follow-up data, they were excluded from the statistical analyses of that variable. Effect sizes were assessed as estimates of median differences and 95% -confidence intervals (CI) were calculated with the Hodges-Lehmann method. Dichotomous variables were analyzed with χ² test or Fisher’s exact test.
3Results
3.1Demographics and baseline characteristics
Altogether 50 subjects underwent all scheduled outcome measurements. In Experiment 1, three subjects missed DVA at post treatment and follow-up. In Experiment 2, all subjects underwent all measurements. In Experiment 3, one patient in the tDCS group missed post-treatment HRP + all follow up measurements, one subject in the tDCS group missed follow-up HRP, and one subject in the sham group missed all follow-up measurements (Fig. 1). Median age of the subjects in Experiment 1 was 58 years and 87.5% were men, whereas the numbers were 58 years and 72.2% in Experiment 2, and 68 years and 71.4% in Experiment 3. Infarct affected the right hemisphere in 58.3%, 55.6%, and 85.7%, respectively. The groups in each experiment did not differ in their demographics nor in their baseline measurements (Table 1).
Table 1
Demographics and baseline measurements of the treatment groups in Experiments 1, 2, and 3
| Experiment 1 | Experiment 2 | Experiment 3 | |||||||||||||
| All (n = 24) | Sham (n = 8) | ACS (n = 8) | DCS/ACS (n = 8) | p | All (n = 18) | Sham (n = 9) | ACS (n = 9) | p | All (n = 14) | Sham (n = 7) | DCS (n = 7) | p | |||
| Demographics | |||||||||||||||
| Age (y), median (IQR) | 58 (51–66) | 64 (59–67) | 54 (51–66) | 52 (45–64) | 0.12 | 58 (36–67) | 57 (36–69) | 59 (34–66) | 0.71 | 68 (60–73) | 65 (57–68) | 72 (67–81) | 0.06 | ||
| Male sex, n (%) | 21 (87.5) | 6 (75.0) | 7 (87.5) | 8 (100.0) | 0.75 | 13 (72.2) | 7 (77.8) | 6 (66.7) | 1.00 | 10 (71.4) | 6 (85.7) | 4 (57.1) | 0.56 | ||
| Infarct side, right, n (%) | 14 (58.3) | 5 (62.5) | 5 (62.5) | 4 (50.0) | 1.00 | 10 (55.6) | 5 (55.6) | 5 (55.6) | 1.00 | 12 (85.7) | 7 (100.0) | 5 (71.4) | 0.46 | ||
| HRP | |||||||||||||||
| DA (%), median (IQR) | 55.9 (53.0–63.9) | 57.0 (49.9–73.6) | 54.0 (47.4–57.9) | 58.0 (55.4–67.1) | 0.31 | 74.0 (60.0–78.8) | 76.0 (62.0–81.0) | 72.0 (60.0–79.5) | 0.85 | 70.0 (51.5–78.3) | 55.7 (25.7–72.7) | 74.3 (65.3–80.0) | 0.16 | ||
| RT (ms), median (IQR) | 439 (401–477) | 437 (392–523) | 435 (397–471) | 441 (405–470) | 0.96 | 416 (380–476) | 418 (395–521) | 414 (370–447) | 0.55 | 488 (429–550) | 515 (436–589) | 468 (405–537) | 0.62 | ||
| Absolute defect (%), median (IQR) | 38.6 (31.0–44.8) | 35.5 (18.1–42.7) | 44.7 (33.2–47.0) | 37.4 (27.2–42.0) | 0.21 | 24.8 (18.2–37.0) | 23.2 (16.0–34.8) | 26.8 (17.8–37.6) | 0.73 | – | – | – | – | ||
| Relative defect (%), median (IQR) | 6.7 (3.8–15.1) | 13.8 (3.1–2.8) | 6.6 (3.1–14.6) | 6.0 (3.9–8.9) | 0.63 | 5.0 (3.4–7.0) | 5.2 (3.2–9.9) | 4.3 (3.3–6.7) | 0.53 | – | – | – | – | ||
| Intact field (%), median (IQR) | 52.6 (46.1–61.1) | 52.8 (37.4–63.1) | 49.6 (39.0–55.5) | 55.3 (51.9–64.0) | 0.30 | 71.1 (58.4–76.9) | 72.5 (57.8–79.3) | 69.8 (57.6–75.9) | 0.80 | – | – | – | – | ||
| FA (%), median (IQR) | 98 (96–99) | 97 (96–100) | 97 (96–100) | 99 (96–99) | 0.59 | 98 (95–100) | 98 (92–100) | 98 (95–100) | 0.41 | 90 (65–97) | 93 (66–97) | 88 (61–97) | 0.88 | ||
| False positives (%), median (IQR) | 1.1 (0.4–2.1) | 1.6 (0.5–4.1) | 0.7 (0.4–1.5) | 0.8 (0.4–3.0) | 0.64 | 1.0 (0.8–2.0) | 1.0 (0.5–2.5) | 1.0 (0.5–1.5) | 0.48 | 2.3 (1.5–4.3) | 1.7 (1.0–3.0) | 3.3 (1.7–5.3) | 0.33 | ||
| SAP | |||||||||||||||
| MS, ILE (dB), median (IQR) | 12.6 (10.3–15.0) | 12.7 (10.5–16.5) | 11.5 (8.6–15.2) | 12.6 (11.5–13.7) | 0.59 | 17.7 (14.9–19.2) | 17.7 (14.3–19.4) | 17.7 (14.9–18.6) | 0.75 | 17.5 (12.7–22.2) | 19.1 (9.0–21.6) | 15.9 (13.5–23.2) | 0.54 | ||
| MS, CLE (dB), median (IQR) | 13.5 (11.6–15.7) | 14.0 (11.9–16.6) | 12.9 (8.9–16.2) | 13.5 (11.9–14.9) | 0.77 | 18.2 (16.3–20.3) | 17.6 (15.1–20.8) | 18.7 (16.1–19.8) | 0.98 | 16.8 (12.8–22.0) | 17.3 (10.5–22.3) | 16.4 (13.5–21.9) | 1.00 | ||
| FS, ILE (dB), median (IQR) | 26.0 (25.0–27.0) | 26.0 (25.3–26.8) | 25.5 (22.8–27.0) | 27.5 (25.3–28.0) | 0.18 | 32.0 (26.8–32.3) | 32.0 (26.5–33.0) | 31.0 (26.5–32.0) | 0.32 | 35.0 (30.8–37.0) | 35.0 (30.0–37.0) | 35.0 (32.0–36.0) | 0.81 | ||
| FS, CLE (dB), median (IQR) | 26.0 (24.0–27.0) | 26.0 (22.3–26.0) | 26.0 (23.3–27.8) | 26.5 (24.3–27.8) | 0.39 | 32.0 (29.5–33.0) | 32.0 (29.0–32.5) | 32.0 (30.0–33.0) | 0.41 | 35.0 (31.3–36.3) | 36.0 (29.0–38.0) | 35.0 (33.0–36.0) | 0.51 | ||
| Absolute defect, ILE (%), median (IQR) | 34.1 (20.1–42.0) | 31.1 (13.6–36.0) | 40.9 (17.4–51.9) | 34.1 (24.2–45.8) | 0.37 | – | – | – | – | – | – | – | – | ||
| Absolute defect, CLE (%), median (IQR) | 28.8 (18.2–40.5) | 22.7 (11.0–33.3) | 37.1 (17.8–48.5) | 33.3 (22.7–42.0) | 0.10 | – | – | – | – | – | – | – | – | ||
| Relative defect, ILE (%), median (IQR) | 6.8 (3.0–13.3) | 4.5 (1.9–13.6) | 9.8 (3.4–11.7) | 8.3 (3.0–17.0) | 0.63 | – | – | – | – | – | – | – | – | ||
| Relative defect, CLE (%), median (IQR) | 6.1 (1.9–13.6) | 11.4 (2.3–17.4) | 6.1 (1.5–12.1) | 4.5 (3.4–10.6) | 0.57 | – | – | – | – | – | – | – | – | ||
| Intact field, ILE (%), median (IQR) | 59.1 (48.5–66.7) | 66.7 (51.5–76.9) | 50.8 (39.0–68.9) | 55.3 (48.5–62.1) | 0.20 | – | – | – | – | – | – | – | – | ||
| Intact field, CLE (%), median (IQR) | 59.9 (56.6–73.9) | 65.9 (55.3–79.2) | 58.3 (39.8–71.6) | 59.1 (54.9–72.3) | 0.61 | – | – | – | – | – | – | – | – | ||
| VA (decimal), median (IQR) | 1.4 (0.8–1.4) | 1.3 (0.8–1.4) | 1.4 (0.8–1.4) | 1.2 (0.8–1.4) | 0.94 | 1.1 (0.8–1.4) | 1.4 (0.9–1.4) | 1.0 (0.8–1.4) | 0.58 | 1.3 (1.0–1.3) | 1.3 (1.0–1.3) | 1.0 (1.0–1.3) | 0.43 | ||
| RS (words/min), median (IQR) | 126 (93–150) | 130 (84–148) | 109 (82–183) | 129 (120–145) | 0.90 | 122 (98–137) | 117 (78–138) | 122 (101–134) | 0.78 | 137 (104–160) | 138 (58–156) | 128 (120–171) | 0.90 | ||
| CS (logMAR), median (IQR) | 1.76 (1.72–1.79) | 1.74 (1.72–1.76) | 1.76 (1.73–1.83) | 1.76 (1.76–1.79) | 0.23 | – | – | – | – | 1.65 (1.50–1.65) | 1.65 (1.50–1.65) | 1.65 (1.50–1.65) | 1.00 | ||
| DVA (%), median (IQR) | 75.0 (60.9–91.3) | 76.3 (23.1–92.5) | 75.0 (57.8–79.1) | 81.9 (68.6–92.2) | 0.82 | – | – | – | – | – | – | – | – | ||
Between-group p values for continuous variables were calculated with Mann-Whitney U test or Kruskal-Wallis analysis of variance test in case of more than two groups and for dichotomous variables with Fisher’s exact test. ACS, alternating current stimulation; DCS/ACS, combined cathodal direct current stimulation and alternating current stimulation; DCS, direct current stimulation; HRP, high-resolution perimetry; DA, detection accuracy; RT, response time; FA, fixation accuracy; SAP, static automated perimetry; MS, mean sensitivity; FS, foveal sensitivity; ILE, ipsilesional eye; CLE, contralesional eye; VA, visual acuity; RS, reading speed; CS, contrast sensitivity; DVA, dynamic visual acuity.
3.2Effects of therapy
3.2.1Experiment 1: rtACS vs. tDCS/rtACS vs. sham
3.2.1.1 Primary outcomes: The median change of DA from baseline was 0.2 percentage points (pp) (IQR –1.3–0.3) in the rtACS group, 0.7 pp (IQR -0.2-1.2) in the tDCS/rtACS group, and 1.3 pp (IQR -0.4-2.1) in the sham group and did not differ between the groups (H(2) = 3.10, p = 0.213) (Fig. 2, Table 2). The median change of MS at post treatment in the ipsilesional eye was –0.1 dB (IQR –0.8–0.4) after rtACS, 0.3 dB (IQR –0.3–0.4) after tDCS/rtACS, and 0.7 dB (IQR 0.04–1.4) after sham and in the contralesional eye –0.3 dB (IQR –1.0–0.2), 0.4 dB (IQR –0.2–0.7), and 0.7 dB (IQR 0.1–1.2), respectively, with a significant between-group difference in the contralesional eye (H(2) = 6.26, p = 0.044). Pairwise comparisons revealed that the difference was significant between the rtACS and sham group, resulting in estimated median difference of –1.1 dB (95% CI, –1.9– –0.2, Z = 2.48, adj. p = 0.040). MS improved in the both eyes within the sham group (ipsilesional: H(2) = 6.47, p = 0.039; contralesional: H(2) = 7.75, p = 0.021), but pairwise comparisons showed a significant difference only in the contralesional eye at post treatment (Z = –2.75, adj. p = 0.018, estimated median difference 0.7 dB [95% CI, 0.05–1.2]), but no other significant within-group changes occurred. No changes from baseline were detected at the 2-month follow-up measurement.
Table 2
Results of Experiment 1: Sham vs. ACS vs. DCS/ACS
| BASELINE –POST TREATMENT CHANGE | BASELINE –FOLLOW-UP CHANGE | Within-group p | |||||||||||
| Median (IQR) | Between-group | Median (IQR) | Between-group | ||||||||||
| Sham (n = 8) | ACS (n = 8) | DCS/ACS (n = 8) | Estimated median difference (95% CI) | p | Sham (n = 8) | ACS (n = 8) | DCS/ACS (n = 8) | Estimated median difference (95% CI) | p | Sham | ACS | DCS/ACS | |
| HRP | |||||||||||||
| DA (pp) | 1.3 (–0.1–3.4) | 0.2 (–1.3–0.3) | 0.7 (–0.2–1.2) | – | 0.213 | 0.3 (–0.4–1.6) | –0.4 (–1.3–0.01) | 0.6 (–0.4–1.4) | – | 0.091 | 0.284 | 0.072 | 0.250 |
| RT (ms) | 11 (–5–42) | 7 (–6–12) | –3 (–21–10) | – | 0.271 | 11 (–2–58) | 15 (–3–35) | –3 (–15–6) | – | 0.107 | 0.417 | 0.223 | 0.284 |
| Abs. defect (pp) | –0.8 (–5.3–1.6) | –0.3 (–1.3–1.3) | 0.1 (–1.7–3.1) | – | 0.611 | –0.1 (–0.9–4.2) | 0.2 (–0.7–1.0) | 0.0 (–1.3–1.5) | – | 0.911 | 0.657 | 0.657 | 0.875 |
| Rel. defect (pp) | 0.5 (–5.1–2.2) | –0.7 (–0.7–1.5) | 0.9 (–1.5–2.6) | – | 0.888 | –0.5 (–8.7–1.8) | –0.8 (–1.9–2.3) | 0.9 (–2.1–1.7) | – | 0.676 | 0.657 | 0.419 | 0.687 |
| Intact field (pp) | 0.6 (–2.3–6.2) | –0.6 (–1.8–1.4) | 0.2 (–7.5–1.5) | – | 0.812 | –0.2 (–1.5–8.2) | 0.2 (–2.0–1.9) | 0.5 (–3.9–2.1) | – | 0.920 | 1.000 | 1.000 | 0.485 |
| FA (pp) | –0.4 (–2.5–0.8) | 0.4 (–0.5–2.9) | 0.7 (–0.008–1.9) | – | 0.162 | –0.4 (–6.9–1.9) | 0.9 (–1.9–8.3) | –0.6 (–1.1–1.3) | – | 0.564 | 0.725 | 0.508 | 0.356 |
| False positives (pp) | 0.02 (–0.4–1.4) | –0.1 (–0.6–0.1) | –0.6 (–1.2– –0.1) | – | 0.167 | 0.2 (–0.2–0.9) | –0.3 (–0.9–0.1) | –0.3 (–0.5–0.3) | – | 0.297 | 1.000 | 0.417 | 0.028j; |
| B-PT | |||||||||||||
| 0.026 | |||||||||||||
| SAP | |||||||||||||
| MS, ILE (dB) | 0.7 (0.04–1.4) | –0.1 (–0.8–0.4) | 0.3 (–0.3–0.4) | – | 0.060 | 0.3 (–0.05–0.7) | 0.07 (–0.6–0.2) | 0.5 (–0.5–1.2) | – | 0.454 | 0.039g; | 0.607 | 0.417 |
| n.s. | |||||||||||||
| MS, CLE (dB) | 0.7 (0.1–1.2) | –0.3 (–1.0–0.2) | 0.4 (–0.2–0.7) | –1.1 (–1.9– –0.2)a | 0.044d; | 0.3 (–0.3–0.6) | –0.3 (–1.2–0.7) | 0.7 (–0.3–1.1) | – | 0.213 | 0.021h; | 0.417 | 0.135 |
| B-PT | |||||||||||||
| 0.018 | |||||||||||||
| FS, ILE (dB) | –0.5 (–1.0–0.0) | 1.0 (0.0–2.0) | 0.5 (0.0–1.8) | 2.0 (1.0–2.0)a | 0.010e; | 0.0 (–0.8–0.8) | 0.5 (–0.8–1.0) | 0.0 (0.0–0.8) | – | 0.781 | 0.102 | 0.084 | 0.483 |
| ACS-Sh | |||||||||||||
| 0.013 | |||||||||||||
| FS, CLE (dB) | 0.0 (–1.0–1.8) | 0.0 (0.0–1.5) | 0.5 (0.0–1.8) | – | 0.717 | 0.0 (–1.0–1.5) | 0.0 (–0.8–2.5) | 1.0 (0.0–1.8) | – | 0.565 | 0.692 | 0.646 | 0.108 |
| Abs. defect, ILE (pp) | –2.3 (–4.2–2.3) | 0.0 (–1.5–6.1) | 0.0 (–2.7–1.5) | – | 0.423 | –0.8 (–3.0–2.3) | 0.8 (–1.5–3.0) | –3.0 (–5.7–4.9) | – | 0.591 | 0.289 | 0.898 | 0.670 |
| Abs. defect, CLE (pp) | 0.0 (–2.7–1.1) | 0.8 (–2.7–1.5) | –0.8 (–2.7–1.1) | – | 0.811 | 0.0 (0.0–1.1) | 0.0 (–6.1–6.1) | –1.5 (–5.7–1.5) | – | 0.069 | 0.638 | 0.798 | 0.009k; |
| B-FU | |||||||||||||
| 0.026 | |||||||||||||
| Rel. defect, ILE (pp) | 0.0 (–2.7–3.0) | 0.0 (–6.1–2.7) | –0.8 (–2.7–1.5) | – | 0.855 | 0.0 (–4.5–2.7) | –1.5 (–2.7–3.0) | –1.5 (–4.2–1.1) | – | 0.763 | 0.961 | 0.687 | 0.725 |
| Rel. defect, CLE (pp) | –2.3 (–3.0– –0.4) | 2.3 (–1.1–5.7) | 0.0 (–1.5–3.0) | – | 0.071 | 0.0 (–3.0–0.0) | 2.3 (0.0–9.1) | 2.3 (0.0–5.7) | – | 0.104 | 0.154 | 0.140 | 0.096 |
| Intact field, ILE (pp) | 2.3 (–2.3–6.4) | –0.8 (–3.0–2.7) | 0.8 (–1.1–2.7) | – | 0.464 | 0.0 (–2.3–2.3) | –0.8 (–2.7–2.7) | 3.0 (–0.8–4.6) | – | 0.205 | 0.495 | 0.779 | 0.177 |
| Intact field, CLE (pp) | 1.5 (0.4–5.7) | –2.3 (–5.7– –0.4) | 1.5 (–0.8–2.7) | –6.1 (–9.1– –1.5)a | 0.013f; | 0.0 (–2.3–1.5) | –1.5 (–6.4–1.1) | 1.5 (0.0–1.5) | – | 0.342 | 0.080 | 0.039i; | 0.102 |
| Sh-ACS | n.s. | ||||||||||||
| 0.017 | |||||||||||||
| VA (decimal) | 0.0 (–0.4–0.0) | 0.0 (–0.08–0.0) | 0.0 (0.0–0.2) | – | 0.561 | –0.1 (–0.3–0.0) | 0.0 (0.0–0.3) | 0.1 (0.0–0.2) | – | 0.145 | 0.268 | 0.174 | 0.291 |
| RS (w/min) | 4.2 (–7.5–9.3) | 6.5 (–7.8–14.6) | 4.6 (–6.8–19.2) | – | 0.850 | 6.5 (–4.5–16.0) | 6.0 (–5.3–22.3) | 14.5 (5.3–21.0) | – | 0.382 | 0.284 | 0.792 | 0.005l; |
| B-FU | |||||||||||||
| 0.005 | |||||||||||||
| CS (logMAR) | 0.04 (0.00–0.07) | 0.00 (0.00–0.04) | 0.00 (–0.07–0.05) | – | 0.408 | 0.00 (0.00–0.00) | 0.02 (–0.03–0.04) | 0.00 (–0.04–0.09) | – | 0.796 | 0.196 | 0.554 | 0.568 |
| DVA (pp) | 2.5 (–1.6–9.1)b | 0.0 (–1.3–11.3)c | 5.0 (1.9–9.7) | – | 0.719 | –5.0 (–14.4–2.2)b | 1.3 (–10.0–3.8)c | 0.6 (0.0–7.5) | – | 0.356 | 0.385 | 0.772 | 0.025m; |
| B-PT | |||||||||||||
| 0.037 | |||||||||||||
P values were calculated with Kruskal-Wallis test with post hoc pairwise comparison with Dunn test (between groups) and Friedman two-way analysis of variance test with post hoc pairwise comparison with Wilcoxon signed-rank test (within groups). Estimated median differences between groups and 95% -confidence intervals (CI) were calculated with the Hodges-Lehmann method for variables and treatment arms with significant between-group difference after pairwise comparison. Significant p values are bolded. ACS, alternating current stimulation; DCS/ACS, combined cathodal direct current stimulation / alternating current stimulation; HRP, high-resolution perimetry; DA, detection accuracy; RT, response time; FA, fixation accuracy; SAP, static automated perimetry; MS, mean sensitivity; FS, foveal sensitivity; ILE, ipsilesional eye; CLE, contralesional eye; VA, visual acuity; RS, reading speed; CS, contrast sensitivity; DVA, dynamic visual acuity; aCounted for ACS vs. sham, negative values favoring sham and positive ACS, bn = 6, cn = 7; dpost hoc p for Sham-ACS 0.040; epost hoc p for ACS-Sham 0.013; fpost hoc p for Sham-ACS 0.017; gpost hoc p n.s; hpost hoc p for baseline vs. post treatment 0.018; ipost hoc p n.s.; jpost hoc p for baseline vs. post treatment 0.026; kpost hoc p for baseline vs. follow-up 0.026; lpost hoc p for baseline vs. follow-up 0.005; mpost hoc p for baseline vs. post treatment 0.037.
3.2.1.2 Secondary outcomes: We observed some improvements within the tDCS/rtACS group (Table 2), whereby the absolute defect in the contralesional eye diminished (H(2) = 9.36, p = 0.009); pairwise comparisons showed a significant –1.5 pp (IQR –5.7–1.5) decrease at follow-up (Z = 2.63, adj. p = 0.026, estimated median difference –3.0 pp [95% CI, –5.3– –0.8]). Reading speed increased 4.6 words/min (IQR –6.8–19.2) to post treatment and 14.5 words/min (IQR 5.3–21.0) to follow-up (H(2) = 10.52, p = 0.005), the latter of which reached statistical significance (Z = –3.13, adj. p = 0.005, estimated median difference 14 words/min [95% CI, 6.5–27.0]). Furthermore, average DVA improved 5.0 pp (IQR 1.9–9.7) to post treatment (H(2) = 7.36, p = 0.025; post hoc Z = –2.50, adj. p = 0.037); however, due to a small sample size the Hodges-Lehman estimator had CI reaching both sides of zero (5.3 pp, [95% CI, –5.0–10.6]). Finally, the false positive responses in HRP decreased to post treatment (H(2) = 7.16, p = 0.028; post hoc Z = 2.63, adj. p = 0.026, estimated median difference –0.6 pp [95% CI, –1.0– –0.2]). However, none of these changes were large enough to lead to significant between-group differences.
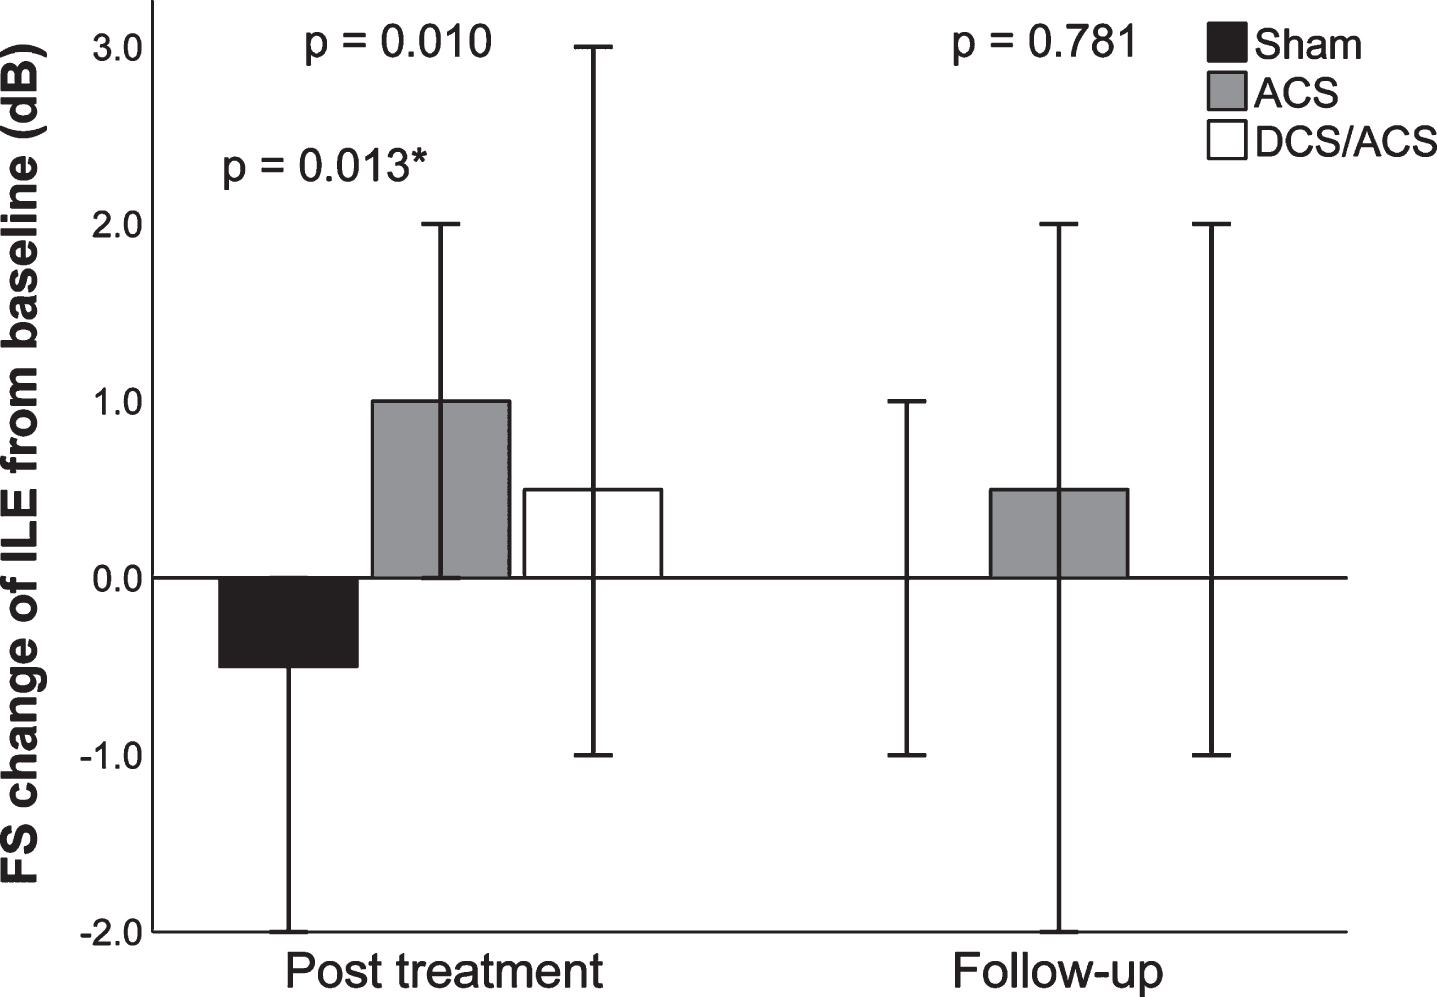
Consistent with the MS results at post treatment, the intact field of the contralesional eye increased 1.5 pp (IQR 0.4–5.7) in the sham group and decreased –2.3 pp (IQR –5.7– –0.4) in the rtACS group, resulting in a significant between-group difference favoring sham (H(2) = 8.63, p = 0.013; post hoc Z = 2.77, adj p = 0.017, estimated median difference –6.1 pp [95% CI, –9.1– –1.5]). In contrast, the between-group comparison of foveal sensitivity of the ipsilesional eye showed opposite results: it decreased –0.5 dB (IQR –1.0–0.0) in the sham group and increased 1.0 dB (IQR 0.0–2.0) in the rtACS group, which yielded a significant between-group difference at post treatment (H(2) = 9.19, p = 0.010; post hoc Z = –2.86, adj. p = 0.013, estimated median difference 2.0 dB [95% CI, 1.0–2.0]) (Fig. 3).
Fig. 2
Results of primary outcomes in Experiments 1, 2, and 3. Median changes from baseline, 95% -CIs, and between-group p values, calculated with Mann-Whitney U test or Kruskal-Wallis analysis of variance test in case of more than two groups, are given. ACS, alternating current stimulation; DCS/ACS, combined direct current stimulation/alternating current stimulation; DCS, direct current stimulation; DA, detection accuracy; MS, mean sensitivity; ILE, ipsilesional eye; CLE, contralesional eye. *Sham vs. ACS, calculated from post hoc pairwise comparison.
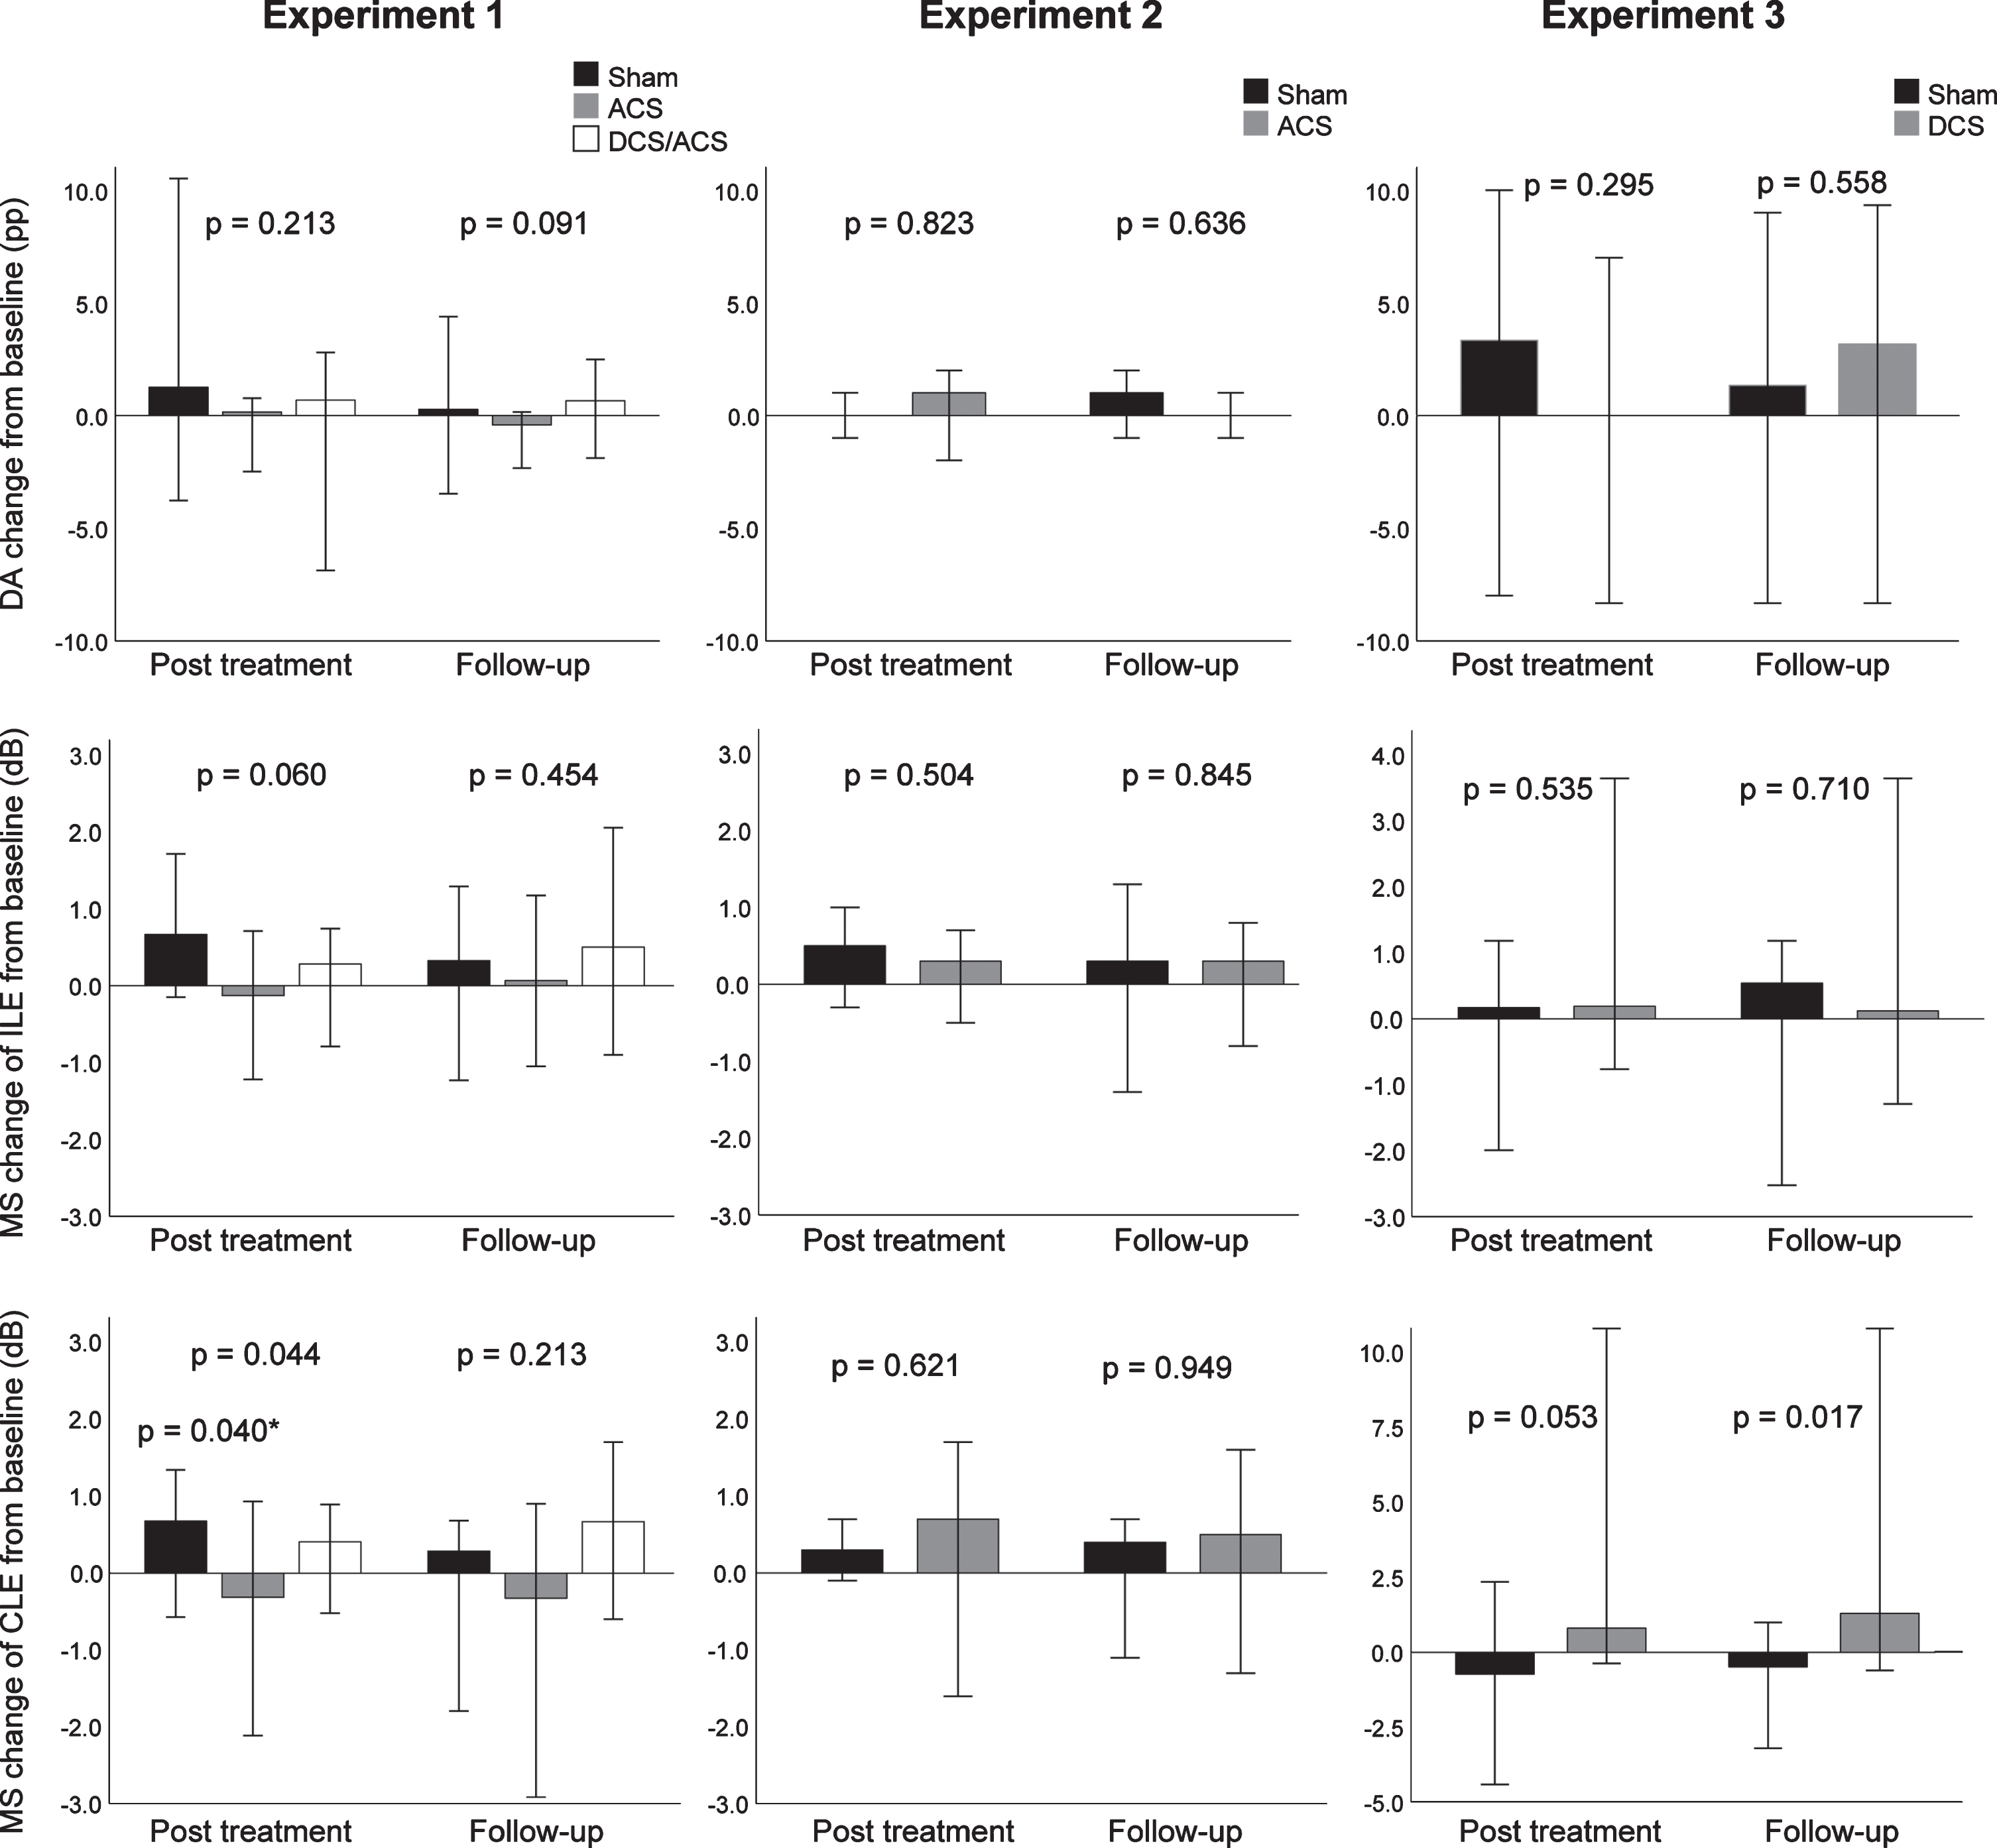
Fig. 3
Changes of foveal sensitivity of the ipsilesional eye from baseline in Experiment 1. Median changes from baseline, 95% -CIs, and between-group p values, calculated with Kruskal-Wallis analysis of variance test are given. ACS, alternating current stimulation; DCS/ACS, combined direct current stimulation/alternating current stimulation; FS, foveal sensitivity ILE, ipsilesional eye. *ACS vs. Sham, calculated from post hoc pairwise comparison.
3.2.2Experiment 2: rtACS vs. sham
3.2.2.1 Primary outcomes: There was no difference in the median DA change after the treatment between the groups (rtACS 1.0 pp [IQR –1.0–1.5], sham 0.0 pp [–0.5–1.0], U = 37.5, p = 0.823), nor in the MS of the ipsilesional (rtACS 0.3 dB [IQR –0.4–0.7], sham 0.5 dB [IQR –0.2–0.9], U = 31.5, p = 0.504) or contralesional eye (rtACS 0.7 dB [IQR –0.9–1.4], sham 0.3 dB [IQR 0.0–0.7], U = 35.0, p = 0.621). The results remained neutral at the 2-month follow-up (Table 3).
Table 3
Results of Experiment 2: Sham vs. ACS
| BASELINE – POST TREATMENT CHANGE | BASELINE – FOLLOW-UP CHANGE | Within-group p | ||||||||
| Median (IQR) | Between-group | Median (IQR) | Between-group | |||||||
| Sham (n = 9) | ACS (n = 9) | Estimated median difference (95% CI) | p | Sham (n = 9) | ACS (n = 9) | Estimated median difference (95% CI) | p | Sham | ACS | |
| HRP | ||||||||||
| DA (pp) | 0.0 (– 0.5– 1.0) | 1.0 (– 1.0– 1.5) | 0.0 (– 1.0– 1.0) | 0.823 | 1.0 (– 1.0– 2.0) | 0.0 (– 0.5– 1.0) | 0.0 (– 2.0– 1.0) | 0.636 | 0.497 | 0.453 |
| RT (ms) | – 33 (– 39– – 15) | – 11 (– 29– 3) | 16 (– 5– 35) | 0.142 | – 20 (– 50– 7) | – 12 (– 36– 28) | 13 (– 23– 49) | 0.423 | 0.097 | 0.368 |
| Abs. defect (pp) | – 0.3 (– 0.9– 1.0) | – 0.5 (– 3.0– 0.6) | – 0.7 (– 3.0– 0.9) | 0.503 | – 0.7 (– 1.7– 0.9) | – 0.5 (– 1.3– 0.3) | 0.0 (– 1.6– 1.6) | 0.914 | 0.347 | 0.490 |
| Rel. defect (pp) | 0.0 (– 3.0– 0.7) | – 0.7 (– 1.5– 1.7) | 0.2 (– 1.6– 2.5) | 0.914 | 0.2 (– 3.3– 1.5) | – 0.5 (– 0.7– 0.8) | 0.0 (– 2.0– 3.2) | 0.879 | 0.625 | 0.773 |
| Intact field (pp) | 0.2 (0.1– 1.5) | 1.4 (0.8– 1.9) | 0.9 (– 0.5– 1.6) | 0.197 | 1.4 (0.0– 2.1) | 0.7 (– 1.3– 1.4) | – 0.7 (– 3.0– 0.7) | 0.267 | 0.065 | 0.092 |
| FA (pp) | 0.0 (– 1.0– 3.5) | – 1.0 (– 1.0– 0.5) | 0.0 (– 4.0– 1.0) | 0.507 | 1.0 (– 0.5– 3.5) | 0.0 (– 3.5– 1.5) | – 1.0 (– 8.0– 1.0) | 0.193 | 0.284 | 0.422 |
| False positives (pp) | 0.0 (– 1.0– 0.0) | 0.0 (– 0.5– 0.5) | 0.0 (0.0– 1.0) | 0.440 | 0.0 (0.0– 0.0) | 0.0 (– 1.0– 0.0) | 0.0 (– 1.0– 0.0) | 0.361 | 0.305 | 0.368 |
| SAP | ||||||||||
| MS, ILE (dB) | 0.5 (– 0.2– 0.9) | 0.3 (– 0.4– 0.7) | – 0.3 (– 1.1– 0.4) | 0.504 | 0.3 (– 0.6– 1.2) | 0.3 (– 0.5– 0.8) | – 0.1 (– 1.0– 0.9) | 0.845 | 0.175 | 0.641 |
| MS, CLE (dB) | 0.3 (0.0– 0.7) | 0.7 (– 0.9– 1.4) | 0.3 (– 1.3– 1.1) | 0.621 | 0.4 (– 0.7– 0.7) | 0.5 (– 1.2– 1.0) | 0.0 (– 1.5– 1.4) | 0.949 | 0.368 | 0.641 |
| FS, ILE (dB) | – 1.0 (– 1.5– 6.0) | – 1.0 (– 3.0– 3.0) | – 1.0 (– 7.0– 2.0) | 0.471 | 0.0 (– 1.5– 5.0) | 0.0 (– 3.5– 1.0) | – 1.0 (– 6.0– 2.0) | 0.501 | 0.889 | 0.809 |
| FS, CLE (dB) | – 1.0 (– 2.0– 1.5) | 0.0 (– 2.0– 3.0) | 0.0 (– 4.0– 4.0) | 0.876 | 0.0 (– 1.0– 3.5) | – 1.0 (– 5.0– 1.0) | – 2.0 (– 7.0– 1.0) | 0.167 | 0.331 | 0.430 |
| VA (decimal) | 0.0 (– 0.2– 0.0) | 0.0 (0.0– 0.2) | 11.1 (0.0– 25.0) | 0.052 | 0.0 (– 0.1– 0.1) | 0.0 (0.0– 0.3) | 0.0 (– 5.6– 28.6) | 0.320 | 0.179 | 0.161 |
| RS (w/min) | 2.8 (– 9.0– 6.8) | 4.5 (– 3.8– 9.1) | 4.6 (– 6.0– 13.4) | 0.489 | 2.2 (– 7.0– 11.6) | 4.6 (0.5– 14.8) | 2.5 (– 7.5– 14.4) | 0.328 | 0.641 | 0.097 |
Estimated median differences between groups and 95% -confidence intervals (CI) were calculated with the Hodges-Lehmann method, negative values favoring sham and positive ACS. P values were calculated with Mann-Whitney U test (between groups) and Friedman two-way analysis of variance test with post hoc pairwise comparison with Wilcoxon signed-rank test (within groups). ACS, alternating current stimulation; HRP, high-resolution perimetry; DA, detection accuracy; RT, response time; FA, fixation accuracy; SAP, static automated perimetry; MS, mean sensitivity; FS, foveal sensitivity; ILE, ipsilesional eye; CLE, contralesional eye; VA, visual acuity; RS, reading speed.
3.2.2.2 Secondary outcomes: No significant changes in any of the secondary outcomes were detected (Table 3).
3.2.3Experiment 3: tDCS vs. sham
3.2.3.1 Primary outcomes: MS of the contralesional eye increased 0.8 dB (IQR –0.2–2.1) in the tDCS group and decreased –0.7 dB (IQR –1.0–0.5) in the sham group between baseline and post treatment, resulting in a trend in between-group difference (U = 40.0, p = 0.053, estimated median difference 1.5 dB [95% CI, 0.02–5.2]) (Fig. 2, Table 4). After the 2-month follow-up, MS of the tDCS group had increased 1.3 dB (IQR 0.5–3.3) and that of the sham group decreased –0.5 dB (IQR –1.7–0.3) from baseline (U = 43.0, p = 0.017, estimated median difference 2.2 dB [95% CI, 0.6–5.0]). However, the within-group changes were non-significant. No significant between-group changes were seen after the treatment in MS of the ipsilesional eye (tDCS 0.2 dB [IQR –0.2–1.0], sham 0.2 dB [IQR –1.0–0.2], U = 30.0, p = 0.535) or in DA (tDCS 0.0 pp [IQR –7.3–4.0], sham 3.3 pp [IQR –0.7–4.7], U = 13.0, p = 0.295).
Table 4
Results of Experiment 3: Sham vs. DCS
| BASELINE –POST TREATMENT CHANGE | BASELINE –FOLLOW-UP CHANGE | Within-group p | ||||||||
| Median (IQR) | Between-group | Median (IQR) | Between-group | |||||||
| Sham (n = 7) | DCS (n = 7) | Estimated median difference (95% CI) | p | Sham (n = 7)a | ACS (n = 7)a | Estimated median difference (95% CI) | p | Sham | DCS | |
| HRP | ||||||||||
| DA (pp) | 3.3 (–0.7–4.7) | 0.0 (–7.3–4.0)b | –2.7 (–11.0–3.7) | 0.295 | 1.3 (–8.0–4.0) | 3.1 (–1.1–8.6)b | 3.3 (–4.0–11.7) | 0.558 | 0.459 | 0.070 |
| RT (ms) | –17 (–39–16) | –11 (–22–1)b | 7 (–34–49) | 0.731 | –59 (–129– –54) | –34 (–62– –1)b | 46 (–25–106) | 0.181 | 0.066 | 0.084 |
| FA (pp) | 4.0 (–0.3–16.7) | 0.0 (–7.3–9.1)b | –5.3 (–24.7–45.2) | 0.445 | 2.7 (–2.7–30.0) | 2.3 (–3.0–12.2)b | –0.5 (–27.7–25.0) | 0.731 | 0.383 | 0.607 |
| False positives (pp) | –0.3 (–1.0–0.0) | 0.2 (–0.8–0.7)b | 0.7 (–1.3–1.7) | 0.346 | –1.0 (–1.3–0.3) | –0.7 (–1.6–0.7)b | 0.3 (–2.3–1.7) | 0.749 | 0.236 | 0.385 |
| SAP | ||||||||||
| MS, ILE (dB) | 0.2 (–1.0–0.2) | 0.2 (–0.2–1.0) | 0.5 (–0.5–2.2) | 0.535 | 0.5 (–1.1–0.9) | 0.1 (–0.7–2.0) | 0.9 (–1.3–2.8) | 0.710 | 0.368 | 0.459 |
| MS, CLE (dB) | –0.7 (–1.0–0.5) | 0.8 (–0.2–2.1) | 1.5 (0.02–5.2) | 0.053 | –0.5 (–1.7–0.3) | 1.3 (0.5–3.3) | 2.2 (0.6–5.0) | 0.017 | 0.317 | 0.163 |
| FS, ILE (dB) | 1.0 (0.0–3.0) | –1.0 (–2.0–3.0) | –2.0 (–4.0–2.0) | 0.318 | 1.5 (–0.3–3.3) | –0.5 (–2.3–0.5) | –2.0 (–4.0–0.0) | 0.107 | 0.097 | 0.887 |
| FS, CLE (dB) | 1.0 (–1.0–2.0) | 0.0 (–2.0–1.0) | –1.0 (–3.0–1.0) | 0.438 | 0.0 (–2.0–3.3) | 0.0 (–0.5–2.3) | 0.0 (–3.0–3.0) | 1.000 | 0.747 | 0.662 |
| VA (decimal) | 0.0 (0.0–0.0) | 0.0 (0.0–0.0) | 0.0 (0.0–0.0) | 1.000 | 0.0 (0.0–0.0) | 0.0 (0.0–0.0) | 0.0 (0.0–0.0) | 1.000 | 0.368 | 0.717 |
| RS (w/min) | 3.5 (–2.0–15.5) | 3.0 (–2.5–8.5) | –1.5 (–15.0–6.5) | 0.710 | 0.5 (–10.0–28.5) | 5.5 (–6.0–7.0) | –0.5 (–23.5–15.5) | 1.000 | 0.459 | 0.513 |
| CS (logMAR) | 0.0 (0.0–0.0) | 0.0 (–0.2–0.0) | 0.0 (–0.2–0.0) | 0.514 | 0.0 (0.0–0.0) | 0.0 (–0.2–0.0) | 0.0 (–0.2–0.0) | 0.486 | 0.717 | 0.368 |
Estimated median differences between groups and 95% -confidence intervals (CI) were calculated with the Hodges-Lehmann method, negative values favoring sham and positive DCS. P values were calculated with and Mann-Whitney U test (between groups) and Friedman two-way analysis of variance test with post hoc pairwise comparison with Wilcoxon signed-rank test (within groups). Significant p values are bolded. DCS, direct current stimulation; HRP, high-resolution perimetry; DA, detection accuracy; RT, response time; FA, fixation accuracy; SAP, static automated perimetry; MS, mean sensitivity; FS, foveal sensitivity; ILE, ipsilesional eye; CLE, contralesional eye; VA, visual acuity; RS, reading speed; CS, contrast sensitivity. aResults of one subject with missing outcome data at follow-up was replaced with their post-treatment results, bn = 6.
3.2.3.2 Secondary outcomes: All secondary outcome variables were neutral in both treatment arms (Table 4).
3.3Safety
No serious adverse events occurred. In Experiment 1, the most common adverse effect was mild skin irritation under stimulation electrodes during the treatment (rtACS: n = 3, tDCS/rtACS: n = 1, sham: n = 3). In addition, the rtACS group experienced metallic taste (n = 2) and mild discomfort during stimulation (n = 1); the tDCS/rtACS group reported metallic taste during the stimulation (n = 1), and paroxysmal phosphene-like visual phenomena (n = 1) and tiredness between sessions (n = 1); and the sham group had metallic taste (n = 1) and other skin sensations (n = 1) during the stimulation. No difference in the frequency of any of the reported adverse effects, nor in their composite number per subject occurred between the different modalities (rtACS: median 1 per subject [IQR 0–2.5], tDCS/rtACS: median 0 per subject [IQR 0–1.5], sham: median 0.5 [IQR 0–1.8], p = 0.431).
In Experiment 2, the subjects reported mild skin irritation under the stimulation electrodes during the treatment (rtACS: n = 8, sham: n = 7), metallic taste (rtACS: n = 2, sham: n = 3), other skin sensations (rtACS: n = 3, sham: n = 4), chills (rtACS: n = 3, sham: n = 1), myokymia (rtACS: n = 1, sham: n = 1), dizziness (rtACS: n = 1), and transient discomfort during the intervention (rtACS: n = 1), as well as tiredness (rtACS: n = 2, sham: n = 4), paroxysmal phosphene-like visual phenomena (rtACS: n = 3, sham: n = 3), mild headache (rtACS: n = 3, sham: n = 1), sleeping difficulties (sham: n = 1), and lack of concentration (sham: n = 1) between the sessions. Consistent with Experiment 1, no difference was observed in the number of individual adverse effect, nor in their composite number per subject (rtACS: median 3.0 per subject [IQR 2.0–5.5], sham: median 4.0 per subject [IQR 1.5–5.0], p = 0.194). In Experiment 3, all subjects reported mild skin sensations.
4Discussion
To the best of our knowledge, this is the first randomized, sham-controlled trial exploring different NIBS modalities for the rehabilitation of hemianopia after occipital stroke, including a tDCS/rtACS regimen. The study did not demonstrate efficacy of the NIBS methods on the primary endpoints in two experiments (1 and 2). However, the tDCS-alone modality (Experiment 3) led to some improvement in monocular vision compared to sham. Additionally, the combined tDCS/rtACS reduced the absolute field defect, increased dynamic vision, and improved reading from baseline, but did not differ significantly from the sham group. rtACS was mostly ineffective and, regarding some outcomes, even inferior to sham. The stimulation was well tolerated with the number of adverse events comparable to previous reports (Antal et al., 2017), providing further evidence for the safe application of NIBS.
The effects of NIBS, especially rtACS, were smaller than expected and not comparable to changes reported after optic nerve damage (Gall et al., 2016). Possible causes for the low efficacy are several. First, compared to people with optic nerve injury, hemianopic patients tend to have smaller areas of residual vision (relative defects with partial vision), i.e. areas, where they see some of the presented stimuli, but not all (Sabel et al., 2011). As the areas of residual vision are thought to possess the greatest recovery potential (Sabel et al., 2011), our results may reflect their small size at baseline. Another explanation may lie in the central origin of the damage. If the reorganizing brain is a basis for vision recovery, damage to the brain might leave a smaller recovery potential. This is supported by the overall low efficacy of restorative attempts in stroke-related VFD (Pollock et al., 2019). Moreover, the few previous successful rehabilitation studies have combined NIBS with visual training (Alber et al., 2017; Plow et al., 2011; Plow et al., 2012), which may be prerequisite for vision restoration in post-chiasmal visual impairment. Likewise, the stimulation might be effective only if applied in the acute or subacute phase, when the plasticity after stroke is at its greatest (Murphy & Corbett, 2009).
Most importantly, the current flow after rtACS may not be optimal for vision rehabilitation after central damage. It travels mostly through the frontal cortex and the eye, moving along the optic nerve, towards the brainstem (Gall et al., 2016). It has been hypothesized to elicit synchronous activation of retinal ganglion cells when the retinae and optic nerves are stimulated (Foik et al., 2015; Gall et al., 2016); however, little, if any, current reaches the visual cortex. This might explain why rtACS treatment alone is beneficial for patients with optic nerve damage (Gall et al., 2016) but not for those with occipital lesions. Our results are supported by a recent study that showed that occipital, but not transorbital, ACS modulated occipital oscillations and affected visual detection ability (Herring et al., 2019). Thus, the former might be worth further studying in vision rehabilitation after occipital stroke.
Interestingly, the sham group demonstrated small improvements in some of the monocular visual variables compared to the rtACS treatment. This implies that minimal stimulation used as sham might actually have beneficial effects on the visual system. Therefore, it is a continuing challenge in the future trials to create a sham protocol devoid of the minimal stimulation effect, yet maintain the blinding.
Although the overall NIBS effects were not favorable, our exploration yielded some positive signals after tDCS alone. We found a statistically significant 2.2-dB difference in MS of the contralesional eye compared to the sham group at follow-up and a trend towards improvement at post treatment. Although the clinical improvement was modest, it was in line with the few pilot studies on combined tDCS and visual training that have reported vision restoration in hemianopia (Alber et al., 2017; Plow et al., 2011; Plow et al., 2012). Moreover, the variability in response to the stimulation was notable, as indicated by wide CIs (Fig. 2), suggesting that some patients may benefit from tDCS, whereas others do not. Unfortunately, the small sample size of the experiment did not allow us to study factors influencing the treatment response.
Another modality producing a few cautiously positive findings was the combined tDCS/rtACS. Different stimulation protocols can interact when applied successively under certain timing conditions, producing either enhanced or opposing effects (Huang et al., 1992; Lang et al., 2004). In the present study, cathodal tDCS may have induced a priming effect on rtACS, leading to a different impact than rtACS alone. Alternatively, tDCS might have neutralized or counteracted ACS, because the latter exerts weaker effects on neural activity (Antal et al., 2008). Considering the results of tDCS and rtACS alone and the lack of direct comparison of the combined protocol with the former, we cannot conclude, whether tDCS/rtACS inflicts any additional benefit over tDCS alone.
The effects of tDCS and tDCS/rtACS were detected mainly in the contralesional eye, which cannot be easily explained by the gross anatomy of the primary visual pathway. In normal vision, the lateral hemifield supports more peripheral and less central vision, which have different anatomical inputs: the latter is driven predominantly by the retino-geniculate pathway, whereas the former also depends on the extrastriate pathway, which supports movement perception and controls eye movements. It is proposed to be the main mechanism of “blindsight” (Poppel et al., 1973; Weiskrantz et al., 1974), where patients with lesioned primary visual cortex can perform detection tasks without being aware of the stimuli. Of note, training “blindsight” is one way to improve vision in patients with hemianopia (Raninen et al., 2007; Sahraie et al., 2006). Thus, vision restoration therapy after stroke might be of greater benefit to the extrastriate pathway than to the region of primary damage, explaining the improvement in the contralesional eye and increased dynamic vision. If true, the response variability to NIBS might depend in part on the extent of extrastriate damage. Nevertheless, our results should be viewed with caution, because the groups were small and no systematic changes in both within- and between-group results were observed.
4.1Strengths and limitations
The strength of our study was its randomized, sham-controlled, double-blinded design and the exploration of several different NIBS modalities in rehabilitation of post-chiasmal vision damage. We used comprehensive examinations of visual function and several methods to control for fixation. Only little patient dropout was experienced, and all subjects were treated according to their allocation.
However, our study possessed several limitations. Given its exploratory character and the small sample size, our results cannot be generalized. The target sample size defined in the protocol was not reached due to technical and funding issues; yet, our study is still among the largest using NIBS in vision rehabilitation. Although the variations of the experimental protocol, randomization, and examination methods at the centers enabled experimenting with different setups, they did not allow a direct comparison between the modalities used in different experiments. Finally, the number of examinations—although acceptable in an exploratory setup—raises the question of multiple comparisons and must be addressed in the future confirmatory studies.
5Conclusions
Despite the mostly neutral results, some positive findings of the tDCS and tDCS/rtACS modalities and the good safety profile of NIBS encourage further research. This, however, requires increased knowledge of the underlying mechanisms to establish the optimal treatment paradigm. rtACS, however, does not seem to provide much efficacy in rehabilitation of vision after stroke. There are open questions, which include optimizing the current flow with respect to the underlying EEG rhythms, stimulating both the striate and extrastriate retinofugal pathway, and finding a sham condition without the minimal stimulation effect. If these goals are achieved, we believe that a larger-sample trial with a tDCS-based method, possible in combination with visual training, is justified.
Declaration of conflicting interests
BS is a shareholder of SAVIR-Center, a vision rehabilitation outpatient clinic, where NIBS methods are used. Other authors have no disclosures.
Funding
The authors disclosed receipt of the following financial support for the research, authorship, and/or publication of this article: This study and the REVIS consortium were funded through ERA-NET Neuron 2011 funding call for The Helsinki part by Academy of Finland (grant number 263200) and for the Magdeburg part by German Federal Education and Research Ministry (grant number BMBF 01EW1210). The study was also supported by Government subsidiary grants (VTR); and grants from Biomedicum Helsinki Foundation; the Finnish Medical Foundation; and Päivikki and Sakari Sohlberg Foundation to SR; and the Maire Tapola Foundation to KS and SR.
Acknowledgments
We thank Wioletta J. Waleszczyk, PhD for participating in designing the study and Heli Silvennoinen, MD, PhD for analyzing the MRI scans in Helsinki.
References
1 | Alber, R. , Moser, H. , Gall, C. , & Sabel, B. A. ((2017) ). Combined transcranial direct current stimulation and Vision Restoration training in subacute stroke rehabilitation: A Pilot study. PM & R, 9: (8), 787–794. |
2 | Ali, M. , Hazelton, C. , Lyden, P. , Pollock, A. , & Brady, M. ((2013) ). Recovery from poststroke visual impairment: Evidence from a clinical trials resource. Neurorehabilitation and Neural Repair, 27: (2), 133–141. |
3 | Antal, A. , Alekseichuk, I. , Bikson, M. , Brockmöller, J. , Brunoni, A. R. , Chen, R. ,... Paulus, W. ((2017) ). Low intensity transcranial electric stimulation: Safety, ethical, legal regulatory and application guidelines. Clinical Neurophysiology, 128: (9), 1774–1809. |
4 | Antal, A. , Boros, K. , Poreisz, C. , Chaieb, L. , Terney, D. , & Paulus, W. ((2008) ). Comparatively weak after-effects of transcranial alternating current stimulation (tACS) on cortical excitability in humans. Brain Stimulation, 1: (2), 97–105. |
5 | Bola, M. , Gall, C. , Moewes, C. , Fedorov, A. , Hinrichs, H. , & Sabel, B. A. ((2014) ). Brain functional connectivity network breakdown and restoration in blindness. Neurology, 83: (6), 542–551. |
6 | Dougherty, B. E. , Flom, R. E. , & Bullimore, M. A. ((2005) ). An evaluation of the MARS letter contrast sensitivity test. Optometry and Vision Science, 82: (11), 970–975. |
7 | Foik, A. T. , Kublik, E. , Sergeeva, E. G. , Tatlisumak, T. , Rossini, P. M. , Sabel, B. A. , & Waleszczyk, W. J. ((2015) ). Retinal origin of electrically evoked potentials in response to transcorneal alternating current stimulation in the rat. Investigative Ophthalmology & Visual Science, 56: (3), 1711–1718. |
8 | Gall, C. , Franke, G. H. , & Sabel, B. A. ((2010) ). Vision-related quality of life in first stroke patients with homonymous visual field defects. Health & Quality of Life Outcomes, 8: , 33. |
9 | Gall, C. , Schmidt, S. , Schittkowski, M. P. , Antal, A. , Ambrus, G. G. , Paulus, W. ,... Sabel, B. A. ((2016) ). Alternating current stimulation for vision restoration after optic nerve damage: A randomized clinical trial. PloS One, 11: (6), e0156134. |
10 | Gall, C. , Silvennoinen, K. , Granata, G. , de Rossi, F. , Vecchio, F. , Brosel, D. ,... Sabel, B. A. ((2015) ). Non-invasive electric current stimulation for restoration of vision after unilateral occipital stroke. Contemporary Clinical Trials, 43: , 231–236. |
11 | Gray, C. S. , French, J. M. , Bates, D. , Cartlidge, N. E. , Venables, G. S. , & James, O. F. ((1989) ). Recovery of visual fields in acute stroke: Homonymous hemianopia associated with adverse prognosis. Age & Ageing, 18: (6), 419–421. |
12 | Halko, M. A. , Datta, A. , Plow, E. B. , Scaturro, J. , Bikson, M. , & Merabet, L. B. ((2011) ). Neuroplastic changes following rehabilitative training correlate with regional electrical field induced with tDCS. Neuroimage, 57: (3), 885–891. |
13 | Herring, J. D. , Esterer, S. , Marshall, T. R. , Jensen, O. , & Bergmann, T. O. ((2019) ). Low-frequency alternating current stimulation rhythmically suppresses gamma-band oscillations and impairs perceptual performance. Neuroimage, 184: , 440–449. |
14 | Huang, Y. Y. , Colino, A. , Selig, D. K. , & Malenka, R. C. ((1992) ). The influence of prior synaptic activity on the induction of long-term potentiation. Science, 255: (5045), 730–733. |
15 | Kanai, R. , Chaieb, L. , Antal, A. , Walsh, V. , & Paulus, W. ((2008) ). Frequency-dependent electrical stimulation of the visual cortex. Current Biology, 18: (23), 1839–1843. |
16 | Kasten, E. , Wust, S. , Behrens-Baumann, W. , & Sabel, B. A. ((1998) ). Computer-based training for the treatment of partial blindness. Nature Medicine, 4: (9), 1083–1087. |
17 | Lang, N. , Siebner, H. R. , Ernst, D. , Nitsche, M. A. , Paulus, W. , Lemon, R. N. , & Rothwell, J. C. ((2004) ). Preconditioning with transcranial direct current stimulation sensitizes the motor cortex to rapid-rate transcranial magnetic stimulation and controls the direction of after-effects. Biological Psychiatry, 56: (9), 634–639. |
18 | Larcombe, S. J. , Kulyomina, Y. , Antonova, N. , Ajina, S. , Stagg, C. J. , Clatworthy, P. L. , & Bridge, H. ((2018) ). Visual training in hemianopia alters neural activity in the absence of behavioural improvement: A pilot study. Ophthalmic & Physiological Optics, 38: (5), 538–549. |
19 | Matteo, B. M. , Viganò, B. , Cerri, C. G. , Meroni, R. , Cornaggia, C. M. , & Perin, C. ((2017) ). Transcranial direct current stimulation (tDCS) combined with blindsight rehabilitation for the treatment of homonymous hemianopia: A report of two-cases. Journal of Physical Therapy Science, 29: (9), 1700–1705. |
20 | Murphy, T. H. , & Corbett, D. ((2009) ). Plasticity during stroke recovery: From synapse to behaviour. Nature Reviews Neuroscience, 10: (12), 861–872. |
21 | Nitsche, M. A. , Cohen, L. G. , Wassermann, E. M. , Priori, A. , Lang, N. , Antal, A. ,... Pascual-Leone, A. ((2008) ). Transcranial direct current stimulation: State of the art. Brain Stimulation, 1: (3), 206–223. |
22 | Ozen, S. , Sirota, A. , Belluscio, M. A. , Anastassiou, C. A. , Stark, E. , Koch, C. , & Buzsáki, G. ((2010) ). Transcranial electric stimulation entrains cortical neuronal populations in rats. The Journal of Neuroscience, 30: (34), 11476–11485. |
23 | Plow, E. B. , Obretenova, S. N. , Fregni, F. , Pascual-Leone, A. , & Merabet, L. B. ((2012) ). Comparison of visual field training for hemianopia with active versus sham transcranial direct cortical stimulation. Neurorehabilitation and Neural Repair, 26: (6), 616–626. |
24 | Plow, E. B. , Obretenova, S. N. , Halko, M. A. , Kenkel, S. , Jackson, M. L. , Pascual-Leone, A. , & Merabet, L. B. ((2011) ). Combining visual rehabilitative training and noninvasive brain stimulation to enhance visual function in patients with hemianopia: A comparative case study. PM & R, 3: (9), 825–835. |
25 | Pollock, A. , Hazelton, C. , Rowe, F. J. , Jonuscheit, S. , Kernohan, A. , Angilley, J. ,... Campbell, P. ((2019) ). Interventions for visual field defects in people with stroke. Cochrane Database of Systematic Reviews, (5). |
26 | Poppel, E. , Held, R. , & Frost, D. ((1973) ). Leter: Residual visual function after brain wounds involving the central visual pathways in man. Nature, 243: (5405), 295–296. |
27 | Raninen, A. , Vanni, S. , Hyvarinen, L. , & Nasanen, R. ((2007) ). Temporal sensitivity in a hemianopic visual field can be improved by long-term training using flicker stimulation. Journal of Neurology, Neurosurgery & Psychiatry, 78: (1), 66–73. |
28 | Rossini, P. M. , Calautti, C. , Pauri, F. , & Baron, J. ((2003) ). Post-stroke plastic reorganisation in the adult brain. Lancet Neurology, 2: (8), 493–502. |
29 | Rowe, F. J. , Hepworth, L. R. , Howard, C. , Hanna, K. L. , Cheyne, C. P. , & Currie, J. ((2019) ). High incidence and prevalence of visual problems after acute stroke: An epidemiology study with implications for service delivery. PloS One, 14: (3), e0213035. |
30 | Sabel, B. A. , Henrich-Noack, P. , Fedorov, A. , & Gall, C. ((2011) ). Vision restoration after brain and retina damage: The “residual vision activation theory”. Progress in Brain Research, 192: , 199–262. |
31 | Sabel, B. A. , Thut, G. , Haueisen, J. , Henrich-Noack, P. , Herrmann, C. S. , Hunold, A. ,... Antal, A. ((2020) ). Vision modulation, plasticity and restoration using non-invasive brain stimulation - an IFCN-sponsored review. Clinical Neurophysiology, 131: (4), 887–911. |
32 | Sahraie, A. , Trevethan, C. T. , MacLeod, M. J. , Murray, A. D. , Olson, J. A. , & Weiskrantz, L. ((2006) ). Increased sensitivity after repeated stimulation of residual spatial channels in blindsight. Proceedings of the National Academy of Sciences of the United States of America, 103: (40), 14971–14976. |
33 | Strbian, D. , Ahmed, N. , Wahlgren, N. , Kaste, M. , Tatlisumak, T. , SITS Investigators. ((2012) ). Intravenous thrombolysis in ischemic stroke patients with isolated homonymous hemianopia: Analysis of Safe Implementation of Thrombolysis in Stroke-International Stroke Thrombolysis Register (SITS-ISTR. Stroke, 43: (10), 2695–2698. |
34 | Tiel, K. , & Kolmel, H. W. ((1991) ). Patterns of recovery from homonymous hemianopia subsequent to infarction in the distribution of the posterior cerebral-artery. Neuro-Ophthalmology, 11: (1), 33–39. |
35 | Trauzettel-Klosinski, S. , & Dietz, K. ((2012) ). Standardized assessment of reading performance: The new international reading speed texts IReST. Investigative Ophthalmology & Visual Science, 53: (9), 5452–5461. |
36 | Weiskrantz, L. , Warrington, E. K. , Sanders, M. D. , & Marshall, J. ((1974) ). Visual capacity in the hemianopic field following a restricted occipital ablation. Brain, 97: (4), 709–728. |
37 | Wist, E. R. , Ehrenstein, W. H. , Schrauf, M. , & Schraus, M. ((1998) ). A computer-assisted test for the electrophysiological and psychophysical measurement of dynamic visual function based on motion contrast. Journal of Neuroscience Methods, 80: (1), 41–47. |
38 | Zaehle, T. , Rach, S. , & Herrmann, C. S. ((2010) ). Transcranial alternating current stimulation enhances individual alpha activity in human EEG. PloS One, 5: (11), e13766. |
39 | Zhang, X. , Kedar, S. , Lynn, M. J. , Newman, N. J. , & Biousse, V. ((2006) ). Natural history of homonymous hemianopia. Neurology, 66: (6), 901–905. |


