
Comparison of hemodynamic changes after repetitive transcranial magnetic stimulation over the anatomical hand knob and hand motor hotspot: A functional near-infrared spectroscopy study
Abstract
Background:
Low-frequency rTMS can induce upregulation of excitability in the contralateral hemisphere by interhemispheric interaction.
Objective:
The aim of this study was to compare the effects of interhemispheric modulation on hemodynamic changes after applying low-frequency rTMS over the anatomical hand knob (HK) and the hand motor hotspot (hMHS) in the dominant motor cortex.
Methods:
Ten healthy right-handed participants without a history of neurological or psychiatric symptoms (five males; 29.8±2.8 years) participated in this single-blind, randomized, cross-over study. rTMS was applied under three conditions over the dominant (left) hemisphere for 20 minutes: 1) 1 Hz rTMS stimulation on the HK (HK-rTMS), 2) 1 Hz rTMS stimulation on the hMHS (hMHS-rTMS), and 3) sham stimulation (Sham-rTMS). For all participants, functional near-infrared spectroscopy (fNIRS) was applied for measurement of cerebral oxyhemoglobin (oxyHb) and deoxyhemoglobin (deoxyHb) concentration over the non-dominant (right) hemisphere during a serial reaction time task (SRTT) with the non-dominant (left) hand before and after each condition.
Results:
The average coordinates of the hMHS (x = – 39.60 mm, y = – 17.11 mm, z = 66.40 mm) were anterior and lateral to the HK (x = – 36.72 mm, y = – 28.87 mm, z = 56.41 mm). In fNIRS time-series analysis, the integral value of oxyHb was
significantly increased over the motor cortical region of the non-dominant hemisphere after the hMHS-rTMS compared with Sham-rTMS. The HK-rTMS also showed slight increment of oxyHb concentration but without statistical significance. The SPM group analysis showed greater magnitude of the activity in hMHS-rTMS than that of HK-rTMS after stimulation (p < 0.05).
Conclusions:
These results demonstrated an interhemispheric modulation effect of hemodynamic changes by 1 Hz rTMS. The hMHS produced a more robust modulation effect of 1 Hz rTMS on the contralateral hemisphere than did the HK. Therefore, the rTMS can be considered a better stimulation target than the HK.
1Introduction
Repetitive transcranial magnetic stimulation (rTMS) is an effective, non-invasive method for mod-ulating specific cortical activity and has been attracting attention among neuroscientists and clinicians (Oliveira-Maia, Press, & Pascual-Leone, 2017). The magnetic field can be generated by inducing a short discharge of electric current in an rTMS coil. The magnetic field under the coil induces nerve cell membrane depolarization in cortical tissue and affects the activity of the related nerve loop (Klomjai, Katz, & Lackmy-Vallée, 2015). The exact mechanism for the long-lasting effect of rTMS is not clear, but rTMS could alter synaptic efficacy related to long-term potentiation (LTP) and long-term depression (LTD) (Klomjai et al., 2015; Zhengwu et al., 2018). This technique has been demonstrated to have potential therapeutic effects in several psychiatric and neurological illnesses, such as stroke and depression (Wassermann & Lisanby, 2001). The increase or de-crease in cortical excitability caused by rTMS dep-ends on the intensity, frequency, and duration of stimulation (Caparelli et al., 2012; Maeda, Keenan, Tormos, Topka, & Pascual-Leone, 2000; Oliveira-Maia et al., 2017). Low-frequency rTMS (≤1 Hz) usually is considered to cause downregulation of excitability in healthy people and stroke patients and to suppress the excitability of the cortex (Song et al., 2009). Low-frequency rTMS also could induce upregulation of excitability in the contralateral hemisphere by interhemispheric interaction. Some studies have reported these interhemispheric effects of low-frequency rTMS on contralateral cortical excitability assessed by motor evoked potential (MEP) amplitude and resting motor threshold (rMT) (Caparelli et al., 2012; Song et al., 2009). Neuroimaging studies such as functional magnetic resonance imaging (fMRI) and positron emission tomography (PET) investigated changes in brain activity after low-frequency rTMS and reported increased cortical activation at the contralateral motor cortical region by interhemispheric modulation effect (Conchou et al., 2009; Nowak et al., 2008; Salatino et al., 2014).
The conventional method to identify rTMS target site is the international 10– 20 electroencephalography system, which measures the distance from certain external landmarks (Langguth et al., 2006). This approach does not consider individual differences in brain anatomy and morphology of the cortex, making it difficult to find an optimal location. In other studies, the target site was designated as the hand motor hotspot (hMHS), where single-pulse transcranial magnetic stimulation (TMS) is able to produce motor evoked potentials (MEPs) of maximal amplitude in the contralateral hand muscle (Rossini et al., 1994). Recently, the frameless stereotaxic navigation system has allowed visualization of the anatomical structure of the cerebral cortex, enabling direct stimulation over the anatomical hand knob (HK) (Iwański et al., 2020; Sahlsten et al., 2019). As described above, different methods have been proposed for determining target sites to modulate the activity of the motor cortex. Of those, the hMHS and HK are receiving increasing interest as the methods consider individual brain characteristics. However, studies reported that the hMHS is not always consistent with the HK in healthy participants (Ahdab, Ayache, Brugières, Farhat, & Lefaucheur, 2016; Sparing, Buelte, Meister, Pauš, & Fink, 2008). Especially in stroke patients, whose cortical motor representation can be reorganized and shifted from the original M1 area (Lee, Lee, Kim, & Kim, 2015), it is not always clear which area is optimum to obtain the maximal effects of rTMS. There has been no study directly comparing the physiologic effects of rTMS on cortical excitability over the HK and hMHS.
Functional neuroimaging studies such as fMRI and PET are valuable tools for visualizing cerebral cortical activities associated with behavioral tasks (Yoo et al., 2008). However, repeated use is not always feasible because of reasons such as cost-effectiveness, movement artifact, or radiation hazards. Functional near-infrared spectroscopy (fNIRS) is a unique non-invasive functional neuroimaging tool that offers several potential advantages including a relatively small and portable structure and high degrees of safety and non-invasiveness (Plichta et al., 2006). Therefore, cortical excitability changes induced by rTMS can be measured by oxyhemoglobin (oxyHb) concentration changes using fNIRS. There have been reports of the effects of cortical excitability after low-frequency rTMS using fNIRS (Chiang et al., 2007; Curtin et al., 2019; Hada, Abo, Kaminaga, & Mikami, 2006; Mesquita et al., 2013). All these studies showed increased oxyHb concentration over the contralateral motor cortex after low-frequency rTMS; however, the stimulation target sites were variable. Two studies (Chiang et al., 2007; Mesquita et al., 2013) used the HK as the rTMS target site, and one study (Hada et al., 2006) used hMHS. No comparison between these two target sites was suggested. Because the method for determining the rTMS target site is variable, investigation of the different neuromodulation effects may help to determine an effective target site between the HK and the hMHS.
The aim of this study was to compare the effects of interhemispheric modulation by low-frequency rTMS in terms of hemodynamic changes of the contralateral cortical region when rTMS was applied over the HK or the hMHS. We monitored changes of oxyHb concentration of the motor cortical regions using fNIRS during a serial reaction time task (SRTT) before and after low-frequency rTMS. We hypothesized that the positions of HK and hMHS would be different in healthy subjects, and rTMS application to HK and hMHS demonstrate a difference in change in oxyHb concentration during a motor task in the contralateral motor cortical region before and after stimulation.
2Methods
2.1Participants
Ten healthy subjects (five males; mean age: 29.8±2.8 years) participated in this study. All participants were right-handed (Edinburgh Handedness Inventory score, mean±SD, 92.0±15.7, range, 65– 100) and had no neurophysiological disorder. The experimental procedures used in this study were approved by the Institutional Review Board of Samsung Medical Center (2014-05-021), and all participants gave informed consent.
2.2Experimental protocol
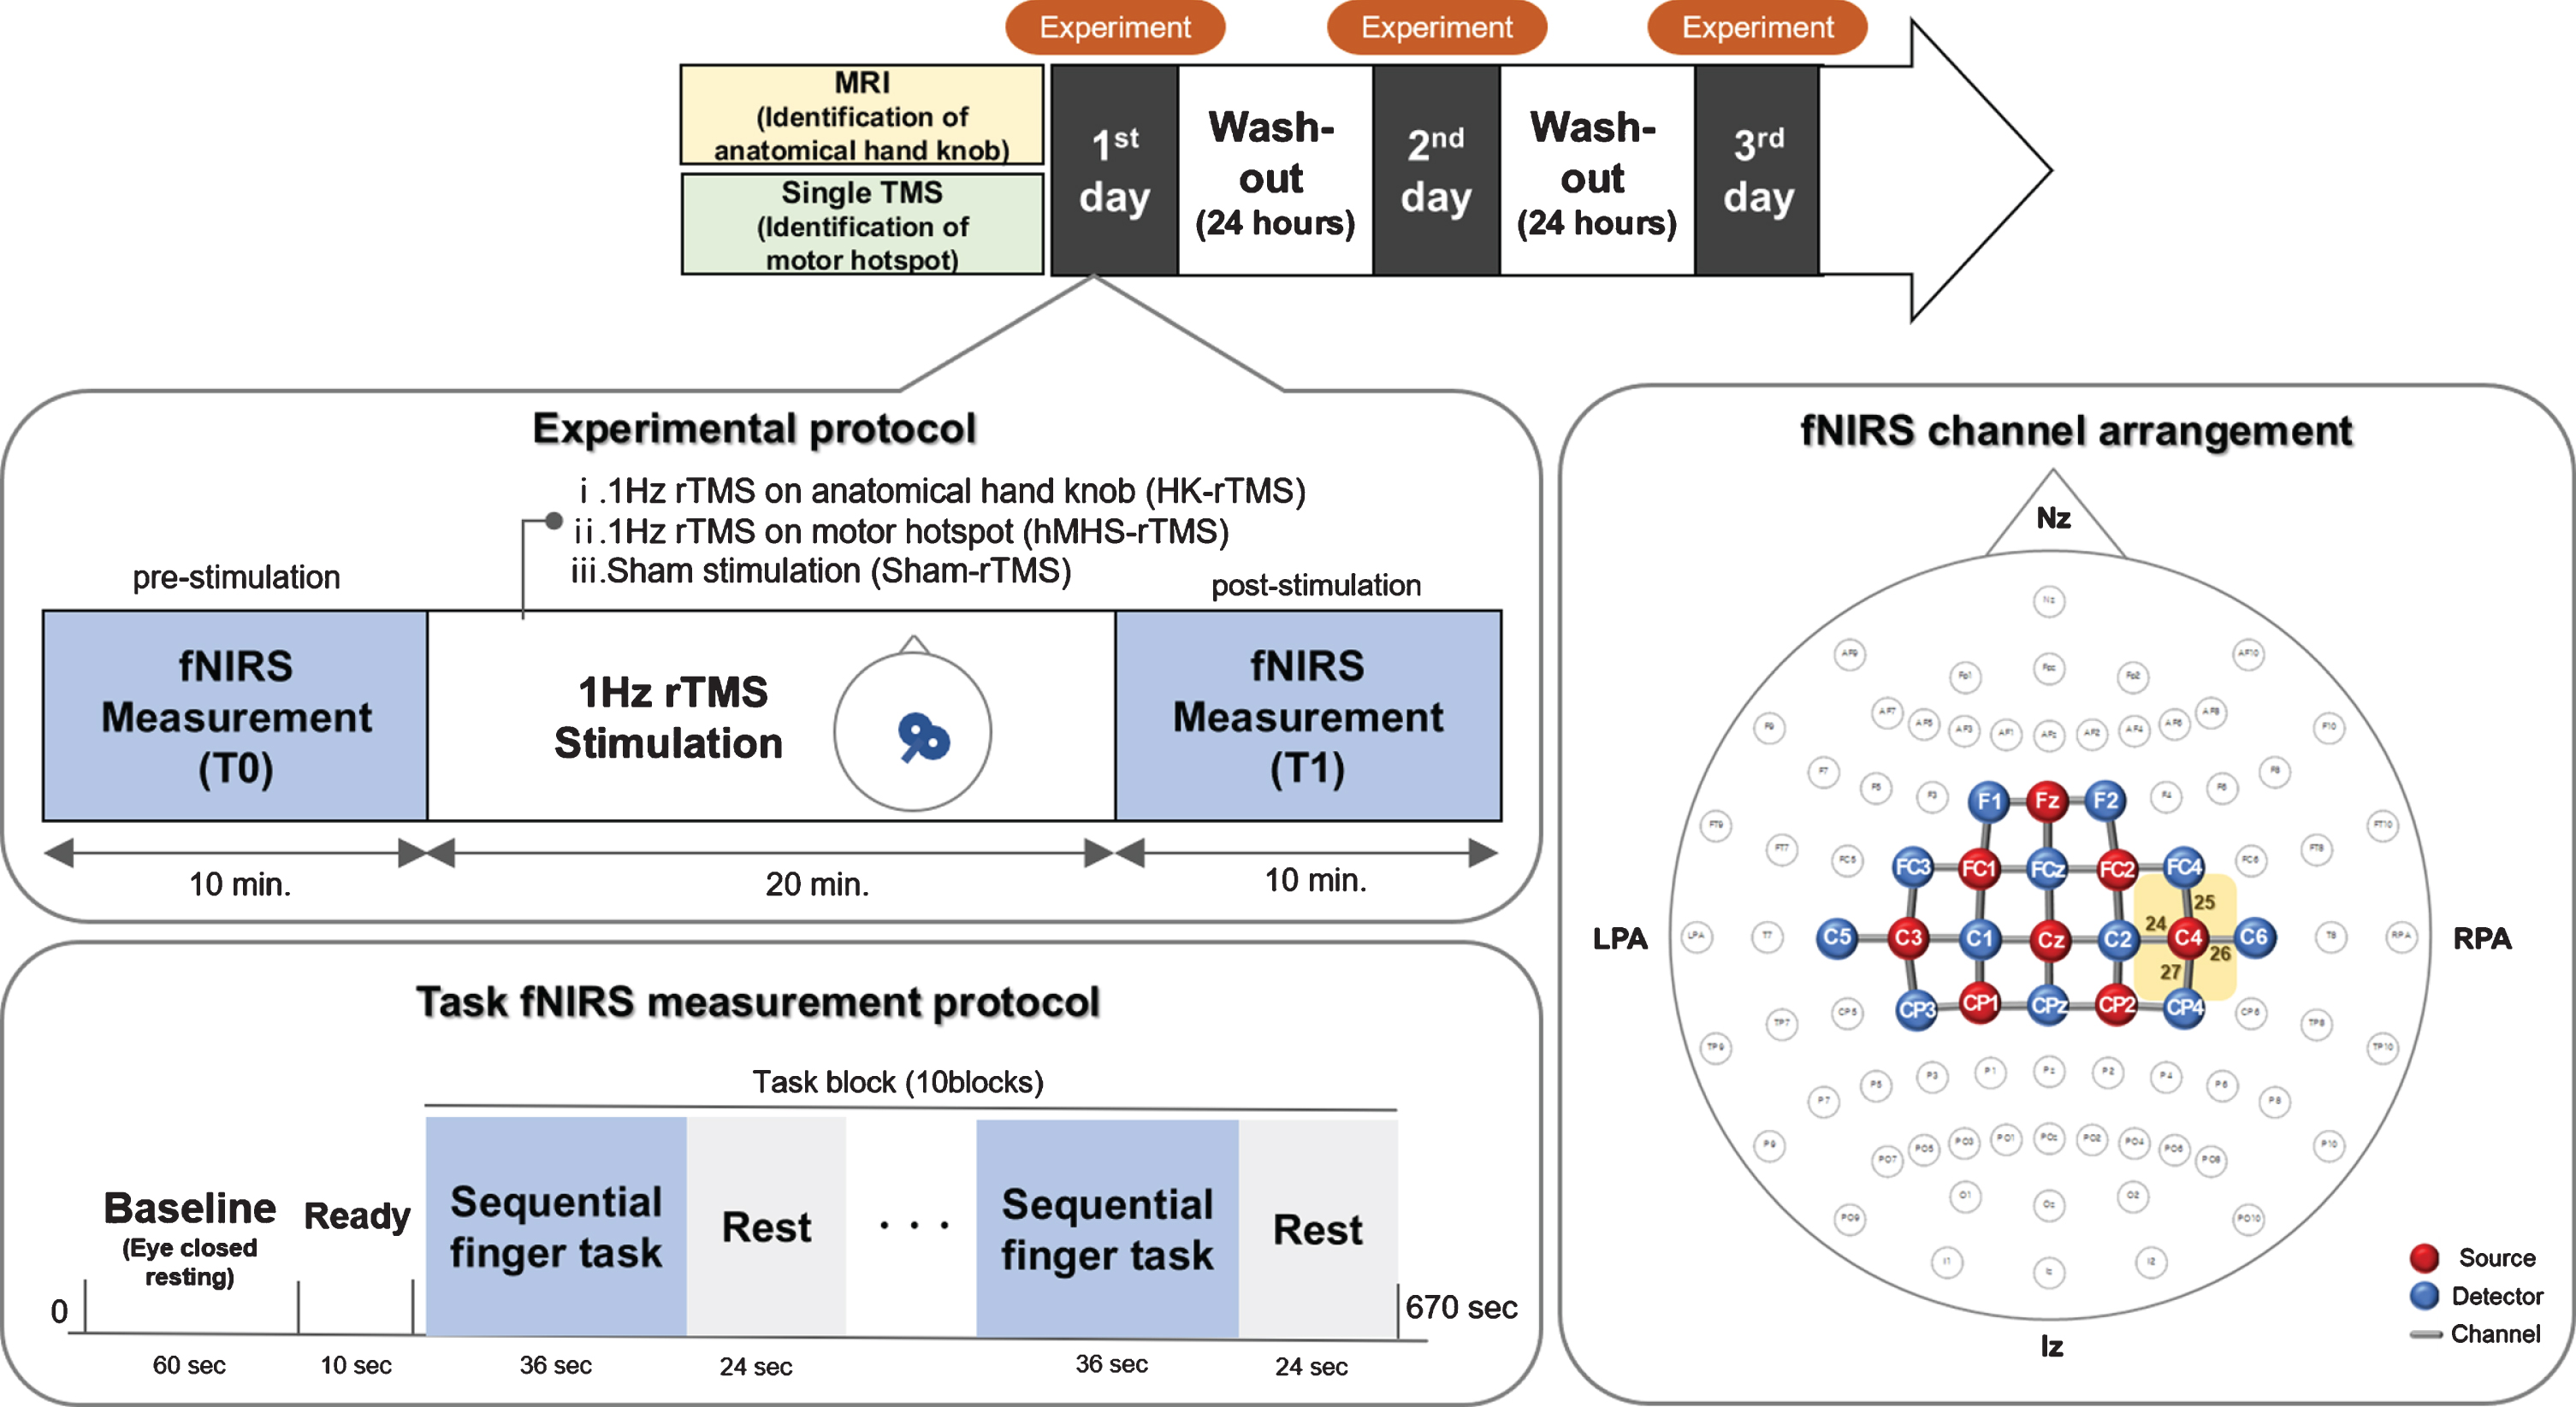
We performed a randomized, single-blind, sham-controlled, crossover study to compare the hemodynamic changes after 1 Hz rTMS over the HK and the hMHS. All participants were stimulated with 1 Hz rTMS under three conditions randomly applied, with a 24-hour washout period between each session, 1) 1,200 pulses of 1 Hz rTMS for 20 minutes on the HK of the dominant hemisphere (HK-rTMS), 2) 1,200 pulses of 1 Hz rTMS for 20 minutes on the hMHS of the dominant hemisphere (hMHS-rTMS), and 3) sham stimulation (Sham-rTMS) with the same frequency and duration as the other conditions (Fig. 1). The randomization scheme was generated using the website www.randomization.com. Those who underwent rTMS stimulation were separate from those who underwent fNIRS. Therefore, the fNIRS evaluators were able to remain blinded. To try to keep the subjects blinded as much as possible, they were not informed about how and where the scalp would be stimulated.
Fig. 1
Experimental protocol and arrangement of the functional near-infrared spectroscopy (fNIRS) measurement channel. In the fNIRS channel arrangement, eight sources and 16 detectors covered the cortical areas of the bilateral motor cortex using 31 channels of interest. fNIRS, functional near-infrared spectroscopy; MRI, magnetic resonance imaging; TMS, transcranial magnetic stimulation; rTMS, repetitive transcranial magnetic stimulation; HK, anatomical hand knob; hMHS, hand motor hotspot; LPA, left pre-auricular points; RPA, right pre-auricular points; Nz, nasion; Iz, inion
2.3Identification of the locations of the anatomical hand knob and hand motor hotspot
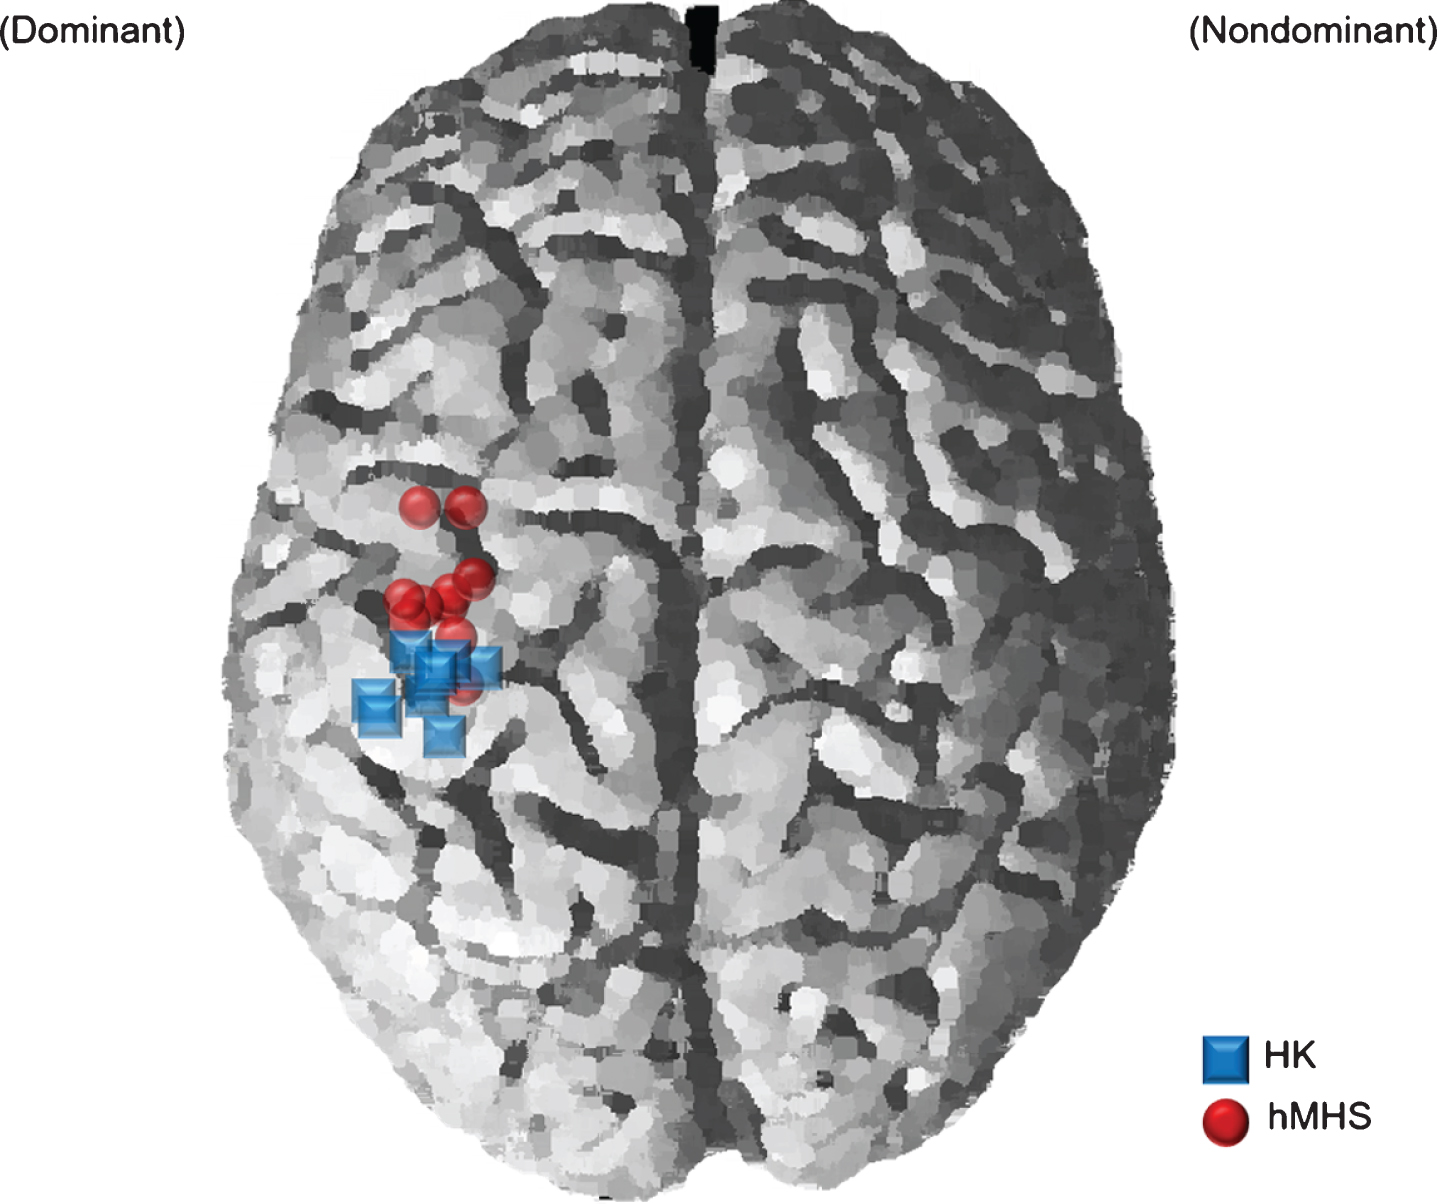
Before stimulation, all participants underwent magnetic resonance imaging scans and single-pulse TMS to identify the locations of the HK and the hMHS. High-resolution anatomical brain images were obtained from each participant in a 3T magnetic resonance scanner (Achieva 3.0TTM; Philips Medical Systems, Best, Netherlands). The location of the HK on the high-resolution anatomical image was identified by skilled medical staff. The HK was identified in the middle of the central gyrus with a pattern of reverse omega or horizontal epsilon using the methods of a previous study (Yousry et al., 1997).
To determine the optimal hMHS for rTMS, single-pulse TMS (Magstim® BiStim2; Magstim Co. Ltd, Dyfed, Wales, UK) was performed for each subject before the rTMS session as described previously (Chang et al., 2010). The handle of a 70 mm figure-8 coil was directed in a 45° angle posterior to the midline, so that the electromagnetic current flowed perpendicular to the central sulcus. Electromyography (EMG) data were collected from the contralateral first dorsal interosseus muscle using the EMG monitoring system (Medelec Synergy®; Medelec, Oxford, UK). The optimal position of hMHS was where it exhibited the highest MEP amplitude and the shortest latency when moving 1 cm in each direction at 5 second intervals starting 5 cm from the vertex (Cz) point. The rMT was defined as the lowest magnetic intensity required to evoke the EMG activity (MEP peak-to-peak amplitude ≥50μV) in 5 or more of 10 consecutive trials at the location of the determined motor hotspot.
The locations of HK and hMHS were imported into a TMS navigation system (BrainsightTM; Rogue Research, Montreal, Canada) to allow for stereotaxic registration of the participant’s brain with the TMS coil for online control of coil positioning over the same location. For comparing the three-dimensional locations of HK and hMHS, each individual’s coordinates were transformed to the standard space, and Montreal Neurological Institute (MNI) coordinates were obtained.
2.4Application of repetitive transcranial magnetic stimulation
For the rTMS, 1,200 pulses of 1 Hz rTMS were delivered at 100% of rMT over the dominant hemisphere using an rTMS stimulator (Magstim® Rapid2; Magstim Co. Ltd, Dyfed, Wales, UK). The magnetic figure-8 coil was positioned over the HK or the hMHS in the dominant hemisphere and was oriented tangentially to the scalp at a 45° angle from the midline. The coil position was maintained at the same position as during stimulation using the coil holder and the navigation system. All participants were instructed to remain comfortable and as static as possible without moving their hands during rTMS. The sham stimulation was performed by diverting the coil 90° so that stimulation was not delivered to the cortex of the HK with the same frequency and duration as other conditions (Lisanby, Gutman, Luber, Schroeder, & Sackeim, 2001). All stimulation parameters were in accordance with published safety standards (Rossi, Hallett, Rossini, Pascual-Leone, & Group, 2009).
2.5Measurement of functional near-infrared spectroscopy
We performed fNIRS measurements of each participant during an SRTT with the non-dominant hand before (T0) and after (T1) stimulation. We used a continuous wave fNIRS measurement system (NIRScout®; NIRx Medical Technology, Berlin, Germany), which is a multi-modal compatible fNIRS platform, for confirming the changes of hemoglobin concentrations in the motor cortex. This system consists of 8 sources and 16 detectors that cover the bilateral motor cortical regions using 31 channels of interest (Fig. 1). The fNIRS system used two wavelengths, 760 nm and 850 nm, with the sampling rate set to 7.81 Hz. The fNIRS optodes were positioned according to the international 10/20 system, and the channel distance (i.e., the distance between source and detector) was 3.0 cm. During fNIRS measurement, all participants performed SRTT with the non-dominant hand. The task was arranged in a block paradigm of 10 task blocks (36 s in duration) and 10 rest blocks (24 s in duration) (Fig. 1). The participants were asked to tap with their non-dominant hand a 9-digit sequence using SuperLabPro® 2.0 software (Cedrus Co., Phoenix, AZ, USA) with a customized keyboard. In a scene, one asterisk representing from 1 to 5 fingers appeared at one of five positions arranged as a horizontal line in front of the participant as a visual cue. When the asterisk appeared in a certain position (thumb = 1, index finger = 2, middle finger = 3, ring finger = 4, little finger = 5), the participants should press the key as quickly and accurately as possible. A scene showing one digit for 600 ms appeared and a black screen for 400 ms when the scene disappeared.
2.6Data processing and analysis of functional near-infrared spectroscopy
The changes in oxyHb and deoxyhemoglobin (deoxyHb) concentration were recorded and analyzed using the nirsLAB® software (v.2016.05; NIRx Medical Technologies, LLC, Minneapolis, MN, USA) for time-series analysis. Discontinuities and spike artifacts of signals obtained from the 31 channels were removed and replaced with the nearest signals. The raw data were first band-pass filtered from 0.01 Hz to 0.2 Hz to remove baseline noise and to eliminate possible respiration and heart rate signals (Robbins, Elwell, Jimenez, & Goss-Sampson, 2012). Both oxyHb and deoxyHb concentrations were calculated from preprocessed filtered data using a modified Beer-Lambert law for each of the 31 channels (Strangman, Culver, Thompson, & Boas, 2002). For each channel, the grand average of each hemodynamic response was computed. For comparison between the conditions, the mean and integral values of the concentration changes for oxyHb and deoxyHb were obtained from channels of the regions of interest (ROIs) in the non-dominant primary hand motor area. The coordinates and target ROIs were chosen using the fNIRS Optodes Location Decider (fOLD) toolbox in MATLAB® (Morais, Balardin, & Sato, 2018). The Mann-Whitney U test was used for determination of significant differences in hemodynamic responses between HK-rTMS, hMHS-rTMS, and Sham-rTMS.
The cortical activation mapping of fNIRS data was performed using the open-source software package NIRS-SPM implemented in MATLAB® environment (MathWorks, Inc., Natick, MA, USA). In statistical parametric mapping (SPM) analysis, the general linear model (GLM) with a canonical hemodynamic response curve was performed to model the hypothesized oxyHb response and to test for significant cortical activation during the experiment (Tak & Ye, 2014; Tak et al., 2011). At the group level, statistical analysis was performed based on the individual-level beta-values to find activated channels (p < 0.01, corrected) (Benjamini & Hochberg, 1995). Furthermore, t-statistic maps computed for group analysis were plotted onto a conventional brain template, and the regions with significant differences in oxyHb concentrations were identified.
3Results
3.1Location of applied low-frequency repetitive transcranial magnetic stimulation
Figure 2 represents the locations of the HK and hMHS in the MNI brains of all participants involved in the experiment. The location of the HK was x = – 36.72±6.58 mm, y = – 28.87±4.02 mm, z =56.41±4.66 mm. The locations of the hMHS (average coordinates±standard deviation, x =– 39.60±3.42 mm, y = – 17.11±9.40 mm, z = 66.40±8.54 mm) were anterior and lateral to the HK. The Euclidean distance between the HK and hMHS was 18.34±8.22 mm (Fig. 2). The mean values of rMT were 47.8±8.7 %, 48.1±9.0 %, and 46.9±7.9 % in HK-rTMS, hMHS-rTMS and sham-rTMS, respectively, and there was no statistical difference in rMT among the three conditions (Kruskal-Wallis test, p > 0.05).
Fig. 2
Comparison of repetitive transcranial magnetic stimulation (rTMS) target Montreal Neurological Institute (MNI) locations between the motor hotspot and the hand-knob. The blue squares represent the individual MNI locations of the hand knobs (HK), and the red circles represent the individual MNI locations of hand motor hotspots (hMHS). rTMS, repetitive transcranial magnetic stimulation; MNI, Montreal Neurological Institute; HK, anatomical hand knob; hMHS, hand motor hotspot
3.2Results of oxyhemoglobin concentration changes in time-series analysis
The average group changes in oxyHb and deoxyHb concentrations in the non-dominant hemisphere during the SRTT with the non-dominant hand are represented in channels 24, 25, 26, and 27 (Fig. 3). Among these channels, concentration changes were noticeable in channel 24 (between C2 and C4), related to the hand motor cortical region. The changes in the mean and integral values of oxyHb and deoxyHb in each individual for channel 24 in the three conditions are described in Table. The difference in integral value of oxyHb was significantly higher in the hMHS-rTMS than in the Sham-rTMS (p = 0.048). The mean value of oxyHb tended to increase in the hMHS-rTMS compared with the Sham-rTMS but did not show statistical significance. The mean and integral values of the deoxyHb were slightly decreased but did not show statistical significance.
Fig. 3
Time-series plot of changes in oxyHb and deoxyHb concentrations in the non-dominant motor cortical region during the non-dominant hand motor task. The red dotted line represents the oxyHb concentration at the point before stimulation (oxyHb T0), and the red solid line represents the oxyHb concentration at the point after stimulation (oxyHb T1). The blue dotted line represents the deoxyHb concentration at the point before stimulation (deoxyHb T0), and the blue solid line represents the deoxyHb concentration at the point after stimulation (deoxyHb T1). The colored background represents the standard deviation. In channel 24, oxyHb concentration was remarkably increased during the motor task compared to T0 in the HK-rTMS and hMHS-rTMS. There was no change in the Sham-rTMS. oxyHb, oxyhemoglobin; deoxyHb; deoxyhemoglobin; M1, primary motor cortex; T0, before rTMS stimulation; T1, after rTMS stimulation; HK, anatomical hand knob; hMHS, hand motor hotspot
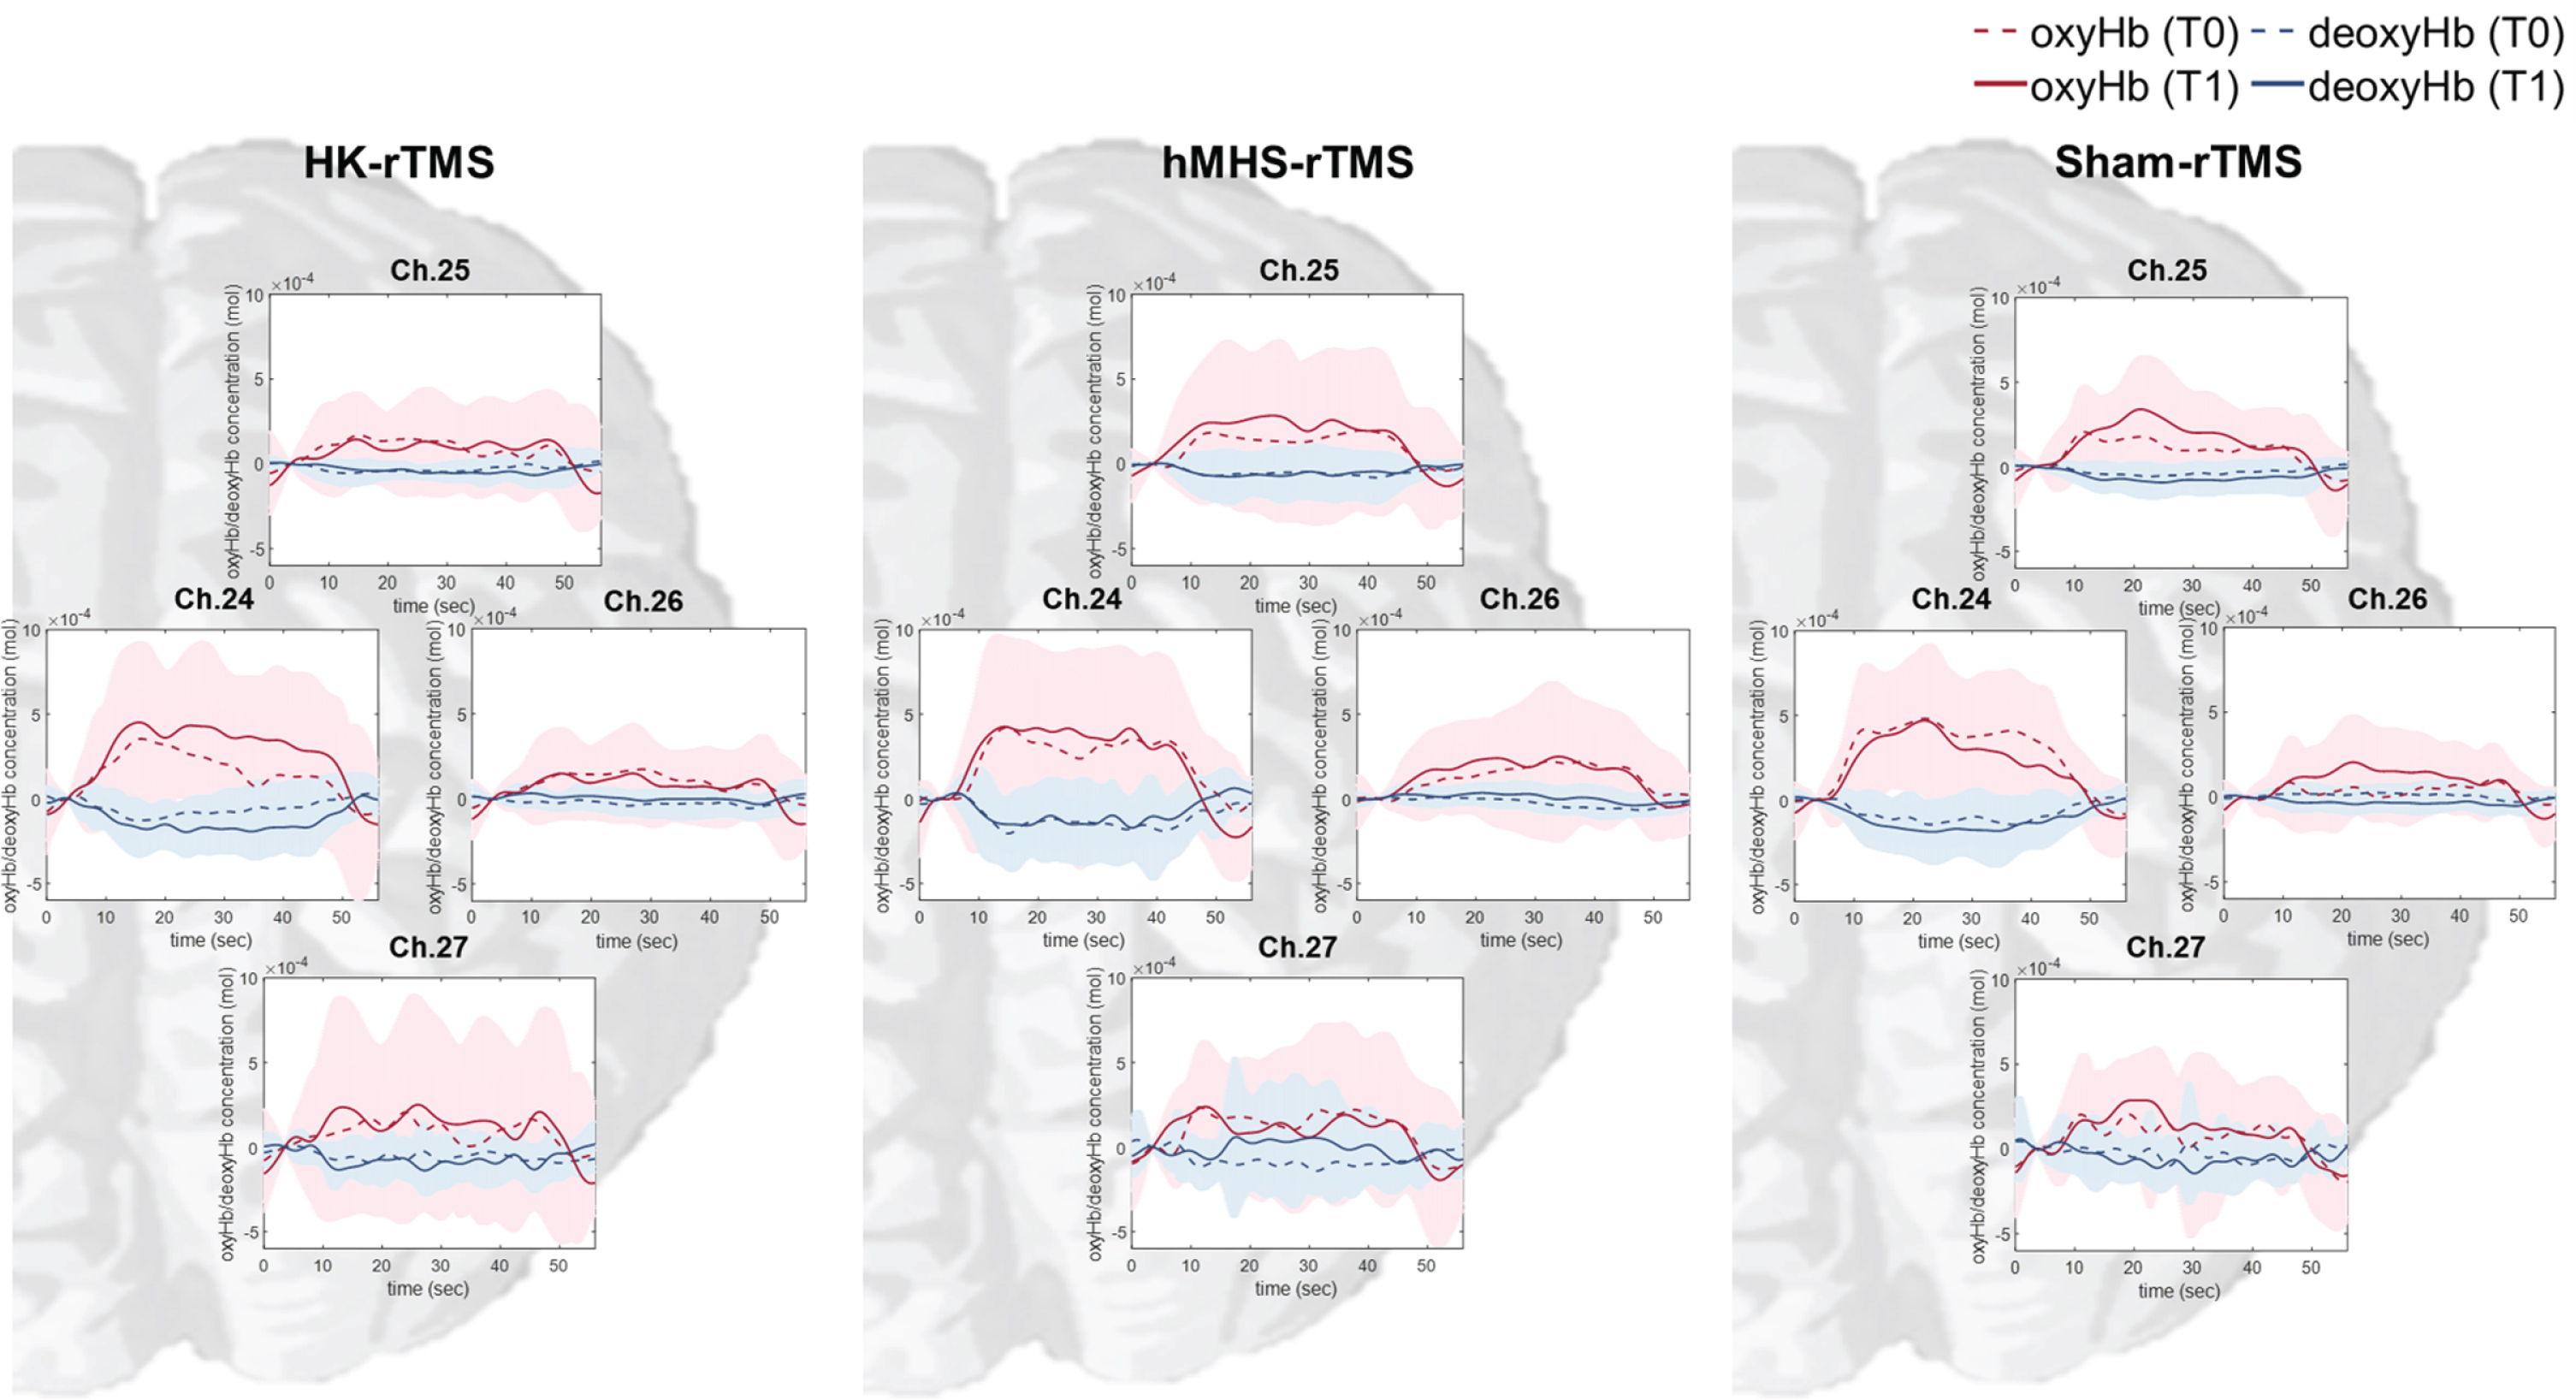
Table 1
Differences in mean and integral values of oxyHb and deoxyHb concentrations in the primary motor cortical area (channel 24) of the non-dominant hemisphere during a motor task in three conditions
| Subject No. | Differences in mean value | Differences in integral value | |||||
| (units: mol×10–3) | (units: mol·s) | ||||||
| HK-rTMS | hMHS-rTMS | Sham-rTMS | HK-rTMS | hMHS-rTMS | Sham-rTMS | ||
| OxyHb | |||||||
| 1 | 0.9184 | 0.3914 | 0.0023 | 0.2574 | 0.1098 | 0.0011 | |
| 2 | – 0.2255 | 0.1040 | 0.1686 | – 0.0632 | 0.0292 | 0.0473 | |
| 3 | 0.0348 | 0.0162 | 0.0805 | 0.0099 | 0.0045 | 0.0226 | |
| 4 | – 0.0560 | – 0.1273 | – 0.1107 | – 0.0158 | – 0.0357 | – 0.0311 | |
| 5 | 0.7358 | 0.4310 | – 0.1218 | 0.2061 | 0.1209 | – 0.0341 | |
| 6 | – 0.0794 | 0.3102 | – 0.1527 | – 0.0222 | 0.0870 | – 0.0428 | |
| 7 | 0.2852 | – 0.2166 | 0.1920 | 0.0801 | – 0.0607 | 0.0539 | |
| 8 | – 0.0421 | 0.3200 | – 0.5554 | – 0.0115 | 0.0899 | – 0.1558 | |
| 9 | – 0.3934 | 0.0203 | – 0.1161 | – 0.1105 | 0.0057 | – 0.0325 | |
| 10 | 0.0139 | 0.1175 | 0.0121 | 0.0039 | 0.0331 | 0.0034 | |
| Median | – 0.014 | 0.111 | – 0.054 | – 0.004 | 0.031* | – 0.015 | |
| (IQR) | (0.296) | (0.300) | (0.184) | (0.083) | (0.084) | (0.051) | |
| DeoxyHb | |||||||
| 1 | 0.0049 | 0.0029 | – 0.1398 | 0.0015 | 0.0009 | – 0.0392 | |
| 2 | – 0.0039 | 0.0004 | 0.0468 | – 0.0011 | 0.0001 | 0.0131 | |
| 3 | 0.0579 | – 0.0406 | – 0.0597 | 0.0162 | – 0.0114 | – 0.0168 | |
| 4 | – 0.0123 | 0.0316 | 0.0312 | – 0.0034 | 0.0089 | 0.0088 | |
| 5 | – 0.3955 | 0.1965 | – 0.0562 | – 0.1107 | 0.0551 | – 0.0157 | |
| 6 | 0.0322 | – 0.0917 | 0.0012 | 0.0090 | – 0.0257 | 0.0003 | |
| 7 | – 0.1069 | – 0.0917 | – 0.2848 | – 0.0300 | – 0.0257 | – 0.0799 | |
| 8 | – 0.2137 | 0.1337 | – 0.0067 | – 0.0600 | 0.0374 | – 0.0019 | |
| 9 | 0.0034 | 0.0051 | – 0.0352 | 0.0010 | 0.0014 | – 0.0099 | |
| 10 | – 0.0431 | – 0.1398 | – 0.0461 | – 0.0121 | – 0.0392 | – 0.0129 | |
| Median (IQR) | – 0.008 (0.095) | 0.002 (0.104) | – 0.041 (0.058) | 0.005 (0.009) | – 0.001 (0.027) | – 0.003 (0.009) | |
HK, anatomical hand knob; hMHS, hand motor hotspot; rTMS, repetitive transcranial magnetic stimulation; OxyHb, oxyhemoglobin; DeoxyHb, deoxyhemoglobin; IQR, inter-quartile range; *, significant difference between hMSH and Sham-rTMS conditions (p < 0.05).
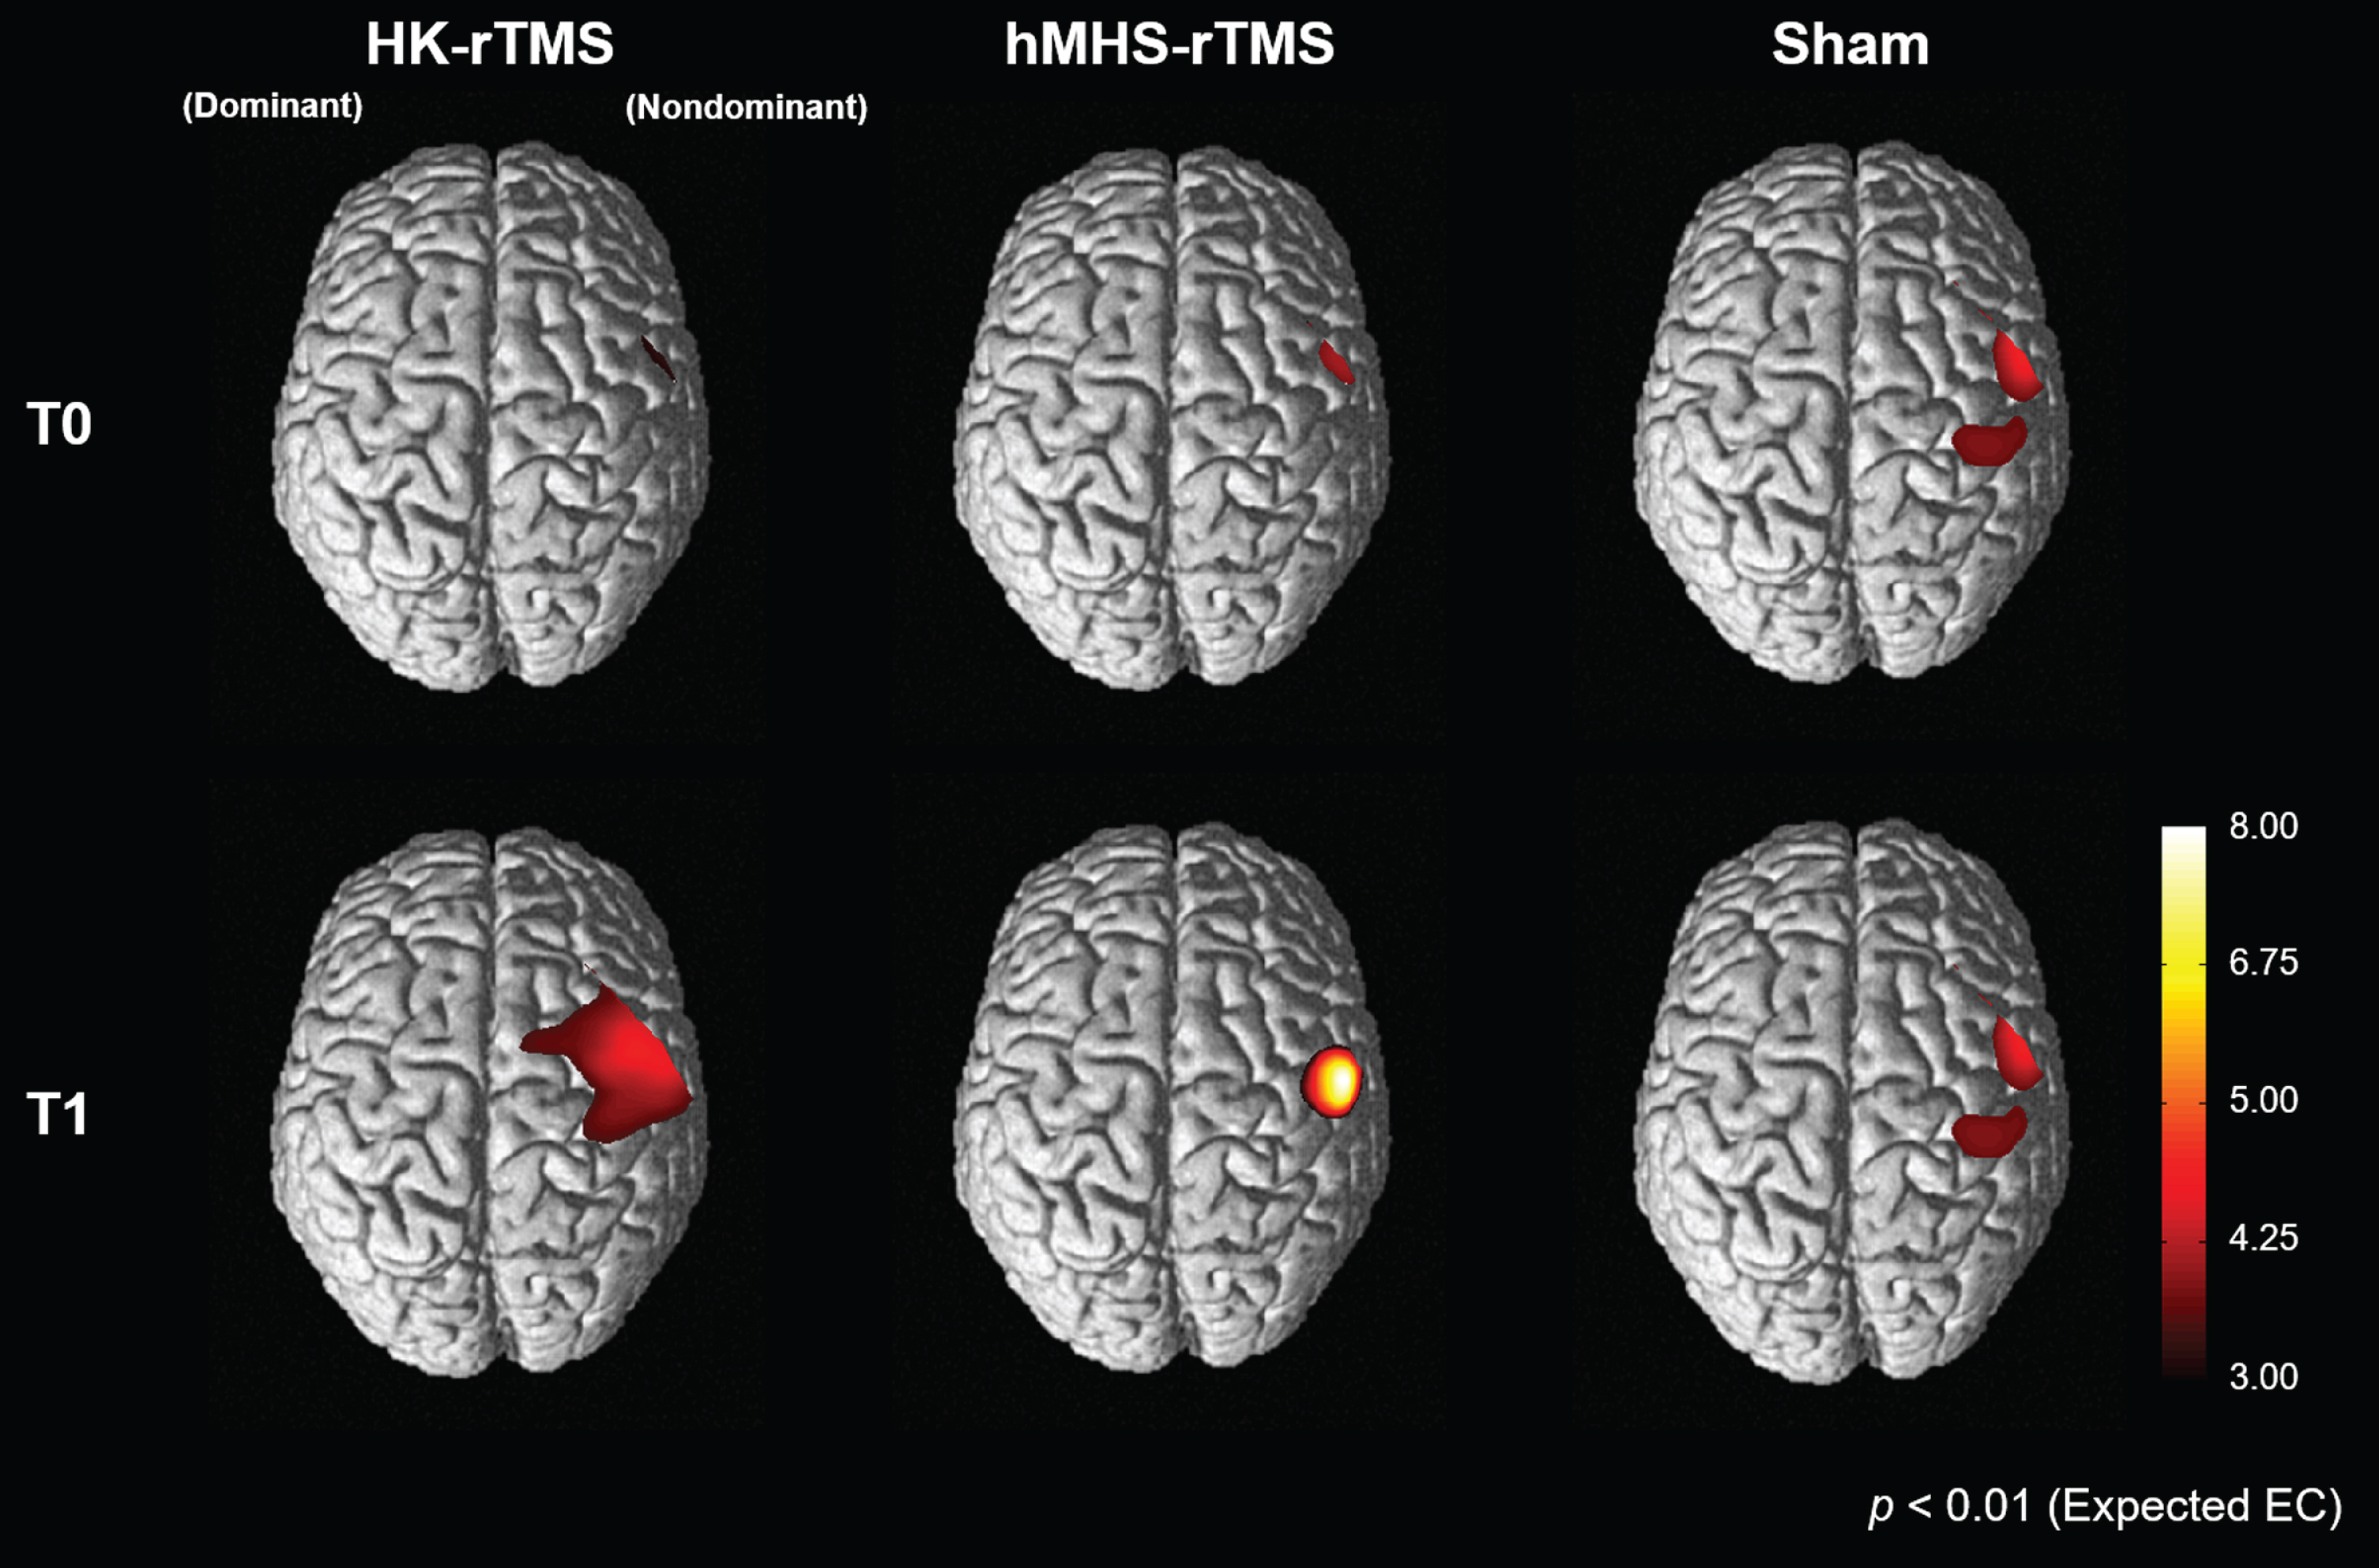
3.3Results of cortical activation in statistical parametric mapping analysis
Figure 4 shows the cortical activation patterns representing oxyHb concentration during the SRTT with the non-dominant hand before and after 1 Hz rTMS. Use of a non-dominant hand has led to activation of a non-dominant motor cortex containing channels corresponding to the ROI. As a result of SPM group analysis, the magnitude and position of cortical activity at T0 were similar in all three conditions. In both HK-rTMS and hMHS-rTMS, the magnitude and extent of activity of the non-dominant cortical region increased after 1 Hz rTMS. In HK-rTMS, the extent of cortical activity at T1 was wider than that at T0, but the magnitude of the activity increased very slightly (maximum t-value, 4.22 at T0 ⟶ 4.23 at T1). In hMHS-rTMS, the extent of cortical activity at T1 was wider than that at T0, and the magnitude of the activity drastically increased (maximum t-value, 3.24 at T0 ⟶ 7.66 at T1). In contrast, there was no significant change in the Sham-rTMS after stimulation compared with T0.
Fig. 4
Cortical activation patterns during a non-dominant serial reaction time task before (T0) and after (T1) rTMS stimulation. Cortical activation of the non-dominant hemisphere increased after low-frequency rTMS in the HK-rTMS and hMHS-rTMS. There was no significant change in the Sham-rTMS. T0, before rTMS stimulation; T1, after rTMS stimulation; rTMS, repetitive transcranial magnetic stimulation; HK, anatomical hand knob; hMHS, hand motor hotspot
4Discussion
In this study, we investigated the interhemispheric modulation effect of low-frequency (1 Hz) rTMS over the dominant motor cortex of different target sites, the HK and the hMHS. The application of 1 Hz rTMS on both HK and hMHS demonstrated significant changes of the contralateral cortical activity measured by oxyHb concentration compared with the Sham-rTMS in healthy subjects. On the other hand, changes in integral values of oxyHb concentration were significantly increased only in hMHS-rTMS condition compared with Sham-rTMS.
rTMS is a widely used non-invasive neuromodulation method in both basic research and clinical practice (Fitzgerald, Fountain, & Daskalakis, 2006). Investigating brain function by rTMS in healthy participants can be the basis for developing non-invasive brain stimulation techniques for neurologic patients (Reithler, Peters, & Sack, 2011). In the previous studies, low-frequency rTMS applied to the dominant hMHS improved function performance of the non-dominant hand by interhemispheric modulation effect as measured by grip strength, nine hole peg test, Wolf motor function test, and the motor evaluation scale for upper extremity in stroke patients (Lüdemann-Podubecká, Bösl, Theilig, Wiederer, & Nowak, 2015). Some studies have examined the effect of rTMS on cortical activity through fNIRS over different target sites. Hada et al. (Hada et al., 2006) applied 0.5 Hz or 2 Hz rTMS over the hMHS and reported deactivation of the stimulated motor cortex, while Chiang et al. (Chiang et al., 2007) used 1 Hz TMS over the HK and demonstrated increased oxyHb in the contralateral motor cortex. The latter study suggested that low-frequency rTMS over the motor cortex produced activation in the non-stimulated contralateral motor cortex by interhemispheric modulation effect. Our study confirmed the increase in oxyHb concentration in the non-stimulated contralateral motor cortical regions after 1 Hz rTMS, confirming this interhemispheric modulation effect.
In our study, the individual hMHS were located anterior and lateral to the HK. The difference in location between the HK and the hMHS was consistent with previous results of fMRI studies (Ahdab, Ayache, Brugières, Goujon, & Lefaucheur, 2010; Ahdab et al., 2016). Ahdab et al. (Ahdab et al., 2010) reported that the magnetic resonance imaging (MRI)-defined HK was 6.1±12.6 mm posterior to the hMHS in healthy subjects. In another study, the hMHS was located anteriorly over the precentral or middle frontal gyrus in healthy subjects and chronic neuropathic pain syndrome patients (Ahdab et al., 2016). These studies showed that the hMHS did not always correspond to the HK. Several functional neuroimaging studies have found that activation changes during hand movements are anteriorly scattered in the precentral gyrus (Yousry et al., 1997). It is well established that premotor cortex (PMC) adjacent to M1 in the precentral gyrus has direct excitatory projections over M1 (Mochizuki, Huang, & Rothwell, 2004). Therefore, the hand motor representation can be embedded in a larger map around the precentral cortex. According to the electrical microstimulation studies, the map related to the hand motor representation encompassed both M1 and adjacent PMC (Graziano, Taylor, & Moore, 2002; Graziano, Taylor, Moore, & Cooke, 2002).
Due to transcallosal connections between cortical areas, inhibition of one target site could produce a secondary effect distant from the stimulation target site (Chen, Deng, Schmidt, & Kimberley, 2015; Houdayer et al., 2008). According to the results of this study, the anatomical and neurophysiological characteristics could be different in the individual cerebral cortex, and these two characteristics should be carefully considered for targeting neuromodulation effect. Nonetheless, this is the first study to id-entify changes in cortical activation according to targeting method of the motor cortex. When the hMHS was stimulated, there was a significantly incr-eased cortical activity compared to the Sham-rTMS in channel 24, but it was not significant in the case of the HK-rTMS. Channel 24 was located between C2 and C4 in the international 10/20 system and corresponded to (x = 42, y = – 21, z = 62) in MNI co-ordinates (Morais et al., 2018). This channel was considered the primary motor cortical region related to hand movement among the four ROI channels, as the MRI study reported that the M1-Hand region was located between C2 and C4 (Silva, Silva, Lira-Bandeira, Costa-Ribeiro, & Araújo-Neto, 2020). The results of this study give insight for selecting the target site for neuromodulation of stroke patients. In stroke patients whose cerebral cortical motor expression can be reconstructed and shifted from the original M1 (Lee et al., 2015), rTMS target site should be determined using individual neurophysiological responses to obtain the maximum stimulation effect.
The present study has some limitations. First, we examined the results of only a single session of 1 Hz rTMS without examining multiple session effect. However, our results may provide the rationale for further studies investigating long-term changes in cortical activity after repeated rTMS sessions. Secondly, we confirmed the hemodynamic response to the position difference between HK and hMHS stimulated with 1 Hz rTMS over the dominant hemisphere to stimulate non-dominant hand function. This study is limited because the effect of other frequencies (i.e., high frequency) of rTMS was not examined. Therefore, further research is needed to confirm our results using other rTMS frequencies. Third, we tested as relatively small sample size of right-handed and young participants. A large sample size in different age groups may show interesting results related with aging of the brain. Fourth, we measured changes in cerebral blood flow by setting the maximum source detector separation (SDS) to 30 mm without short SDS signal acquisition. Thus, the recorded fNIRS signals reflect both extra-brain and intra-brain changes. Correction algorithms using short SDS signals can reduce the influence of skin blood flow changes in the fNIRS signal (Scholkmann, Gerber, Wolf, & Wolf, 2013). However, we could not apply this in our study due to a lack of short SDS signals. The removal of skin blood flow will have to be considered in future studies.
Nevertheless, our results confirm the effects of 1 Hz rTMS by investigating alterations of cortical activity in non-stimulated contralateral motor regions by fNIRS. When rTMS is used for neuromodulation, the cortical modulation effect can differ according to the method of determining rTMS target sites. The TMS-induced hMHS seemed to be a more effective target site for inducing interhemispheric modulation effect using 1 Hz rTMS. This effect should be retested in patients with neurologic diseases such as stroke.
Acknowledgments
This study was supported by Samsung Medical Center Grant (PHO014296) and by a grant from the Korea Health Technology R&D Project through the Korea Health Industry Development Institute (KHIDI), funded by the Ministry of Health & Welfare, Republic of Korea (HI17C1501), and by a National Research Foundation of Korea (NRF) grant funded by the Korean government (MSIP; NRF-2020R1A2C3010304, NRF-2020R1C1C1011688). This study was registered at ClinicalTrials.gov (NCT04019028).
References
1 | Ahdab, R. , Ayache, S. , Brugières, P. , Goujon, C. , & Lefaucheur, J.-P. ((2010) ). Comparison of “standard” and “navigated” procedures of TMS coil positioning over motor, premotor and prefrontal targets in patients with chronic pain and depression. Neurophysiologie Clinique/Clinical Neurophysiology, 40: (1), 27–36. |
2 | Ahdab, R. , Ayache, S.S. , Brugières, P. , Farhat, W.H. , & Lefaucheur, J.-P. ((2016) ). The hand motor hotspot is not always located in the hand knob: a neuronavigated transcranial magnetic stimulation study. Brain topography, 29: (4), 590–597. |
3 | Benjamini, Y. , & Hochberg, Y. ((1995) ). Controlling the false discovery rate: a practical and powerful approach to multiple testing. Journal of the Royal statistical society: series B (Methodological), 57: (1), 289–300. |
4 | Caparelli, E. , Backus, W. , Telang, F. , Wang, G. , Maloney, T. , Goldstein, R. , & Henn, F. ((2012) ). Is 1Hz rTMS always inhibitory in healthy individuals? The Open neuroimaging Journal, 6: , 69. |
5 | Chang, W.H. , Kim, Y.-H. , Bang, O.Y. , Kim, S.T. , Park, Y.H. , & Lee, P.K. ((2010) ). Long-term effects of rTMS on motor recovery in patients after subacute stroke. Journal of Rehabilitation Medicine, 42: (8), 758–764. |
6 | Chen, M. , Deng, H. , Schmidt, R.L. , & Kimberley, T.J. ((2015) ). Low-frequency repetitive transcranial magnetic stimulation targeted to premotor cortex followed by primary motor cortex modulates excitability differently than premotor cortex or primary motor cortex stimulation alone. Neuromodulation: Technology at the Neural Interface, 18: (8), 678–685. |
7 | Chiang, T.-C. , Vaithianathan, T. , Leung, T. , Lavidor, M. , Walsh, V. , & Delpy, D.T. ((2007) ). Elevated haemoglobin levels in the motor cortex following 1Hz transcranial magnetic stimulation: a preliminary study. Experimental Brain Research, 181: (4), 555–560. |
8 | Conchou, F. , Loubinoux, I. , Castel-Lacanal, E. , Le Tinnier, A. , Gerdelat-Mas, A. , Faure-Marie, N. ,... & Berry, I. ((2009) ). Neural substrates of low-frequency repetitive transcranial magnetic stimulation during movement in healthy subjects and acute stroke patients. A PET study. Human Brain Mapping, 30: (8), 2542–2557. |
9 | Curtin, A. , Tong, S. , Sun, J. , Wang, J. , Onaral, B. , & Ayaz, H. ((2019) ). A systematic review of integrated functional near-infrared spectroscopy (fNIRS) and transcranial magnetic stimulation (TMS) studies. Frontiers in Neuroscience, 13: , 84. |
10 | Fitzgerald, P.B. , Fountain, S. , & Daskalakis, Z.J. ((2006) ). A comprehensive review of the effects of rTMS on motor cortical excitability and inhibition. Clinical Neurophysiology, 117: (12), 2584–2596. |
11 | Graziano, M.S. , Taylor, C.S. , & Moore, T. ((2002) ). Complex movements evoked by microstimulation of precentral cortex. Neuron, 34: (5), 841–851. |
12 | Graziano, M.S. , Taylor, C.S. , Moore, T. , & Cooke, D.F. ((2002) ). The cortical control of movement revisited. Neuron, 36: (3), 349–362. |
13 | Hada, Y. , Abo, M. , Kaminaga, T. , & Mikami, M. ((2006) ). Detection of cerebral blood flow changes during repetitive transcranial magnetic stimulation by recording hemoglobin in the brain cortex, just beneath the stimulation coil, with near-infrared spectroscopy. Neuroimage, 32: (3), 1226–1230. |
14 | Houdayer, E. , Degardin, A. , Cassim, F. , Bocquillon, P. , Derambure, P. , & Devanne, H. ((2008) ). The effects of low-and high-frequency repetitive TMS on the input/output properties of the human corticospinal pathway. Experimental brain research, 187: (2), 207–217. |
15 | Iwański, S. , Leśniak, M. , Polanowska, K. , Bembenek, J. , Czepiel, W. , & Seniów, J. ((2020) ). Neuronavigated 1Hz rTMS of the left angular gyrus combinedwith visuospatial therapy in post-stroke neglect. NeuroRehabilitation(Preprint), 1-11. |
16 | Klomjai, W. , Katz, R. , & Lackmy-Vallée, A. ((2015) ). Basic principles of transcranial magnetic stimulation (TMS) and repetitive TMS (rTMS). Annals of physical and Rehabilitation Medicine, 58: (4), 208–213. |
17 | Langguth, B. , Zowe, M. , Landgrebe, M. , Sand, P. , Kleinjung, T. , Binder, H. ,... & Eichhammer, P. ((2006) ). Transcranial magnetic stimulation for the treatment of tinnitus: a new coil positioning method and first results. Brain Topography, 18: (4), 241–247. |
18 | Lee, J. , Lee, M. , Kim, D.-S. , & Kim, Y.-H. ((2015) ). Functional reorganization and prediction of motor recovery after a stroke: A graph theoretical analysis of functional networks. Restorative Neurology and Neuroscience, 33: (6), 785–793. |
19 | Lisanby, S.H. , Gutman, D. , Luber, B. , Schroeder, C. , & Sackeim, H.A. ((2001) ). Sham TMS: intracerebral measurement of the induced electrical field and the induction of motor-evoked potentials. Biological Psychiatry, 49: (5), 460–463. |
20 | Lüdemann-Podubecká, J. , Bösl, K. , Theilig, S. , Wiederer, R. , & Nowak, D.A. ((2015) ). The effectiveness of 1Hz rTMS over the primary motor area of the unaffected hemisphere to improve hand function after stroke depends on hemispheric dominance. Brain Stimulation, 8: (4), 823–830. |
21 | Maeda, F. , Keenan, J.P. , Tormos, J.M. , Topka, H. , & Pascual-Leone, A. ((2000) ). Modulation of corticospinal excitability by repetitive transcranial magnetic stimulation. Clinical Neurophysiology, 111: (5), 800–805. |
22 | Mesquita, R.C. , Faseyitan, O.K. , Turkeltaub, P.E. , Buckley, E.M. , Thomas, A. , Kim, M. N. ,... & Yodh, A.G. ((2013) ). Blood flow and oxygenation changes due to low-frequency repetitive transcranial magnetic stimulation of the cerebral cortex. Journal of Biomedical Optics, 18: (6), 067006. |
23 | Mochizuki, H. , Huang, Y.Z. , & Rothwell, J.C. ((2004) ). Interhemispheric interaction between human dorsal premotor and contralateral primary motor cortex. The Journal of Physiology, 561: (1), 331–338. |
24 | Morais, G.A.Z. , Balardin, J.B. , & Sato, J.R. ((2018) ). fNIRS optodes’ location decider (fOLD): a toolbox for probe arrangement guided by brain regions-of-interest. Scientific Reports, 8: (1), 1–11. |
25 | Nowak, D.A. , Grefkes, C. , Dafotakis, M. , Eickhoff, S. , Küst, J. , Karbe, H. , & Fink, G.R. ((2008) ). Effects of low-frequency repetitive transcranial magnetic stimulation of the contralesional primary motor cortex on movement kinematics and neural activity in subcortical stroke. Archives of neurology, 65: (6), 741–747. |
26 | Oliveira-Maia, A.J. , Press, D. , & Pascual-Leone, A. ((2017) ). Modulation of motor cortex excitability predicts antidepressant response to prefrontal cortex repetitive transcranial magnetic stimulation. Brain stimulation, 10: (4), 787–794. |
27 | Plichta, M.M. , Herrmann, M.J. , Baehne, C. , Ehlis, A.-C. , Richter, M. , Pauli, P. , & Fallgatter, A.J. ((2006) ). Event-related functional near-infrared spectroscopy (fNIRS): are the measurements reliable?. Neuroimage, 31: (1), 116–124. |
28 | Reithler, J. , Peters, J. , & Sack, A. ((2011) ). Multimodal transcranial magnetic stimulation: using concurrent neuroimaging to reveal the neural network dynamics of noninvasive brain stimulation. Progress in Neurobiology, 94: (2), 149–165. |
29 | Robbins, D. , Elwell, C. , Jimenez, A. , & Goss-Sampson, M. ((2012) ). Localised muscle tissue oxygenation during dynamic exercise with whole body vibration. Journal of Sports Science & Medicine, 11: (2), 346. |
30 | Rossi, S. , Hallett, M. , Rossini, P.M. , Pascual-Leone, A. , & Group, S. o. T. C. ((2009) ). Safety, ethical considerations, and application guidelines for the use of transcranial magnetic stimulation in clinical practice and research. Clinical Neurophysiology, 120: (12), 2008–2039. |
31 | Rossini, P.M. , Barker, A. , Berardelli, A. , Caramia, M. , Caruso, G. , Cracco, R. ,... & Lücking, C. ((1994) ). Non-invasive electrical and magnetic stimulation of the brain, spinal cord and roots: basic principles and procedures for routine clinical application. Report of an IFCN committee. Electroencephalography and Clinical Neurophysiology, 91: (2), 79–92. |
32 | Sahlsten, H. , Holm, A. , Rauhala, E. , Takala, M. , Löyttyniemi, E. , Karukivi, M. ,... & Johansson, R. ((2019) ). Neuronavigated versus non-navigated repetitive transcranial magnetic stimulation for chronic tinnitus: a randomized study. Trends in hearing, 23: , 2331216518822198. |
33 | Salatino, A. , Berra, E. , Troni, W. , Sacco, K. , Cauda, F. , D’Agata, F. ,... & Ricci, R. ((2014) ). Behavioral and neuroplastic effects of low-frequency rTMS of the unaffected hemisphere in a chronic stroke patient: a concomitant TMS and fMRI study. Neurocase, 20: (6), 615–626. |
34 | Scholkmann, F. , Gerber, U. , Wolf, M. , & Wolf, U. ((2013) ). End-tidal CO2: an important parameter for a correct interpretation in functional brain studies using speech tasks. Neuroimage, 66: , 71–79. |
35 | Silva, L.M. , Silva, K.M.S. , Lira-Bandeira, W.G. , Costa-Ribeiro, A.C. , & Araújo-Neto, S.A. ((2020) ). Localizing the Primary Motor Cortex of the Hand by the 10-5 and 10-20 Systems for Neurostimulation: An MRI Study. Clinical EEG and Neuroscience, 1550059420934590. |
36 | Song, W. , Du, B. , Xu, Q. , Hu, J. , Wang, M. , & Luo, Y. ((2009) ). Low-frequency transcranial magnetic stimulation for visual spatial neglect: a pilot study. Journal of Rehabilitation Medicine, 41: (3), 162–165. |
37 | Sparing, R. , Buelte, D. , Meister, I.G. , Pau\v s, T. , & Fink, G.R. ((2008) ). Transcranial magnetic stimulation and the challenge of coil placement: a comparison of conventional and stereotaxic neuronavigational strategies. Human Brain Mapping, 29: (1), 82–96. |
38 | Strangman, G. , Culver, J.P. , Thompson, J.H. , & Boas, D.A. ((2002) ). A quantitative comparison of simultaneous BOLD fMRI and NIRS recordings during functional brain activation. Neuroimage, 17: (2), 719–731. |
39 | Tak, S. , & Ye, J.C. ((2014) ). Statistical analysis of fNIRS data: a comprehensive review. Neuroimage, 85: , 72–91. |
40 | Tak, S. , Yoon, S.J. , Jang, J. , Yoo, K. , Jeong, Y. , & Ye, J.C. ((2011) ). Quantitative analysis of hemodynamic and metabolic changes in subcortical vascular dementia using simultaneous near-infrared spectroscopy and fMRI measurements. Neuroimage, 55: (1), 176–184. |
41 | Wassermann, E.M. , & Lisanby, S.H. ((2001) ). Therapeutic application of repetitive transcranial magnetic stimulation: a review. Clinical Neurophysiology, 112: (8), 1367–1377. |
42 | Yoo, W.-K. , You, S.H. , Ko, M.-H. , Kim, S.T. , Park, C.-h. , Park, J.-W. ,... & Kim, Y.-H. ((2008) ). High frequency rTMS modulation of the sensorimotor networks: behavioral changes and fMRI correlates. Neuroimage, 39: (4), 1886–1895. |
43 | Yousry, T.A. , Schmid, U. , Alkadhi, H. , Schmidt, D. , Peraud, A. , Buettner, A. , & Winkler, P. ((1997) ). Localization of the motor hand area to a knob on the precentral gyrus. A new landmark. Brain: A Journal of Neurology, 120: (1), 141–157. |
44 | Zhengwu, P. , Cuihong, Z. , Shanshan, X. , Jie, B. , Shoufen, Y. , Xiaosa, L. ,... & Qingrong, T. ((2018) ). Mechanism of repetitive transcranial magnetic stimulation for depression. Shanghai Archives of Psychiatry, 30: (2), 84. |


