
Early recovery of neuronal functioning in the sensory cortex after nerve reconstruction surgery
Abstract
Background:
Nerve reconstructive surgery induces a transient loss and a prolonged and a gradual return of sensory inputs to the brain. It is unknown whether, following this massive peripheral denervation, the brain will experience a prolonged period of severe, intrinsic dysfunction.
Objective:
We aim to investigate the mechanisms of return of processing function in cortical neurons.
Methods:
We used the whisker model in rats to evaluate the functional recovery in the somatosensory cortex after a nerve reconstruction surgery. Multi-unit recording in the barrel cortex was performed in lightly anesthetized rats while their whiskers were stimulated by a whisker stimulator.
Results:
We observed a loss of neuronal responses to whisker stimulation 1 week after surgery, which started to recover 2 weeks after surgery. Following the surgery, only 11.8% of units had principle whiskers (PWs) returned to their original status while 17.7% had PWs different from their original status, indicating the effect of aberrant reinnervation on the whisker response map.
Conclusions:
Robust neuronal responses to sensory stimulation even when only sparse sensory inputs are available in the early recovery phase. During this phase, aberrant reinnervation induces disorganized whisker tuning, a finding that might be account for the hypoesthesia and paresthesia during early recovery after nerve reconstruction.
1Introduction
The objective of functional reconstruction in plastic surgery is to restore motor-sensory function that is necessary for daily life. For example, the goal of hand transplantation is to achieve haptic function and the ability to manipulate objects (Salminger, Roche, Sturma, Mayer, & Aszmann, 2016). Similarly, the ultimate goal of facial transplantation is to provide facial sensation as well as dexterous and intuitive facial muscle control (Pomahac et al., 2011). In clinical scenarios, most reconstructed nerves are mixed nerves, in which both motor and sensory axons are injured. For vibrissae system, motor recovery using facial nerve reconstruction models has been studied (Pavlov et al., 2008; Peeva et al., 2006; Skouras, Pavlov, Bendella, & Angelov, 2012), but the recovery of sensation remains unclear. Given the inevitable aberrant reinnervation at the nerve apposition site on the reconstructed nerve, it is important to understand how the brain resolves the aberrant input and reconstructs the pragmatic sensory percepts. Understanding the physiological limitations of functional reorganization will guide us to develop novel therapies to regain sensory-motor function following a neurological injury. To tackle this issue, we need an animal model that can undergo reconstruction surgery in a highly controlled manner, with monitoring of brain activity before and after the surgery in chronologically measured detail.
The rodent mystacial pad flap consists of a skin flap, vasculature, nerves, muscles, and whisker receptor, a specialized sensory organ that provides sensory information that is crucial for environmental awareness and exploratory behavior (Washington et al., 2009). González-García and colleagues (González-García, Landín-Jarillo, & Piqueras-Del, 2007) evaluated this sensory function after hemifacial transplant in rats by filming traction of the whiskers. Electromyography of the mystacial muscle and facial nerve conduction studies were performed after hemifacial transplant in the rats to evaluate the recovery of motor function (González-García et al., 2007; Landin, Cavadas, Gonzalez, Caballero-Hidalgo, & Rodriguez-Perez, 2009; Landin et al., 2008). Behavioral and immunohistological methods were also applied for characterizing the mechanisms of motor recovery after facial nerve reinnervation (Pavlov et al., 2008; Peeva et al., 2006; Skouras et al., 2012). Somatosensory-evoked potential and motor-evoked potential testing were also used to evaluate recovery after midface transplant in rats (Zor, Bozkurt, Nair, & Siemionow, 2010).
The afferent responses emanating from each whisker ascend to the barrel cortex in the primary somatosensory cortex (S1), with the response manifestation predominantly of a one-whisker-to-one-barrel correspondence (Kwegyir-Afful, Bruno, Simons, & Keller, 2005), a property that can be used to fathom the degree to which the one-to-one correspondence is achieved following reconstruction surgery. For a neuron in the barrel cortex, the whisker that elicits the maximal response is called principle whisker (PW). We hypothesized that an ideal reconstruction surgery would restore a neuron’s PW function to its original presurgical function.
The infraorbital nerve (ION), a purely sensory nerve, receives peripheral afferent impulses from mechanoreceptors in the whiskers (Erzurumlu, Murakami, & Rijli, 2010) and provides perceptive signals when the animal explores its environment (Andermann, Ritt, Neimark, & Moore, 2004; Carvell & Simons, 1990). Xiao et al. (2016) (Xiao, Zanoun, Carvell, Simons, & Washington, 2016) reported the dynamics of recovery of electrophysiological signals in the trigeminal ganglia following nerve reconstruction in the ION of rats 3 and 8 weeks postsurgically. The results showed that the activities of peripheral afferents disappeared immediately after the surgery and emerged 2-3 weeks after surgery with spare inputs, and their onset latency was profoundly prolonged. It is unknown whether the brain can recover its neuronal processing for somatosensory inputs after experiencing a prolonged period of severe, intrinsic dysfunction following massive peripheral denervation. Furthermore, the mechanisms of return of processing function in cortical neurons remains unclear given aberrant reinnervation is inevitable during the early phase of sensory recovery.
To this end, we characterized the chronological changes of whisker tuning following reconstruction surgery of the ION. In order to keep track of the tuning of neurons in barrel cortex before and after the reconstruction, chronic recording of 3 to 4 weeks is needed. We hypothesized that, analogous to the clinical presentation observed in patients, the initial recovery of sensory inputs from the reinnervated nerve can yield strong neuronal responses even though only a proportion of afferents has been reinnervated. We also hypothesized that aberrant reinnervation would abolish the one-to-one correspondence between the whisker-to-barrel pairs in a majority of cortical neurons.
2Methods
2.1Animals
Twelve adult Lewis male rats (body weight: 260–360 g) (BioLASCO Taiwan Co., Ltd.) were used. The rats were kept in a 12-h dark/light cycle environment at a temperature of 25°C with food and water available ad libitum. All the experimental procedures were approved by the Institutional Animal Care and Use Committee of Linkou Chang Gung Memorial Hospital. Animal care adhered to the guidance established by Codes for Experimental Use of Animals from the Council of Agriculture, Taiwan.
2.2Electrodes implantation for chronic recording
For electrode implantation surgery, the animal was first placed in a cage with a mixture of 2% isoflurane and air for sedation. Anesthesia was induced by intraperitoneal injection with an initial dose of a mixture of tiletamine/zolazepam (30 mg/kg) and dexmedetomidine (0.1 mg/kg); dexmedetomidine (0.25 mg/kg, subcutaneous injection) was used to maintain the anesthesia depth such that no pain-elicited withdrawal reflex could be observed during the surgery. The rats were placed on the stereotaxic device, and body temperature was maintained at 37°C by a heating pad. The skin, skull (4×3 mm), and the dura overlying the predetermined recording area on the right barrel cortex was removed sequentially, and the electrode was inserted slowly into the recording site (1–3 mm posterior and 3–5 mm lateral to the bregma, to a depth of 1.2–1.8 mm from the brain surface and with an insertion angle perpendicular to the brain surface). The electrode was a hand-made 8-channel microwire (stainless steel 304, with a diameter of 0.002 inch) (California Fine Wire, Grover Beach, USA) array that spanned a total length of 2 mm. One ground and one reference screw electrode were placed on the occipital bone. Four stainless screws 1 mm in diameter were used to fix the electrode and connector to the skull, two head holders were fixed to the occipital bone, and finally, all the components were covered by dental cement. Immediately after the surgery, the wound was covered with antibiotic and 0.2% lidocaine cream for infection prevention and pain control, respectively, and for the subsequent insertion of microelectrodes around the surgical wound. The recording procedure was performed after a recovery period of at least 7 days.
2.3Nerve reconstruction surgery
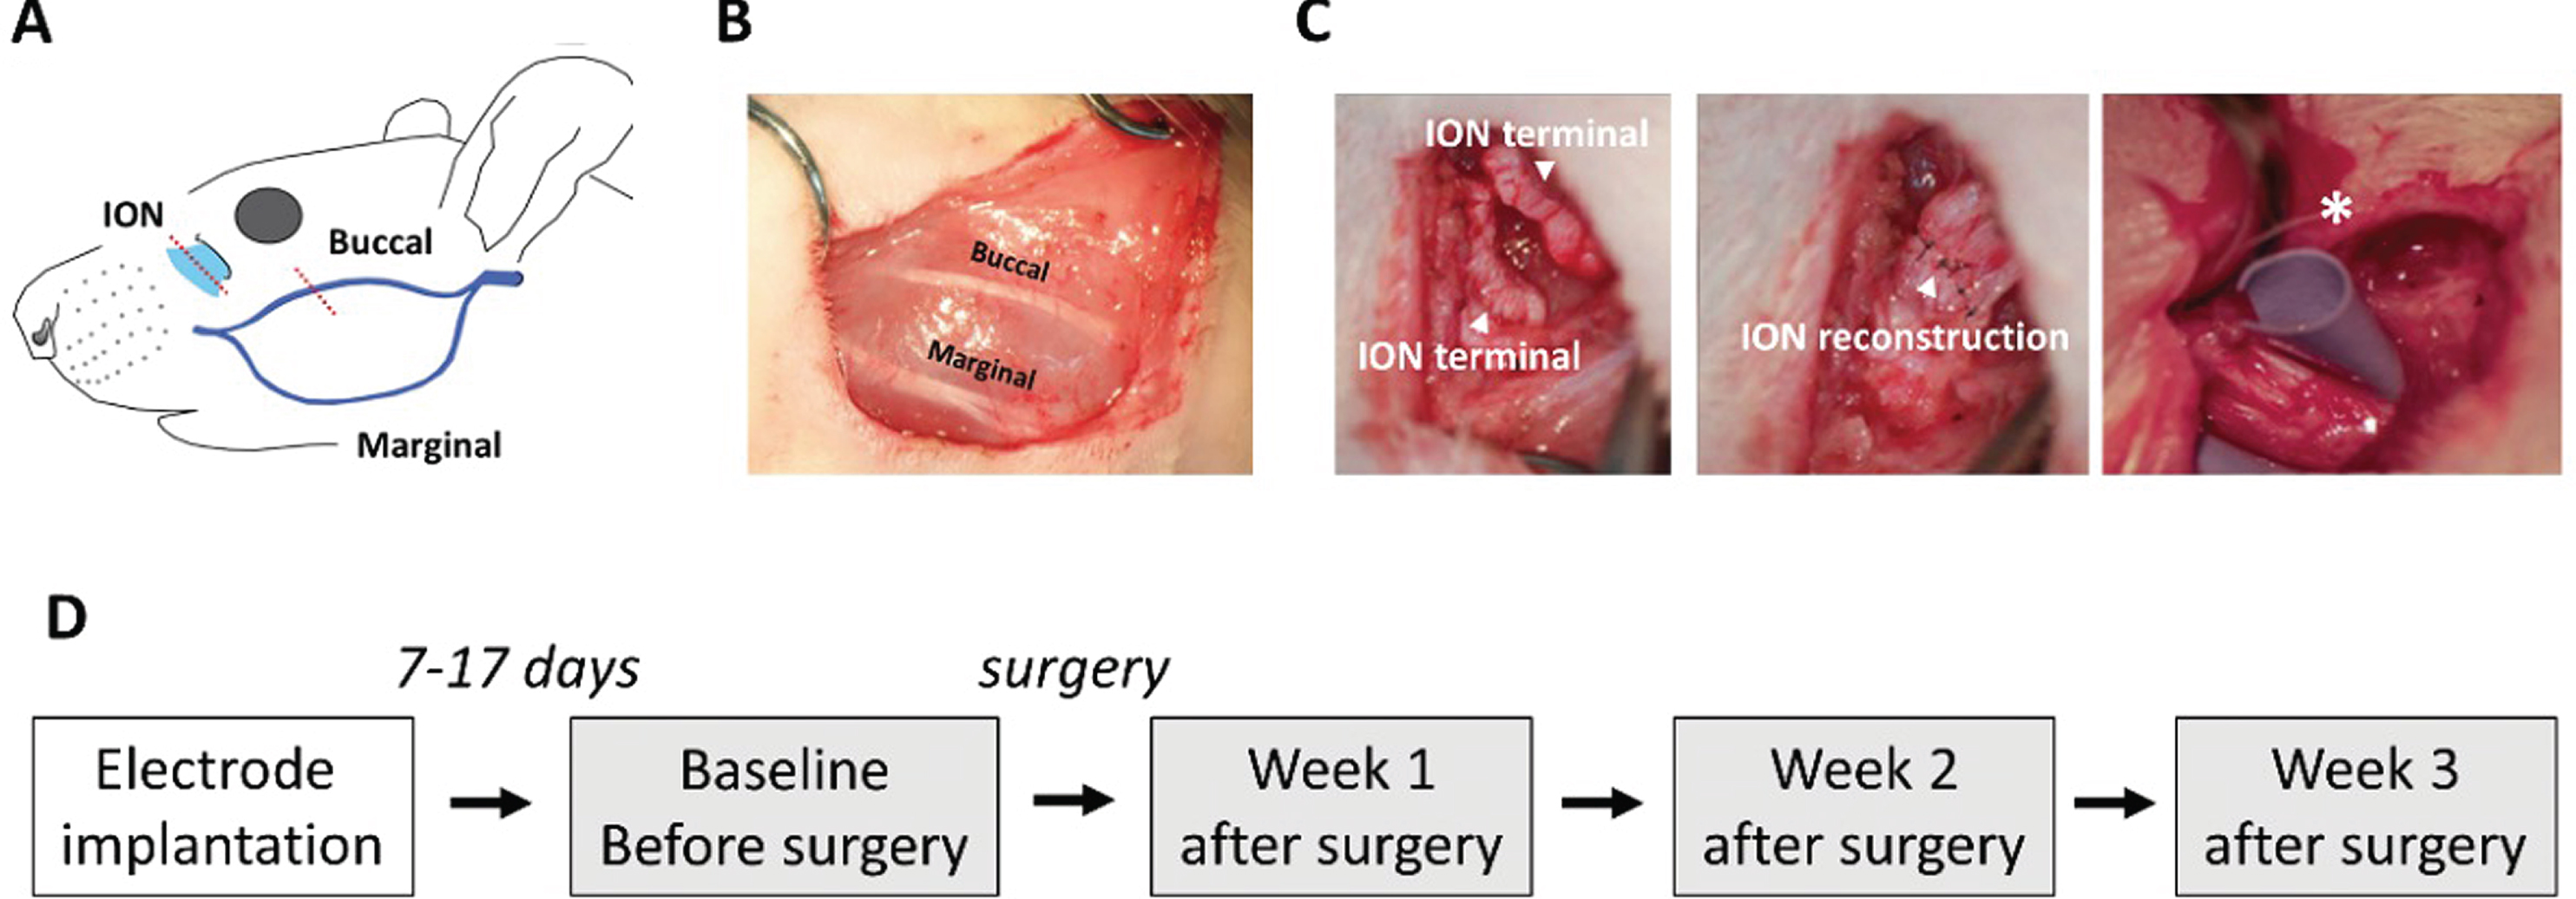
Nerve reconstruction surgery was performed at least 7 days after electrode implantation. The animal was anesthetized by a mixture of 0.5% isoflurane and air. The animals were assigned into three groups: the (1) reconstruction (n = 5), (2) sham (n = 3), and (3) resection (n = 4) groups. In the reconstruction group, we first cut the skin near the mystacial pad and isolated the buccal branch of the facial nerve (a purely motor nerve) and the infraorbital branch of the trigeminal nerve (a purely sensory nerve) (Fig. 1A). In order to mimic the loss of sensory-motor function after reconstruction surgery, the two nerves were cut (neurotomy) and were then reconnected end-to-end (neurorrhaphy) using 10-0 nylon (Fig. 1B, Fig. 1C left and middle panels). Finally, the skin was closed using 6-0 nylon. The resection group was identical to the reconstruction group except that, after neurotomy, neurorrhaphy was not performed, and a plastic material was implanted between the proximal and distal stump ends, so that nerve regrowth through the stump ends was totally prevented (Fig. 1C right panel). This group thus served as the negative control by having no return of afferent inputs. The rats in the sham group underwent only the skin incision and repair so that nerve was perfectly healthy, and we expected this group to have normal nerve function.
Fig.1
Nerve reconstruction surgery in the left facial area of the rat and timeline of experiments. (A) Localization of the infraorbital nerve (ION) (cyan) and buccal branch of the facial nerve (purple). The red dotted line shows the reconstruction sites. (B) The buccal branch of the facial nerves after reconstruction surgery in the reconstruction group. (C) ION after reconstruction surgery. In the reconstruction group, ION was first resected (left panel), and the sutured end-to-end apposition (middle panel). In the resection group, a plastic material (marked as *) was placed between the gap of the proximal and distal stumps of the ION, blocking nerve regeneration. (D) The timeline of the experiment. Each grey block indicates a neuronal recording.
2.4Whisker stimulation and neuronal recording
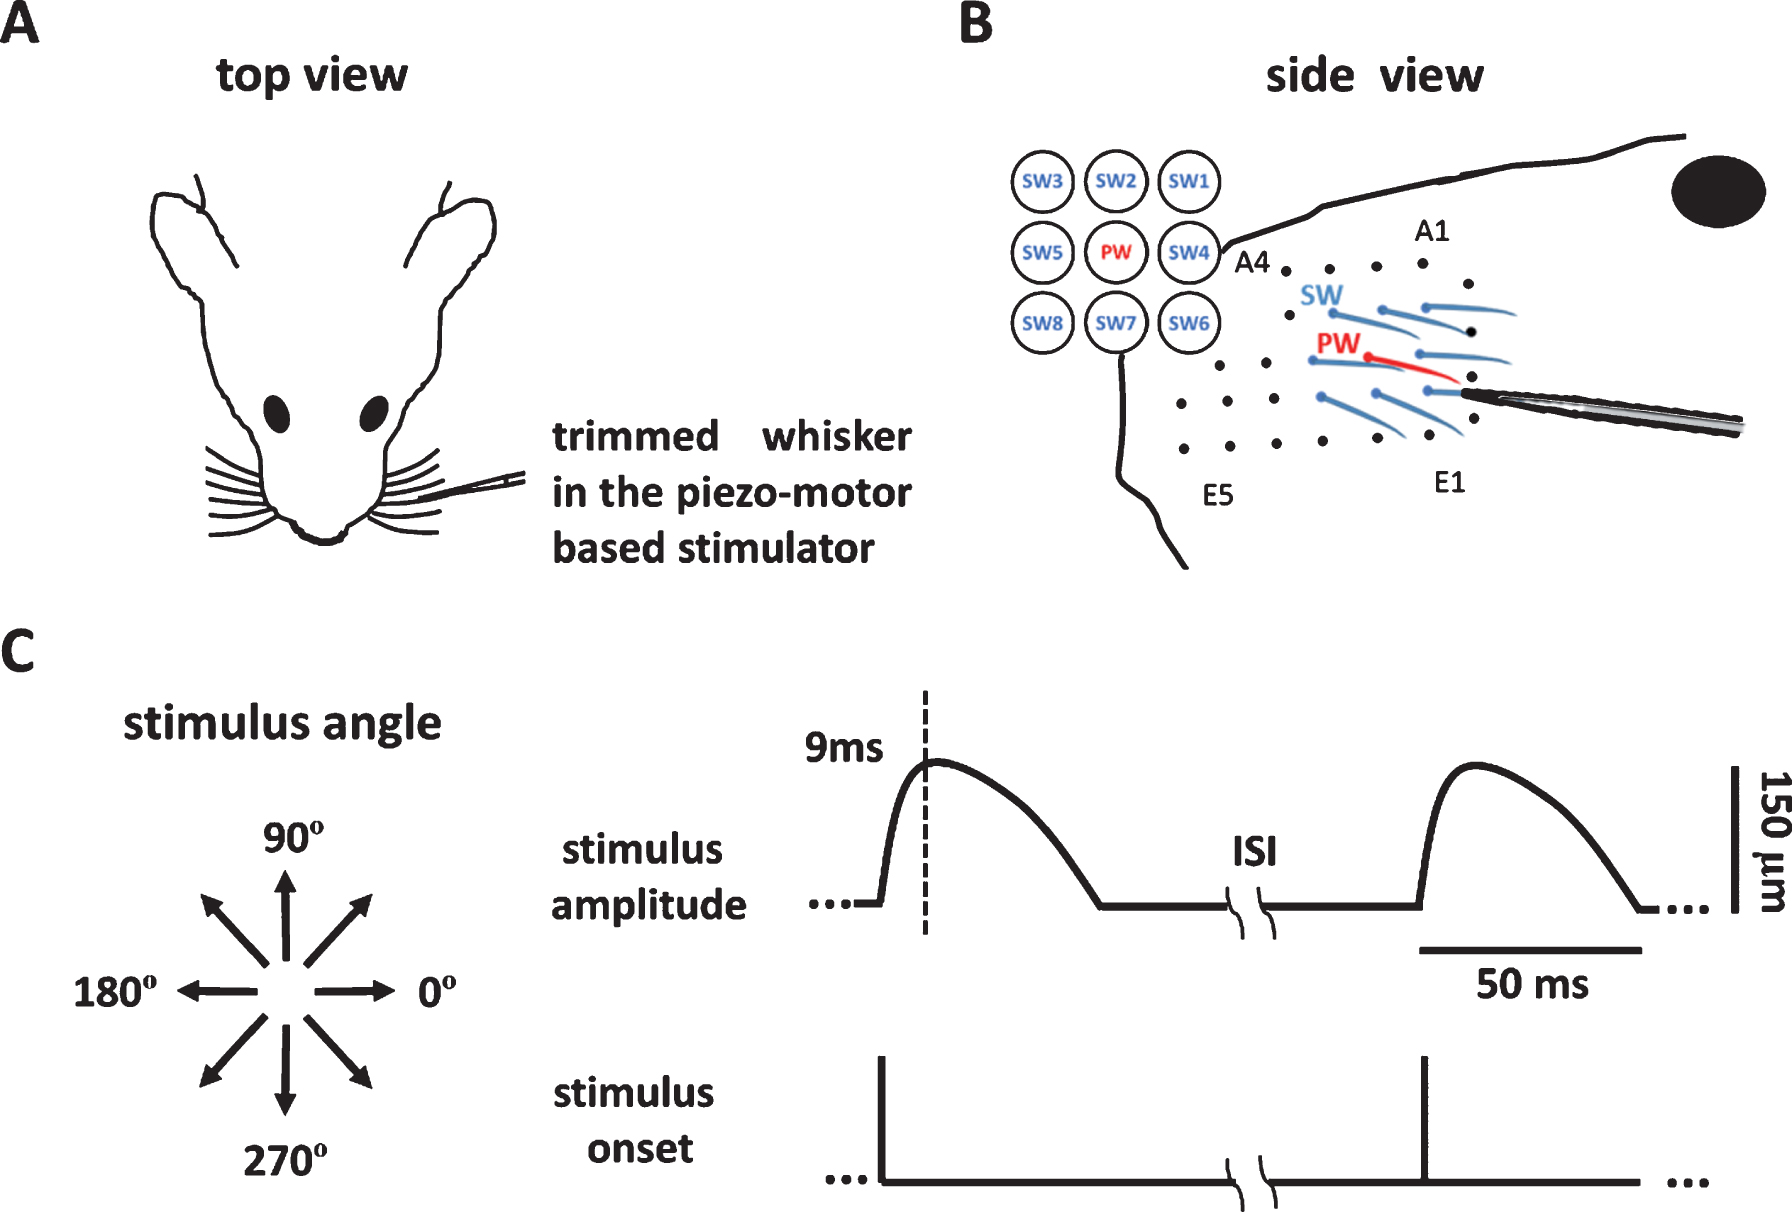
Neuronal recording of whisker stimulation began at least 7 days after electrode implantation (Fig. 1D), at a time when the interaction between the tissue and the electrode had supposedly reached stability. The rat was anesthetized with a mixture of air and 2% isoflurane and then was kept in light anesthesia using dexmedetomidine (0.1 mg/kg, i.m.). The anesthesia was then maintained by administering half of the initial dose every 30 min. Before recording, all the whiskers were trimmed to a length of 10 mm, and the PW was identified by manual mapping using a dropper. The PW and its eight surrounding whiskers (SWs) (Fig. 2A) were stimulated one by one (Fig. 2B). The PW was stimulated first, and the SWs were stimulated in a random order. The rat’s head was fixed in the head holder, and the whisker to be stimulated was inserted 5-6 mm into the micro tube connected to the piezo-based whisker stimulator (Fig. 2B). For each whisker, the stimulus consisted of eight directions, from 0° to 315° in 45° steps (Fig. 2C, left), each of which was repeated 10 times in 10 blocks, each of which was repeated in a pseudorandom order. One blank (no stimulation) trial was interleaved in each block. The trajectory of whisker stimulation in each trial was a morphed 1/4 sinusoid wave with a 9 ms rise time and 41 ms decay time, and the amplitude was 150 μm (Fig. 2C, right). The adaptation was avoided by using an inter-trial interval of 250 ms (Fanselow & Nicolelis, 1999).
Fig.2
Whisker stimulations presented by the whisker stimulator. (A) The setup for recording and whisker stimulation. The animal’s whiskers were trimmed, a whisker was mounted into the piezo-motor based stimulator, and neuronal signals were obtained by the micro-wire electrode. (B) The principle whisker (PW) (red) and eight surrounding whiskers (SWs) (blue) were first identified by manual mapping, and each of the whiskers was stimulated one-by-one in the stimulator. (C) The left panel shows the eight stimulus directions. The 0° and 180° indicate the posterior and anterior directions with respect to the left mystacial pad. The right panel shows the bending amplitude as a function of time. The bending peaked 9 ms post stimulus onset and gradually return to the baseline position 50 ms after stimulus onset.
The neuronal recording was obtained before and 1, 2, and 3 weeks after the reconstruction surgery (Fig. 1D), providing a chronological follow-up of the neural activities. The electrode signals were recorded by a multichannel recording system (Cerebus, Blackrock Microsystems, Salt Lake City, UT, USA). The signals were sampled at a 30 kHz sampling rate and bandpass filtered from 250 Hz to 7.5 kHz (Fig. 3A). Multi-unit activities were detected using Offline Sorter software (Plexon, Dallas, USA). Specifically, a multi-unit spike was detected if its amplitude exceeded a threshold of four standard deviations of the signal amplitude from the filtered signal trace. The spike timing data was then analyzed using Matlab (Mathworks, Natick, USA).
Fig.3
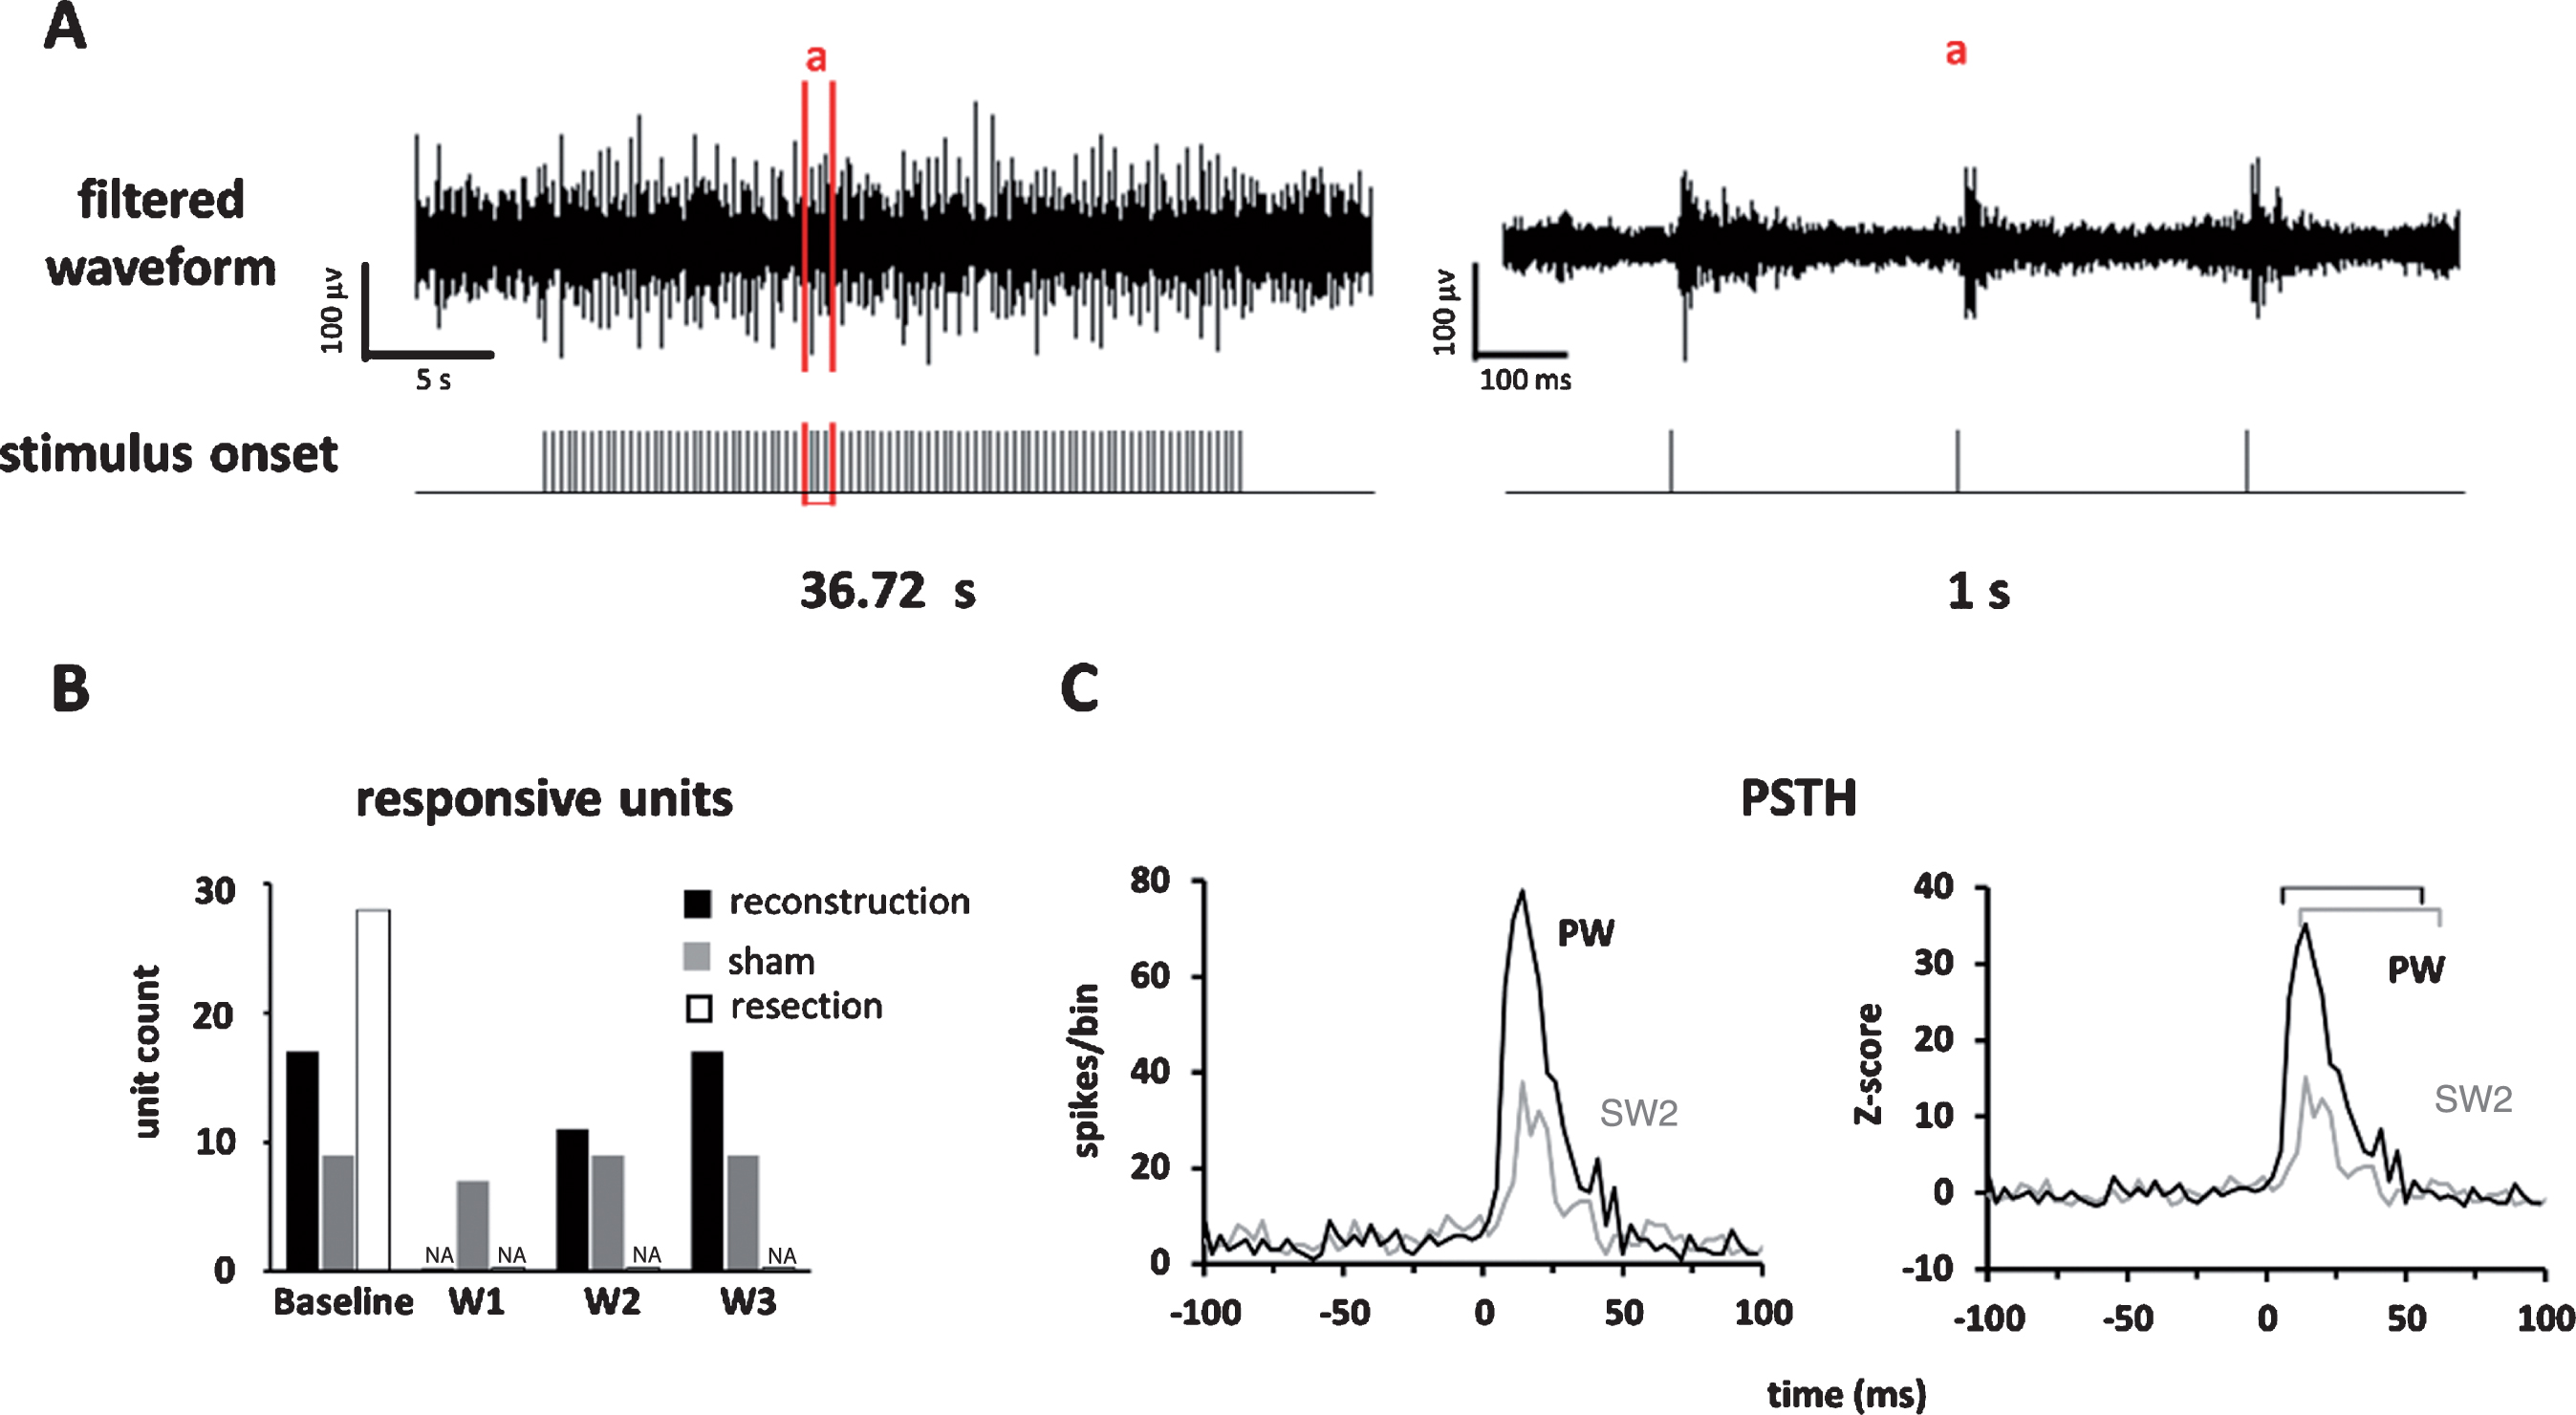
Neuronal responses in barrel cortex elicited by whisker stimulation. (A) Left panel: the recorded multi-unit signals from a block of experiment; Right panel: the signals in window “a”; the spike timing was computed from the filtered neuronal signals. (B) Comparison of number of responsive units across assessment weeks and across experiment groups showed a gradual recovery of responsive units in the reconstruction group, a persistent number of response units in the sham group, and no recovery in the resection group. (C) The PSTH (left) and Z-score (right) of a unit’s responses to stimulus presented to the PW (black) and SW2 (gray) recorded before surgery. The bin size was 3 ms. The marked time windows were used to compute the area under the curve that started from response onset and lasted for 50 ms.
2.5Estimation of sensory functional recovery
First, a peristimulus time histogram (PSTH) spanning 100 ms before to 100 ms after stimulus onset that included 80 trials (8 directions×10 repetitions) was constructed. The onset latency of the stimulus-driven responses was identified using a threshold of 2 standard deviations of signals during the prestimulus baseline (0–100 ms before stimulus onset) as the first bin that passed the threshold and was defined as the response onset latency (bin width = 3 ms). In each trial, the time window to compute neuronal activities started from the onset of the stimulus-driven responses and lasted 50 ms. The effective responses were identified as Wilcoxon Rank Sum tests with p < 0.05, indicating a significant increase of stimulus-driven responses compared with its prestimulus baseline. For analyzing neuronal activities, the spike counts were binned at bin width of 3 ms, and the count per bin was transformed to a Z-score using Equation 1:
(1)
2.6Whisker spatial recovery
For analyzing chronological changes of the whisker response map, the spatial distribution of Z-score values among the PW and eight SWs, the center of gravity (COG) method was applied. The COG of the response map was computed using the spatial weight of the location of the whiskers and their corresponding neuronal responses, yielding a location on the map that most suitably reflected the center of whisker tuning.
This analysis was performed for the recording sessions when the unit was responsive to whisker stimulation, which usually occurred at baseline and 2 and 3 weeks after reconstruction surgery. Finally, the vector, the direction, and distance of the change in COG over time were analyzed to evaluate the chronological alternation of whisker tuning. The unit of COG distance is inter-whisker distance.
2.7Histology
At the end of the experiment, the rat was deep anesthetized by sodium pentobarbital (50 mg/kg, i.p.) overdose. The recording sites were marked by a monophasic microcurrent of 5 μA for 30 seconds, and then the rat was cardiac perfused using a solution of 10% formalin mixed with 1% potassium ferricyanide. The brain tissue was removed and then soaked in a solution of 20% sucrose for 7 days and serially frozen and sectioned at 50 μm per slice in the coronal plane. The tissue was later stained using cytochrome oxidase (CO) histochemistry.
3Results
3.1Recovery of sensory input in the barrel cortex after nerve reconstruction
Thirty-six units were recorded in the barrel cortex from five rats in the reconstruction group. We removed the electrodes from the units that were not consistently observed for at least 3 weeks, which will yield data to fill in missing data from other units. The whisker tuning of each unit, in terms of the PW, was identified by finding the whisker that elicited the maximal responses when stimulated. The chronological changes of whisker tuning showed that all units that exhibited tuned PWs before surgery (n = 17/17, 100%, responsive significance was confirmed by Wilcoxon rank-sum test) and showed no stimulus driven responses 1 week after surgery (Table 1), indicating a loss of conduction through the reconstruction site. The neuronal responses then recovered at 2 weeks after surgery in almost two-thirds of the units (n = 11/17, 64.7%), indicating the afferent signals started to ascend to the cortex after nerve regrowth. Units in the sham group showed stimulus-driven responses in all the assessment time points, but those in the resection group showed responses only at baseline and no responses after surgery, indicating that successful reconstruction is necessary for regeneration (Fig. 3B, Supplementary Table 1).
The latency of the stimulus-drive response is used to discern the degree to which the sensory signals are prolonged as they ascend from the mechanoreceptor to the cortex, which is supposed to occur in the reconstruction site due to inadequate myelination. The results analyzed from the calculation window (50 ms from response onset, Fig. 3C) showed that onset latency 2 weeks after surgery increased to almost 2.5 times that observed at baseline (baseline: 9.88±1.02 ms, n = 17; W2: 22.67±1.26 ms, n = 9). Interestingly, onset latency partially improved 3 weeks after surgery (18.18±1.44 ms, n = 17) but was still prolonged compared with baseline. The onset latency in the shame group remained stationary (baseline: 9.67±0.77ms, n = 9; W1: 9.00±1.60ms, n = 7; W2: 7.67±0.61ms, n = 9; W3: 8.33±1.26ms, n = 9), and was no longer observed after the surgery in the resection group (before: 12.00±1.12ms, n = 28) (Fig. 4A).
Under curve area of PSTH was used to reflect the magnitude of stimulus-driven neuronal responses. In the reconstruction group, even no neuronal responses were observed 1 week after surgery, 40% of the under curve area has recovered 2 weeks after surgery (baseline: 140.58±13, n = 17; W2: 52.63±7.88, n = 9; W3: 53.77±10.2, n = 17), and remained comparable in the sham group (baseline: 114.90±12.24, n = 9; W1: 144.17±14.87, n = 7; W2: 187.69±15.60, n = 9; W3: 136.83±9.21, n = 9), and was no longer observed after the surgery in the resection group (baseline: 106.04±14.09, n = 28), indicating a substantial neuronal responses even when afferent inputs from reinnervated nerves were sparse in early phase of recovery (Fig. 4B).
Fig.4
The onset latency and under curve area of PSTH for the three groups. (A) Onset latency increased after recovery in the reconstruction group, remained stationary in the sham group, and was no longer observed after the surgery in the resection group. (B) The area under the curve (obtained from the 50ms window beginning from the onset of response delineated in Fig. 3C) that reflects the magnitude of the stimulus-driven responses decreased after recovery in the reconstruction group, remained comparable in the sham group, and was no longer observed after the surgery in the resection group. (C) The onset latency specifically in units whose stimulus-driven activities returned 2 weeks after surgery. (D) The undercurve area in those units described in (C). Data is presented as mean±SEM; *p < 0.05; **p < 0.01.
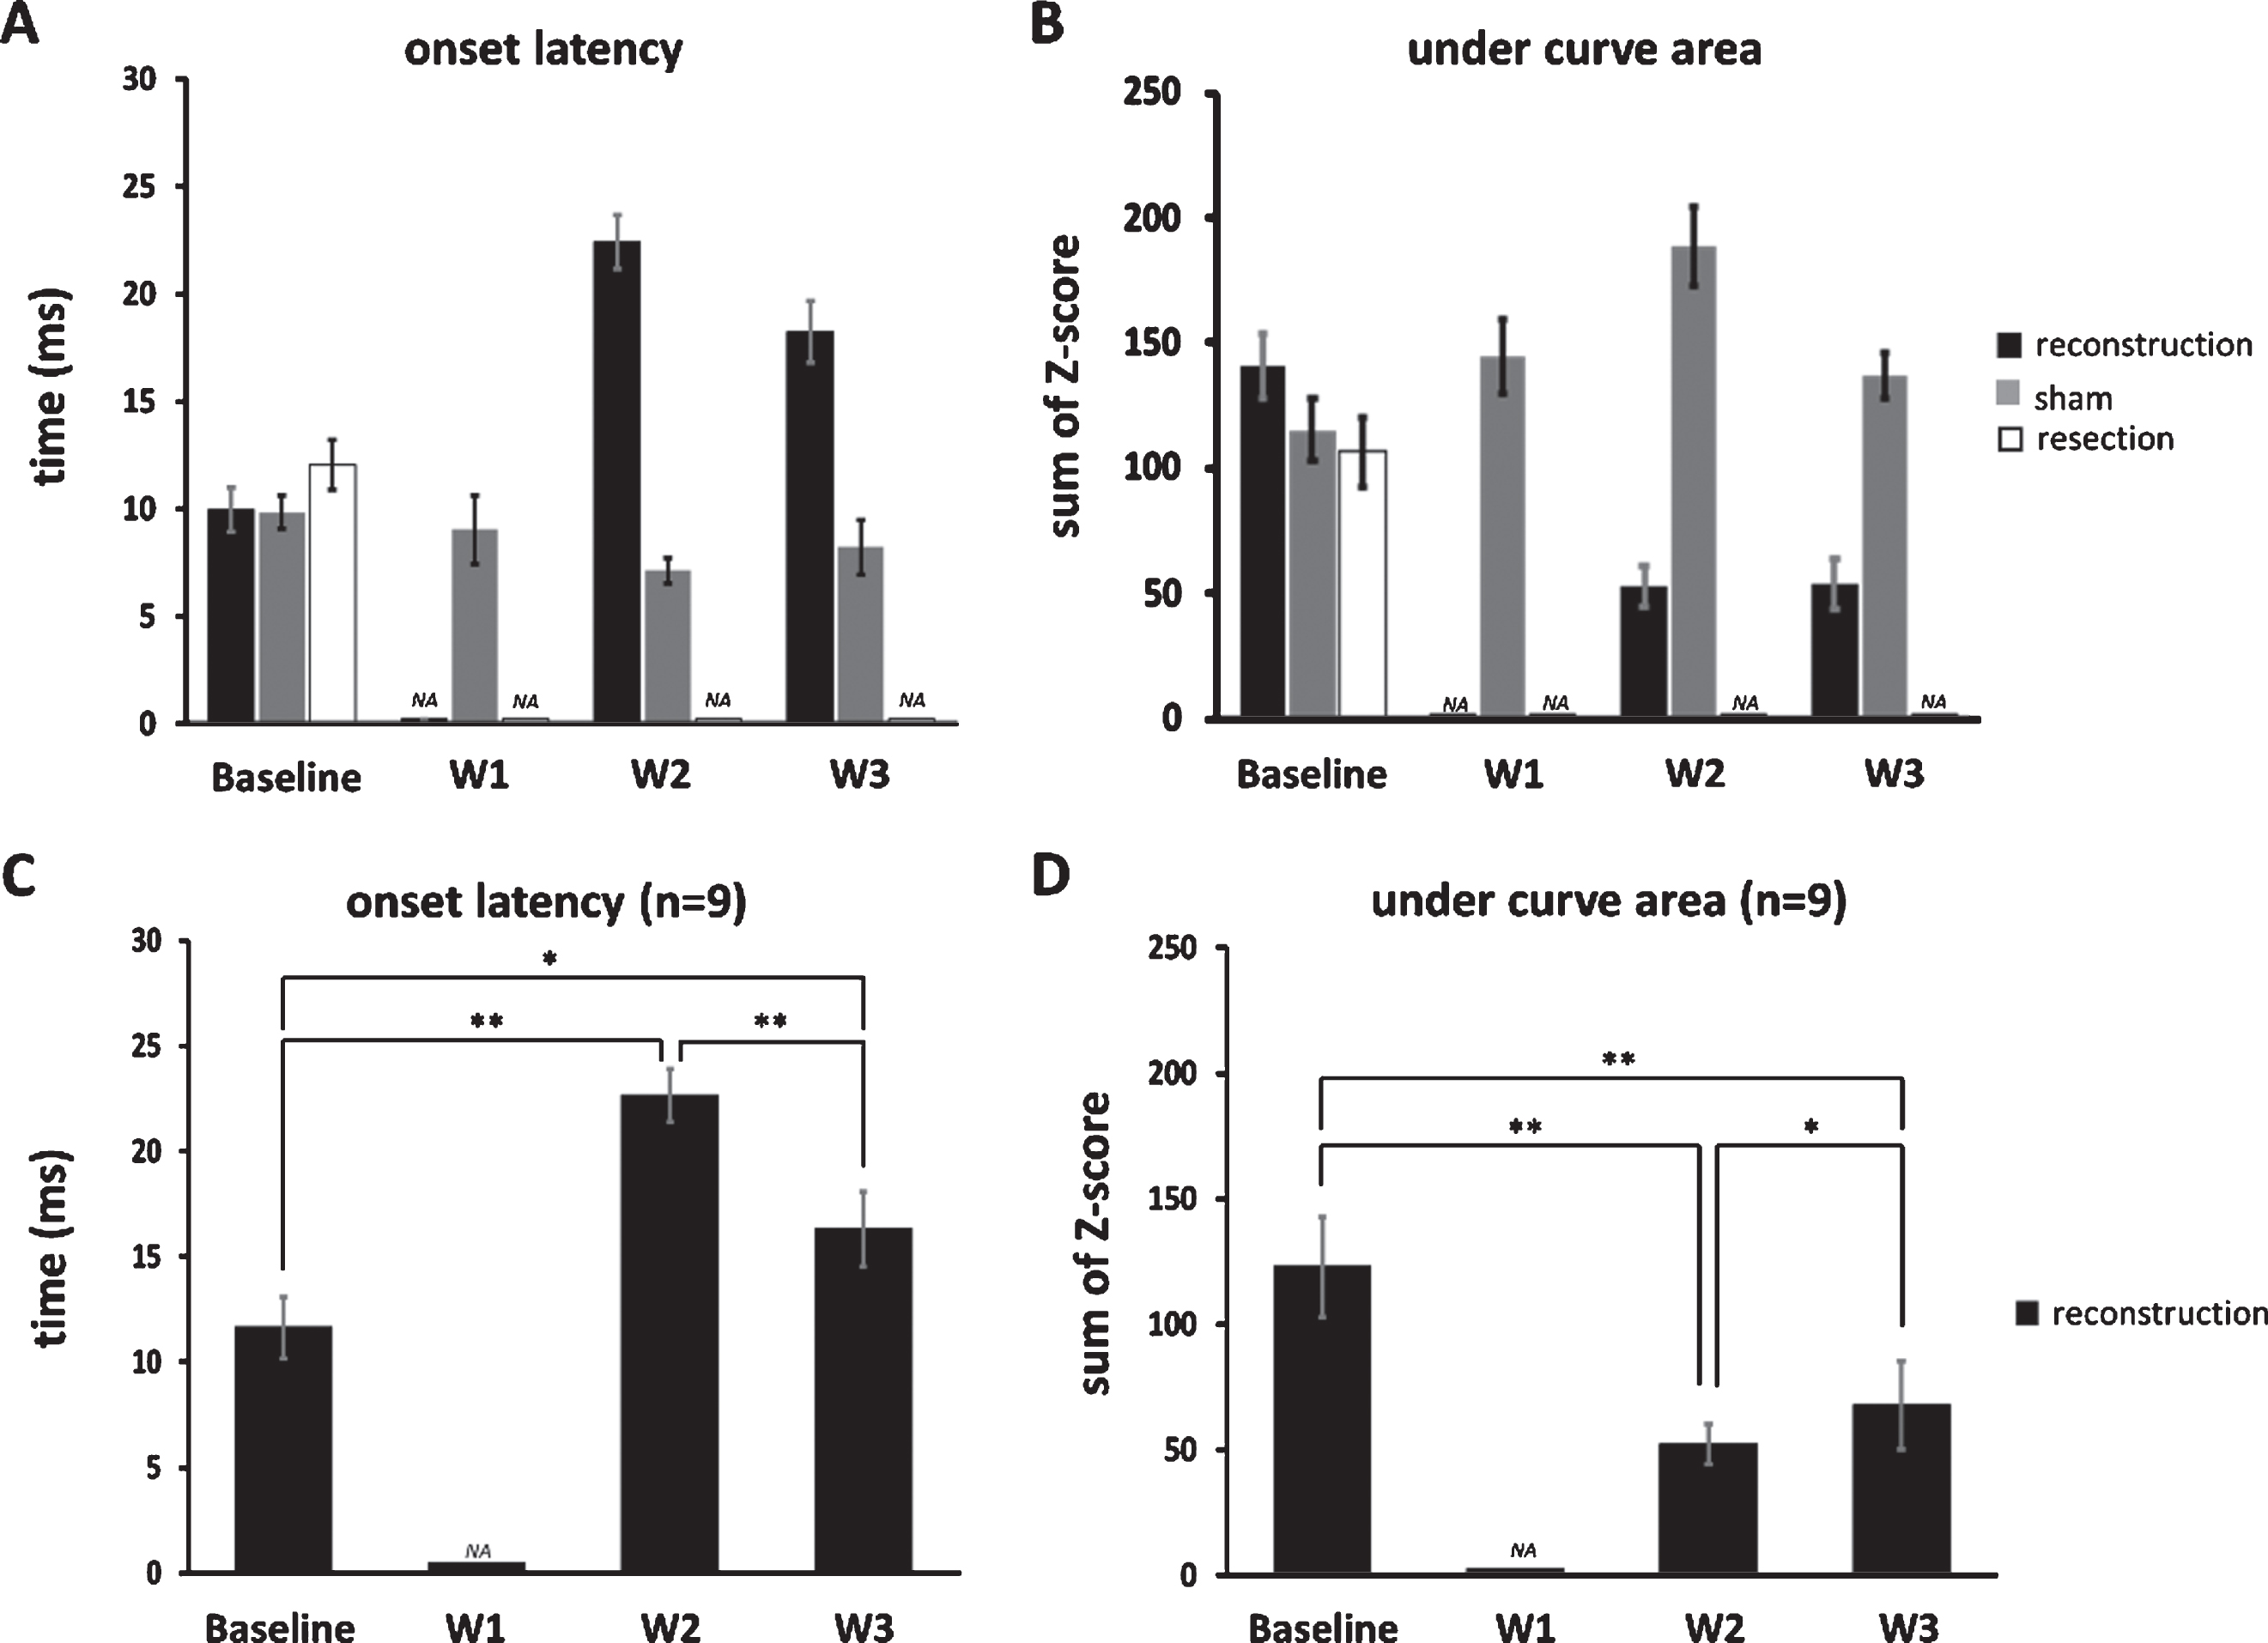
We then specifically analyzed units whose stimulus-driven responses have returned 2 weeks after surgery and found that their onset latency decreased from 2 to 3 weeks after surgery (22.67±1.26 vs. 16.33±1.77 ms, n = 9, p < 0.01, single-sided Wilcoxon singed rank test, Fig. 4C), implying a gradual recovery of myelination at the reconstruction site over time; furthermore, their under curve area increased from 2 to 3 weeks after surgery (52.63±7.88 vs. 68.08±17.67, n = 9, p < 0.05, single-sided Wilcoxon signed rank test, Fig. 4D), indicating a gradual increase neuronal responses along of the course of recovery.
3.2Temporal changes of whisker response map following reconstruction
The next question is whether all the units showed the same change in whisker response map following the recovery of whisker tuning after reconstruction (by comparing baseline and 2-week postsurgical data) and whether the whisker response map changed at follow-up (by comparing the tuning at 2 and 3 weeks postsurgically). The former reflects the effect of aberrant reinnervation as evidenced by a change of the topography of innervation, and the latter reflects its change of time as a result of more reinnervation or neuroplasticity. According to the chronological changes, three patterns were found, the (1) original, (2) shifted and stationary, and (3) shifted and shifting patterns (Fig. 5A-C).
Fig.5
Temporal dynamics of the whisker response map after recovery in the reconstruction group. (A) The neuronal responses (Z-scores) to whisker stimulation in the nine whiskers, including one PW and eight SWs. The gray area denotes time windows for computing the area under the curve. (B) The response map computed from (A), showing the whisker map centering in the PW. (C) Up to three weeks after surgery, three temporal patterns of the dynamics of the response map were found, including the original pattern, shifted and stationary pattern, and shifted and shifting pattern (see text for details). Color bars in (B) and (C) denote Z-scores.
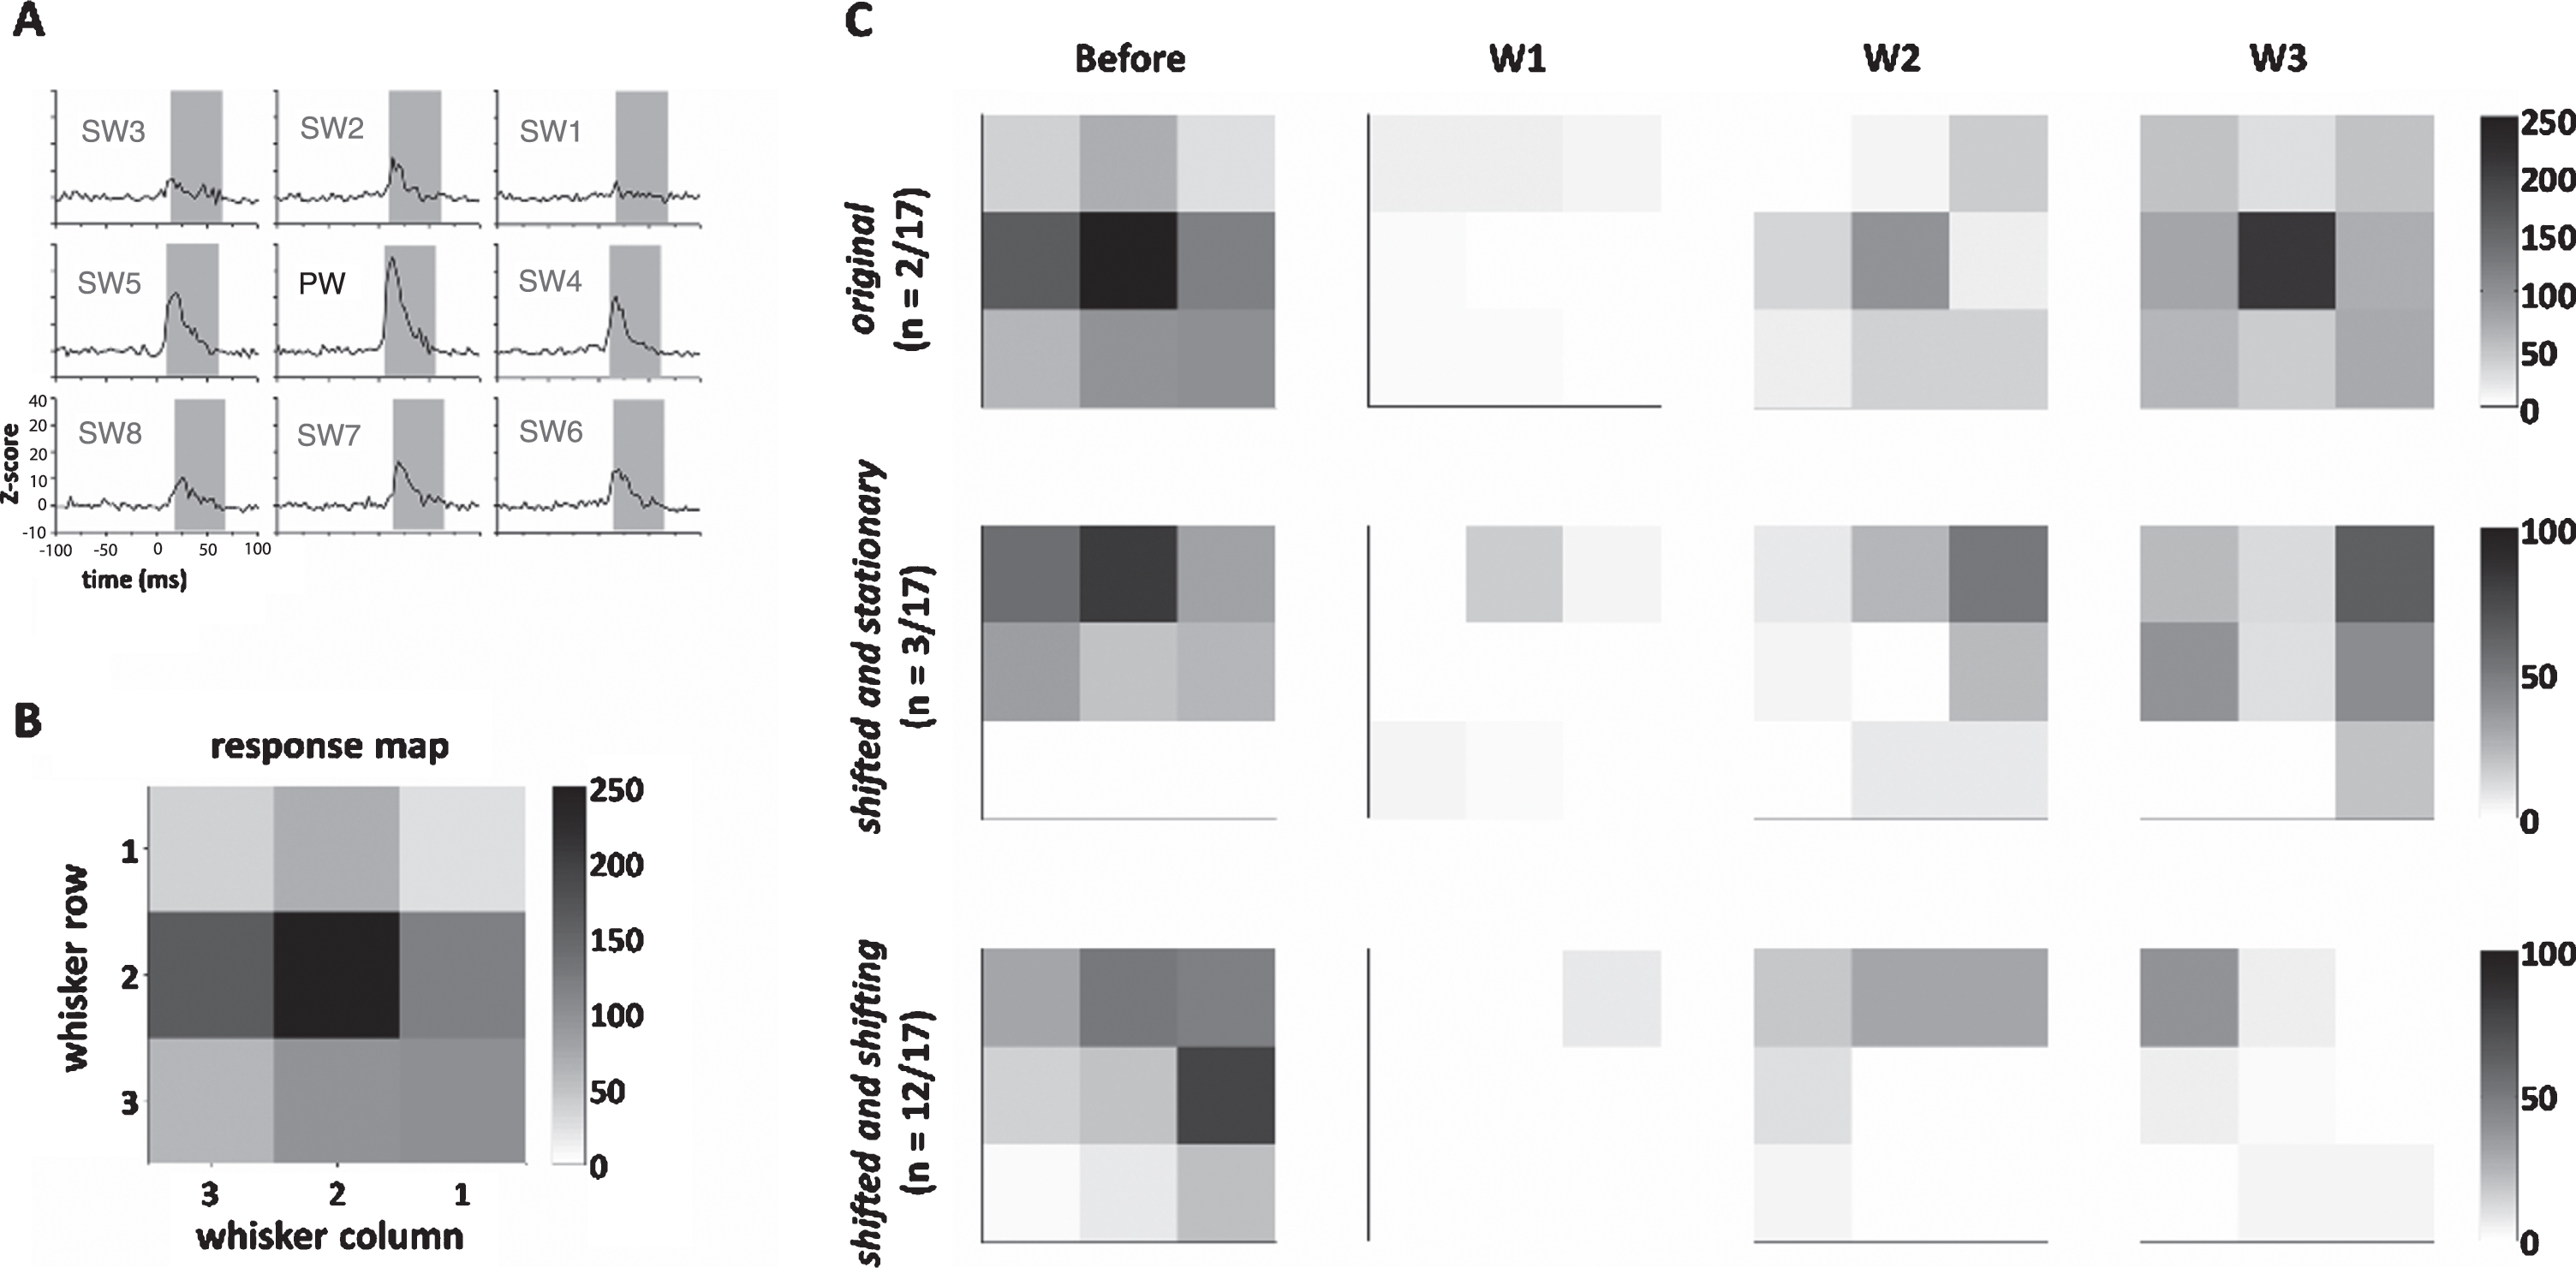
(1) The original pattern (2/17 units, 11.8%) had a 2-week postsurgical map similar to the baseline map, and this map remained stationary with the 3-week map, indicating a perfect recovery 2 weeks postsurgically with minimal aberrant conduction. (2) The constantly shifting pattern (in 3/17 units, 17.7%) had the 2-week map different from the baseline map, and this map remained stationary at 3 weeks postsurgically, indicating a shift of topography caused by aberrant reinnervation. (3) Shifted and shifting patterns (12/17 units, 71.6%) that had a 2-week map different from the baseline map and this map shifted again from 2 weeks to 3 weeks postsurgically, indicating an initial shift of topography caused by aberrant reinnervation and a change of time. On the contrary, units in the sham group showed a stable map across time (Supplementary Table 1).
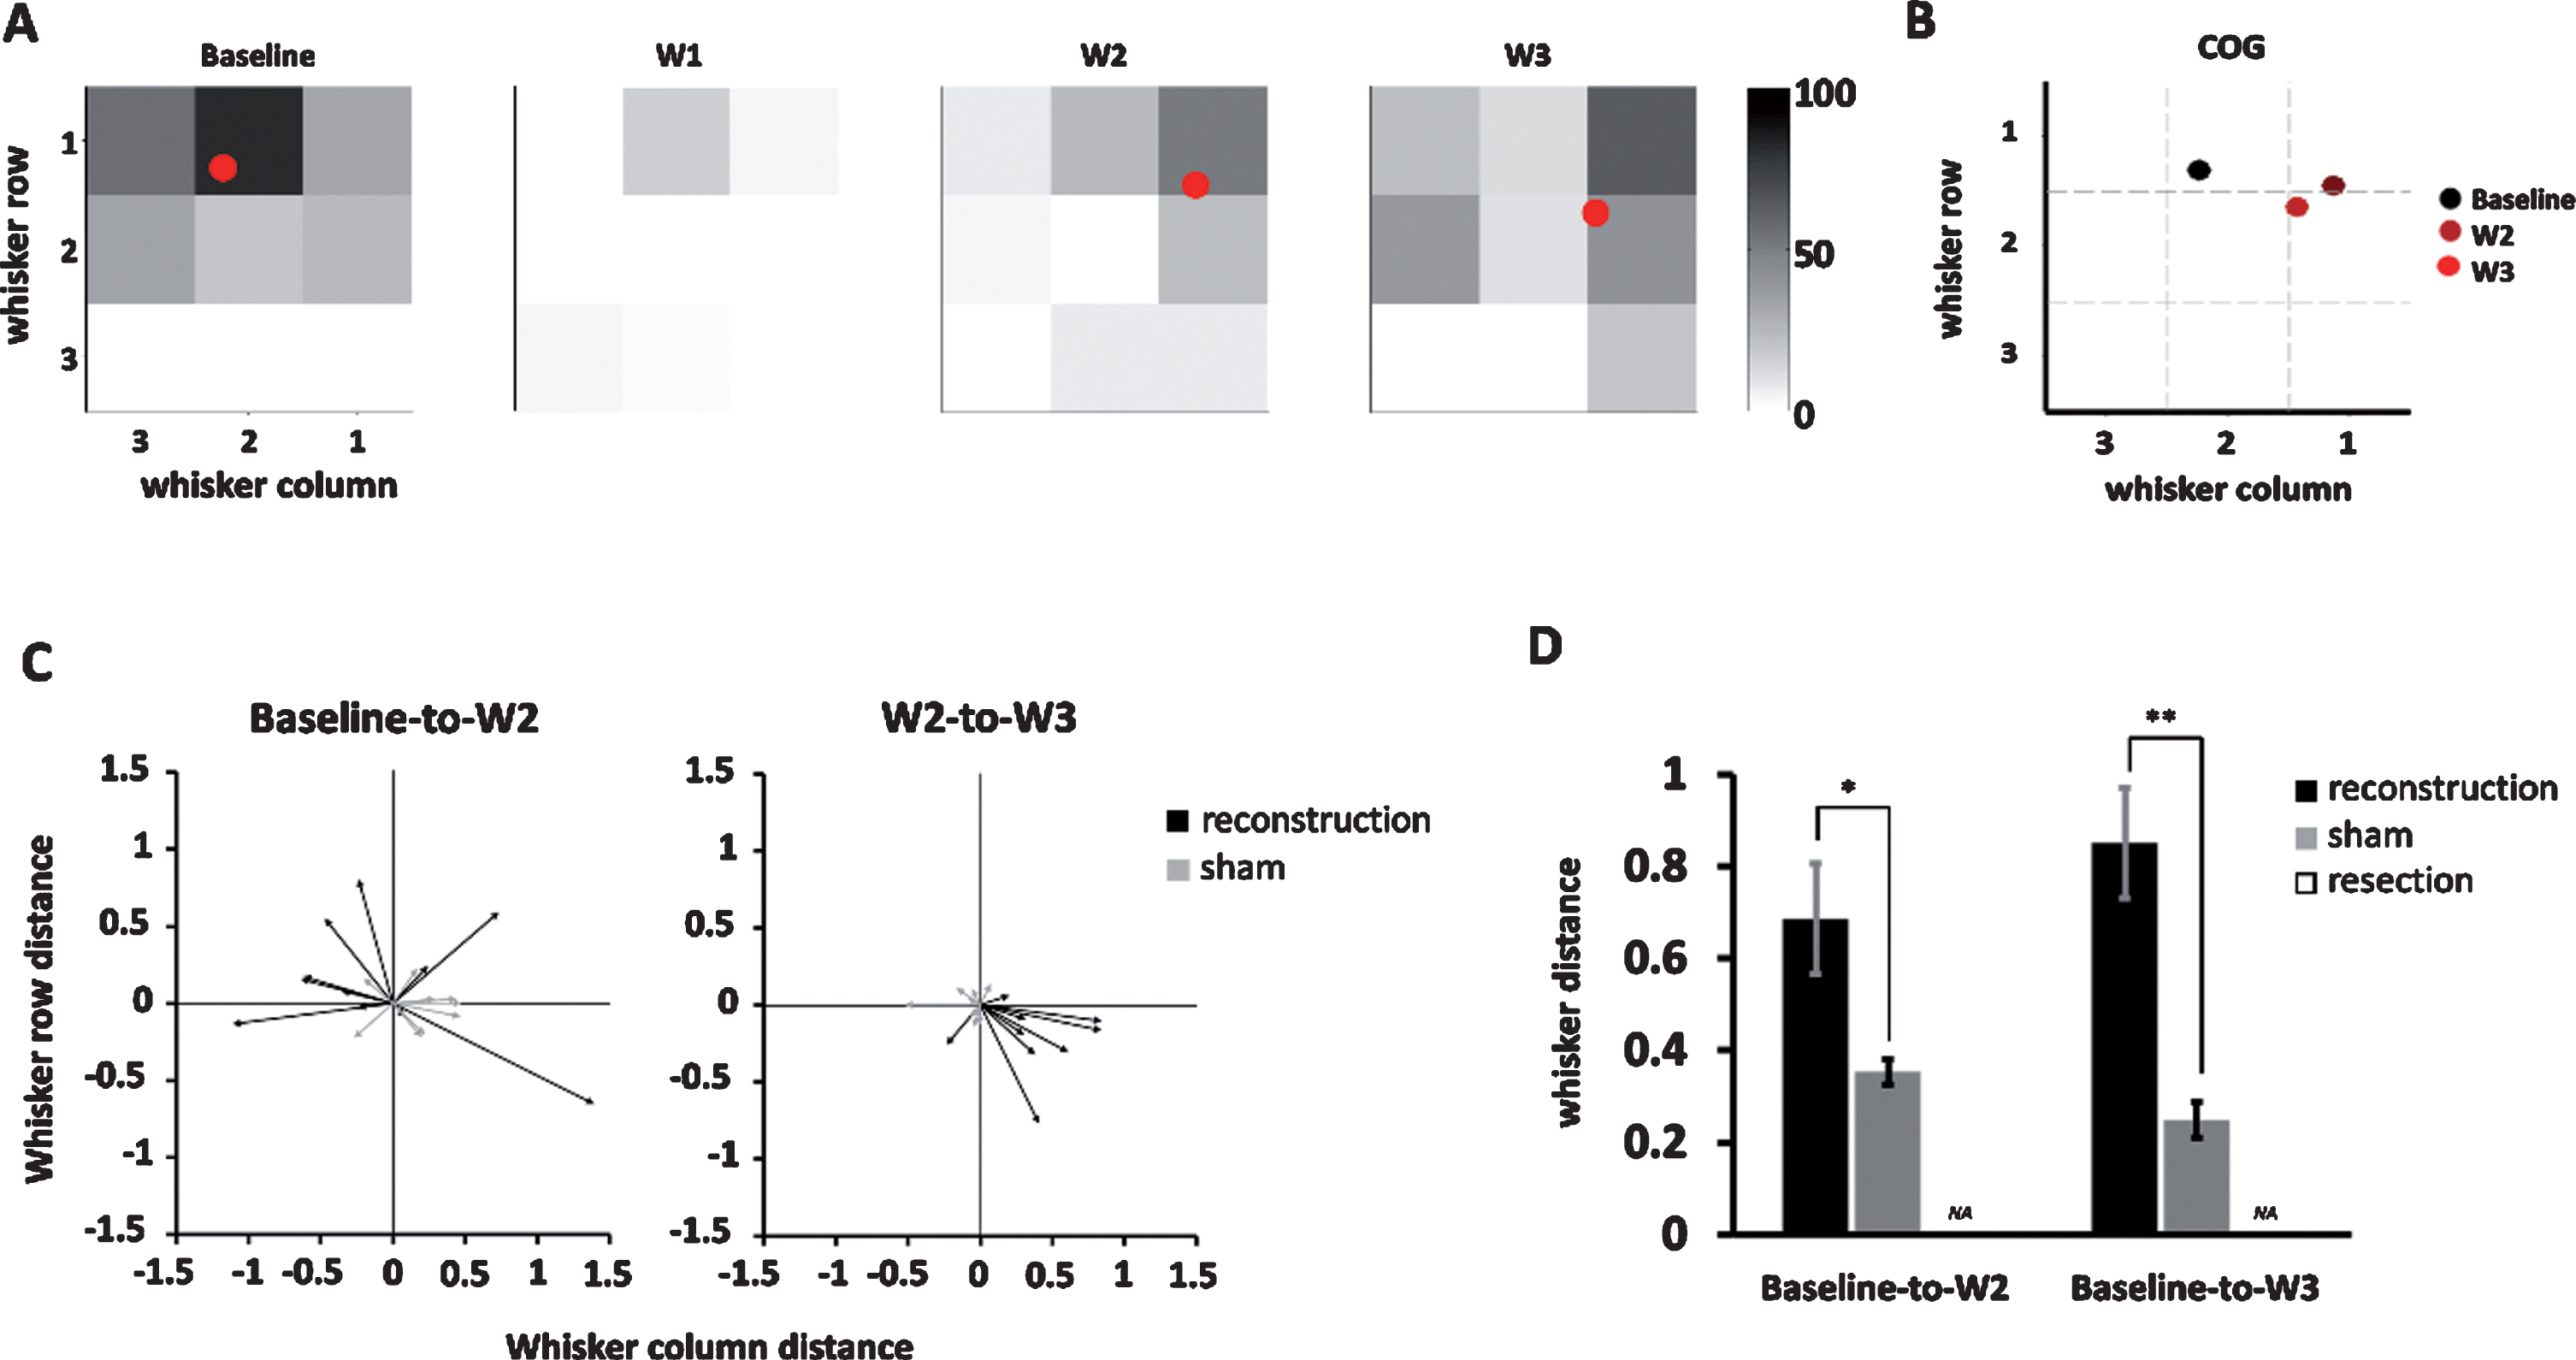
Finally, we quantified the temporal dynamics of whisker response maps by applying COG analysis, in which the COG of the whisker response map of each unit was an averaged whisker position weighted its responses reflected by the area under the curve (see the Methods for details) (Fig. 6A-B). The change in COG, such as in baseline to 2 weeks, baseline to 3 weeks, and 2 to 3 weeks post surgically, were represented as COG shift vector that comprised direction and distance (Fig. 6C). Units in the reconstruction group showed a large baseline to 2-week COG shift and a relatively smaller 2-week to 3-week shift (P = 0.40) while units in the sham group showed relatively small baseline to 2-week and 2-week to 3-week COG shifts. Comparison between the reconstruction and sham groups showed that the distances of COG shifts were longer for both baseline to 2-week (reconstruction group: 0.7±0.1, n = 11; sham group: 0.4±0.03, n = 9, P < 0.05, two-tailed Student t-test) and baseline to 3-week distances (reconstruction group: 0.9±0.1, n = 17; sham group: 0.3±0.04, n = 9, P < 0.01)(Fig. 6D), which supports that reconstruction induced a dramatic shift in COG of the whisker response map, and this shift had not recovered up to 3 weeks postsurgically.
Fig.6
The center of gravity (COG) analysis quantifying the COG shift vector, direction, and distance on the whisker response map over time. (A) The temporal change of COG (red dot) computed from the whisker response map in the example unit in the shifted and stationary groups. The color bar denotes the Z-score value. (B) A summary of the COG shown in (A) showed a dramatic shift of COG from baseline to week 2 and which is stationary in week 3. (C) The COG shift vectors at baseline to week 2 (left) and week 2 to week 3 (right) among units in the reconstruction and sham groups. (D) Comparison between the reconstruction and sham groups showed significantly larger COG distance shift in the reconstruction groups at baseline to week 2 (P < 0.05) and baseline to week 3 (P < 0.01), respectively. Data is presented as mean±SEM; *p < 0.05; **p < 0.01.
4Discussion
As commonly seen in clinical scenario, an injured nerve is reconstructed to allow axonal regrowth through the stump ends to regain conduction. The body part, such as the hand, has motor and sensory functions so that a fruitful functioning needs axonal regrowth of the motor and sensory axons. A major line of inquiry is to understand, following reinnervation, how the brain controls the limbs by spare and disordered axons innervation to the muscles as well as how distorted sensory inputs can be processed in the brain. For motor recovery, several rodent models had been developed to mimic the clinical scenario, such as end-to-end reconnection of facial and hypoglossal nerves. Using this model, manual stimulation of target muscles following the nerve injury has been shown to improve whisking, blink reflexes, and tongue protraction (Angelov et al., 2007; Bischoff et al., 2009; Evgenieva et al., 2008), indicating that rehabilitation facilitates the recovery of innervation by showing a shift toward a more physiological innervation in the endplate.
On the contrary, the mechanisms underlying sensory recovery were to be determined. Xiao et. al. (2016) recently applied reconstruction on the ION in rodents, showing a loss of sensory responses elicited by whisker stimulation after the surgery and a gradual increase of the magnitude of responses in the trigeminal ganglion 3 weeks later (Xiao et al., 2016). However, it remains unclear how the brain processes sparse information at early phase of recovery and the degree of which the tuning properties of sensory neurons has recovered. To this end, the present study induced denervation of both sensory and motor axons innervating the mystacial pad, an approach that is analogous to what occurs in a reconstruction for a mixed nerve in patients (Angelov et al., 2007; Bischoff et al., 2009; Evgenieva et al., 2008).
The present work is the first to report the longitudinal observation of sensory function recovery in the barrel cortex after nerve reconstruction surgery. The critical period of recovery occurs between 1 and 2 weeks postsurgically as units had a recovery of neuronal responses 2 weeks after surgery. During this early phase of sensory recovery, the neuronal responses to sensory stimulation was quite robust although the cortex only received spare inputs from reinnervated fibers and after sustaining two weeks of complete lack of sensory inputs. That is, cortical neurons retain enough of its functionality that it can be readily reactivated when sensory input is restored. The latency decreased and partly improved 3 weeks postsurgically, indicating slower conduction to in reconstructive nerves. Only 11.8% of neurons corresponded to their original map upon initial recovery and were stationary after the initial recovery, suggesting that aberrant reinnervation of the peripheral nerves dramatically alters the labeled line coding of the cortical neurons.
In the present study, we assumed that the returned function mainly resulted from the reinnervation through the lesion site of the infraorbital nerve and did not assume compensation by other nerves. The assumption is based by a lack of anatomical evidence of anastomosis of infraorbital nerve with other nerves. Further studies will explore this issue by concomitant denervation of nearby nerves so that innervation has to be mediated by reinnervation through the lesion site of the infraorbital nerve. A possible mechanism that accounts for the dynamics induced by neuroplasticity observed in this study is an alternation of the ION-Trigeminal ganglion (Tg) pathway. Indeed, misrouting during the nerve regeneration process may destroy the spatial map in the nerve terminating in the follicles of the whisker system and affect the sensory afferent to the central nerve system (Kis et al., 1999; Waite & Cragg, 1982). An in-vitro patch clamp study in ION-crushed postnatal rats showed that 64% of ION function was blocked, and the proportion of silent synapses dramatically increased in the Tg principle nuclei in the 3 days after injury, and this phenomenon was no longer observed at 7 days after injury (Lo, Zhao, & Erzurumlu, 2014). Analogous findings were reported by Xiao et al. (2016) using electro-neurophysiological extracellular single-unit recording in the Tg of adult rats by showing that reconstruction of the ION induced a decrease in response amplitude and prolongation of onset latency (Xiao et al., 2016), which is analogous to our findings. However, they found that neuronal responses recovered 3 weeks after surgery, but we found neurons had already shown responses at 2 weeks after surgery, a discrepancy that could be accounted for by the nerve reconstruction technique. In our study, the rats underwent surgery performed by a certificated plastic surgeon or a training assistant with more than 3 years of expertise.
S1 receives sensory afferents projected from the Tg-thalamic pathway, and the ventral posteromedial nucleus in the thalamus receives converged sensory inputs and then projects them to the barrel cortex. ION transection in rats showed enhanced excitability of neurons in barrel cortex but not those in the thalamus (Világi, Dóczi, Kirilly, Banczerowski-Pelyhe, & Takács, 1999), implying that the neuroplasticity is more robust in the cortex than thalamus. Indeed, a similar result was found for reconstruction of the median nerve in the monkey induced a change in receptive field size in area 3b (Kaas & Florence, 2001). Another study also found that the forelimbs of injured monkeys had a reorganization of receptive fields in the thalamus, and this change further extended to the cortex (Garraghty & Kaas, 1991). Interestingly, forelimb injured monkeys did not show a change of thalamocortical connection, but the lateral connections between the cortical neurons increased in the areas 1 and 3b in S1 (Florence, Taub, & Kaas, 1998).
The present study might reflect the neural substrates of the sensory symptoms experienced in patients received reconstruction surgery. Specifically, no neuronal responses 1 week after surgery is compatible with anesthesia; disorganized whisker tuning observed 2-3 weeks after surgery might induce allodynia and paresthesia at this phase, and delayed latency and decreased neuronal responses to tactile stimulation might cause hypoesthesia. Reorganization of the receptive fields reported in human and non-human primate studies is thought to play a critical role in the neuroplasticity, contributing to functional recovery following peripheral nerve injury (Elbert & Rockstroh, 2004; Kaas, 1999; Merabet & Pascual-Leone, 2010). Another fundamental question is the end point of neuroplasticity, asking whether the dynamic changes come to an end and what the whisker tuning is at the end point of neuroplasticity. In the present study, the chronic recording made it possible to record neuronal activities across weeks, a property allowing us to compare the whisker response maps in units in fixed cortical locations. However, the local inflammation and sclerosis in the brain around the electrode inevitably made single unit recording impossible over time (McConnell et al., 2009; Winslow & Tresco, 2010), so that our analysis depends on multi-unit recording and analysis. The multi-unit analysis is not suitable for measuring the exact spike rate of individual neurons or for measuring the directional tuning to whisker bending. To this end, we are performing another study to apply single unit recording over a prolonged period to make it possible to characterize neuroplasticity. Therefore, a sequential change in neuronal tuning can be observed, yielding important information regarding how sensory function is regained after a nerve reconstruction or after an insult in the peripheral nerve.
5Conclusion
In the present study, we developed a whisker model in rats to evaluate the neuroplasticity after a neurotomy and neurorrhaphy surgery. According to our results, neurons in somatosensory cortex remains robust responses to sensory stimuli even in the early phase of reinnervation. Aberrant reinnervation induced disorganized whisker tuning.
Author Contribution
YCP, YPC, JLC, CHL, CJW, and JJH designed the experiment; YCP, JLC, CHL, and JJH performed the experiment; YCP, YPC, JLC, and JJH analyzed the data; and YCP, YPC, JLC, CHL, CJW, and JJH wrote the manuscript.
Author Disclosure Statement
No competing financial interests exist.
Acknowledgments
The present project was supported by the Ministry of Science and Technology (MOST 104-2811-B-182-031, MOST 104-2314-B-182-050, MOST 105-2314-B-182-001) and Chang Gung Medical Foundation Grant (CMRPG5C0071-3 for consumable and instrumentation, and CMRPG5H0051-4 and CMRPG3C0461-4 for personnel support)
Supplementary material
[1] The supplementary material is available in the electronic version of this article: http://dx.doi.org/10.3233/RNN-190914.
References
1 | Andermann, M.L , Ritt, J , Neimark, M.A , & Moore, C.I. ((2004) ). Neural correlates of vibrissa resonance: Band-pass and somatotopic representation of high-frequency stimuli. Neuron 42: (3), 451–463. |
2 | Angelov, D.N , Ceynowa, M , Guntinas-Lichius, O , Streppel, M , Grosheva, M , Kiryakova, S.I , … & Dunlop S.A. ((2007) ). Mechanical stimulation of paralyzed vibrissal muscles following facial nerve injury in adult rat promotes full recovery of whisking. Neurobiology of Disease, 26: (1), 229–242. |
3 | Bischoff, A , Grosheva, M , Irintchev, A , Skouras, E , Kaidoglou, K , Michael, J , … & Angelov D.N. ((2009) ). Manual stimulation of the orbicularis oculi muscle improves eyelid closure after facial nerve injury in adult rats. Muscle & Nerve: Official Journal of the American Association of Electrodiagnostic Medicine, 39: (2), 197–205. |
4 | Carvell, G.E , & Simons, D.J. ((1990) ). Biometric analyses of vibrissal tactile discrimination in the rat. Journal of Neuroscience, 10: (8), 2638–2648. |
5 | Elbert, T , & Rockstroh, B. ((2004) ). Reorganization of human cerebral cortex: The range of changes following use and injury. The Neuroscientist, 10: (2), 129–141. |
6 | Erzurumlu, R.S , Murakami, Y , & Rijli, F.M. ((2010) ). Mapping the face in the somatosensory brainstem. Nature Reviews Neuroscience, 11: (4), 252. |
7 | Evgenieva, E , Schweigert, P , Guntinas-Lichius, O , Pavlov, S , Grosheva, M , Angelova, S , … & Angelov D.N. ((2008) ). Manual stimulation of the suprahyoid-sublingual region diminishes polynnervation of the motor endplates and improves recovery of function after hypoglossal nerve injury in rats. Neurorehabilitation and Neural Repair, 22: (6), 754–768. |
8 | Fanselow, E.E , & Nicolelis, M.A. ((1999) ). Behavioral modulation of tactile responses in the rat somatosensory system. Journal of Neuroscience, 19: (17), 7603–7616. |
9 | Florence, S.L , Taub, H.B , & Kaas, J.H. ((1998) ). Large-scale sprouting of cortical connections after peripheral injury in adult macaque monkeys. Science, 282: (5391), 1117–1121. |
10 | Garraghty, P.E , & Kaas, J.H. ((1991) ). Functional reorganization in adult monkey thalamus after peripheral nerve injury. Neuroreport, 2: (12), 747–750. |
11 | González-García, E , Landín-Jarillo, L , & Piqueras-Del, A.R. ((2007) ). Functional recovery in hemifacial transplants in rats. Revista de Neurologia, 45: (7), 389–392. |
12 | Kaas, J.H. ((1999) ). Is most of neural plasticity in the thalamus cortical? Proceedings of the National Academy of Sciences, 96: (14), 7622–7623. |
13 | Kaas, J.H. , & Florence, S.L. ((2001) ). Reorganization of sensory and motor systems in adult mammals after injury. In: Kaas, J. H. (Ed.), The Mutable Brain: Dynamic and Plastic Features of the Developing and Mature Brain (pp. 165–242). London: Harwood Academic Publishers. |
14 | Kis, Z , Farkas, T , Rábl, K , Kis, E , Kóródi, K , Simon, L , … & Toldi J. ((1999) ). Comparative study of the neuronal plasticity along the neuraxis of the vibrissal sensory system of adult rat following unilateral infraorbital nerve damage and subsequent regeneration. Experimental Brain Research, 126: (2), 259–269. |
15 | Kwegyir-Afful, E.E , Bruno, R.M , Simons, D.J , & Keller, A. ((2005) ). The role of thalamic inputs in surround receptive fields of barrel neurons. Journal of Neuroscience, 25: (25), 5926–5934. |
16 | Landin, L , Cavadas, P.C , Gonzalez, E , Caballero-Hidalgo, A , & Rodriguez-Perez, J.C. ((2009) ). Sensorimotor recovery after partial facial (mystacial pad) transplantation in rats. Annals of Plastic Surgery, 63: (4), 428–435. |
17 | Landin, L , Cavadas, P.C , Gonzalez, E , Rodriguez, J.C , & Caballero, A. ((2008) ). Functional outcome after facial allograft transplantation in rats. Journal of Plastic, Reconstructive & Aesthetic Surgery, 61: (9), 1034–1043. |
18 | Lo, F.S , Zhao, S , & Erzurumlu, R.S. ((2014) ). Neonatal infraorbital nerve crush-induced CNS synaptic plasticity and functional recovery. Journal of Neurophysiology, 111: (8), 1590–1600. |
19 | McConnell, G.C , Rees, H.D , Levey, A.I , Gutekunst, C.A , Gross, R.E , & Bellamkonda, R.V. ((2009) ). Implanted neural electrodes cause chronic, local inflammation that is correlated with local neurodegeneration. Journal of Neural Engineering, 6: (5), 056003. |
20 | Merabet, L.B , & Pascual-Leone, A. ((2010) ). Neural reorganization following sensory loss: The opportunity of change. Nature Reviews Neuroscience, 11: (1), 44. |
21 | Pavlov, S.P , Grosheva, M , Streppel, M , Guntinas-Lichius, O , Irintchev, A , Skouras, E , … & Angelov D.N. ((2008) ). Manually-stimulated recovery of motor function after facial nerve injury requires intact sensory input. Experimental Neurology, 211: (1), 292–300. |
22 | Peeva, G.P , Angelova, S.K , Guntinas-Lichius, O , Streppel, M , Irintchev, A , Schütz, U , … & Angelov D.N. ((2006) ). Improved outcome of facial nerve repair in rats is associated with enhanced regenerative response of motoneurons and augmented neocortical plasticity. European Journal of Neuroscience, 24: (8), 2152–2162. |
23 | Pomahac, B , Pribaz, J , Eriksson, E , Annino, D , Caterson, S , Sampson, C , … & Tullius S. ((2011) ). Restoration of facial form and function after severe disfigurement from burn injury by a composite facial allograft. American Journal of Transplantation, 11: (2), 386–393. |
24 | Salminger, S , Roche, A.D , Sturma, A , Mayer, J.A , & Aszmann, O.C. ((2016) ). Hand transplantation versus hand prosthetics: Pros and cons. Current Surgery Reports, 4: (2), 8. |
25 | Skouras, E , Pavlov, S , Bendella, H , & Angelov, D.N. ((2012) ). Stimulation of trigeminal afferents improves motor recovery after facial nerve injury: Functional, electrophysiological and morphological proofs (Vol. 213): Springer Science & Business Media. |
26 | Világi, I , Dóczi, J , Kirilly, D , Banczerowski-Pelyhe, I , & Takács, J. ((1999) ). An in vitro electrophysiological and Co 2+-uptake study on the effect of infraorbital nerve transection on the cortical and thalamic neuronal activity. Brain Research, 844: (1), 118–125. |
27 | Waite, P.M.E , & Cragg, B.G. ((1982) ). The peripheral and central changes resulting from cutting or crushing the afferent nerve supply to the whiskers. Proceedings of the Royal Society of Series B. Biological Sciences, 214: (1195), 191–211 London. |
28 | Washington, K.M , Solari, M.G , Sacks, J.M , Horibe, E.K , Unadkat, J.V , Carvell, G.E , … & Lee W.A. ((2009) ). A model for functional recovery and cortical reintegration after hemifacial composite tissue allotransplantation. Plastic and Reconstructive Surgery, 123: (2 Suppl), 26S. |
29 | Winslow, B.D , & Tresco, P.A. ((2010) ). Quantitative analysis of the tissue response to chronically implanted microwire electrodes in rat cortex. Biomaterials, 31: (7), 1558–1567. |
30 | Xiao, B , Zanoun, R.R , Carvell, G.E , Simons, D.J , & Washington, K.M. ((2016) ). Response properties of whisker-associated primary afferent neurons following infraorbital nerve transection with microsurgical repair in adult rats. Journal of Neurophysiology, 115: (3), 1458–1467. |
31 | Zor, F , Bozkurt, M , Nair, D , & Siemionow, M. ((2010) ). A new composite midface allotransplantation model with sensory and motor reinnervation. Transplant International, 23: (6), 649–656. |


