
The association between brain activity and motor imagery during motor illusion induction by vibratory stimulation
Abstract
Background:
The association between motor imagery ability and brain neural activity that leads to the manifestation of a motor illusion remains unclear.
Objective:
In this study, we examined the association between the ability to generate motor imagery and brain neural activity leading to the induction of a motor illusion by vibratory stimulation.
Methods:
The sample consisted of 20 healthy individuals who did not have movement or sensory disorders. We measured the time between the starting and ending points of a motor illusion (the time to illusion induction, TII) and performed electroencephalography (EEG). We conducted a temporo-spatial analysis on brain activity leading to the induction of motor illusions using the EEG microstate segmentation method. Additionally, we assessed the ability to generate motor imagery using the Japanese version of the Movement Imagery Questionnaire-Revised (JMIQ-R) prior to performing the task and examined the associations among brain neural activity levels as identified by microstate segmentation method, TII, and the JMIQ-R scores.
Results:
The results showed four typical microstates during TII and significantly higher neural activity in the ventrolateral prefrontal cortex, primary sensorimotor area, supplementary motor area (SMA), and inferior parietal lobule (IPL). Moreover, there were significant negative correlations between the neural activity of the primary motor cortex (MI), SMA, IPL, and TII, and a significant positive correlation between the neural activity of the SMA and the JMIQ-R scores.
Conclusion:
These findings suggest the possibility that a neural network primarily comprised of the neural activity of SMA and M1, which are involved in generating motor imagery, may be the neural basis for inducing motor illusions. This may aid in creating a new approach to neurorehabilitation that enables a more robust reorganization of the neural base for patients with brain dysfunction with a motor function disorder.
1Introduction
In recent years, one approach in neurorehabilitation has drawn attention. It utilizes motor imagery (Dickstein & Deutsch, 2007; Hanakawa, 2016; Rabadi, 2011) and vibratory stimulation (Conrad, Scheidt, & Schmit, 2011; Huh et al., 2016; Liepert & Binder, 2010) as facilitatory stimuli for kinesthetic reacquisition. It has been suggested that it is effective to utilize sensorimotor-information-induced motor illusions (Goodwin, Mccloskey, & Matthews, 1972) created by vibratory stimulation for motion control and proficiency. In particular, motor illusion in the limbs is considerably useful for motor learning and reorganization of the motor control system (Ghez & Sainburg, 1995). A motor illusion is an illusion generated in the brain by applying vibratory stimulation over the skin to the muscle tendons. It provides the sensation of the limbs moving without performing voluntary movements and is created by a vibratory stimulus activating the Ia afferent sensory fibers (Burke, Hagbarth, Löfstedt, & Wallin, 1976; Hagura et al., 2007; Roll, Vedel, & Ribot, 1989) and II afferent sensory fibers (Bove, Nardone, & Schieppati, 2003) via the muscle spindles.
Previous studies on the influence of motor illusions on brain function have elucidated the involvement of areas of brain neural activity using various brain function imaging techniques. Casini et al. (2006) used magnetoencephalography (MEG) and reported that the primary sensorimotor area (MI-SI), which includes the primary motor cortex (MI) and primary somatosensory cortex (SI), somatosensory association cortex, supplementary motor area (SMA), and others are active during motor illusion induction by vibratory stimulation. Moreover, Naito, Ehrsson, Geyer, Zilles, and Roland. (1999) investigated the brain areas that were active while participants were experiencing a motor illusion using fMRI, and reported the involvement of the MI. Naito et al. (1999) reported that there are cells in the MI that send excitatory signals to contract the vibrated muscles via spinal motor neurons. Furthermore, they also indicated that some percentage of these cells receive afferent sensory signals, which result from the stretching of antagonist muscles. They proposed that the cells of the target muscles in the MI receive sensory signals both from the muscle spindles in the stimulated muscles and from the antagonist muscles, and thus these signals are related to the kinesthetic illusion by increasing the excitability of those cells. Furthermore, Ehrsson et al. (2000) reported that, when a motor illusion was induced in the direction of extension by applying vibratory stimulation to the wrist flexor tendons and the participants were asked to perform motor imagery in the same direction as the motion, the motor illusion was enhanced, thereby increasing its maximum angle; in contrast, the motor illusion was inhibited when they were asked to perform motor imagery in the direction of flexion. These results suggest that there is interaction between motor illusions and motor imagery. It is, therefore, believed that there is an overlap between the body schema in motor imagery and the body schema in motor illusions (Naito et al., 2002), and it is assumed that common areas in the brain are used for processing both. However, the association between the processes that take place in the brain when motor imagery and motor illusions are induced remains unclear. Daprati, Sirigu, and Nico. (2010) stated that motor imagery begins consciously or voluntarily in the brain in the same manner as motor execution, and defined it as the simulation of the motor commands that initiate motor execution. In contrast, it has been reported that a motor illusion holds no intention of motion in itself and that it is induced by the generation of latent motor commands, which are generated as if those movements were being executed as a result of the motor-related areas processing afferent kinesthetic information (Amemiya & Naito, 2016). Because of these processing differences, the association between the brain neural activity that leads to the manifestation of a motor illusion in the brain induced by exogenous stimuli (bottom-up processing) and the motor imagery ability endogenously generated (top-down processing) remains unclear. It has been suggested that if there is an association between the ability to imagine a movement and the brain neural activity that induces motor illusions, a more vivid physical movement schema or sense of agency may be established in the brain by providing motor imagery intentionally and synchronously during the motor illusion induction process (Kodama & Nakano, 2017).
Therefore, in this study, we examined the brain activity leading to the induction of motor illusions caused by vibratory stimulation using electroencephalography (EEG). We performed microstate segmentation method (Lehmann, Wackermann, Michel, & Koenig, 1993), which is used to identify the microstate of brain function via standardized low-resolution brain electromagnetic tomography (sLORETA) (Pascual-Marqui, Michel, & Lehmann, 1994; Pascua-Marqui, 2002), which is a three-dimensional imaging display method for neural activity in the brain. The purpose was to examine the association between neural activity in the areas active during motor illusion induction and the ability to generate motor imagery. If a relation is established, it may aid in creating a new approach to neurorehabilitation that enables a more robust reorganization of the neural base for patients with brain dysfunction with a motor function disorder by applying an approach that combines the bottom-up process induced by motor illusions and the top-down process induced by motor imagery.
2Participants and method
The participants were recruited by advertisements and comprised 20 healthy men with no movement or sensory disorders. Prior to measurement, we conducted a medical interview and physical evaluations (e.g., sensory testing), and we confirmed that all participants were free from orthopedic diseases, neurological diseases, movement disorders, and sensory disorders. Moreover, all participants had not previously experienced a motor illusion induced by vibratory stimulation. We confirmed that the dominant hand was the right hand in all participants based on the Edinburgh Inventory (Oldfield, 1971). In accordance with the Declaration of Helsinki, we explained, in writing and orally, the details of the study, and obtained the participants’ signatures of consent in writing. This study was approved by the Ethics Committee of Kyoto Tachibana University.
2.1Measurement task conditions
The participant was seated in a chair in a room designed for EEG experiments and wore earplugs. The lights in the room were turned off during EEG signal acquisition. The participants were instructed to abstain from consuming coffee, alcohol, or tobacco from the night before the measurement. A relaxing resting state was created, in which the subject placed the plantar surface of the lower limbs on the floor, and the forearm of the left upper limb (the upper limb which was not measured) on an armrest while assuming a reclined seated position. This was performed since application of vibratory stimulation to the tendons of unrelaxed limbs readily leads to a tonic vibration reflex (Conrad et al., 2011) constituting the induction of a motor illusion less likely to happen. Three task conditions of (1) vibratory stimulation, (2) sensory stimulation, and (3) button pressing were set, and brain neural activity was captured by EEG.
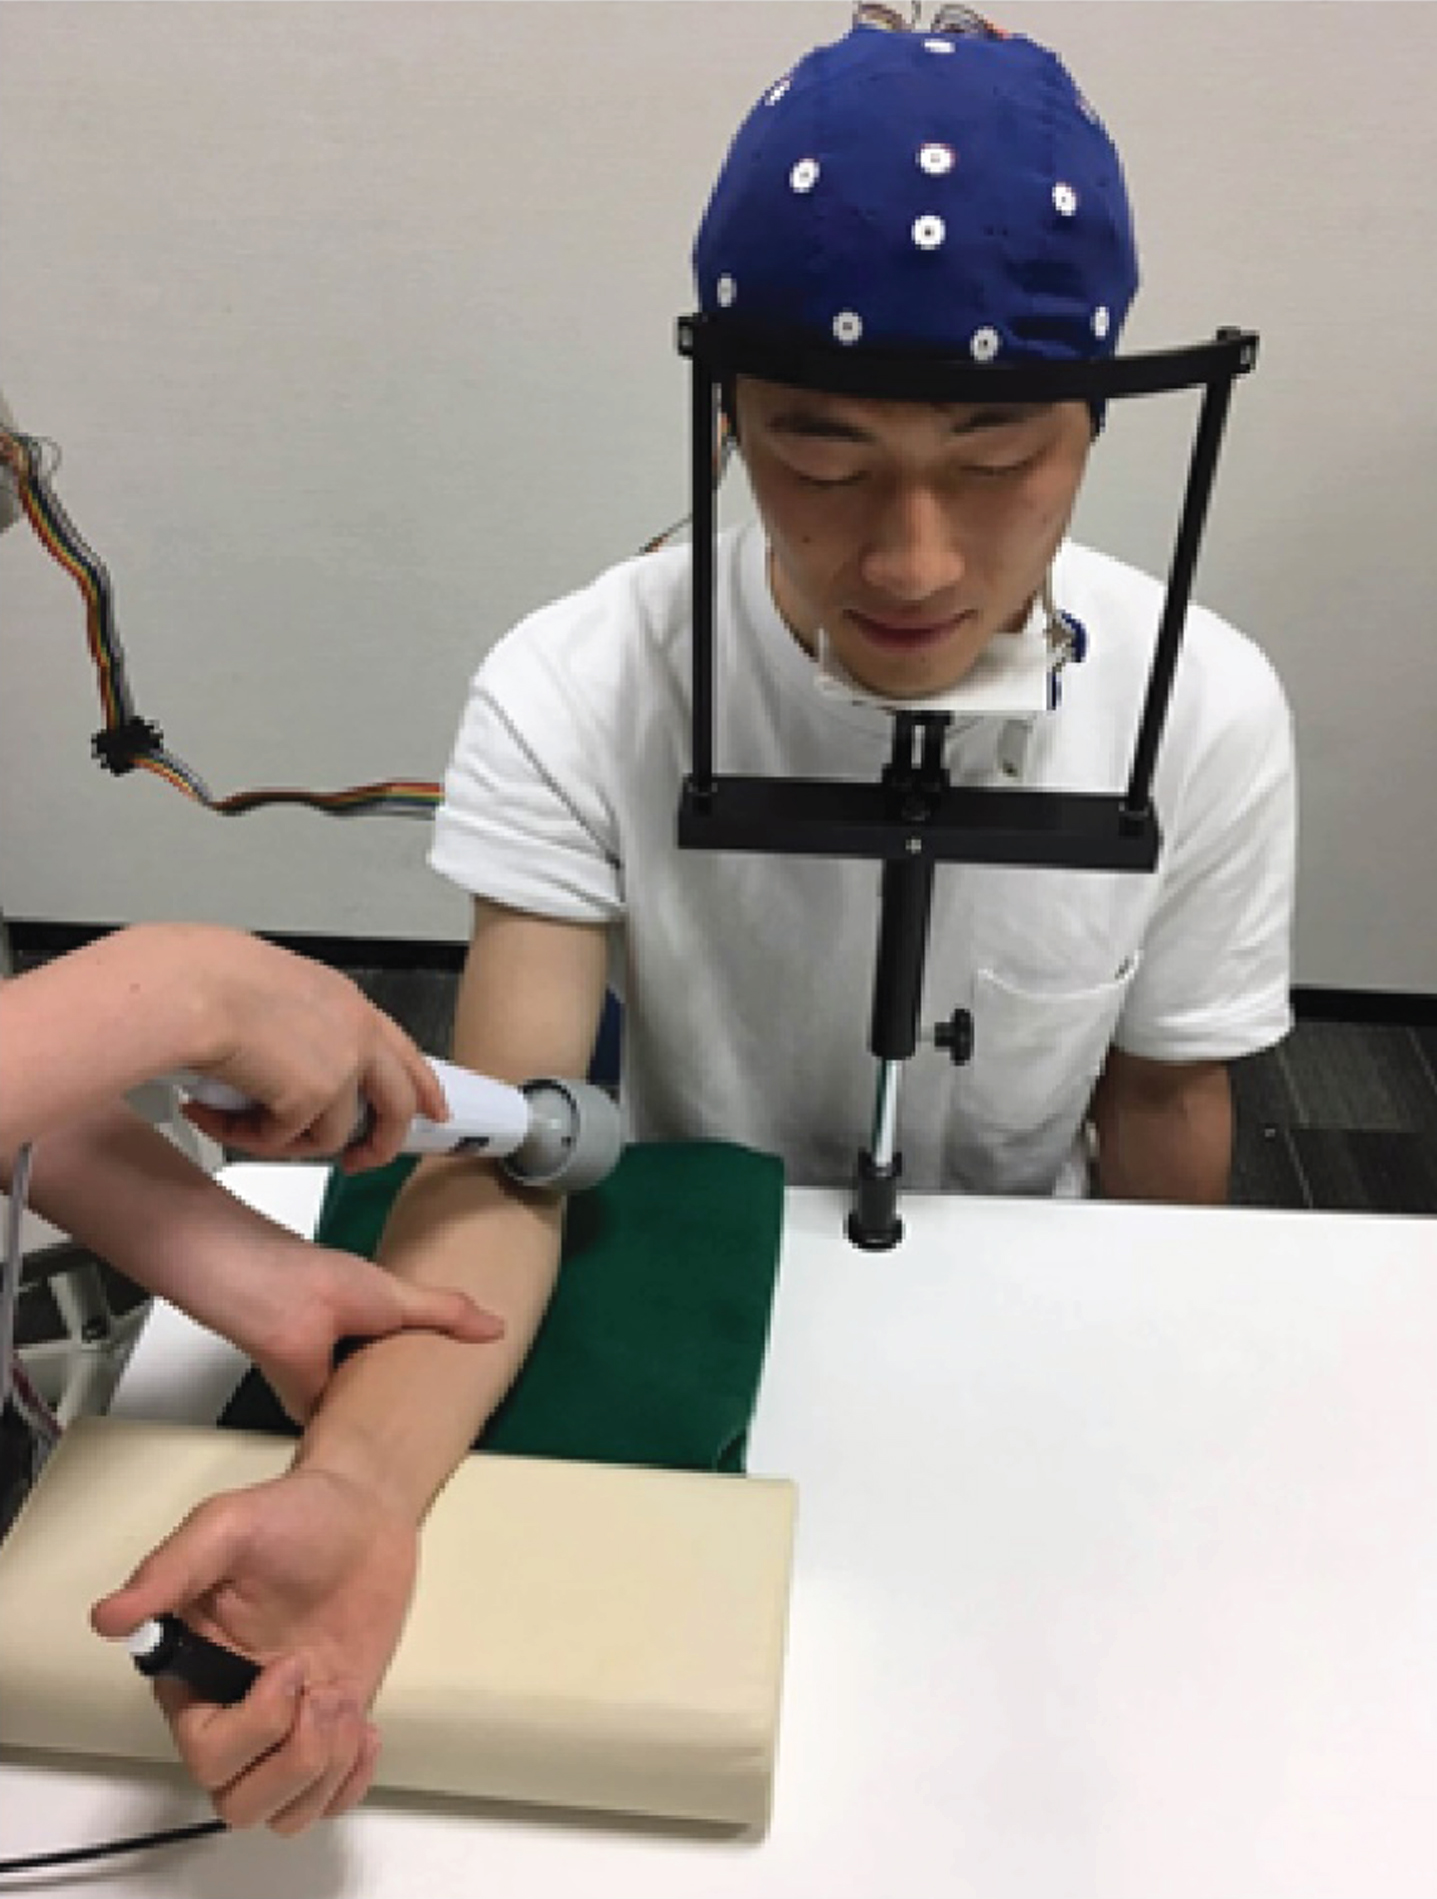
(1) Vibratory stimulation condition (hereinafter VS): A hand massager for home use (THRIVE MD-01, Thrive Co., Ltd., Osaka, Japan) was used for vibratory stimulation. The extension of the right elbow joint was chosen as the target movement to generate the illusion of motion. We, therefore, applied vibration (the direction of vibration was horizontal and the pressure was 6 N) to the right brachial biceps tendon in a state of bending the elbow joint 30°. With respect to the vibratory stimulation frequency, although the device used could apply stimulation at 91.7 Hz and 108.3 Hz, we used 91.7 Hz as previous studies have suggested that motor illusions are more readily generated at frequencies of 70 to 100 Hz (Liepert & Binder, 2010; Burke et al., 1976; Naito et al., 1999; Roll & Vedel, 1982). When applying stimulation, the measurer tightly grasped the forearm at the position of elbow flexion of 30° and inhibited joint movement to prevent flexion of the elbow joint caused by muscle contraction of the right biceps brachii. Furthermore, the participants were asked to keep their eyes closed during the application of the vibratory stimuli, as the visual perception of an upper limb that is actually not moving leads to a diminished motor illusion (Hagura et al., 2007). Stimulation was applied a total of 10 times. The time range for one stimulus was set at 10 s as previous studies have reported that a motor illusion of the flexing movement of the elbow joint appeared between 1.2 s and 8.2 s in healthy participants (Cordo, Gurfinkel, Brumagne, & Flores-Vieira, 2005). Within the time range, vibratory stimulation was applied to the tendon of the right biceps brachii (starting point) and the participants were asked to press the button when a motor illusion was induced (ending point) (Fig. 1). In order to allow sufficient time to pass between stimuli and to prevent the aftereffects of a motor illusion, the interval between each stimulus was set at 2 min.
(2) Sensory stimulation conditions (hereinafter SS): A control condition was set for when sensory stimulation alone was applied, as cutaneous stimulation receptors such as the Meissner and Pacinian receptors are also ordinarily stimulated by epidermal stimulation of the tendons when applying vibratory stimulation (Naito et al., 2007). Under this condition, as in the VS, the measurer grasped the forearm at the position of elbow flexion of 30° and vibration was applied to the skin on the medial side of the area of the muscle-tendon transition of the right biceps brachii using the same device and at the same frequency that was used for the VS (Naito et al., 2016).
(3) Button pressing condition (hereinafter BP): Because the activity associated with the button pressing movement was contained in the TII of the VS, in addition to the brain neural activity associated with the induction of motor illusions, it was set as a control condition. Under this condition, the measurer grasped the forearm at the position of elbow flexion of 30°, the button was pressed 10 times. The interval between each button pressing was set at 2 min, both in the VS and SS.
Fig.1
The conditions of an experiment. Vibratory stimulation was applied to the tendon of the right biceps brachii and the participants were asked to press the button when a motor illusion was induced.
For each execution condition, each subject underwent three repetitions of VS, SS, and BP. The first measurement was performed in the order of (1) VS, (2) BP, and (3) SS to avoid (1) vibratory stimulation and (3) sensory stimulation from being applied consecutively, as vibration generated by the device was applied to the subject in both conditions, and each condition was spaced at a sufficient interval. The order of VS and SS was reversed for each subject.
2.2Electroencephalography measurement
Neurofax, manufactured by Nihon Koden Co., Ltd. (Tokyo, Japan), was used for EEG recording. Based on the International 10–20 system, recording electrodes were placed on 18 sites: F3, F4, F7, F8, Fz, C3, C4, Cz, P3, P4, Pz, O1, O2, Oz, T3, T4, T5, and T6 with the reference electrodes placed on bilateral earlobes. The band-pass filter was set at 0.5 to 60 Hz, and measurement was recorded at a sampling frequency of 1 kHz. For VS and SS data, we calculated the average values for 10 sets on the measured 10 s under each condition. For BP, we calculated the average values for 10 sets on the 10 s prior to pressing the button.
2.3Identification of the brain area with the microstate segmentation method
Prior to the analysis, we orally asked the participants, “What kind of sensation was felt in the elbow?” when vibratory stimulation was applied. We collected the EEG data of the participants who were confirmed to have had motor illusions induced and Brain neural activity data in the TII were computed by subtracting the SS and BP from the VS to specify brain neural activity until the kinesthetic illusion was induced. After the data were computed, we performed temporo-spatial analysis on the brain neural activity leading to the induction of a motor illusion by performing microstate segmentation method-based sLORETA analysis, which captures the microstates reflecting the different stages of brain neural activity that takes place during information processing in the brain. We first computed the microstates by performing microstate segmentation method with a basic algorithm based on k-means clustering. The MI, SMA, premotor area (PMA), SI, and somatosensory association cortex have been implicated in motor illusion appearance in previous studies (Casini et al., Naito et al., 2016); motor illusions may be induced by these areas becoming synchronously and coordinately active. We set the maximum number of microstates in this analysis at five based on the assumption that a motor illusion is induced when these brain areas become independently active. We, then, identified and computed the brain neural activity areas and neural activity levels in each of the computed microstates using sLORETA as current source density (CSD) (μA/mm2). sLORETA computes the standard brain, which is standardized by the Talairach Daemon software (Talairach & Tournoux, 1988; Lancaster et al., 1997) (http://www.talairach.org/) as coordinates in the directions of x, y, and z in the brain areas divided into 6239 voxels, and converts it into a three-dimensional image by performing curvilinear anatomical adjustments using nonlinear conversion. As a result, the brain neural activity areas for each task condition are computed as neural activity levels on each voxel and are identified as Brodmann areas (BA) and Montreal Neurological Institute (MNI) coordinates (Collins et al., 1995).
2.4Evaluation of the ability to generate motor imagery
In order to examine the association between brain neural activity leading to the induction of a motor illusion and the ability to generate motor imagery, we evaluated the ability to generate motor imagery prior to the tasks using the Japanese version of the Movement Imagery Questionnaire-Revised (JMIQ-R) (Hall & Martin, 1997), which consists of a visual and a kinesthetic imagery scale. The visual and kinesthetic imagery scales of the JMIQ-R each comprise four items, a total of eight items (e.g., “Stand with your legs aligned and keep your arms down”). The result is calculated as the sum of scores for each item ranging from 8 to 56 points. The duration of the evaluation is short to avoid mental fatigue (Hall & Martin, 1997).
2.5Statistical analysis
The associations among the neural activity peak value of the active neural areas in the brain identified by microstate segmentation method, the duration between the starting and ending point defined as the duration required for a motor illusion to be induced (TII), and the JMIQ-R were examined. Statistical processing was performed using Spearman’s rank correlation analysis. The significance level was set at 5%.
3Results
3.1TII
All participants (average age: 21.3±1.8 years old) responded: “a sensation of the elbow stretching (extending),” “a sensation of movement in which the elbow is being stretched, unlike when sensory stimulation was applied,” etc., thereby confirming the induction of a motor illusion. The average TII was 2.78±0.59 s (Table 1).
Table 1
TII, CSD, and JMIQ-R results
| TII | CSD | JMIQ-R | |||||
| s | (μA/mm2)*10 - 3 | ||||||
| BA6 | BA4 | BA45 | BA39 | Kinesthetic Imagery | Visual Imagery | total | |
| 2.8±0.6 | 3.3±0.4 | 2.9±0.7 | 3.2±0.4 | 3.2±0.5 | 21.0±2.7 | 22.2±2.4 | 43.2±5.1 |
TII: the time to illusion induction, CSD: current source density, JMIQ-R: Japanese version of the Movement Imagery Questionnaire-Revised, BA6: bilateral supplementary motor areas, BA4: primary motor cortex, BA45: ventrolateral prefrontal cortex (VLPFC), BA39: inferior parietal lobule (IPL).
3.2Areas of neural activity and CSD in each microstate
Areas that showed predominantly high neural activity in each microstate (Fig. 2) were the bilateral SMAs (BA6) in microstates 1 and 4, with the highest level of 3.3±0.4 exhibited by the left SMA in microstate 1; the MI (BA4) of the primary sensorimotor area in microstate 2, with the highest level of 2.9±0.7 exhibited by the left BA4; the bilateral somatosensory association cortices in microstate 3, with the left inferior parietal lobule (IPL) (BA39) showing the highest level of 3.2±0.5; and the right ventrolateral prefrontal cortex (VLPFC) (BA 45) showed the highest level of 3.2±0.4 in microstate 5 (Table 1). Table 2 shows the MNI coordinates of the areas that exhibited predominantly high neural activity.
Fig.2
Montreal Neurological Institute coordinates of neural activity areas at the time of motor illusion induction obtained by the microstate segmentation method. Areas with the highest neural activity are indicated in yellow. BA6 showed predominantly high neural activity in Microstates 1 and 4, BA4 in Microstate 2, BA39 in Microstate 3, and BA45 in Microstate 5. BA6: bilateral supplementary motor areas, BA4: primary motor cortex, BA45: ventrolateral prefrontal cortex (VLPFC), BA39: inferior parietal lobule (IPL).
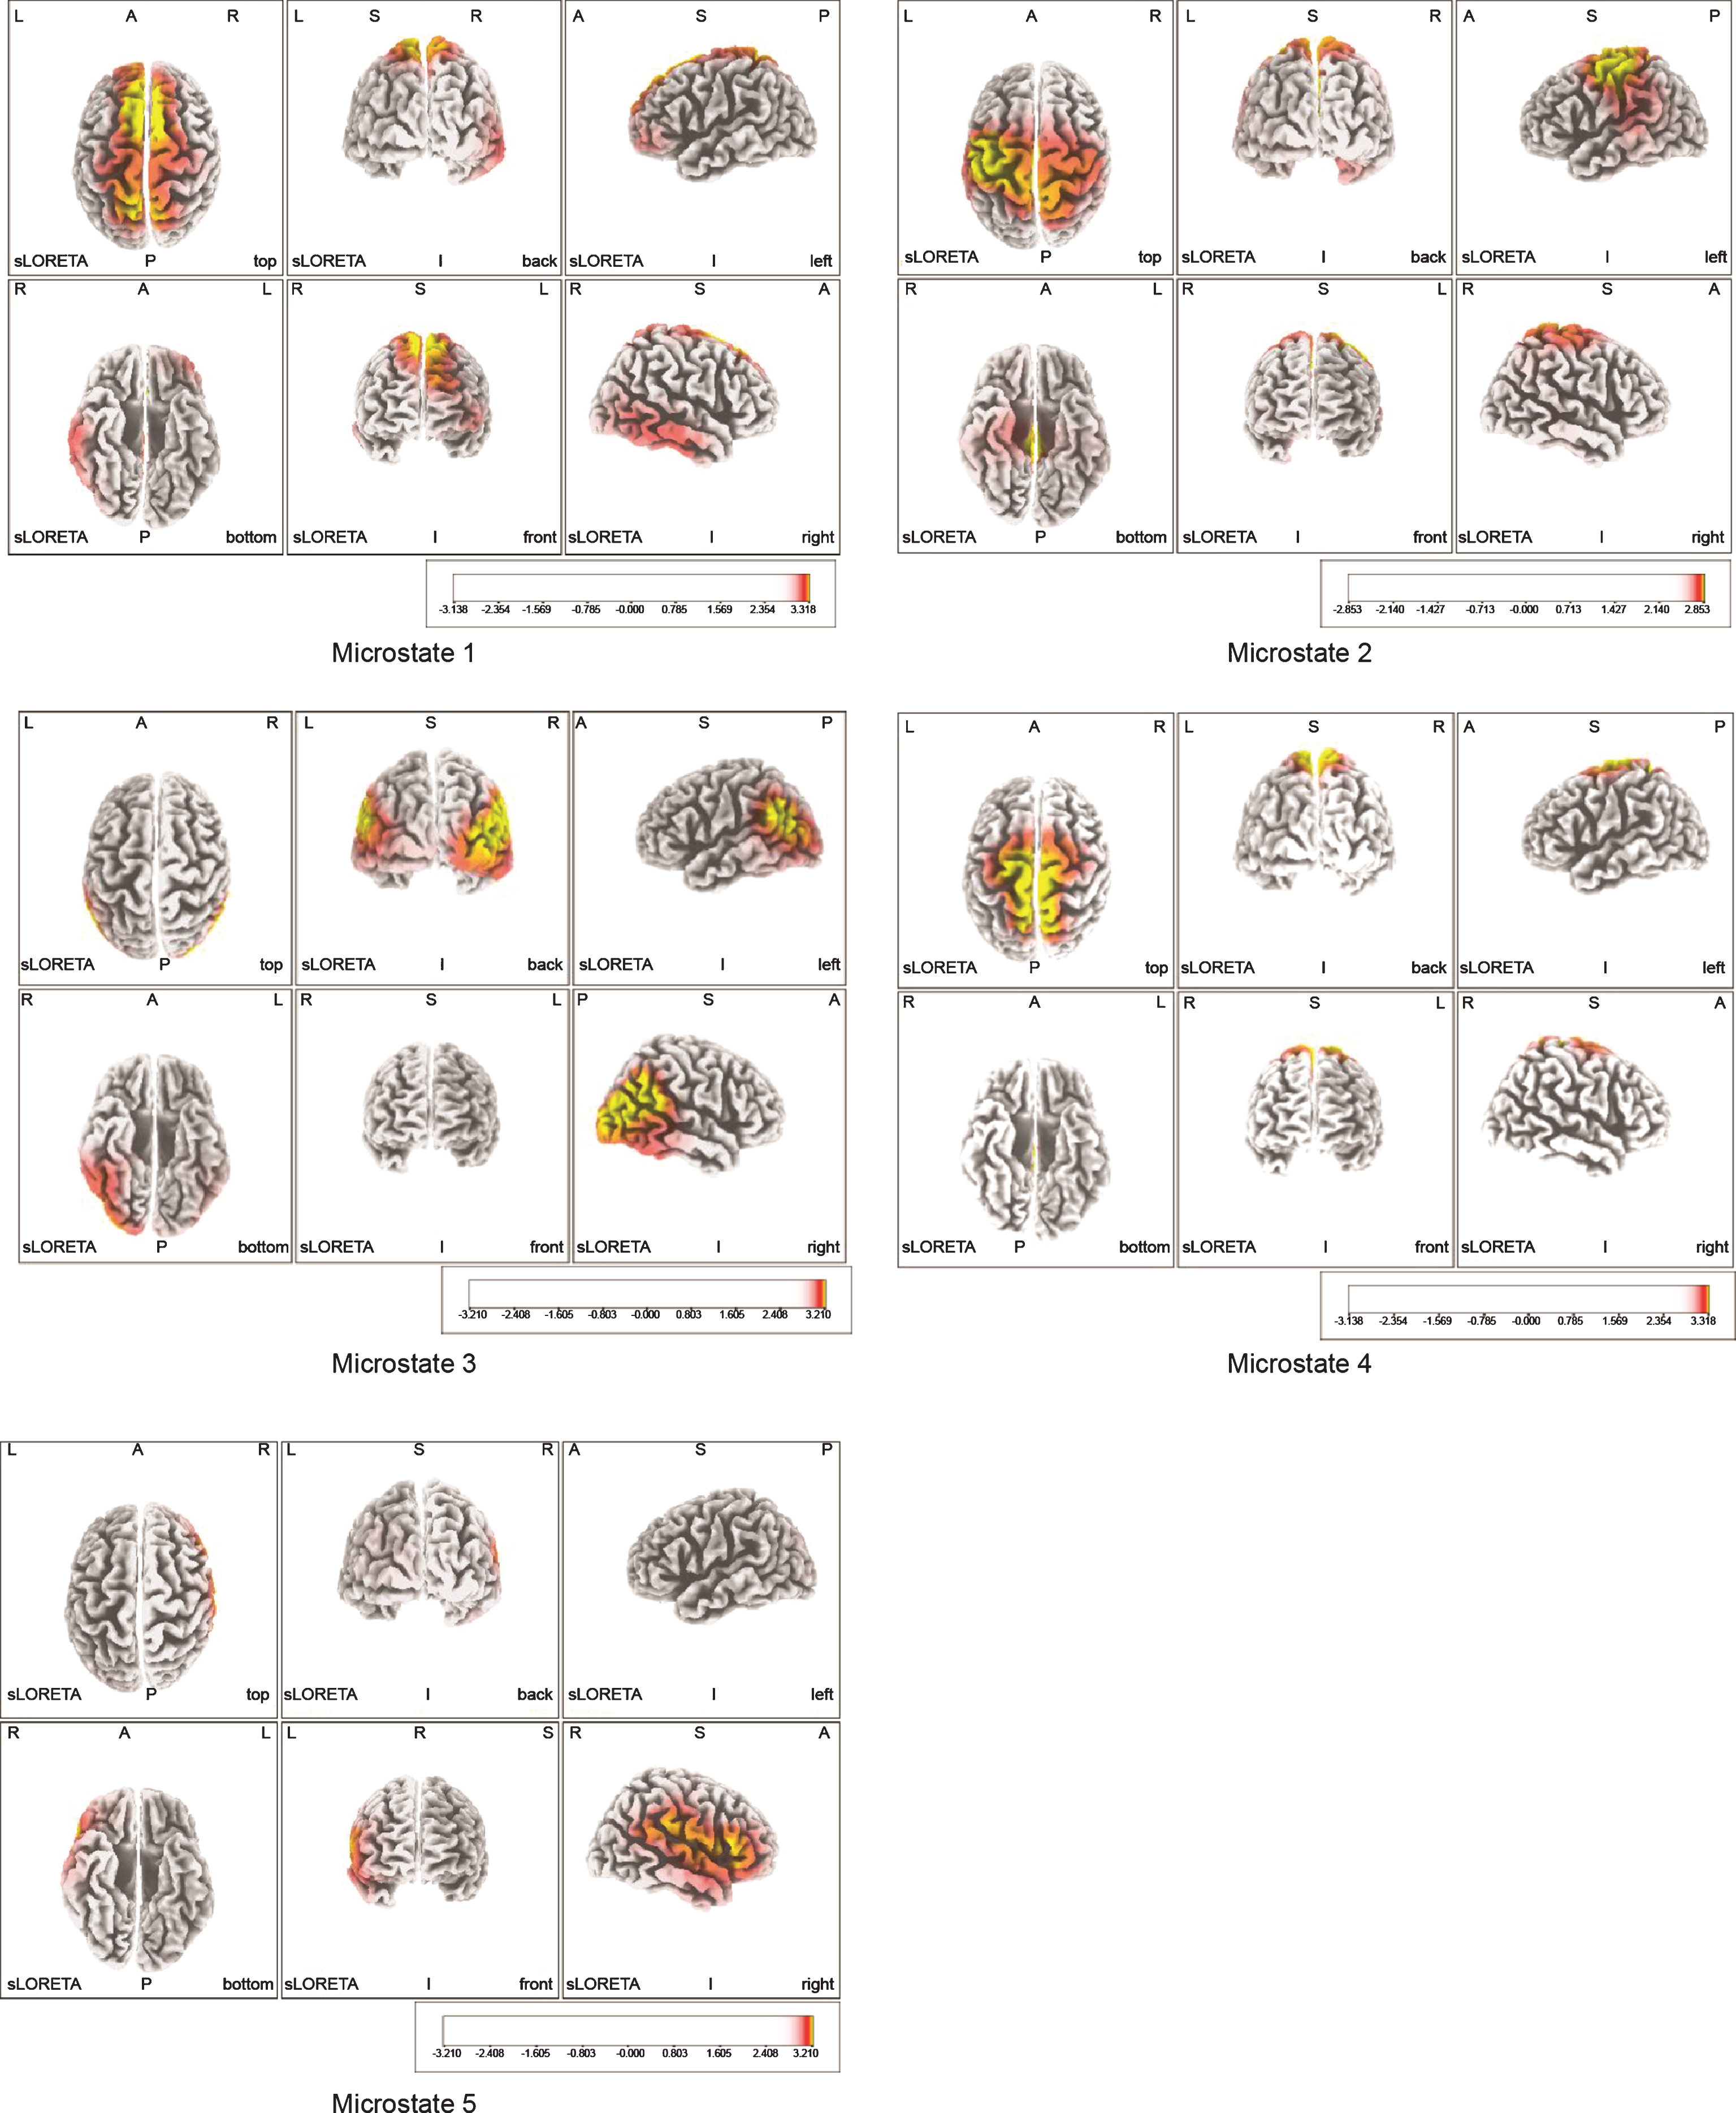
Table 2
MNI coordinates of neural activity areas at the time of motor illusion induction obtained by the microstate segmentation method
| Microstate | Lobe | Region | Gyrus | BA | MNI coordinate | ||
| x | y | z | |||||
| 1 | Left | Frontal | Superior Frontal | 6 | –5 | 30 | 60 |
| 2 | Right | Temporal | Superior Temporal | 39 | 55 | –60 | 25 |
| 3 | Left | Frontal | Precentral | 4 | –40 | –15 | 55 |
| 4 | Left | Frontal | Middle Frontal | 6 | –5 | –30 | 70 |
| 5 | Right | Frontal | Inferior Frontal | 45 | 60 | 20 | 10 |
BA: Brodmann area, MNI: Montreal Neurological Institute.
3.3JMIQ-R
The average total score of JMIQ-R was 43.2±5.1 (Table 1). JMIQ-R scoring was shown to follow a normal distribution with the Shapiro-Wilk Test (p = 0.345). The maximum value was 52 points and the minimum was 37.
3.4The associations amongst TII, neural activity level, and JMIQ-R
There was a significantly positive correlation between JMIQ-R scores and the neural activity levels of the SMA. On the other hand, there was no significant correlation between TII and JMIQ-R scores. Moreover, there were significant negative correlations between TII and SMA, and VLPFC, MI, and IPL. There were also significant positive correlations among the neural activity levels of each area (Table 3).
Table 3
Pearson’s product moment correlation coefficient
| TII | BA6 | BA4 | BA45 | BA39 | |
| JMIQ total score | –0.41 | 0.59 * | 0.54 | 0.56 | 0.52 |
| TII | –0.66 * | –0.60 * | –0.77 * | –0.78 * | |
| BA6 | 0.68 * | 0.62 * | 0.59 * | ||
| BA4 | 0.82 * | 0.86 * | |||
| BA10 | 0.88 * |
TII: the time to illusion induction, JMIQ-R: Japanese version of the Movement Imagery Questionnaire-Revised, BA6: bilateral supplementary motor areas, BA4: primary motor cortex, BA45: ventrolateral prefrontal cortex (VLPFC), BA39: inferior parietal lobule (IPL), *denotes a p-value < 0.05.
4Discussion
In this study, we examined the association between brain neural activity leading to the induction of a motor illusion caused by vibratory stimulation and the ability to generate motor imagery.
With regard to the brain areas identified by microstate segmentation method, predominant neural activity was observed in the MI. Previous studies have reported that SI, SMA, IPL, secondary sensory cortex (SII), PMA, and others, contralateral to the limb used, showed neural activity when identifying the direction of physical movement based on passive sensorimotor information (Nakashita et al., 2008). Among them, the MI, which showed particularly high neural activity, is an important brain area involved in somatosensory perception, especially in processing kinesthetic information from the muscle spindles, and motion perception (Naito, 2004). It is believed that the network of sensorimotor areas, including the SI that showed neural activity, is important in processing sensorimotor information from the muscle spindles (Naito et al., 2007). It, therefore, suggests the possibility that motor illusions are induced by sensorimotor information caused by vibratory stimulation being distributed to and processed in the sensorimotor areas. Furthermore, these areas are the same with those that become active during upper limb motion such as tapping (Solodkin et al., 2004). This indicates that the areas that become active when a motor illusion is induced share the same basis with areas of brain activity that become active during executing movement.
With respect to the neural activity in the SMA, it has been reported that both simple sensory processing and cognitive processes, such as the comparison with past perception experiences (kinesthetic simulation), judgement, and preparatory process, are involved when a motor illusion is induced; therefore, both the activity of the parietal lobe and the frontal lobe are indispensable (Harada et al., 2004). We believe this is the reason activity was noted in this area when a motor illusion was induced. Furthermore, it has been found that the SMAs show a remarkably strong functional link between the bilateral hemispheres (Grefkes et al., 2008), and there have also been reports on their functional link with the motor area (Grefkes et al., 2008; Mintzopoulos et al., 2009); this may explain their bilateral activity. Although BA6, which includes the supplementary motor cortex, is an area that primarily shows high levels of neural activity when actual movements are performed, it also shows activity when one imagines performing a movement without actually performing it (Naito et al., 2005). Furthermore, because BA6 is said to be involved in the identification (Chung et al., 2005; van de Winckel et al., 2005) and integration (Picard & Strick, 2003; Wiesendanger & Wiesendanger, 1985) of sensorimotor information required for a motor illusion; we believe predominantly high neural activity was observed in this area when a motor illusion was induced by vibratory stimulation.
With regard to the predominant neural activity in the IPL, it has been reported activation in this area causes a strong desire to move the contralateral hand, arm, and foot (Desmurget et al., 2009), and also that this area becomes predominantly active especially when executing first-person imagery, such as a muscle sensorimotor imagery. When inducing a motor illusion, it is important to predict the sensation and simulate in advance prior to imagining the physical movement. Both the SMA and IPL, in which neural activity was observed in this study, are said to be central areas involved in this simulation function (Gerardin et al., 2000; Naito et al., 2002). The IPL, in particular, is an important area for eliciting motor imagery of the hands (Moll et al., 2000), and exchange of neural information preceded by IPL, which is involved in predicting the sensation of a movement result, is performed in every area of the brain, such as the SMA (Desmurget et al., 2009). Furthermore, the IPL is said to play the role of processing modification information for the entire brain, in a sense, by temporally and spatially readjusting sensorimotor and efferent copy information for the body parts (Moll et al., 2000), and being involved in inducing a motor illusion when it is continuously active (Desmurget et al., 2009). We, therefore, believe neural activity in this area caused the manifestation of a motor illusion. Additionally, with regard to the fact that we observed bilateral neural activity despite only the right side being stimulated, it has been reported that there is increased bilateral neural activity when vibratory stimulation is applied (Naito et al., 2005), and Berti et al. (2005) and Committeri et al. (2007) stated that it is highly probable that neural activity in the frontal and parietal areas of the right hemisphere may play an important role in mentally reproducing one’s physical image, as the importance of the right hemisphere in physical image perception has been suggested on many occasions. We, therefore, believe that sensorimotor information of the vibratory stimulation caused activity via the bilateral functional link, although vibratory stimulation was only applied to the right upper limb.
Recent studies on motor illusions have shown that areas such as the right IPL and VLPFC that become active when a motor illusion is induced are linked by the superior longitudinal fasciculus III (SLF III), which connects the parietal and frontal areas (Naito, Morita, & Amemiya, 2016). The SLF III includes an area that constitutes the mirror neuron system and has the function of processing various sensory information to generate potential motor commands based on visual and somatosensory information (Amemiya & Naito, 2016). These findings and the activity observed in the IPL suggest that the reason we observed neural activity in BA45 during motor illusion induction may be explained by the self-physical motor imagery expressed based on the sensory information of vibratory stimulation received by the proprioceptive receptors and perceived through the SLF III.
Regarding the fact that there was a significant positive correlation between the total scores of the JMIQ and the neural activity of BA6, the motor imagery represented by the JMIQ is said to be the result of consciously approaching the intention of performing movement or its content (Jeannerod, 1995). In other words, it can be said that the JMIQ evaluates the ability to simulate concrete movement plans towards the execution of the movement. The SMA is deeply involved both in the actual execution of movement and in spatial perception processing of sensorimotor information when one is experiencing a motor illusion (Boussaoud, 2001). It is, therefore, believed to also play an important role in the creation and storage of kinesthetic programs at the motion preparation stage. This suggests that the SMA is an area responsible for the ability to generate motor imagery when a motor illusion is induced and that there is an association between the activity of this area and the ability to generate imagery.
With regard to the significantly negative correlation of TII with the MI, SMA, and IPL, and the significantly positive correlation among the neural activity levels of each area, it is suggested that the processing of a motor illusion is shortened when these multiple brain areas become coordinately active. Assuming that there is an association between TII and the neural activity of the brain areas whose function is the exchange of neural information at the time of motor illusion induction, we believe TII may act as an indicator for the strength of the functional link of the neural network involved in the induction of motor illusions. Moreover, the fact that there was no significant correlation between TII and the total scores of the JMIQ suggests that internal kinesthetic simulation in motor imagery acts as a basis during the process of motor illusion induction, while both BA6 and the activity of a neuronal network that includes the motor area and inferior parietal lobule may be important for the manifestation of a motor illusion.
In this study, we demonstrated that neural activity of the brain areas responsible for sensation and movement is increased when a motor illusion is induced by vibratory stimulation and that there is an association between one of those areas, the SMA, and the ability to generate motor imagery. This suggests that a more vivid physical movement schema or sense of agency may be established in the brain by providing motor imagery intentionally and synchronously during the motor illusion induction process. This may aid in creating a new approach to neurorehabilitation that would enable a more robust reorganization of the neural base for patients with brain dysfunction with a motor function disorder.
However, the basic algorithm of the microstate segmentation method used in our analysis is based on cluster analysis with the k-means method. Thus, as a limitation to this study, there is a possibility that the patterns express the temporal aspect of the microstate switching. However, we did not discuss the temporal aspect since we did not perform pertinent analyses, such as effective connectivity analysis, to identify causality. Moreover, this study was conducted with healthy participants. Additionally, involvement of the cerebellum in data collection during sensorimotor information processing and during the information discrimination process has been reported (Dupont, Sáry, Peuskens, & Orban, 2003). We were, therefore, unable to verify the general neural network involved in neural information processing or the association between the ability to generate motor imagery and motor illusions in patients with brain dysfunction. In the future study, we believe it is important to verify the functional difference between a healthy person and a patient with brain dysfunction by examining in detail the neural network(s) of sensorimotor information in wider brain areas in patients with brain dysfunction based on the functional connectivity among activated areas to validate our proposed approach.
Acknowledgments
This study is part of a project operating under JSPS grant 16H05602. We would like to thank Editage (www.editage.com) for English language editing and Publication Support.
References
1 | Amemiya K., & Naito E. ((2016) ). Importance of human right inferior frontoparietal network connected by inferior branch of superior longitudinal fasciculus tract in corporeal awareness of kinesthetic illusory movement. Cortex, 78: , 15–30. |
2 | Berti A., Bottini G., Gandola M., Pia L., Smania N., Stracciari A., & … Paulesu E. ((2005) ). Shared cortical anatomy for motor awareness and motor control. Science, 309: , 488–491. |
3 | Boussaoud D. ((2001) ). Attention versus intention in the primate premotor cortex. Neuroimage, 14: , S40–S45. |
4 | Bove M., Nardone A., & Schieppati M. ((2003) ). Effects of leg muscle tendon vibration on group Ia and group II reflex responses to stance perturbation in humans. The Journal of Physiology, 550: , 617–630. |
5 | Burke D., Hagbarth K.E., Löfstedt L., & Wallin B.G. ((1976) ). The responses of human muscle spindle endings to vibration during isometric contraction. The Journal of Physiology, 261: , 695–711. |
6 | Casini L., Romaiguère P., Ducorps A., Schwartz D., Anton J.L., & Roll J.P. ((2006) ). Cortical correlates of illusory hand movement perception in humans: A MEG study. Brain Research, 1121: , 200–206. |
7 | Chung G.H., Han Y.M., Jeong S.H., & Jack C.R. ((2005) ). Functional heterogeneity of the supplementary motor area. American Journal of Neuroradiology, 26: , 1819–1823. |
8 | Collins D.L., Holmes C.J., Peters T.M., & Evans A.C. ((1995) ). Automatic 3-D model-based neuroanatomical segmentation. Human Brain Mapping, 3: , 190–208. |
9 | Committeri G., Pitzalis S., Galati G., Patria F., Pelle G., Sabatini U., & Pizzamiglio L. ((2006) ). Neural bases of personal and extrapersonal neglect in humans. Brain, 130: , 431–441. |
10 | Conrad M.O., Scheidt R.A., & Schmit B.D. ((2011) ). Effects of wrist tendon vibration on targeted upper-arm movements in poststroke hemiparesis. Neurorehabilitation and Neural Repair, 25: , 61–70. |
11 | Cordo P.J., Gurfinkel V.S., Brumagne S., & Flores-Vieira C. ((2005) ). Effect of slow, small movement on the vibration-evoked kinesthetic illusion. Experimental Brain Research, 167: , 324–334. |
12 | Daprati E., Sirigu A., & Nico D. ((2010) ). Body and movement: Consciousness in the parietal lobes. Neuropsychologia, 48: , 756–762. |
13 | Desmurget M., Reilly K.T., Richard N., Szathmari A., Mottolese C., & Sirigu A. ((2009) ). Movement intention after parietal cortex stimulation in humans. Science, 324: , 811–813. |
14 | Dickstein R., & Deutsch J.E. ((2007) ). Motor imagery in physical therapist practice. Physical Therapy, 87: , 942–953. |
15 | Dupont P., Sáry G., Peuskens H., & Orban G.A. ((2003) ). Cerebral regions processing first-and higher-order motion in anopposed-direction discrimination task. European Journal of Neuroscience, 17: , 1509–1517. |
16 | Ehrsson H.H., Naito E., Geyer S., Amunts K., Zilles K., Forssberg H., & Roland P.E. ((2000) ). Simultaneous movements of upper and lower limbs are coordinated by motor representations that are shared by both limbs: A PET study. European Journal of Neuroscience, 12: , 3385–3398. |
17 | Gerardin E., Sirigu A., Lehéricy S., Poline J.B., Gaymard B., Marsault C., & Le Bihan D. ((2000) ). Partially overlappingneural networks for real and imagined hand movements. Cerebral Cortex, 10: , 1093–1104. |
18 | Ghez C., & Sainburg R. ((1995) ). Proprioceptive control of interjoint coordination. Canadian Journal of Physiology and Pharmacology, 73: , 273–284. |
19 | Goodwin G.M., Mccloskey D.I., & Matthews P.B.C. ((1972) ). The contribution of muscle afferents to keslesthesia shown by vibration induced illusions of movement and by the effects of paralysing joint afferents. Brain, 95: , 705–748. |
20 | Grefkes C., Nowak D.A., Eickhoff S.B., Dafotakis M., Küst J., Karbe H., & Fink G.R. ((2008) ). Cortical connectivity after subcortical stroke assessed with functional magnetic resonance imaging. Annals of Neurology, 63: , 236–246. |
21 | Hagura N., Takei T., Hirose S., Aramaki Y., Matsumura M., Sadato N., & Naito E. ((2007) ). Activity in the posterior parietal cortex mediates visual dominance over kinesthesia. Journal of Neuroscience, 27: , 7047–7053. |
22 | Hall C.R., & Martin K.A. ((1997) ). Measuring movement imagery abilities: A revision of the Movement Imagery Questionnaire. Journal of Mental Imagery, 21: , 143–154. |
23 | Hanakawa T. ((2016) ). Organizing motor imageries. Neuroscience Research, 104: , 56–63. |
24 | Harada T., Saito D.N., Kashikura K.I., Sato T., Yonekura Y., Honda M., & Sadato N. ((2004) ). Asymmetrical neural substrates of tactile discrimination in humans: A functional magnetic resonance imaging study. Journal of Neuroscience, 24: , 7524–7530. |
25 | Huh D.C., Lee J.M., Oh S.M., Lee J.H., Van Donkelaar P., & Lee D.H. ((2016) ). Repetitive transcranial magnetic stimulation of the primary somatosensory cortex modulates perception of the tendon vibration illusion. Perceptual and Motor Skills, 123: , 424–444. |
26 | Jeannerod M. ((1995) ). Mental imagery in the motor context. Neuropsychologia, 33: , 1419–1432. |
27 | Kodama T., & Nakano H. ((2017) ) Neuroscience-Based Rehabilitation for Stroke Patients. In Suzuki T. (ed.). Neurological Physical Therapy (pp. 137–156). InTech. doi: 10.5772/67440 |
28 | Lancaster J.L., Rainey L.H., Summerlin J.L., Freitas C.S., Fox P.T., Evans A.C., & Mazziotta J.C. ((1997) ). Automated labeling of the human brain: A preliminary report on the development and evaluation of a forward-transform method. Human Brain Mapping, 5: , 238. |
29 | Lehmann D., Wackermann J., Michel C.M., & Koenig T. ((1993) ). Space-oriented EEG segmentation reveals changes in brain electric field maps under the influence of a nootropic drug. Psychiatry Research: Neuroimaging, 50: , 275–282. |
30 | Liepert J., & Binder C. ((2010) ). Vibration-induced effects in stroke patients with spastic hemiparesis–a pilot study. Restorative Neurology and Neuroscience, 28: , 729–735. |
31 | Mintzopoulos D., Astrakas L.G., Khanicheh A., Konstas A.A., Singhal A., Moskowitz M.A., & Tzika A.A. ((2009) ). Connectivity alterations assessed by combining fMRI and MR-compatible hand robots in chronic stroke. Neuroimage, 47: , T90–T97. |
32 | Moll J., de Oliveira-Souza R., Passman L.J., Cunha F.C., Souza-Lima F., & Andreiuolo P.A. ((2000) ). Functional MRI correlates of real and imagined tool-use pantomimes. Neurology, 54: , 1331–1336. |
33 | Naito E. ((2004) ). Sensing limb movements in the motor cortex: How humans sense limb movement. The Neuroscientist, 10: , 73–82. |
34 | Naito E., Ehrsson H.H., Geyer S., Zilles K., & Roland P.E. ((1999) ). Illusory arm movements activate cortical motor areas: A positron emission tomography study. Journal of Neuroscience, 19: , 6134–6144. |
35 | Naito E., Kochiyama T., Kitada R., Nakamura S., Matsumura M., Yonekura Y., & Sadato N. ((2002) ). Internally simulated movement sensations during motor imagery activate cortical motor areas and the cerebellum. Journal of Neuroscience, 22: , 3683–3691. |
36 | Naito E., Roland P.E., Grefkes C., Choi H.J., Eickhoff S., Geyer S., & Ehrsson H.H. ((2005) ). Dominance of the right hemisphere and role of area 2 in human kinesthesia. Journal of Neurophysiology, 93: , 1020–1034. |
37 | Naito E., Nakashima T., Kito T., Aramaki Y., Okada T., & Sadato N. ((2007) ). Human limb-specific and non-limb-specific brain representations during kinesthetic illusory movements of the upper and lower extremities. European Journal of Neuroscience, 25: , 3476–3487. |
38 | Naito E., Morita T., & Amemiya K. ((2016) ). Body representations in the human brain revealed by kinesthetic illusions and their essential contributions to motor control and corporeal awareness. Neuroscience Research, 104: , 16–30. |
39 | Nakashita S., Saito D.N., Kochiyama T., Honda M., Tanabe H.C., & Sadato N. ((2008) ). Tactile–visual integration in the posterior parietal cortex: A functional magnetic resonance imaging study. Brain Research Bulletin, 75: , 513–525. |
40 | Oldfield R.C. ((1971) ). The assessment and analysis of handedness: The Edinburgh inventory. Neuropsychologia, 9: , 97–113. |
41 | Pascual-Marqui R.D. ((2002) ). Standardized low-resolution brain electromagnetic tomography (sLORETA): Technical details. Methods & Findings in Experimental & Clinical Pharmacology, 24: (Suppl D), 5–12. |
42 | Pascual-Marqui R.D., Michel C.M., & Lehmann D. ((1994) ). Low resolution electromagnetic tomography: A new method for localizing electrical activity in the brain. International Journal of Psychophysiology, 18: , 49–65. |
43 | Picard N., & Strick P.L. ((2003) ). Activation of the supplementary motor area (SMA) during performance of visually guided movements. Cerebral Cortex, 13: , 977–986. |
44 | Rabadi M.H. ((2011) ). Review of the randomized clinical stroke rehabilitation trials in 2009. Medical Science Monitor: International Medical Journal of Experimental and Clinical Research, 17: , RA25. |
45 | Roll J.P., & Vedel J.P. ((1982) ). Kinaesthetic role of muscle afferents in man, studied by tendon vibration and microneurography. Experimental Brain Research, 47: , 177–190. |
46 | Roll J.P., Vedel J.P., & Ribot E. ((1989) ). Alteration of proprioceptive messages induced by tendon vibration in man: A microneurographic study. Experimental Brain Research, 76: , 213–222. |
47 | Solodkin A., Hlustik P., Chen E.E., & Small S.L. ((2004) ). Fine modulation in network activation during motor execution and motor imagery. Cerebral Cortex, 14: , 1246–1255. |
48 | Talairach J., & Tournoux P. ((1988) ) Co-planar stereotaxic atlasof the human brain. 3-Dimensional proportional system: An approach to cerebral imaging. Stuttgart: Thieme. |
49 | Van de Winckel A., Sunaert S., Wenderoth N., Peeters R., Van Hecke P., Feys H., & De Weerdt W. ((2005) ). Passive somatosensory discrimination tasks in healthy volunteers: Differential networks involved in familiar versus unfamiliar shape and length discrimination. Neuroimage, 26: , 441–453. |
50 | Wiesendanger R., & Wiesendanger M. ((1985) ). The thalamic connections with medial area 6 (supplementary motor cortex) in the monkey (Macaca fascicularis). Experimental Brain Research, 59: , 91–104. |


